 | 27 Jul 2022
Statistical approach to assess radon-222 long-range atmospheric transport modelling and its associated gamma dose rate peaks
Khadija Meddouni
Denis Quélo
Thierry Doursout
Sonia Chuzel
There is a need for a validation framework for long-range atmospheric transport modelling dedicated to radionuclides. For distances greater than 50 km, the modelling of radionuclide deposition and ambient gamma dose rate evaluation are particularly difficult to validate, since it has been mainly only observed after the accidents of Chernobyl and Fukushima. There is however a natural wet deposition phenomenon leading to numerous well-observed gamma dose rate events: the scavenging of radon-222 progeny by rain. Radon-222 exhalation from the soil to the atmosphere, its decay, its progeny, its own transport, the transport of its progeny, their deposition, and the consequent ambient gamma dose rate are then modelled at the European scale. This whole atmospheric radon model from soil (exhalation) to soil (deposition) needs to be validated by comparison with observations.
The biggest benefit of this case study is the number of events that serve as a comparison. For a statistical evaluation of the performance of the model, we compared its results with gamma dose rate observations over a period of two years, gathering more than 15 000 peaks greater than 10 nSv h−1 above the background radiation. Two sets of metrics were used to assess the agreement between the model and observations: on a case by case basis (peak to peak) and continuously (whole time series of gamma dose rates and air concentrations). Particular attention was paid to defining the metrics in order to remove the background radiation level and to exclude outlier stations.
We found that 48 % of the gamma dose rate peaks are well modelled, a fraction of which can rise up to 89 % by being more tolerant with the success criteria. The model has proven to be of the correct magnitude, with room for substantial improvement. Overall, the modelling shows better recall than precision: i.e. a tendency to produce more false positives than false negatives. It is also less effective in reproducing the highest peaks. Exhalation, vertical mixing and deposition have been identified as the three main features which could improve this model.
Now validated, with all its limitations, the atmospheric radon model may serve for its primary purpose, the validation of atmospheric transport modelling and its input data. It also may serve as a framework to test any exhalation model on a national or continental scale. Moreover, it is useful to learn how to properly use the data of an ambient gamma dose rate network, and how to compare this data to modelled data. Finally, some interesting features concerning the assessment of outdoor concentrations of radon-222 became apparent.
- Article
(6316 KB) - Full-text XML
- BibTeX
- EndNote


Atmospheric transport modelling (ATM) dedicated to radionuclides is challenging to validate with regard to the few events studied – apart from accidental releases such as Chernobyl or Fukushima. Here, we are particularly interested in the validation of the long-range (>50 km) ATM of IRSN, known as LdX (Groëll et al., 2014). This model has been used for more than a decade for the long-range atmospheric transport of radionuclides, e.g. to evaluate the consequences of the Fukushima Daiichi nuclear power plant accident (Mathieu et al., 2012; Sato et al., 2020; Quérel et al., 2021) or for Comprehensive Nuclear-Test-Ban Treaty Organization (CTBTO) challenges (Eslinger et al., 2016; Maurer et al., 2018). More details are given in Sect. 2.1. To validate LdX, we focused on radionuclides of natural origin, among which radon-222 and its progeny. These radionuclides indeed provide thousands of observed gamma dose rate peaks per year measured by Téléray, the IRSN national and early warning monitoring network (Téléray, 2022). A radon plume stays in the atmosphere for up to one week, travels across several hundreds of kilometres (Arnold et al., 2010; Barbosa et al., 2017), making the use of a long-range ATM such as LdX relevant. Long-range ATM validation has already been done with radon-222 air concentration (Jacob et al., 1997; Zahorowski et al., 2004; Karstens et al., 2020; Zhang et al., 2021), but not necessarily with gamma-dose rate evaluation or from a statistical point of view (Inomata et al., 2007).
The physics behind the observed gamma dose rate peaks due to radon and its progeny requires knowledge of geology and pedology for radon exhalation, nuclear physics for radioactive decay and progeny, and atmospheric physics – including transport, wet and dry depositions – for peak occurrence. Geology and pedology are characterised by fields that do not usually feed the ATM dedicated to radionuclides, whereas nuclear and atmospheric physics modelling are common between this radon-dedicated study and any other releases of radionuclides into the atmosphere. In other words, modelling gamma dose rate peaks due to radon progeny is a new way to validate the tools used to model the consequences of a nuclear release into the environment.
This study describes the current modelling of the gamma dose rate due to atmospheric radon and its progeny. The statistical performances of the modelling in reproducing the Téléray network measurements are described. Statistical strengths and weaknesses of the modelling are then shown. This allows for a comprehensive view of the ATM validity domain, thus identifying critical features which could be improved.
1.1 Radon-222 exhalation
Radon-222 is a noble gas naturally emitted by rocks containing uranium-238. The surface exhalation flux is mainly driven by the rock composition, but it is also influenced – to different degrees – by both rock and soil porosity, permeability, humidity and temperature, as well as water table depth, geological faults or atmospheric pressure (Griffiths et al., 2010; Manohar et al., 2013; Karstens et al., 2015).
Correct modelling of all these effects needs complete input data for all these parameters – in space and time, as well as a complete, independently validated model. For this study, the temporal fluctuation of the radon exhalation is simplified to a monthly variation. Section 4 will statistically show the necessity of at least taking this monthly variation into account. The exhalation map is based on the work of Karstens et al. (2015). Since this exhalation map does not include data after 2013, we consider the monthly exhalation as the mean of the corresponding month over a 7 year period from 2006 to 2012. Over France, an IRSN exhalation map is used instead (Ielsch et al., 2017). Note that the IRSN source term represents the maximum exhalation rate and so is corrected monthly by the Karstens et al. (2015) monthly variation covering the same territories. It is also important to note that radon-222 sea exhalation is neglected, considering it is several thousand times smaller than continental exhalation. The exhalation in August and January are illustrated in Fig. 1.
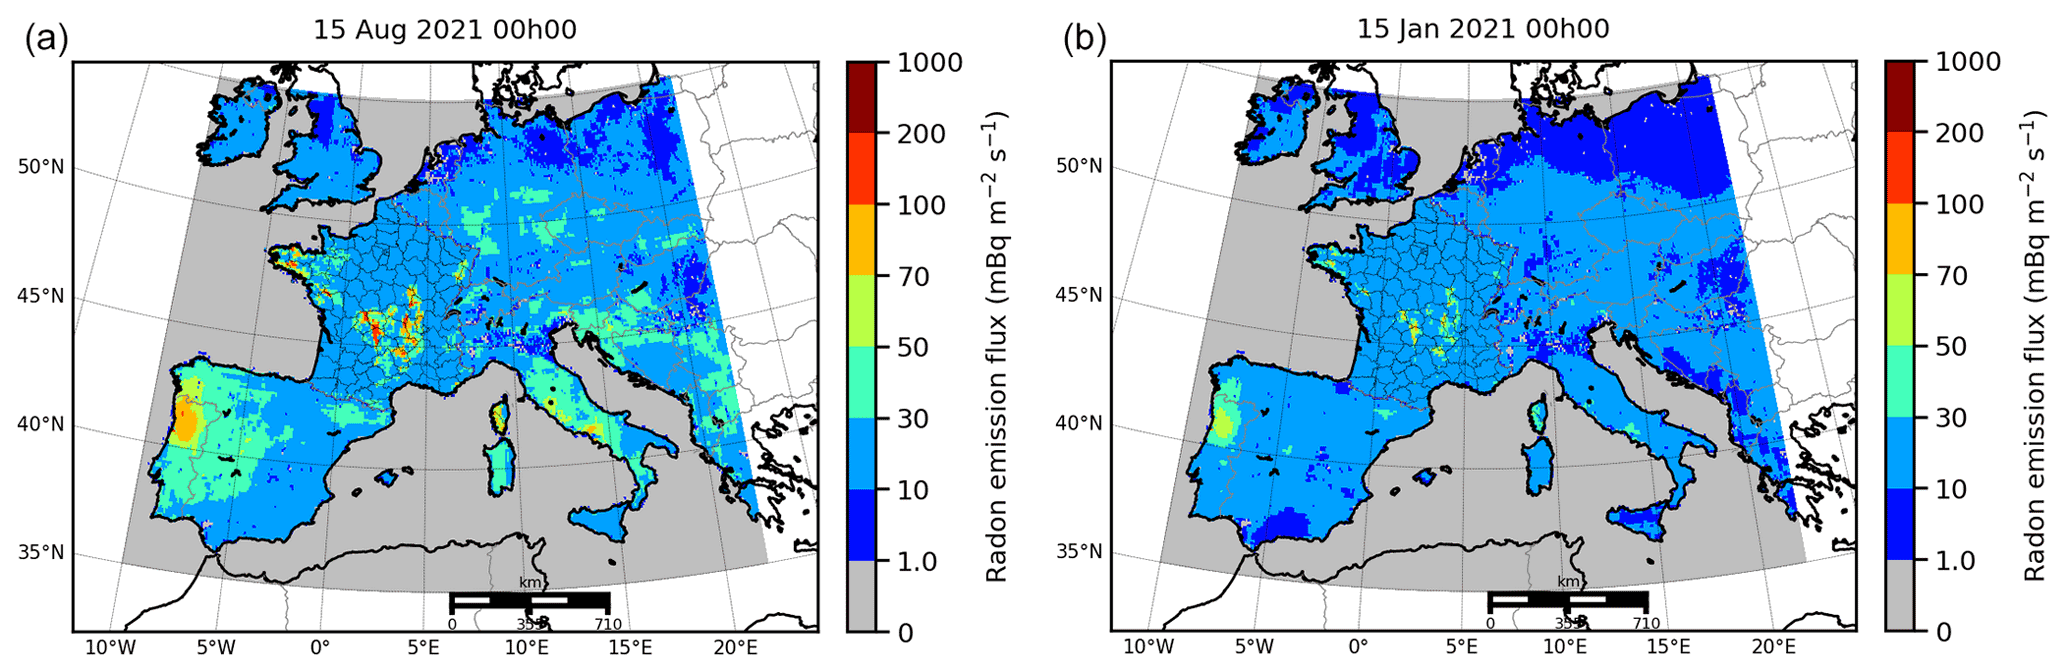
Figure 1Radon-222 exhalation maps. (a) Exhalation in August. (b) Exhalation in January.
1.2 Radon and its progeny in the atmosphere
Once emitted into the atmosphere, radon is quickly transported like any other gas or aerosol particle. As a noble gas, it is unreactive and poorly soluble. Radon is consequently not subject to dry and wet depositions (Fujinami, 1996; Mercier et al., 2009; Paatero et al., 2012; Bottardi et al., 2020). It is transported without depletion other than its radioactive decay. Its half-life of 3.8 d allows radon-222 to travel across several hundred kilometres within the atmosphere.
The successive radon-222 progeny have a half-life shorter than 30 min until lead-210, the half-life of which is 22 years. See Fig. 2 for the series of short-lived radon progeny. Unlike radon-222, the progeny are not noble gases, and quickly bind to aerosol particles. These radionuclides are all considered in the particulate form in this study. They are therefore subject to deposition processes, among which wet scavenging is the most efficient to lead to large deposits on the ground, up to several kBq m−2.
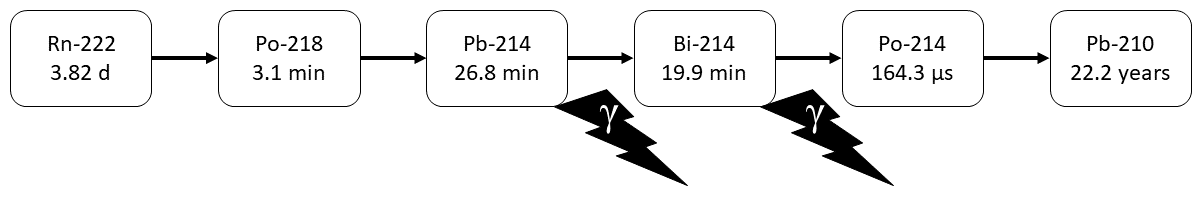
Figure 2Short-lived progeny of radon-222 and their half-lives. Lead-214 and bismuth-214 are significant gamma emitters at the time of their decay.
Among the short-lived progeny of radon, lead-214 and bismuth-214 are significant gamma emitters (Fig. 2), the radiation intensity of which could be measured in terms of ambient gamma dose rate. The deposition of these two progeny can raise the ambient gamma dose rate up to 100 nSv h−1 above the natural background radiation – generally in a range between 50 and 100 nSv h−1 in France. The increase generally lasts between five and 30 min, depending on the rain and the radon air concentration. Because of the short half-lives of lead-214 and bismuth-214, these deposited radionuclides disintegrate within several hours, leading to a gamma dose rate decrease. A rapid increase followed by a decrease together form a gamma dose rate peak. In total, a peak usually lasts 2 to 5 h.
To sum up, radon and its progeny are radionuclides transported over long distances in the atmosphere and the wet deposition of some of them is often measured, therefore suitable as a case study.
The objective was to validate the ATM dedicated to radionuclides and also to identify its possible improvements. To do so, the exhalation, the atmospheric transport and the deposition of radon-222 and its short-lived progeny were modelled, as well the ambient gamma dose rate they caused. The method described here is a way to model this phenomenon and a way to compare it to observations.
2.1 Model settings
All simulations were run with LdX, the operational long-range atmospheric transport model used by IRSN for nuclear emergencies, included in the IRSN's C3X operational platform (Tombette, 2014). This Eulerian model is derived from the Polair3D model (Mallet and Sportisse, 2004) of the Polyphemus platform (Mallet et al., 2007; Quélo et al., 2007), which is designed to study regional-scale air quality issues. Decay modes and products have been added afterwards.
LdX is an off-line model. Meteorological data of the numerical weather prediction (NWP) ARPEGE of Météo-France is used. This data is projected into the LdX domain of computation, which covers western and central Europe. The domain is displayed in Fig. 3. The ARPEGE horizontal resolution of 0.1∘ is kept, leading to a horizontal mesh of 321×201 cells. A vertical resolution of 14 levels is used, with the first level from 0 to 40 m a.g.l. (above ground level), and the 14th level between 6600 and 8800 m a.g.l. ARPEGE data is provided with an hourly frequency, and LdX uses an internal time step of 10 min in order to better capture temporal variations.

Figure 3The computation domain.
The precipitation data from the NWP is substituted by radar observations, in order to improve the space time resolution of the wet deposition processes. Radar data is also provided by Météo-France and have a raw spatial resolution of 1 km and a temporal resolution of 5 min. Radar data is projected onto the LdX domain resolutions of 0.1∘ and 10 min. Rainfall intensities are thresholded at 0.1 mm.h−1, considering that a smaller rainfall level is not relevant (Wang et al., 2016).
Vertical diffusion of Louis (1979) is used above the atmospheric boundary layer (ABL) and in the ABL for stable conditions. Troen and Mahrt (1986) is used for the ABL in unstable conditions.
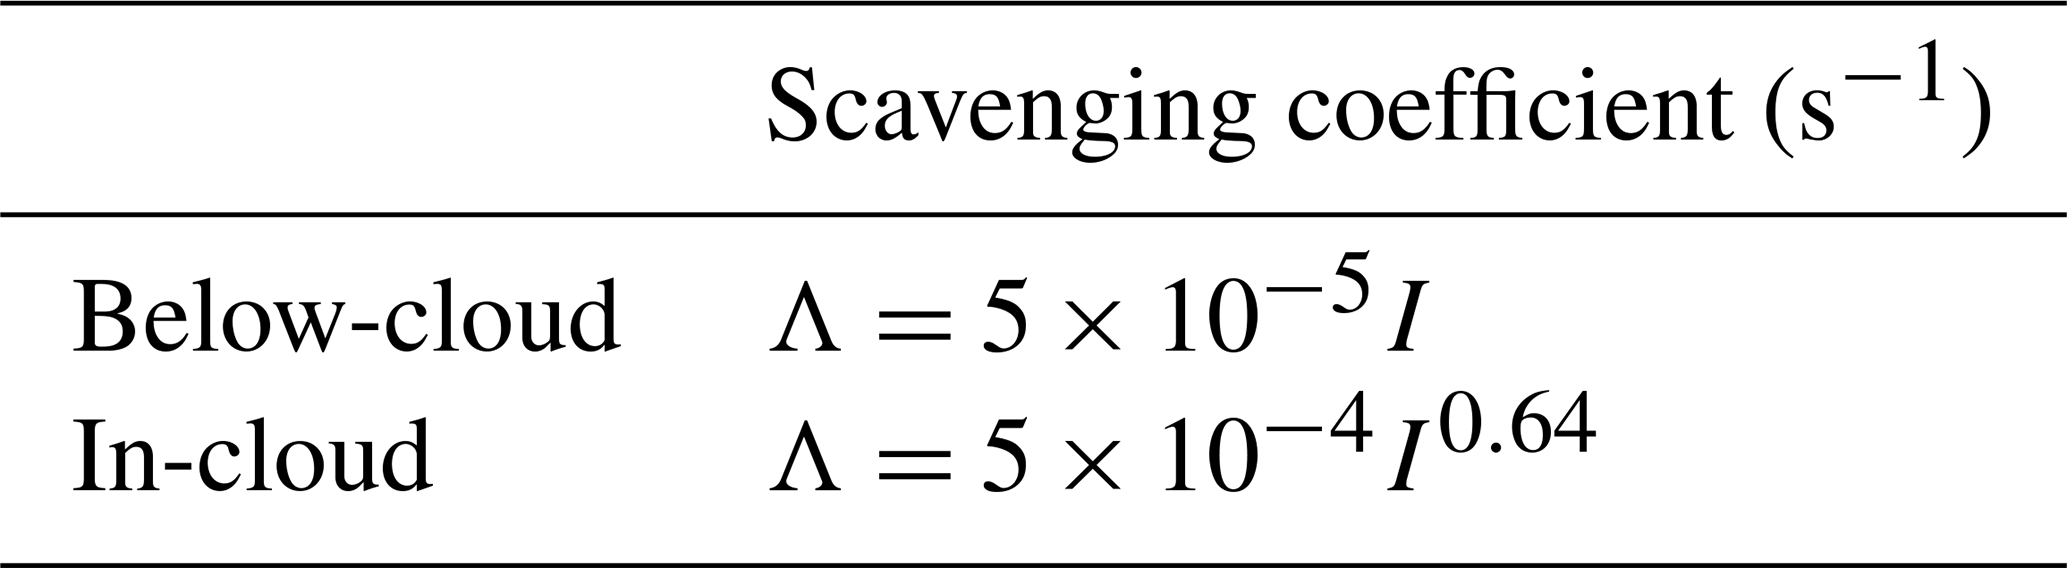
The dry deposition velocity is set at 2 mm s−1. The below-cloud scavenging and in-cloud scavenging used are described in Table 1, with Λ the scavenging coefficient (s−1) and I the rainfall intensity (mm). These coefficients are justified in Quérel et al. (2021).They are effective in a cloud, defined with the Cloud Fraction given by ARPEGE. A Cloud Fraction threshold value of 0.1 is arbitrary set to define the cloud presence. Cloud base height cannot be lower than 3000 m. In the event of absence of a cloud diagnosed above the rain, a by-default cloud at 500–5000 m is used.
ICRP-38 data is used for the half-lives and decay products (ICRP, 1983). The ambient gamma dose rate at ground level is computed as the sum of the radiations due to the concentration and the deposit, using the dose coefficients of the FGR 12 (Eckerman and Ryman, 1993).
Finally, a two year computation with these settings lasts about one month of computation time on a single processor. The modelled period runs from 1 January 2020 to 31 December 2021, inclusive.
2.2 Observations
The ambient gamma dose rates used for this study come from the Téléray monitoring network. In 2021, it consisted of 439 ambient gamma dose rate monitoring stations spread over France, recording data every 10 min all year round. 8346 and 8116 peaks higher than 10 nSv h−1 above background were measured in 2020 and 2021 in France. These large numbers allow a statistical approach to validate an ATM but, like any other observation data set, must be well understood for a relevant comparison with model results.
2.2.1 Téléray network observations
Created in 1991, the IRSN's Téléray network covers ambient radioactivity stations spread all over France (Téléray, 2022), with clusters around each nuclear facility (Fig. 4). The purpose of this network is to quickly detect any unusual rise in ambient radioactivity, in the event of a nuclear accident in France or abroad. Téléray stations, sensitive to gamma radiation, provide a measurement of the ambient gamma dose equivalent rate expressed in nSv h−1.
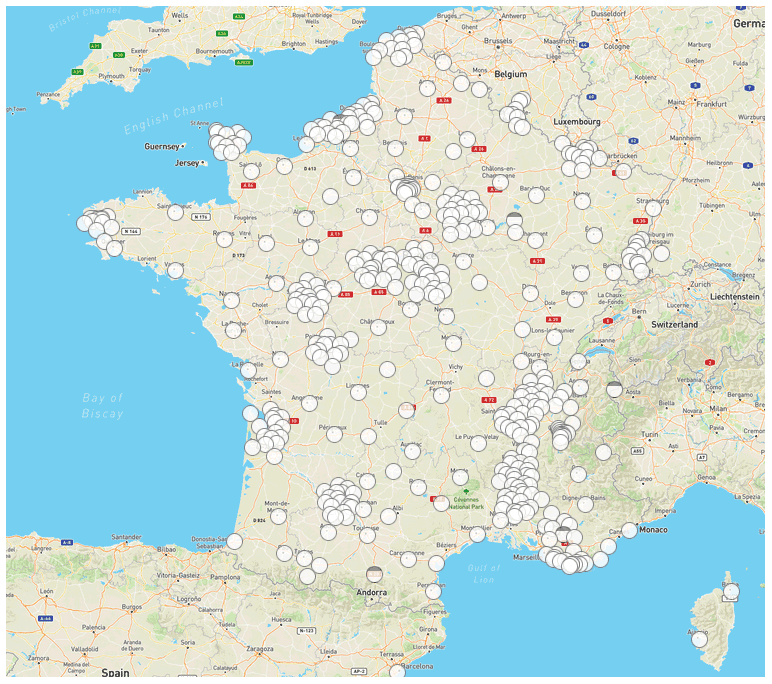
Figure 4Téléray ambient gamma dose rate network, © Open StreetMap contributors. Distributed under the Open Data Commons Open Database License (ODbL) v1.0.
Data is provided every 10 min, but we use an hourly arithmetic mean. This temporal degradation is done because gamma counts are more reliable spread over a 1 h period, avoiding recording errors and being less noisy. In addition, here, only the rain data have a 10 min resolution. All the other met data have a 1 h resolution. Thus, the 1 h aggregation corresponds to the worst input data resolution.
2.2.2 Background radiation subtraction
The natural ambient gamma dose rate is composed of potassium-40 and three natural chains: thorium-232 (via thallium-208 progeny), uranium-238 (via its bismuth-214 progeny) and uranium-235 gamma emission. Cosmic rays can also be added as a component of the natural gamma dose rate, depending on the station altitude (Bossew et al., 2017). The background radiation in France is generally between 50 and 100 nSv h−1. This variability is due to the bedrock nature, the soil composition and the depth profiles of the radionuclides in the soil (Saito et al., 2012; Melintescu et al., 2018). In this study, the increase in the gamma dose rate due to the radon air concentration and deposition is independent of this background radiation.
The background radiation depends on the soil composition, its water content, the soil occupancy and the altitude. It is consequently different for each station and it evolves over time. The airborne radon part of the gamma dose rate can only be observed with a correct subtraction of the background radiation. There are two ways of doing this. The first way is to model this background radiation and the second is to mathematically determine it from the measured gamma dose rate time series. The first method is difficult and still uncertain, considering the poor knowledge of the soil composition surrounding each station.
It is for this reason that the background radiation is subtracted using a Gaussian filter. Gaussian filters are commonly used in signal processing. A background time series is computed for each station using the ndimage module of the scipy Python's library (https://docs.scipy.org/doc/scipy/reference/ndimage.html, last access: 21 July 2022; Virtanen et al., 2020). A sigma of 100 h is set for the computation. This value allows for any presence of radon peaks in the background time series, while keeping a fast computing analysis. The background time series is then subtracted from the measured one, providing an observation time series without its background component. This time series could finally be compared to the simulated gamma dose rate. Figure 5 gives an example of a background radiation subtraction.
Figure 5Example of background radiation subtraction. In black, the observed gamma dose rate. (a) Raw data. (b) Data after background radiation subtraction. (In red, simulated values.)
2.3 Observations-model comparison
A gamma dose rate peak is defined as a temporary elevation of the dose rate. A peak is defined by a location (that of the measurement station), a time (the moment of the maximum) and a peak intensity (the maximum gamma dose rate level once the background radiation has been subtracted). Two peak value levels are used here: peaks > 10 nSv h−1 and peaks > 50 nSv h−1. These two levels were chosen to acquire the largest number of peaks in order to obtain good statistics and to work on the model's ability to reproduce the highest peaks, i.e. the ones that trigger a radiological alert on the monitoring network.
2.3.1 Definitions of failures and successes
For each observed gamma dose rate peak, simulation success or failure were evaluated. Three categories were used: true positive (TP), false negative (FN) and false positive (FP). A TP is a peak observed that is well simulated. A FN is a peak observed but not simulated. A FP is a peak simulated but not observed.
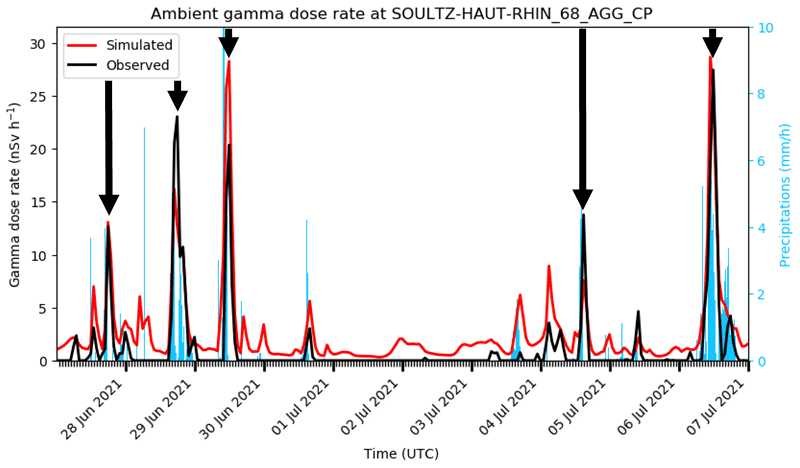
Figure 6Five TP in a row, at the Soultz–Haut–Rhin station at the start of summer 2021. TP are marked with black arrows.
A simulated peak is never perfectly identical to an observed peak. There is thus a necessity to define the tolerance to consider that a simulated peak is similar to an observed one. A tolerance in intensity, in time and in space can be set. A tolerance in intensity is relative to the dose rate value reached by the observed and the simulated peak. A factor 2 is used in this study. A factor 5 would lead to very good scores but would be poorly sensitive to the model setting and so this would prevent the identification of sources of improvement. Conversely, an intensity tolerance of a factor 1.1 leads to only 8 % of TP. The factor 2 in intensity is thus a balanced factor between severity and complacency, making it possible to effectively measure the impact of a parameter on the quality of the modelling. In addition, it should be recalled that the observations are themselves error accompanied (standard deviation ∼ 2.5 nSv h−1), and errors are added by the background radiation subtraction. Figure 6 illustrates a series of five peaks greater than 10 nSv h−1, counted as TP with a factor 2 tolerance. Concerning the time tolerance, an offset of 1 h is allowed between the timing of the observed and simulated local maximum. For the year 2021, 73 % of the simulated peaks were in time accordance with the observed peaks to the nearest hour. A 1 h tolerance is therefore strict enough for these study purposes. Note that the timing offset between simulated and observed peaks is zero-centred (Fig. 7), meaning there is no systematic error of the peak timing. Concerning spatial tolerance, despite the improvements and its positive impact on the statistics, none is set in the study; the gamma dose rate value simulated in the grid cell containing the Téléray station is used. Indeed, a one-cell tolerance was tested – selecting the best value of the 9-cells around the station. There are 83 % of the observed peaks simulated within a factor 2 using this spatial tolerance, but considering that rainfall events measured by radar are well located, it is difficult to justify this spatial tolerance without in-depth studies.
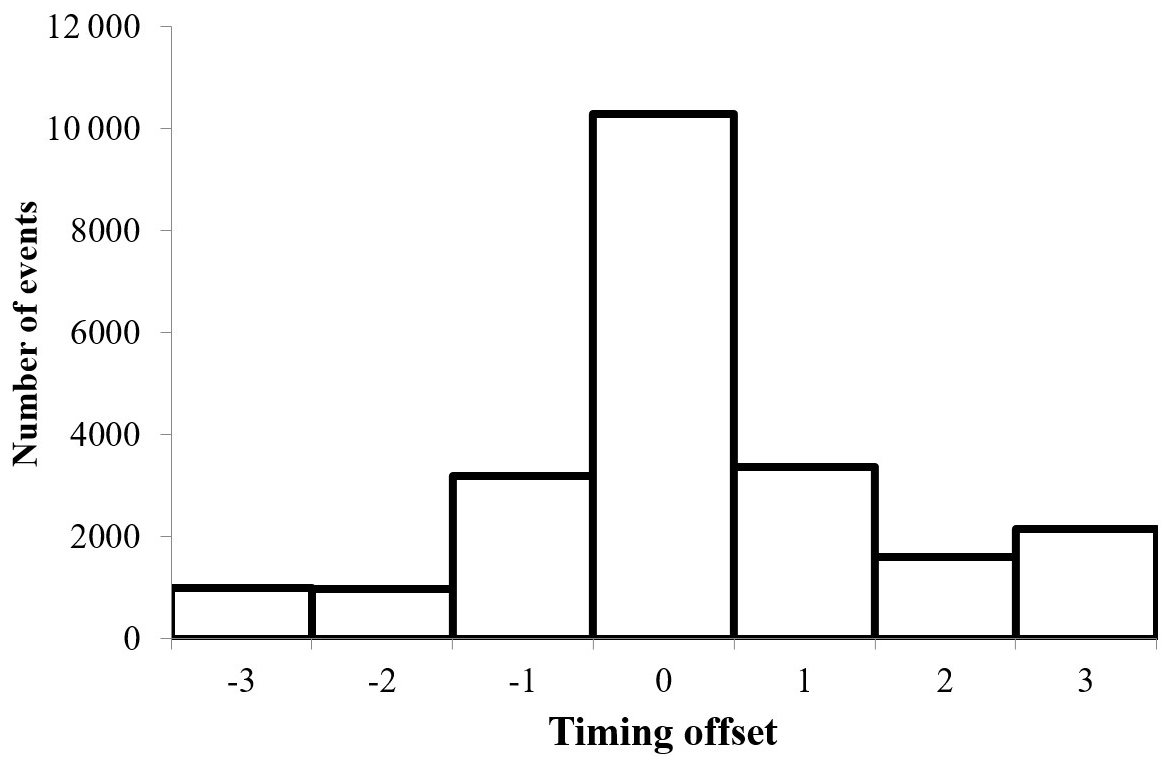
Figure 7Histogram of the timing offset between observed and simulated peaks for the year 2021.
2.3.2 Statistics toolbox
Statistics can be compiled by counting the number of TP, FN and FP over several time periods. It is difficult to compare results integrated over a year to those integrated over a month, or over two months, which is why we also used a statistical common way to aggregate TP, FN and FP, using the recall and precision metrics, themselves aggregates in the F1 score. The recall is the fraction of TP compared to the total number of observed peaks (Eq. 1). The precision is the fraction of the TP compared to the total number of simulated peaks (Eq. 2). The F1 score is the harmonic mean of the recall and the precision (Eq. 3).
In addition to these three metrics dedicated to the peaks, there is a need to measure the performance of the whole simulated gamma dose rate time series compared to the observed ones. The goal is to detect systematic bias or strong decorrelation between them. To do so, Pearson correlation coefficient (PCC), Factor 2 (FAC2) and Wasserstein distance are used. The PCC measures the linear correlation between the observed (μobs) and the simulated gamma dose rate time series (μsim). This value is between −1 and 1, and the agreement increases as the value approaches 1. The FAC2 is described in Eq. (4), evaluating the fraction of simulated values including in a factor 2 of the observed ones at the same time. The Wasserstein distance is computed with the Wasserstein_function of the stats module of the SciPy Python package (https://docs.scipy.org/doc/scipy/reference/stats.html, last access: 21 July 2022; Virtanen et al., 2020). The closer the Wasserstein distance is to zero, the closer are the observed and simulated time series.
2.3.3 Exclusion of outlier stations
The next step is to clean up the observation dataset. Some observations indeed appear not relevant for the comparison with the simulation. The metrics described above are applied to each station and the ones for which the scores are the worst are studied in detail. If a station produces bad metrics for reasons related to an observational bias or default, this station is tagged as an outlier and it is then excluded from the observation database.
A station could be an outlier for different reasons: a large gap in data, a drift in observation due to a calibration error, a station in a mountainous area, or the presence of anthropic gamma dose rate peaks, for instance due to some industrial activities occurring in its neighbourhood. The three global metrics (PCC, FAC2 and Wasserstein distance) are particularly useful to detect these outliers. The first results are a presentation of the outliers found in this two-year study.
3.1 Identified outliers
The worst recalls were obtained for stations located at high altitude. For example, the Pic-du-Midi-de-Bigorre station, located at 2876 m a.s.l. (above sea level), gave 85 FN over the 2020–2021 period, including six gamma dose rate peaks greater than 50 nSv h−1. Figure 8a shows four of them observed between June and July 2020. Figure 8b is zoomed around the peak of the 30th June. These FN could be explained in two ways: average value assessment and snow deposition. LdX is dedicated to assessing an average concentration in a cell (as a reminder, about 10×10 km), and does not represent variability within the cell. This is also true for the underlying meteorological model, and especially the modelled topography is considerably smoothed and the mean altitude in the grid-cell is much lower than the contained summits. This has to be kept in mind when performing model-to-measurement comparisons in mountainous areas where large wind variabilities and major vertical transport and mixing processes are induced by the sub-grid topography in reality but missed by the model (Rotach et al., 2014, 2015). High altitude stations are finally more subject to snowfall. Particle scavenging by snow is however not yet well modelled in LdX. In addition to the Pic-du-Midi-de-Bigorre station, Aiguille-du-Midi lies in the same outlier category. These two stations give a recall of 19 % (Aiguille-du-Midi) and 11 % (Pic-du-Midi-de-Bigorre) over the 2020–2021 period. This is three to six time lower than the 62 % obtain in mean for the validated stations (see Sect. 3.2).
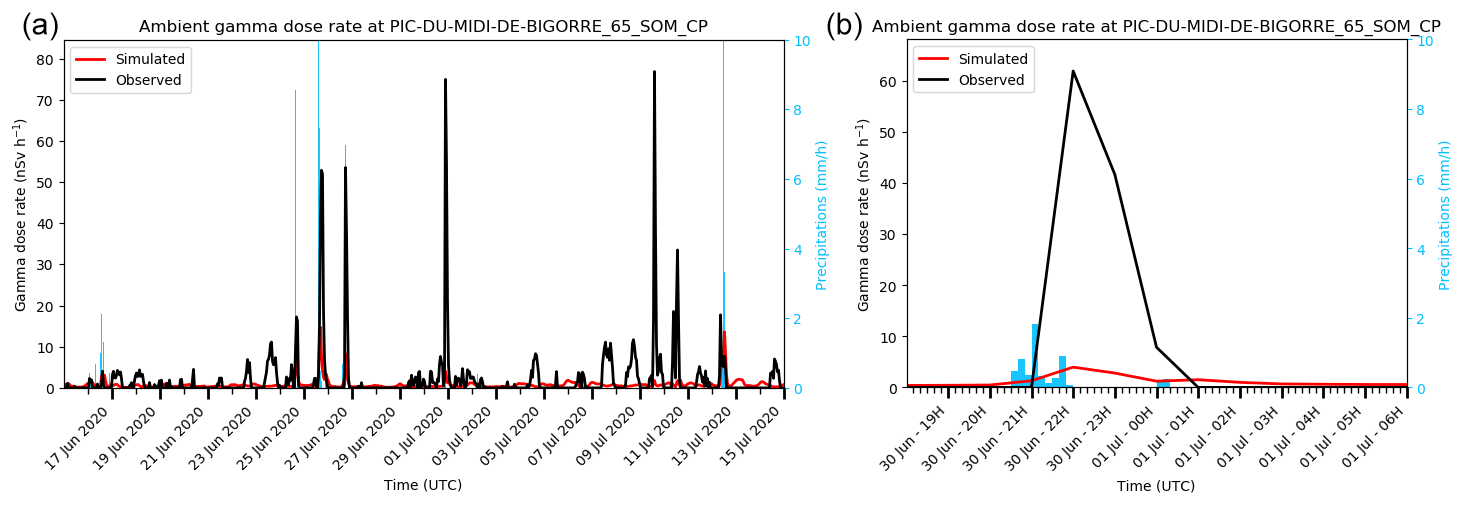
Figure 8Observed and simulated ambient gamma dose rate at the Pic-du-Midi-de-Bigorre station. (a) In June and July 2020. (b) The 30 June 2020.
Conversely, some stations lead to a large number of FP. One of these stations, the Tour Eiffel station, appears to be located too high above the ground (100 m a.g.l., Fig. 9a and b) to be sufficiently sensitive to gamma rays emitted from ground deposition.
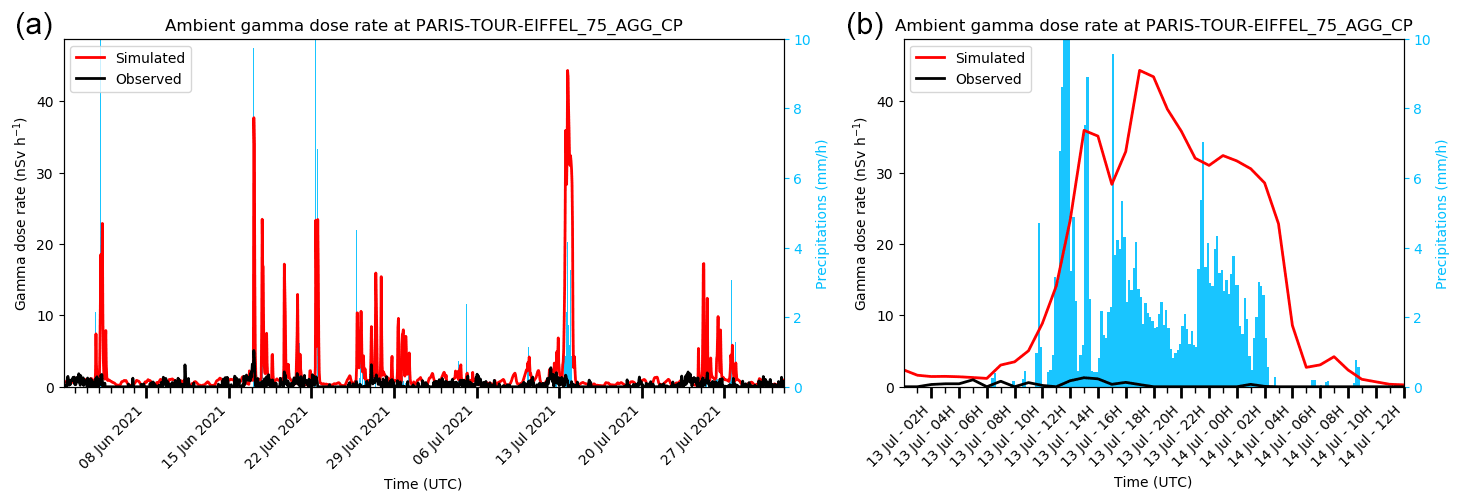
Figure 9Observed and simulated ambient gamma dose rates at the Paris Tour Eiffel station. (a) In June and July 2021. (b) The 13 July 2021.
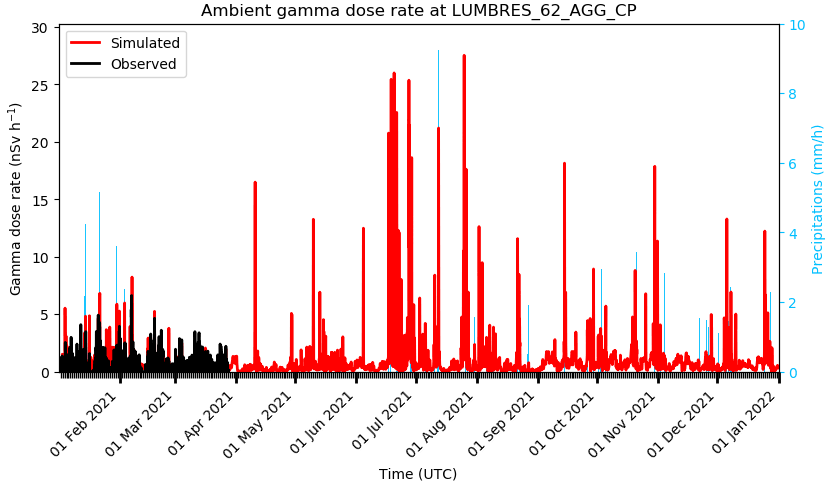
The stations with a lot of missing data have a particularly poor Wasserstein distance. The worst score in 2021 was obtained by the Lumbres station with a value of 0.42, with an obvious lack of data after April 2021 (Fig. 10). It appears that all stations with a Wasserstein distance greater than 0.1 have at least three months of missing observations. There are thus 21 identified outlier stations for the year 2020 and 19 for the year 2021. Note that 7 stations are excluded for both years (Fumay, Grenoble-GN, Lyon, Montpellier, Ruoms, St-Paul-Trois-Chateaux and Sully-sur-Loire).
The FAC2 illustrates the cases where observations are obviously underestimated. The worst FAC2 of 2021 is obtained at the Rodez station with a value of 0.7 % (see Fig. 11a and b time series). It appears that, at this station, the observed values are never greater than 3.3 nSv h−1. Four more stations are excluded due to a too low FAC2 in 2020 and 2021: Rodez, Vincennes, Paris-Sacré-Cœur and Cruas-SIT. The common feature of these four stations is an obstructed horizon (shielding effect), explaining the strong differences between the observed and modelled gamma dose rate peaks. These are categorised as “stations with incompatible horizon”, as well as the Paris-Tour-Eiffel station. This evaluation is indeed based on dose rate coefficients assuming a flat, uniformly contaminated plain, without any obstacles.

Figure 11Observed and simulated ambient gamma dose rates at the Rodez station. (a) In June and July 2021. (b) The 24 June 2021.
The PCC outliers do not bring any other outliers. A high number of FN can also be a clue to exclude some stations. With 8 FN in 2020 for peaks greater than 50 nSv h−1, La-Seyne-sur-Mer is the worst of this metric (see Fig. 12a and b time series), while the second one has only 3 FN. These gamma dose rate peaks are in fact due to anthropic gamma shots. This station outlier is thus excluded. In the same way, Omonville-la-Petite has a large number of FN, in fact gamma dose rate peaks due to industrial activities. The Freiburg station also gives a large number of FN, which are linked to snow deposition. Aerosol particle scavenging by snowfall events are not yet specifically simulated in our ATM. Since out of the domain of validity of the ATM, this station is also excluded.
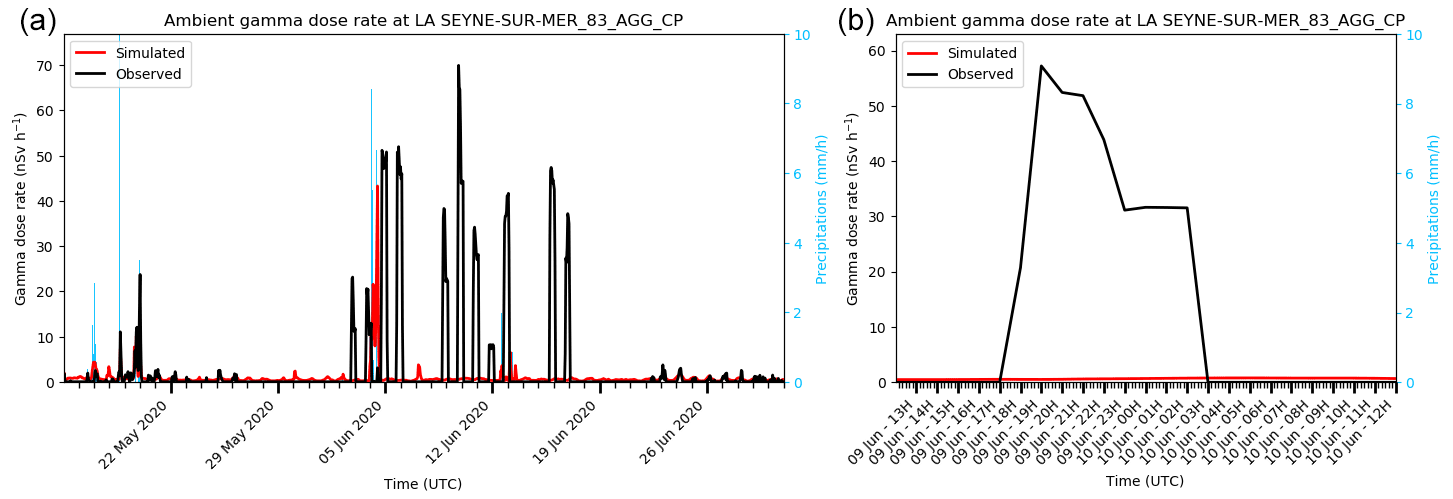
Figure 12Observed and simulated ambient gamma dose rates at the La-Seyne-sur-Mer station. (a) In May and June 2020. (b) The 9 June 2020.
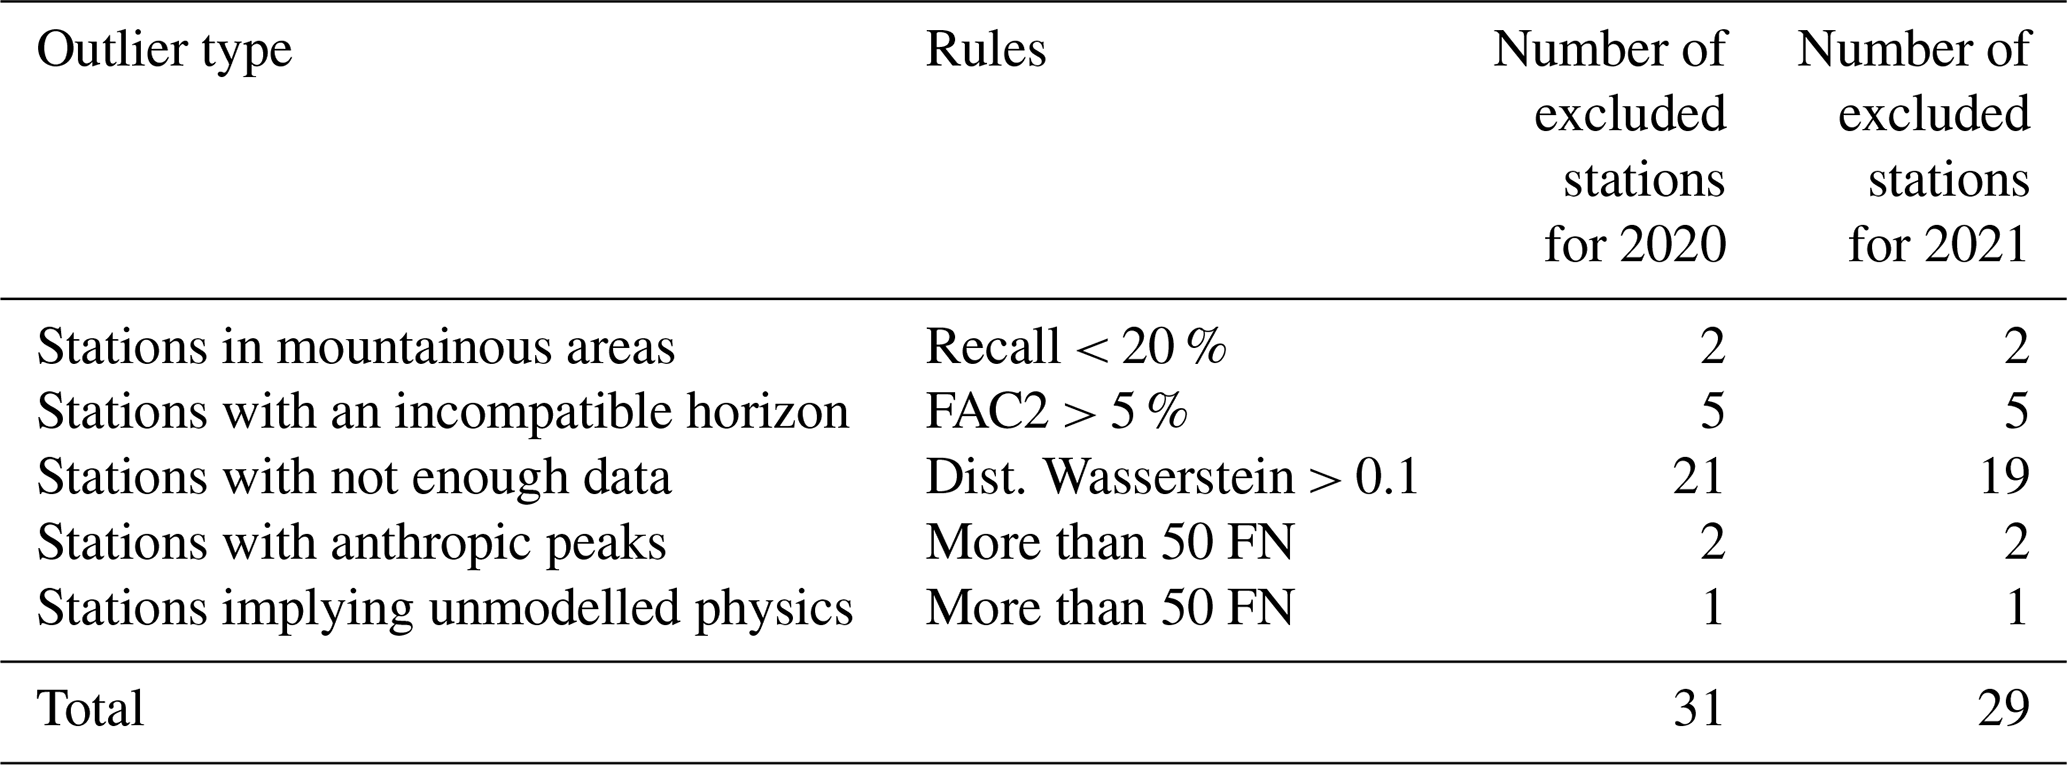
In total, 31 outlier stations were excluded in 2020 and 29 in 2021. The summary of these outliers is provided in Table 2, giving a total number of 395 stations in 2020 and 393 stations in 2021.
3.2 Statistics for 2020 and 2021
Once the outliers were identified and excluded from the measurement database used to compare with the simulations, statistics were compiled over the whole period of simulation, from 1 January 2020 to 31 December 2021 on the remaining stations. Table 3 summarises the impact of the removal of outlier stations. It appears that the removal impact is limited, with only 6 % of the observed peaks excluded. Recall, precision and F1 score are only improved by 2 %. It is a reassuring fact in so far as, even if some outliers have been omitted, the results remain consistent.
Table 3Statistics for peaks greater than 10 nSv h−1 during the period 2020–2021 with and without the outlier stations.

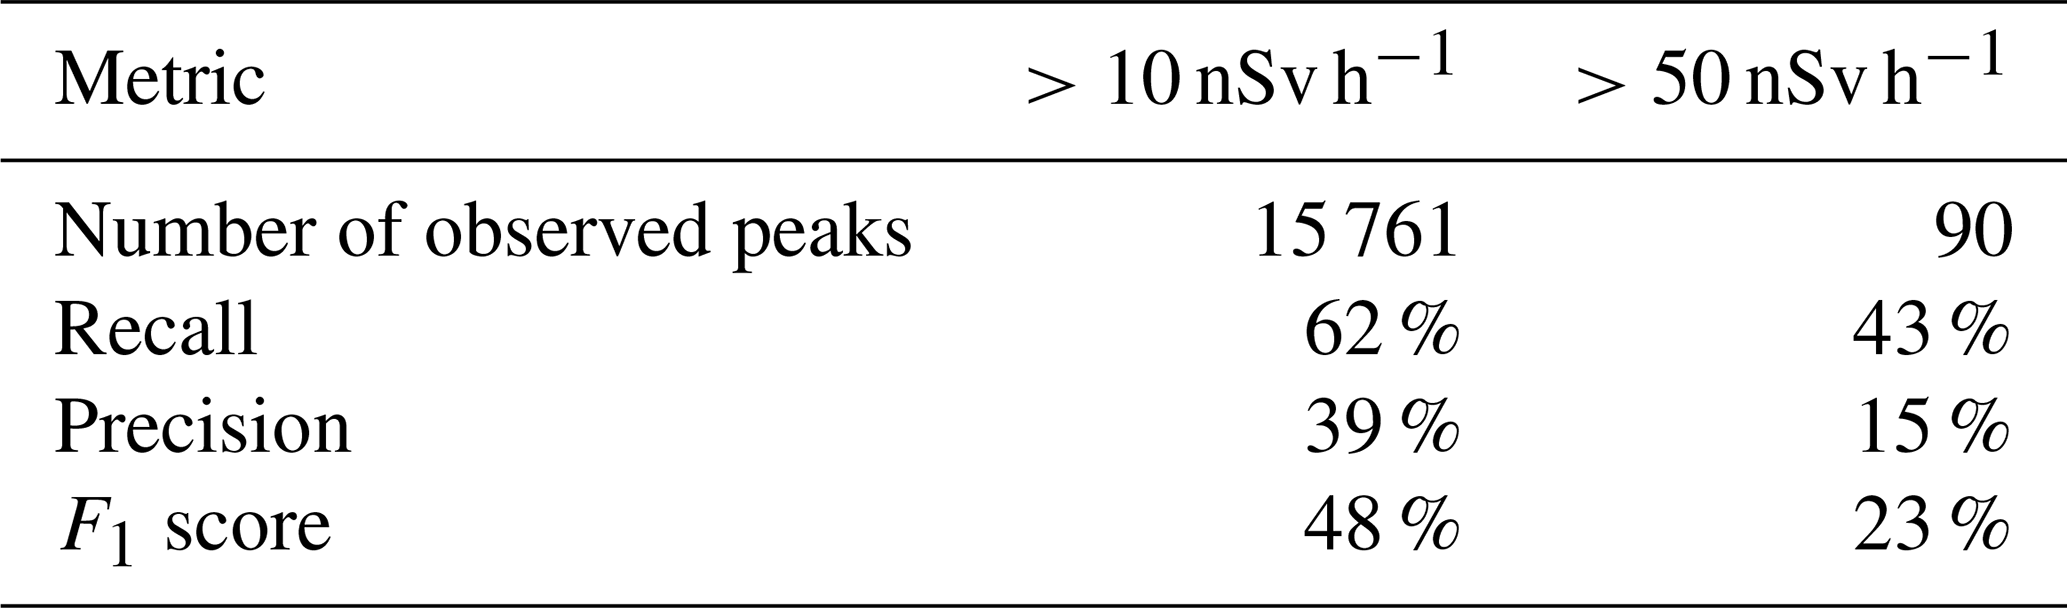
The statistics are more relevant for peaks greater than 10 nSv h−1, due to a larger number of events. Peaks greater than 50 nSv.h−1 are rare, with only 90 observed events (263 simulated). The higher the peaks, the worse the results (Table 4). Recall is 20 % less for peaks greater than 50 nSv h−1 than the 10 nSv h−1 peaks, meaning that fewer observed peaks are indeed simulated, relatively speaking. It is worst with the precision, with a 25 % decrease of the metrics, meaning that only a fraction of the simulated peaks greater than 50 nSv h−1 are indeed observed. The F1 score confirms these results. If this trend turns out to be statistically confirmed, it will be difficult to understand why it is more difficult to simulate the higher gamma dose rate peaks. The wet deposition schemes or precipitation issues could be a possible explanation, and would need further study.
Table 4Statistics for peaks greater than 10 and 50 nSv h−1 for the period 2020–2021, without the outliers.
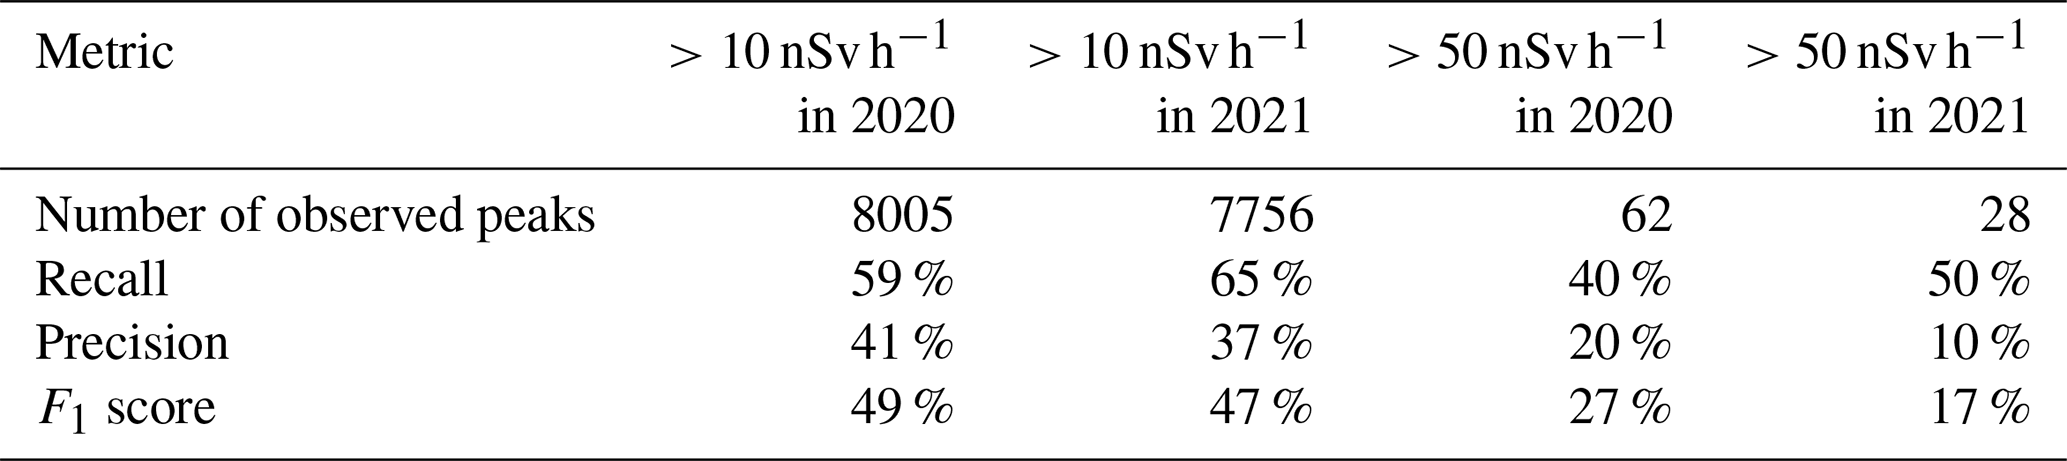
2020 and 2021 have similar statistics for peaks greater than 10 nSv h−1, with less than 6 % difference for the recall, precision (Table 5). Recall is better for 2021 than 2020, whereas precision is better for 2020 than 2021. The same behaviour is observed for peaks greater than 50 nSv h−1, with greater differences: recall 10 % better in 2021, and precision 10 % worse.
Table 5Statistics for peaks greater than 10 and 50 nSv h−1 for 2020 and 2021, without the outliers.
The number of observed peaks cannot be seen as homogeneous on a monthly basis (Fig. 13a). There is a maximum of peaks in June and September, and a minimum during the first three months of the year. Winter months are indeed known to have a smaller exhalation rate, due to soil humidity and freezing (López-Coto et al., 2013; Karstens et al., 2015), unlike summer months, where exhalation is maximum. During the months of July and August there are less rainfall events than in June and September, leading finally to a smaller number of events in July and August. This monthly variation is well reproduced by the modelling (Fig. 13b). The number of FP is then not month-dependent.
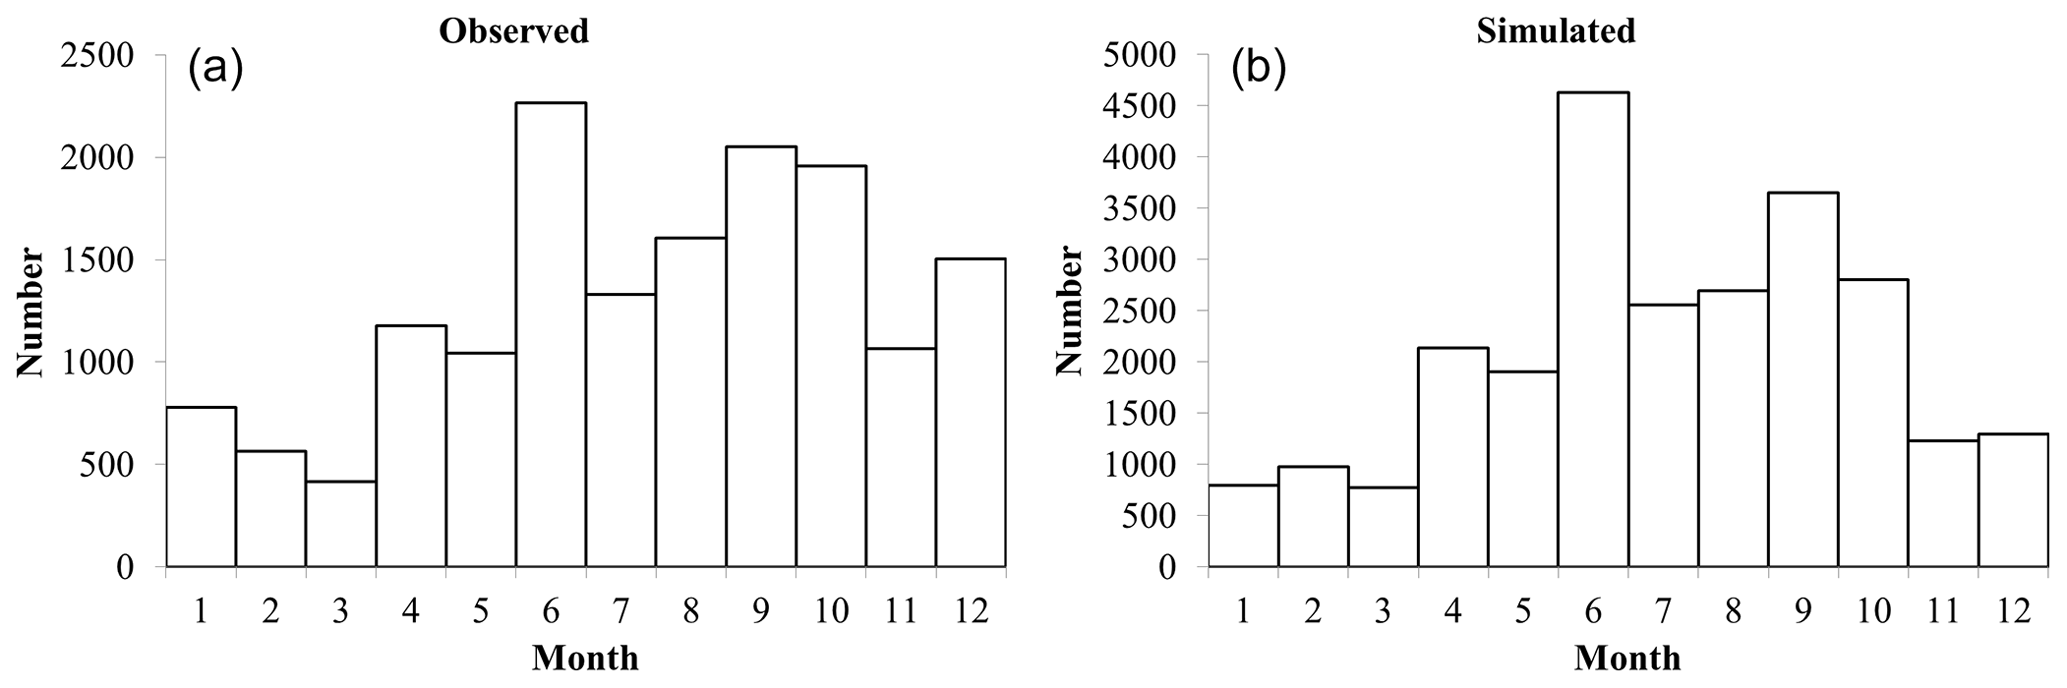
Figure 13Monthly distribution of the peaks for the period 2020–2021. (a) Observed peaks. (b) Simulated peaks.
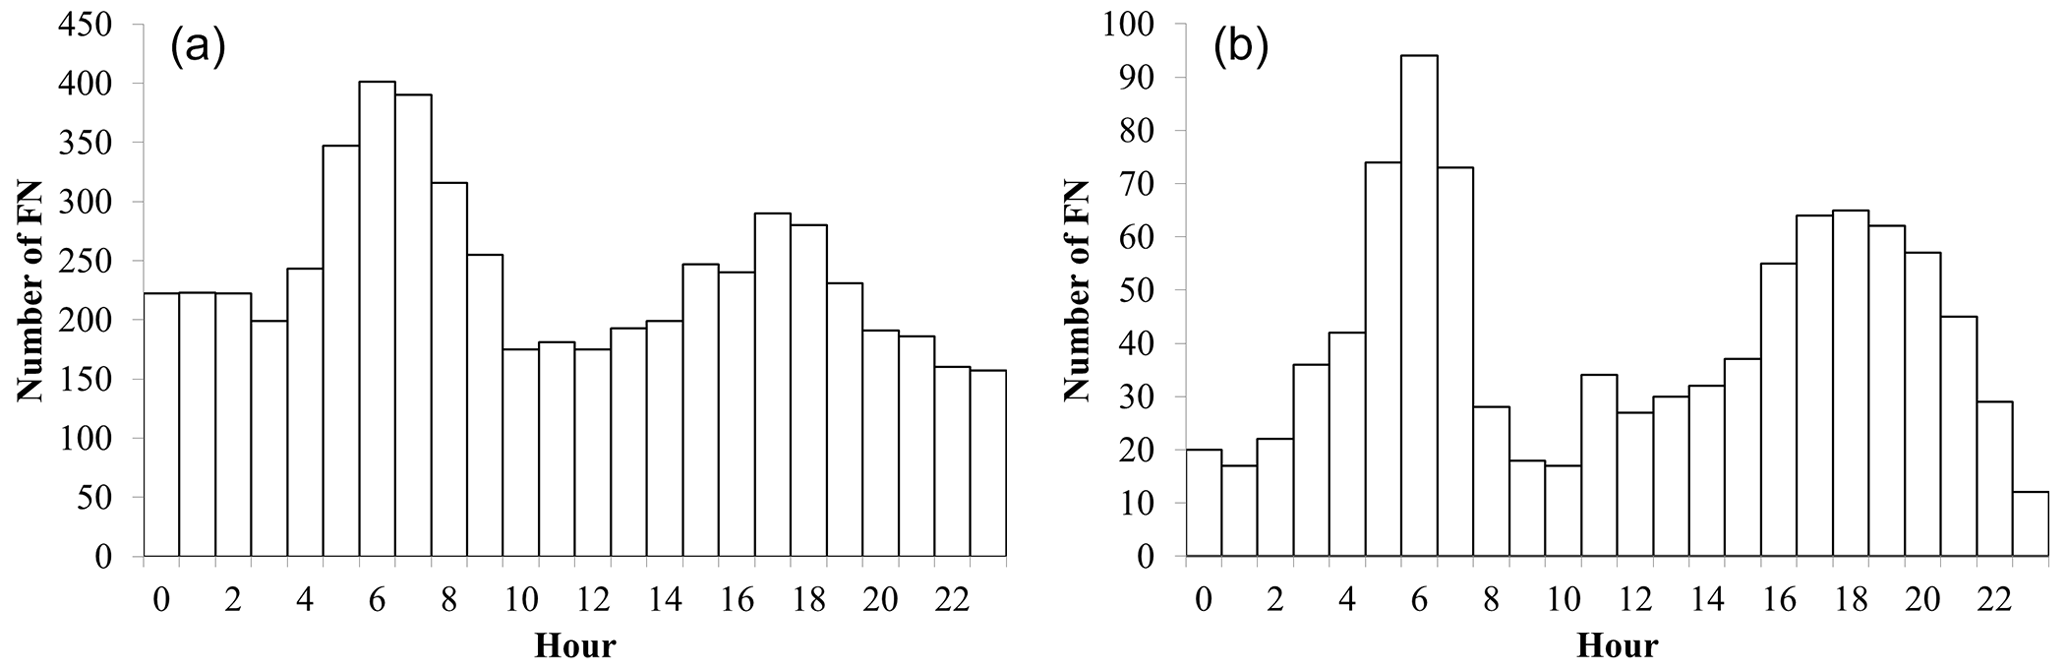
Figure 14Hourly distribution of FN. (a) For the period 2020–2021. (b) For July and August 2020 and 2021.
Like the monthly shape, there is also an hourly shape. Figure 14a illustrates the time of day at which FN occur for the whole period 2020–2021, with a first maximum of FN between 06:00 and 07:00 UTC and a second between 18:00 and 19:00 UTC. This feature is not observed on the TP and on the FP. It can be noticed that this pattern is intensified for the month of July and August (Fig. 14b). The morning peaks are not related to rainfall events. It appears that they are due to night inversion (stratification of the lower layers of the atmosphere). This diurnal phenomenon has already been well observed for radon air concentration activity (Arnold et al., 2009; Barbosa et al., 2017) and ambient gamma dose rates (Melintescu et al., 2018). During the night, the soil is indeed colder than the air, cutting convection due to warming of the lower atmosphere layer caused by the soil, and vertical mixing is then limited during the night. Radon exhalation is exactly the same during the day or night, so the radon exhaled at night accumulates in the first layer of the atmosphere (0–40 m a.g.l. in our modelling). Due to this radon accumulation, its progeny are also in greater concentrations, leading to a gamma dose rate increase. At sunrise, the soil warms up again and convection restarts shortly after, leading to a vertical mixing of the atmosphere, decreasing the radon concentrations and the ambient gamma dose rate in the lower layers. This rise and decrease in the gamma dose rate can be interpreted as a gamma dose rate peak. The example of Limoges during the last two weeks of July 2020 is relevant to this point (Fig. 15a and b), where observed gamma dose rate amplitudes may exceed 20 nSv h−1. Most of these observed peaks are FN, probably meaning that the nightly vertical mixing is probably overestimated by the vertical diffusion schemes used by LdX. This atmospheric phenomenon is especially important during summer, which explains the high number of FN during this period. A part of the late afternoon peaks are correlated to rainfall events, possibly due to thunderstorms breaking out in summer at this time of the day. Further studies will be necessary to confirm this hypothesis.
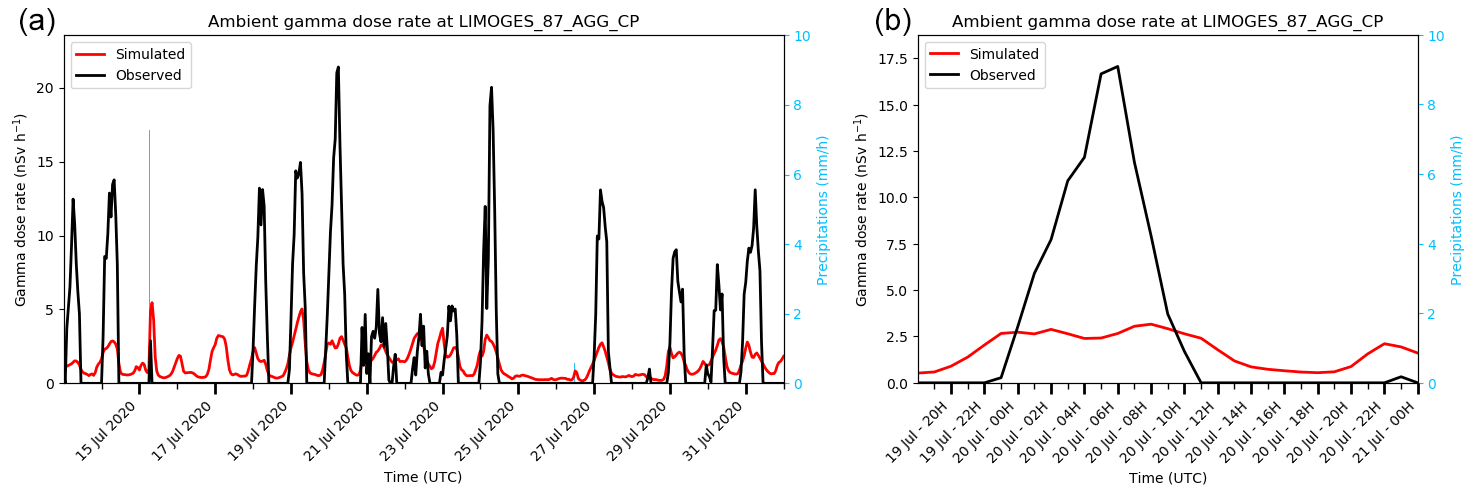
Figure 15Observed and simulated dose rates at Limoges, illustrating summer nights FN. (a) In July 2020. (b) The 20 July 2020.
The results obtained from the modelling of atmospheric transport and deposition of radon and its progeny provide some reassuring certainties about the ATM capability and the entire modelling chain. Yet, it also raises questions and sets out a path for improving the radon modelling chain, from exhalation to the gamma dose rate.
4.1 Certainties
This comparison between an ATM dedicated to radionuclide transport and ambient gamma dose rate measurements was here conducted in “peace time”, testing all the elements of the domestic operational chain and would also be carried out in the event of a nuclear accident leading to atmospheric releases. Several aspects of this particular modelling-observation comparison have been assessed and can be transposed from one case to another. One is the identification of outlier stations. Respectively 29 and 31 stations were identified for 2020 and 2021 as not comparable with this modelling. In a hypothetical emergency with a release of radionuclides into the atmosphere, these stations should be considered by-default as out of the domain of validity of this kind of modelling.
Another gained certainty concerns the timing of the simulated results. Validation of gamma dose rates evaluated from LdX results was previously done following the Fukushima incident (Saunier et al., 2013), but the radon modelling chain presented here allows validation against thousands of events using ARPEGE NWP data coupled with rain radar observations. On this basis we have now gained confidence in the model to statistically simulate the gamma dose rate due to a deposition event at the right time.
The results appear to be consistent over the two years studied. The same behaviour was observed in failures and successes throughout this period. It is a key point for the reliability of the model and the observations. Without being perfect, it must be noted that the modelled peak intensities are of the same magnitude as the observed peak intensities. A F1 score of 82 % with a tolerance of factor 5 in the peak intensity – 89 % if a spatial tolerance on the peak location and a 3 h temporal tolerance is added – indicates that the simulated peaks intensities are consistent with the observed intensities. Even for high-intensity peaks (greater than 50 nSv h−1), we obtained a F1 score of 80 % with tolerances. The solution for the background subtraction is then validated, and the modelling seems to be immune to a major systematic error.
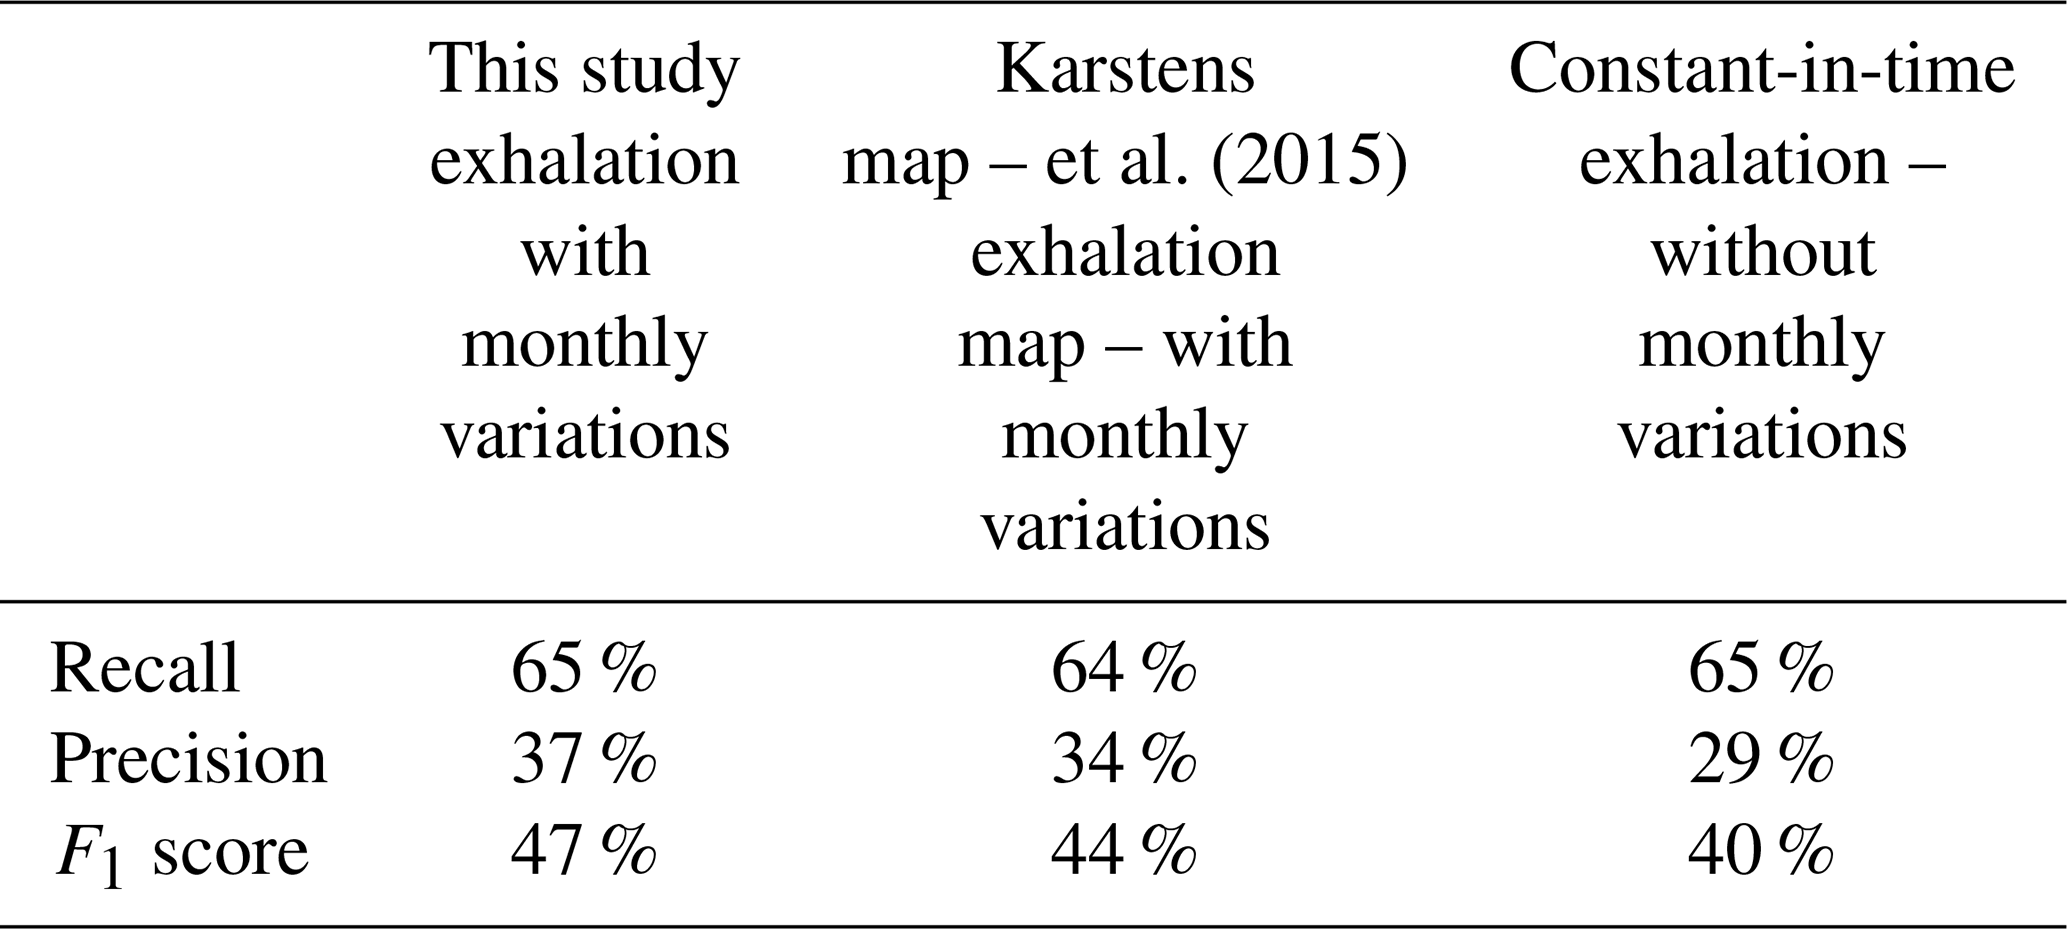
Concerning exhalation, we have presented only one model herein, the combination of an IRSN term over France and the Karstens et al. (2015) one over the rest of Europe. We also performed a sensitivity test on these exhalation maps, using a 100 % Karstens et al. (2015) exhalation and constant-in-time exhalation. It showed a relative independence on the exhalation map choice (Table 6), with a recall, precision and F1 score equal within a 3 % range. However, using a constant-in-time source leads to a score degradation, notably for the precision, due to a greater number of FP. Note that the time dependency of the exhalation rate is more critical in winter, with 2380 FP in January–February 2021 without monthly variations, compared to only 912 FP during the same period with a monthly variation. These results were expected, as the constant-in-time exhalation is set for the summer months. The impact of the exhalation map deserves a more complete and dedicated study (see next section). However, we can already affirm that a monthly variation of the exhalation rate is mandatory for atmospheric radon modelling.
Table 6Impact of the exhalation map choice on the score for the 2020–2021 period.
Finally, a list of gamma dose rate peak modelling failures has already been understood, in addition to the already described outlier stations. Errors can also be caused by poorly modelled atmospheric phenomena, such as atmosphere stability during summer nights. This leads us to be careful with the model results obtained in such circumstances, further studies dedicated to resolve this issue are needed. It is however as important to know the domain of validity of a modelling, especially for an ATM used to help manage the consequences of a potential nuclear accident.
4.2 Future developments
This study attests to already substantial work, with appreciable lessons, but further developments have been identified. With a model of atmospheric radon, from exhalation to ambient gamma dose rate, and with the appropriate metrics, it is now possible to statistically and locally measure the impact of model improvements of exhalation, meteorology, atmospheric transport, deposition and gamma dose rate estimation.
An expected major improvement concerns the exhalation of radon. We have here used monthly variations deduced from the 2006–2012 period studied by Karstens et al. (2015). To start, we have to set our radon exhalation rate to the hourly soil water content, and possibly to other parameters such as the atmospheric pressure, the water table depth and the, soil porosity. The results of the RadoNorm (grant agreement No. 900009 – Euratom Research and Training Programme 2019–2020) and TraceRADON (Röttger et al., 2021) European projects should be helpful for this. In addition, a more complete sensitivity study to the exhalation map could be performed. This could be the opportunity to test other exhalation maps, such as those of Szegvary (2007) and López-Coto et al. (2013).
Another major further development concerns atmospheric vertical mixing, proved as poorly modelled during various late night periods. In a Eulerian ATM like LdX, vertical mixing is modelled by vertical advection (given by the NWP), and by vertical diffusion (also called Kz). Vertical diffusion schemes are particularly difficult to validate. Atmospheric radon appears as an opportunity to work on this item, for instance thanks to the ICOS network (Heiskanen et al., 2021; Grossi et al., 2020). Some stations of this European network provide radon-222 air concentrations for several heights above ground level. It is an opportunity to validate the vertical mixing modelling in the spirit of the Vargas et al. (2015) works, or, at least, to specify the domain of validity of the actual vertical diffusion schemes. Improvements in radon-222 air concentration measurements are also an opportunity to validate the native output data of the ATM (Grossi et al., 2020), unaffected by deposition, contrary to the progeny. Note that this radon air concentration data can also be used to validate the exhalation rate maps.
Deposition modelling, particularly wet deposition, could also benefit from further developments. We have to understand why the actual model seems less efficient in reproducing gamma dose rate peaks with the highest intensities, greater than 50 nSv h−1 than the smaller ones. We suspect an issue with the rainfall rates and/or the wet deposition scheme. Radar observation native resolution (1 km) are indeed degraded to fit to the other meteorological data resolution (0.1∘, ∼10 km). In thunderstorm conditions, rainfall rates are high with strong spatial gradients, both averaged by spatial interpolation. There is then a possibility of a deposition to be evaluated with incorrect inputs. Concerning deposition schemes, we use here a very simple scheme, only depending on the rainfall intensity (see Table 1 in Sect. 2.1). However, in fact, the scavenging coefficient depends on the particle size distribution (Quérel et al., 2014), and other difficult to assess parameters such as electric charges (Lemaitre et al., 2020). The wet deposition scheme used here is possibly neither adapted to the particle size distribution of the attached-to-particles radon progeny, nor to their physical and chemical properties. After the Fukushima case (Leadbetter et al., 2015; Quérel et al., 2021), atmospheric radon could be a good case study to evaluate wet deposition sensitivity, including in long-range atmospheric transport modelling. The other key point could be the implementation of scavenging by snow. It is known that the vast majority of the rainfall events at European latitudes start as snow before melting to rain, so it therefore must be important to distinguish below-cloud scavenging by rain and snow (Leadbetter et al., 2015). In addition to this, a hundred snow deposition events were identified for the winter 2020–2021 on the Téléray network, which could be used as a specific validation set.
Other topics can be explored in the future concerning atmospheric radon modelling: the station surroundings and their impact on the ability of the model to reproduce the observation or the sensitivity of the NWP choice.
In conclusion, a comprehensive modelling of atmospheric radon-222 and its progeny has been set up. Radon exhalation, transport through the atmosphere, decay, progeny, progeny deposition and ambient gamma dose rate evaluation were performed in order to model the gamma dose rate peaks observed by a radiation monitoring network. We were particularly interested in the gamma dose rate peaks due to scavenging by rain of the radon-222 progeny, which are to aerosol particles. The primary purpose of this study was to add validation cases for LdX, the operational atmospheric transport modelling used by IRSN to evaluate the consequences of a radionuclides release for distances greater than 50 km. The atmospheric radon modelling also reveals itself to be an interesting tool to validate radon exhalation maps and to deal with observations-model comparisons of ambient gamma dose rates.
The two year period 2020–2021 was modelled at the European scale, with a comparison made on Téléray, the radiation monitoring network operated by IRSN (+430 stations). Once the outlier stations were eliminated, 15,761 gamma dose rate peaks greater than 10 nSv h−1 were observed on the network during this period – 90 greater than 50 nSv h−1, which allows better statistics than any past accidental nuclear release. A F1 score of 48 % was obtained on peak detection, with a tolerance of a factor 2 on peak value and 1 h on timing. We observed a model tendency to create more false positives (peak simulated but not observed) than false negatives (peak observed but not simulated). This can be explained by an overestimation of the radon flux, rainfall intensities or wet deposition. Further studies will be needed to improve the modelling. Nevertheless, a F1 score of 89 % is obtained by relaxing the intensity, timing and spatial tolerances, meaning that the atmospheric radon model is definitely at the right magnitude to evaluate gamma dose rate peaks.
Even if the model is at the correct magnitude, there is plenty of room to improve it. Our main objectives will be to use properly parametrised exhalation rates, using soil water content instead of a pre-evaluated monthly variation. Results of the European project RadoNorm and TraceRadon could be the next steps for this topic. Another important objective is to work on the vertical mixing of the atmospheric transport modelling, which appears in this study to be inappropriate for some meteorological situations, for example during stable summer nights. The third main objective is to work on the modelling of gamma dose rates due to scavenging of radon progeny by rain and snow. Scavenging by rain schemes could be improved and validated following this study. Furthermore, scavenging by snow should be implemented and validated, as almost all the precipitation events at European latitudes start as snow before melting to form rain.
Codes are not available until their legal status has been clarified. IRSN is working on an open access platform, currently closed.
Meteorological data is given at https://donneespubliques.meteofrance.fr/ (Météo France, 2022). Other data is available upon request to the author. As for the code availability,
AQ and DQ contributed to writing – original draft preparation. KM, TD and SC contributed to writing – review and editing. KM contributed to formal analysis. AQ, KM and DQ contributed to methodology, software and validation. DQ, TD and SC contributed to resources. AQ, KM, DQ, TD and SC contributes to visualization. The CRediT contributor roles taxonomy has been used to define author contribution.
The contact author has declared that none of the authors has any competing interests.
Publisher's note: Copernicus Publications remains neutral with regard to jurisdictional claims in published maps and institutional affiliations.
This article is part of the special issue “Geoscience applications of environmental radioactivity (EGU21 GI6.2 session)”. It is a result of the EGU General Assembly 2021, 19–30 April 2021.
The authors would like to thank Claire Gréau, Nahla Mansouri and Géraldine Ielsch (IRSN-PSE-ENV-SEREN) for their advice and knowledge concerning radon exhalation; Cécilia Damon and Ghislain Darley (IRSN-DTR-D3NSI-SVDDA) for their help on data processing; Romain Vidal (IRSN-PSE-ENV-SIRSE) for his advice and support on Téléray data; François Gheusi (Laboratoire d'Aérologie, Observatoire Midi-Pyrénées) for his advice on modelling in mountainous area; Jérome Groëll, Damien Didier and Emmanuel Quentric (IRSN-PSE-SANTE-SESUC) for their support to this study – and Emmanuel for his review of a draft of the manuscript. Finally, the authors would like to thank Jubricia Baboussadiambou-Mamadou and Pavel Samene-Tiah who did their internship on this study during the difficult times of the pandemic.
This paper was edited by Xuemeng Chen and reviewed by two anonymous referees.
Arnold, D., Vargas, A., and Ortega, X.: Analysis of outdoor radon progeny concentration measured at the Spanish radioactive aerosol automatic monitoring network, Appl. Radiat. Isotop., 67, 833–838, https://doi.org/10.1016/j.apradiso.2009.01.042, 2009.
Arnold, D., Vargas, A., Vermeulen, A. T., Verheggen, B., and Seibert, P.: Analysis of radon origin by backward atmospheric transport modelling, Atmos. Environ., 44, 494–502, https://doi.org/10.1016/j.atmosenv.2009.11.003, 2010.
Barbosa, S. M., Miranda, P., and Azevedo, E. B.: Short-term variability of gamma radiation at the ARM Eastern North Atlantic facility (Azores), J. Environ. Radioact., 172, 218–231, https://doi.org/10.1016/j.jenvrad.2017.03.027, 2017.
Bossew, P., Cinelli, G., Hernández-Ceballos, M., Cernohlawek, N., Gruber, V., Dehandschutter, B., Menneson, F., Bleher, M., Stöhlker, U., Hellmann, I., Weiler, F., Tollefsen, T., Tognoli, P. V., and de Cort, M.: Estimating the terrestrial gamma dose rate by decomposition of the ambient dose equivalent rate, J. Environ. Radioact., 166, 296–308, https://doi.org/10.1016/j.jenvrad.2016.02.013, 2017.
Bottardi, C., Albéri, M., Baldoncini, M., Chiarelli, E., Montuschi, M., Raptis, K. G. C., Serafini, A., Strati, V., and Mantovani, F.: Rain rate and radon daughters' activity, Atmos. Environ., 238, 117728, https://doi.org/10.1016/j.atmosenv.2020.117728, 2020.
Eckerman, K. F. and Ryman, J. C.: Federal guidance report no. 12: External exposure to radionuclides in air, water, and soil, US Environmental Protection Agency, Oak Ridge, Tennessee, USA, https://www.epa.gov/radiation/federal-guidance-report-no-12-external-exposure-radionuclides (last access: 21 July 2022), 1993.
Eslinger, P. W., Bowyer, T. W., Achim, P., Chai, T., Deconninck, B., Freeman, K., Generoso, S., Hayes, P., Heidmann, V., Hoffman, I., Kijima, Y., Krysta, M., Malo, A., Maurer, C., Ngan, F., Robins, P., Ross, J. O., Saunier, O., Schlosser, C., Schöppner, M., Schrom, B. T., Seibert, P., Stein, A. F., Ungar, K., and Yi, J.: International challenge to predict the impact of radioxenon releases from medical isotope production on a comprehensive nuclear test ban treaty sampling station, J. Environ. Radioact., 157, 41–51, https://doi.org/10.1016/j.jenvrad.2016.03.001, 2016.
Fujinami, N.: Observational study of the scavenging of radon daughters by precipitation from the atmosphere, Environ. Int., 22, 181–185, https://doi.org/10.1016/S0160-4120(96)00106-7, 1996.
Griffiths, A. D., Zahorowski, W., Element, A., and Werczynski, S.: A map of radon flux at the Australian land surface, Atmos. Chem. Phys., 10, 8969–8982, https://doi.org/10.5194/acp-10-8969-2010, 2010.
Groëll, J., Quélo, D., and Mathieu, A.: Sensitivity analysis of the modelled deposition of 137 Cs on the Japanese land following the Fukushima accident, Int. J. Environ. Pollut., 55, 67–75, https://doi.org/10.1504/ijep.2014.065906, 2014.
Grossi, C., Chambers, S. D., Llido, O., Vogel, F. R., Kazan, V., Capuana, A., Werczynski, S., Curcoll, R., Delmotte, M., Vargas, A., Morguí, J.-A., Levin, I., and Ramonet, M.: Intercomparison study of atmospheric 222Rn and 222Rn progeny monitors, Atmos. Meas. Tech., 13, 2241–2255, https://doi.org/10.5194/amt-13-2241-2020, 2020.
Heiskanen, J., Brümmer, C., Buchmann, N., Calfapietra, C., Chen, H., Gielen, B., Gkritzalis, T., Hammer, S., Hartman, S., Herbst, M., Janssens, I. A., Jordan, A., Juurola, E., Karstens, U., Kasurinen, V., Kruijt, B., Lankreijer, H., Levin, I., Linderson, M.-L., Loustau, D., Merbold, L., Myhre, C. L., Papale, D., Pavelka, M., Pilegaard, K., Ramonet, M., Rebmann, C., Rinne, J., Rivier, L., Saltikoff, E., Sanders, R., Steinbacher, M., Steinhoff, T., Watson, A., Vermeulen, A. T., Vesala, T., Vítková, G., and Kutsch, W.: The Integrated Carbon Observation System in Europe, B. Am. Meteorol. Soc., 1, 1–54, https://doi.org/10.1175/BAMS-D-19-0364.1, 2021.
ICRP: Radionuclide Transformations – Energy and Intensity of Emissions, https://www.icrp.org/publication.asp?id=ICRP Publication 38 (last access: 21 July 2022), 1983.
Ielsch, G., Cuney, M., Buscail, F., Rossi, F., Leon, A., and Cushing, M. E.: Estimation and mapping of uranium content of geological units in France, J. Environ. Radioactiv., 166, 210–219, https://doi.org/10.1016/j.jenvrad.2016.05.022, 2017.
Inomata, Y., Chiba, M., Igarashi, Y., Aoyama, M., and Hirose, K.: Seasonal and spatial variations of enhanced gamma ray dose rates derived from 222Rn progeny during precipitation in Japan, Atmos. Environ., 41, 8043–8057, https://doi.org/10.1016/j.atmosenv.2007.06.046, 2007.
Jacob, D. J., Prather, M. J., Rasch, P. J., Shia, R.-L., Balkanski, Y. J., Beagley, S. R., Bergmann, D. J., Blackshear, W. T., Brown, M., Chiba, M., Chipperfield, M. P., de Grandpré, J., Dignon, J. E., Feichter, J., Genthon, C., Grose, W. L., Kasibhatla, P. S., Köhler, I., Kritz, M. A., Law, K., Penner, J. E., Ramonet, M., Reeves, C. E., Rotman, D. A., Stockwell, D. Z., Van Velthoven, P. F. J., Verver, G., Wild, O., Yang, H., and Zimmermann, P.: Evaluation and intercomparison of global atmospheric transport models using 222Rn and other short-lived tracers, J. Geophys. Res.-Atmos., 102, 5953–5970, https://doi.org/10.1029/96JD02955, 1997.
Karstens, U., Schwingshackl, C., Schmithüsen, D., and Levin, I.: A process-based 222radon flux map for Europe and its comparison to long-term observations, Atmos. Chem. Phys., 15, 12845–12865, https://doi.org/10.5194/acp-15-12845-2015, 2015.
Karstens, U., Levin, I., Ramonet, M., Gerbig, C., Arnold, S., Conil, S., Della Coletta, J., Frumau, A., Gheusi, F., Kazan, V., Kubistin, D., Lindauer, M., Lopez, M., Maurer, L., Mihalopoulos, N., Pichon, J.-M., and Spain, G.: Assessment of regional atmospheric transport model performance using 222Radon observations, in: Geophysical Research Abstracts, EGU General Assembly 2020, Vienna, Austria, https://doi.org/10.5194/egusphere-egu2020-10467, 2020.
Leadbetter, S. J., Hort, M. C., Jones, A. R., Webster, H. N., and Draxler, R. R.: Sensitivity of the modelled deposition of Caesium-137 from the Fukushima Dai-ichi nuclear power plant to the wet deposition parameterisation in NAME, J. Environ. Radioact., 139, 200–211, https://doi.org/10.1016/j.jenvrad.2014.03.018, 2015.
Lemaitre, P., Sow, M., Quérel, A., Dépée, A., Monier, M., Menard, T., and Flossmann, A.: Contribution of Phoretic and Electrostatic Effects to the Collection Efficiency of Submicron Aerosol Particles by Raindrops, Atmosphere, 11, 1028, https://doi.org/10.3390/atmos11101028, 2020.
López-Coto, I., Mas, J. L., and Bolivar, J. P.: A 40-year retrospective European radon flux inventory including climatological variability, Atmos. Environ., 73, 22–33, https://doi.org/10.1016/j.atmosenv.2013.02.043, 2013.
Louis, J.-F.: A parametric model of vertical eddy fluxes in the atmosphere, Bound.-Lay. Meteorol., 17, 187–202, https://doi.org/10.1007/BF00117978, 1979.
Mallet, V. and Sportisse, B.: 3-D chemistry-transport model Polair: numerical issues, validation and automatic-differentiation strategy, Atmos. Chem. Phys. Discuss., 4, 1371–1392, https://doi.org/10.5194/acpd-4-1371-2004, 2004.
Mallet, V., Pourchet, A., Quélo, D., and Sportisse, B.: Investigation of some numerical issues in a chemistry-transport model: Gas-phase simulations, J. Geophys. Res., 112, 1–16, https://doi.org/10.1029/2006JD008373, 2007.
Manohar, S. N., Meijer, H. A. J., and Herber, M. A.: Radon flux maps for the Netherlands and Europe using terrestrial gamma radiation derived from soil radionuclides, Atmos. Environ., 81, 399–412, https://doi.org/10.1016/j.atmosenv.2013.09.005, 2013.
Mathieu, A., Korsakissok, I., Quélo, D., Groëll, J., Tombette, M., Didier, D., Quentric, E., Saunier, O., Benoit, J.-P., and Isnard, O.: Fukushima Daiichi: Atmospheric Dispersion and Deposition of Radionuclides from the Fukushima Daiichi Nuclear Power Plant Accident, Elements, 8, 195–200, https://doi.org/10.2113/gselements.8.3.195, 2012.
Maurer, C., Baré, J., Kusmierczyk-Michulec, J., Crawford, A., Eslinger, P. W., Seibert, P., Orr, B., Philipp, A., Ross, O., Generoso, S., Achim, P., Schoeppner, M., Malo, A., Ringbom, A., Saunier, O., Quèlo, D., Mathieu, A., Kijima, Y., Stein, A., Chai, T., Ngan, F., Leadbetter, S. J., De Meutter, P., Delcloo, A., Britton, R., Davies, A., Glascoe, L. G., Lucas, D. D., Simpson, M. D., Vogt, P., Kalinowski, M., and Bowyer, T. W.: International challenge to model the long-range transport of radioxenon released from medical isotope production to six Comprehensive Nuclear-Test-Ban Treaty monitoring stations, J. Environ. Radioact., 192, 667–686, https://doi.org/10.1016/j.jenvrad.2018.01.030, 2018.
Melintescu, A., Chambers, S. D., Crawford, J., Williams, A. G., Zorila, B., and Galeriu, D.: Radon-222 related influence on ambient gamma dose, J. Environ. Radioact., 189, 67–78, https://doi.org/10.1016/j.jenvrad.2018.03.012, 2018.
Mercier, J.-F., Tracy, B. L., d'Amours, R., Chagnon, F., Hoffman, I., Korpach, E. P., Johnson, S., and Ungar, R. K.: Increased environmental gamma-ray dose rate during precipitation: a strong correlation with contributing air mass, J. Environ. Radioact., 100, 527–533, https://doi.org/10.1016/j.jenvrad.2009.03.002, 2009.
Météo France: Données publiques, https://donneespubliques.meteofrance.fr/, last access: 21 July 2022.
Paatero, J., Vira, J., Siitari-Kauppi, M., Hatakka, J., Holmén, K., and Viisanen, Y.: Airborne fission products in the high Arctic after the Fukushima nuclear accident, J. Environ. Radioact., 114, 41–47, https://doi.org/10.1016/j.jenvrad.2011.12.027, 2012.
Quélo, D., Krysta, M., Bocquet, M., Isnard, O., Minier, Y., and Sportisse, B.: Validation of the Polyphemus platform on the ETEX, Chernobyl and Algeciras cases, Atmos. Environ., 41, 5300–5315, https://doi.org/10.1016/j.atmosenv.2007.02.035, 2007.
Quérel, A., Monier, M., Flossmann, A. I., Lemaitre, P., and Porcheron, E.: The importance of new collection efficiency values including the effect of rear capture for the below-cloud scavenging of aerosol particles, Atmos. Res., 142, 57–66, https://doi.org/10.1016/j.atmosres.2013.06.008, 2014.
Quérel, A., Quélo, D., Roustan, Y., and Mathieu, A.: Sensitivity study to select the wet deposition scheme in an operational atmospheric transport model, J. Environ. Radioactiv., 237, 106712, https://doi.org/10.1016/j.jenvrad.2021.106712, 2021.
Rotach, M. W., Wohlfahrt, G., Hansel, A., Reif, M., Wagner, J., and Gohm, A.: The World is Not Flat: Implications for the Global Carbon Balance, B. Am. Meteorol. Soc., 95, 1021–1028, https://doi.org/10.1175/BAMS-D-13-00109.1, 2014.
Rotach, M. W., Gohm, A., Lang, M. N., Leukauf, D., Stiperski, I., and Wagner, J. S.: On the Vertical Exchange of Heat, Mass, and Momentum Over Complex, Mountainous Terrain, Front. Earth Sci., 3, 76, https://doi.org/10.3389/feart.2015.00076, 2015.
Röttger, A., Röttger, S., Grossi, C., Vargas, A., Curcoll, R., Otáhal, P., Hernández-Ceballos, M. Á., Cinelli, G., Chambers, S., Barbosa, S. A., Ioan, M.-R., Radulescu, I., Kikaj, D., Chung, E., Arnold, T., Yver-Kwok, C., Fuente, M., Mertes, F., and Morosh, V.: New metrology for radon at the environmental level, Meas. Sci. Technol., 32, 124008, https://doi.org/10.1088/1361-6501/ac298d, 2021.
Saito, K., Ishigure, N., Petoussi-Henss, N., and Schlattl, H.: Effective dose conversion coefficients for radionuclides exponentially distributed in the ground, Radiat. Environ. Biophys., 51, 411–423, https://doi.org/10.1007/s00411-012-0432-y, 2012.
Sato, Y., Sekiyama, T. T., Fang, S., Kajino, M., Quérel, A., Quélo, D., Kondo, H., Terada, H., Kadowaki, M., Takigawa, M., Morino, Y., Uchida, J., Goto, D., and Yamazawa, H.: A model intercomparison of atmospheric 137Cs concentrations from the Fukushima Daiichi Nuclear Power Plant accident, phase III: Simulation with an identical source term and meteorological field at 1-km resolution, Atmos. Environ. X, 7, 100086, https://doi.org/10.1016/j.aeaoa.2020.100086, 2020.
Saunier, O., Mathieu, A., Didier, D., Tombette, M., Quélo, D., Winiarek, V., and Bocquet, M.: An inverse modelling method to assess the source term of the Fukushima Nuclear Power Plant accident using gamma dose rate observations, Atmos. Chem. Phys., 13, 11403–11421, https://doi.org/10.5194/acp-13-11403-2013, 2013.
Szegvary, T.: European 222Rn flux map for atmospheric tracer applications, University of Basel, Basel, 87 pp., https://duw.unibas.ch/fileadmin/user_upload/duw/UGW/Research/Radon/Szegvary_2007.pdf (last access: 21 July 2022), 2007.
Téléray: Téléray – IRSN webpage, https://teleray.irsn.fr/, last access: 7 February 2022.
Tombette, M.: C3X: A software platform for assessing the consequences of an accidental release of radioactivity into the atmosphere, http://venus.iis.u-tokyo.ac.jp/english/workshop/Poster/3rd March/Damien Didier.pdf (last access: 21 July 2022), 2014.
Troen, I. and Mahrt, L.: A simple model of atmospheric boundary layer; sensitivity to surface evaporation, Bound.-Lay. Meteorol., 37, 129–148, 1986.
Vargas, A., Arnold, D., Adame, J. A., Grossi, C., Hernández-Ceballos, M. A., and Bolivar, J. P.: Analysis of the vertical radon structure at the Spanish “El Arenosillo” tower station, J. Environ. Radioact., 139, 1–17, https://doi.org/10.1016/j.jenvrad.2014.09.018, 2015.
Virtanen, P., Gommers, R., Oliphant, T. E., Haberland, M., Reddy, T., Cournapeau, D., Burovski, E., Peterson, P., Weckesser, W., Bright, J., van der Walt, S. J., Brett, M., Wilson, J., Millman, K. J., Mayorov, N., Nelson, A. R. J., Jones, E., Kern, R., Larson, E., Carey, C. J., Polat, İ, Feng, Y., Moore, E. W., VanderPlas, J., Laxalde, D., Perktold, J., Cimrman, R., Henriksen, I., Quintero, E. A., Harris, C. R., Archibald, A. M., Ribeiro, A. H., Pedregosa, F., van Mulbregt, P., and SciPy 1.0 Contributors: SciPy 1.0: Fundamental Algorithms for Scientific Computing in Python, Nat. Meth., 17, 261–272, https://doi.org/10.1038/s41592-019-0686-2, 2020.
Wang, D., Wang, X., Liu, L., Wang, D., Huang, H., and Pan, C.: Evaluation of CMPA precipitation estimate in the evolution of typhoon-related storm rainfall in Guangdong, China, J. Hydroinform., 18, 1055–1068, https://doi.org/10.2166/hydro.2016.241, 2016.
Zahorowski, W., Chambers, S. D., and Henderson-Sellers, A.: Ground based radon-222 observations and their application to atmospheric studies, J. Environ. Radioactiv., 76, 3–33, https://doi.org/10.1016/j.jenvrad.2004.03.033, 2004.
Zhang, B., Liu, H., Crawford, J. H., Chen, G., Fairlie, T. D., Chambers, S., Kang, C.-H., Williams, A. G., Zhang, K., Considine, D. B., Sulprizio, M. P., and Yantosca, R. M.: Simulation of radon-222 with the GEOS-Chem global model: emissions, seasonality, and convective transport, Atmos. Chem. Phys., 21, 1861–1887, https://doi.org/10.5194/acp-21-1861-2021, 2021.