 | 08 Sep 2021
Modeling public charging infrastructure considering points of interest and parking potentials
Philip Gauglitz
David Geiger
Jan Ulffers
Evamaria Zauner
Considering climate change, it is essential to reduce CO2 emissions. The provision of charging infrastructure in public spaces for electromobility – along with the substitution of conventional power generation by renewable energies – can contribute to the energy transition in the transport sector. Scenarios for the spatial distribution of this charging infrastructure can help to exemplify the need for charging points and their impact, for example on power grids.
We model two kinds of demand for public charging infrastructure. First, we model the demand for public charging points to compensate for the lack of home charging points, which is derived from a previously developed and published model addressing electric-vehicle ownership (with and without home charging options) in households. Second, and in the focus of the work presented here, is the demand for public charging infrastructure at points of interest (POIs). Their locations are derived from OpenStreetMap (OSM) data and weighted based on an evaluation of movement profiles from the Mobilität in Deutschland survey (MiD, German for “Mobility in Germany”). We combine those two demands with the available parking spaces and generate distributions for possible future charging points. We use a raster-based approach in which all vector data are rasterized and computations are performed on a municipality's full grid. The presented application area is Wiesbaden, and the methodology is generally applicable to municipalities in Germany.
The model is compared with three other models or model variants in a correlation comparison in order to determine the influence of certain model assumptions and input data. The identification of potential charging points in public spaces plays an important role in modeling the future energy system – especially the power grid – as the rapid adoption of electric vehicles will shift locations of electrical demand. With our investigation, we would like to present a new method to simulate future public charging point locations and show the influences of different modeling methods.
- Article
(2932 KB) - Full-text XML
- BibTeX
- EndNote


The dynamic transition to electric vehicles offers the opportunity for significant CO2 reduction but also presents challenges due to the need for charging infrastructure to be integrated into the electric grid (Gauglitz et al., 2020).
In order to make the coming challenges for energy system technology in general and power grids in particular visible and manageable, numerous models and studies exist to map scenarios of future charging infrastructure. As mentioned in Gauglitz et al. (2020), studies range from higher-level distributions using simple allocation variables such as population or vehicle density (Braun et al., 2018; Vopava et al., 2017; 50Hertz Transmission GmbH, Amprion gmbH, Tennet TSO GmbH, TransnetBW GmbH, 2018) to specific studies of individual application areas considering detailed local conditions such as the American state roads (Xu and Meng, 2020) or individual cities like Hamburg (Rothfuchs et al., 2018). A comprehensive overview, analysis and categorization of spatial localization methodologies for charging infrastructere is provided by Pagany et al. (2019b). A connection to traditional vehicle fleets and driving profiles is established in Bundesministerium für Verkehr und digitale Infrastruktur (2021). The use of possible destinations from OSM and a derivation of demand density is presented by Pagany et al. (2019a).
In this respect, our approach is similar, with the addition of the following aspects: The integrative model takes into account both home charging points and public charging infrastructure and their interconnection, as well as a detailed identification of parking spaces as potential installation areas for charging infrastructure. In order to match demands and potentials, we developed a scoring system based on raster calculations. Our approach attempts to combine a generally applicable methodology in the area of Germany and a detailed, site-specific modeling of possible future charging points. To our knowledge, the combination of these features is not found in any existing literature. With respect to the categories mentioned in the above review (Pagany et al., 2019b), our approach is thus user and destination orientated and provides a demand density as an intermediate step for a localization of charging stations. While a previous publication (Gauglitz et al., 2020) addresses the modeling of home charging sites, the one at hand focuses on public charging sites. The modeling is intended to achieve the best possible coverage of the charging demand with a defined number of charging stations and so that as many (destination or starting) locations as possible are within walking distance. This is done via the intermediate step of modeling the spatial suitability for charging points. However, the validation of the charging demand is not trivial, and due to the lack of a fixed comparison value, the following research question shall be answered:
What is the impact of a detailed consideration of vehicles without a home charging option, and what role do different methodologies generally play in determining the spatial suitability of charging points?
The paper comprises a description of the methodology (Sect. 2) and the results (Sect. 3), each of which is divided into subsections on the input data (Sects. 2.1 and 3.1), the scoring (Sects. 2.2 and 3.2), the rasterization (Sects. 2.3 and 3.3) and a model comparison (Sects. 2.4 and 3.4). The paper closes with the discussion and conclusion (Sect. 4).
This section presents the methodology we have developed, starting with the selection and preparation of input data (Sect. 2.1), followed by the quantified scoring of demands for public charging points (Sect. 2.2) and the raster calculations (Sect. 2.3) and finally leading up to the methodology of a model comparison (Sect. 2.4). The section is followed by the presentation of the results in Sect. 3.
2.1 Methodology: Input data preparation
In order to create scenario locations for the public charging of e-vehicles, data are needed that represent both the potentials and the demand for charging points. Potentials arise from parking spaces of different types. The demand can arise from two driving forces: on the one hand, by e-vehicles without home charging possibility and, on the other hand, by driving destinations, which we refer to as POIs. For the input data, wide availability (at least within Germany) and high spatial resolution are desirable.
For both the demand data by POI and the potentials, OSM thus appears to meet both requirements well, verifiably and free of charge. We assume that the the POI data are appropriate for a future scenario, at least in the medium term. In order to investigate which of the POIs mapped by OSM could be relevant for the evaluation of charging demand, the approach frequency of POIs is examined. For this, we use the categorization from the broad survey of mobility behavior in Germany MiD, including the evaluation of more than 127 000 trips categorized specifically into shopping, errands and leisure (Nobis and Kuhnimhof, 2018). We filter the trips by the size of the city (according to the application area) and trips by car (as driver or passenger). For the selection of POIs, the most important categories of the MiD survey are used until at least 80 % of the paths are covered by these categories, and OSM objects are assigned to these. Corresponding to this, the different possible types of parking spaces are searched and saved for the integration of parking space potentials in OSM, resulting in different object types (points, lines, areas). The target formats for further processing are points for POIs and areas for parking potentials, so the following conversions are performed:
-
Two-dimensional POIs are reduced to a point object by means of the centroid.
-
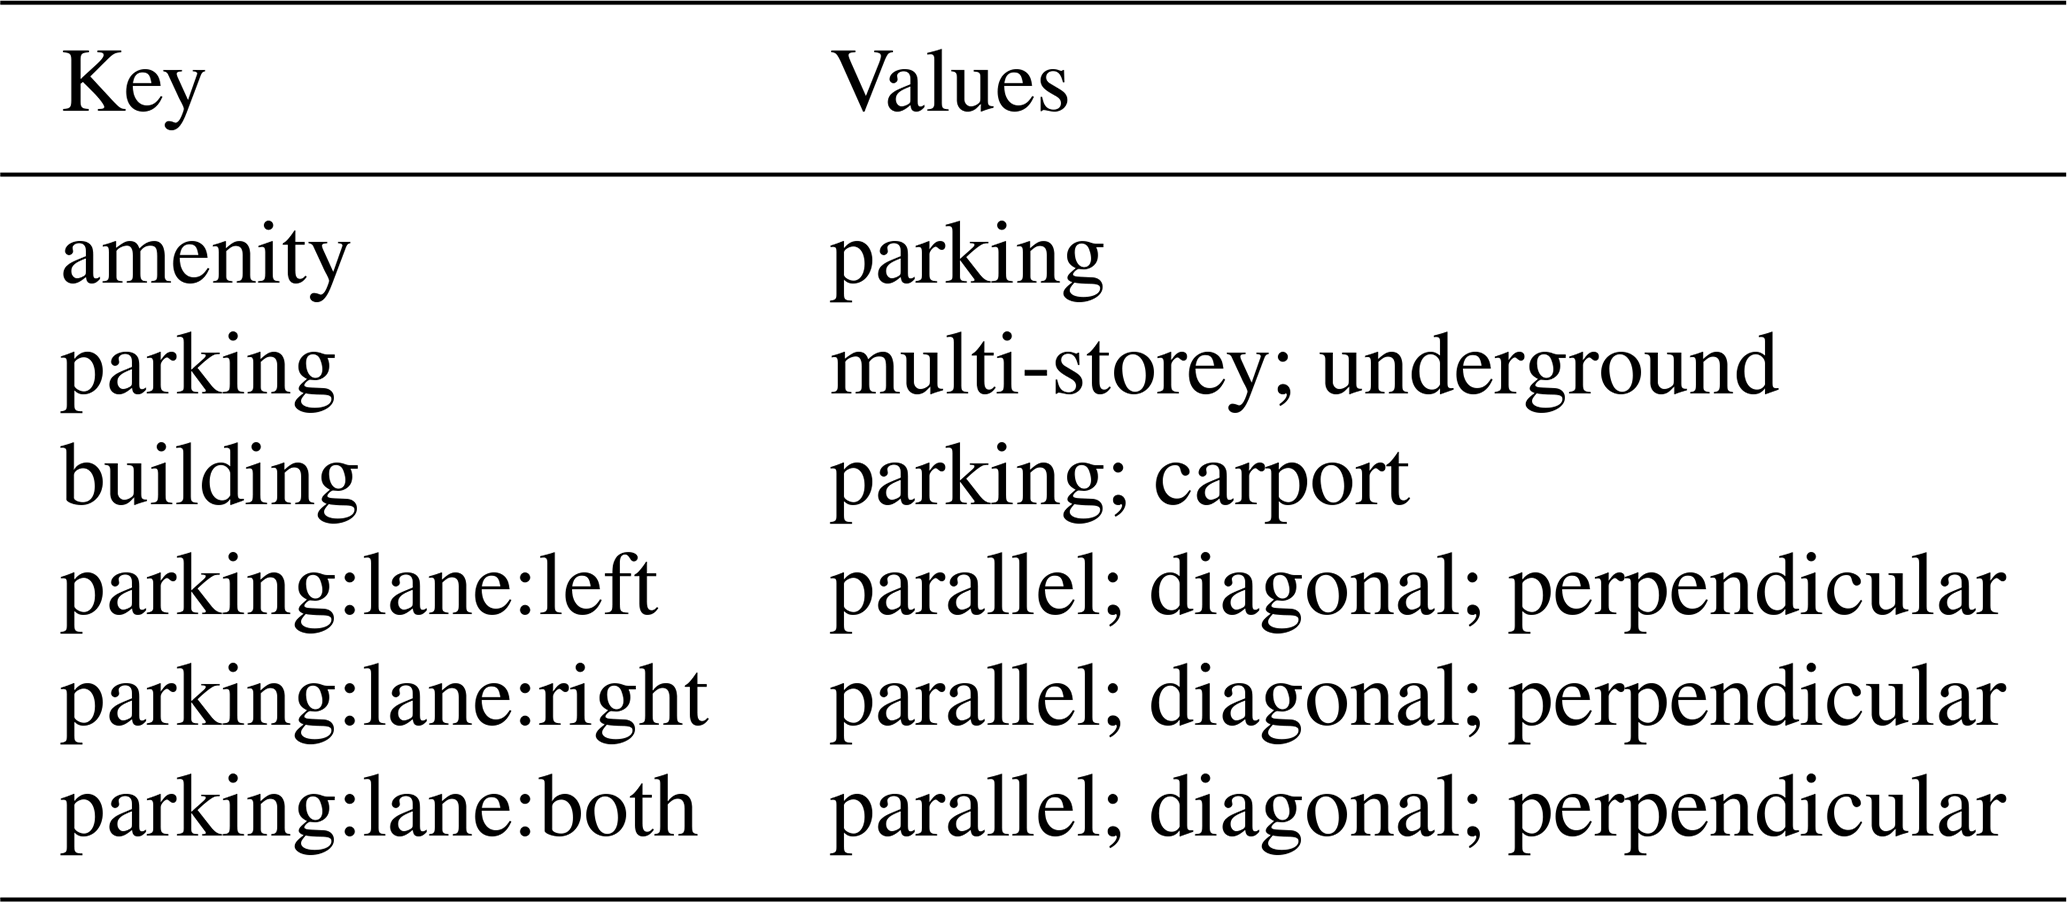
Parking spaces are converted into areas: point-type parking spaces are converted into a circle based on their number of parking spaces (OSM key “capacity”), the area of which corresponds to the capacity size. Linear parking spaces (along the street) receive a buffer according to their parking space potential (e.g. parking bays in transverse orientation to the street provide more parking space than those in longitudinal orientation), as described in the following.
To determine the buffer, the following equations are set up, starting with Eq. (1) for the length that a parking space occupies, depending on the parking orientation, which is given as value in OSM (compare Appendix A, Table A2):
where la is the parking slot length, lb is the parking slot width and lper parking slot is the length of street that one parking slot needs. One can use two terms to determine the number of parking spaces, and , where wbuffer is the buffer width, lstreet is the length of the street in total, aeff is the assumed proportion of the length of the street available for parking space (assumend with 0.3) and asides is a factor determining whether parking is possible on both sides (given by the OSM key, compare Appendix A, Table A2, with asides=1 for parking on the left or right side and asides=2 for parking on both sides). From these two terms, one can derive the following Eq. (2) for buffer width:
To determine the need for public charging infrastructure due to a lack of home charging options, existing actual data are not helpful, as we are concerned with mapping electric vehicles in a future scenario. We resort to an existing model that is characterized by the inclusion of socioeconomic data, the modeling of demographic change and a weighted random distribution of e-vehicle ownership based on a utility analysis at the household level, which is described in detail in Gauglitz et al. (2020). A possible simplification of the input data for e-vehicles without home charging options based on apartment buildings is discussed in Sect. 2. The data are merged in a PostGIS database, object-based and georeferenced. All input data are generally available for applications throughout Germany, although uniform data quality cannot be assumed for user-generated data such as OSM.
In summary, input data from the MiD survey (for the selection of POIs and the evaluation of their importance), from OSM (for the locations of POIs and parking spaces), and from model data from a previous model (for e-vehicle ownership) are used and processed.
2.2 Methodology: Scoring
In order to quantify the demand for charging infrastructure, we use a top-down methodology considering frequencies of arrival at POI categories. For this purpose, the demand mentioned in Sect. 2.1 is assigned a scoring. The relevant factor is the relative comparison of the weightings among each other. For traceability, the sum of all weighting points was chosen to correspond to the number of charging points. Scoring is thus a unitless variable. However, the sum over the scoring remains the same in the course, so that a scoring of 1 in each step represents the demand for a loading station. Or, for example, 10 parking spaces with a scoring of 0.1 in total represents the demand for one charging point.
The total number of charging points is considered a predefined target value in the context of this paper. In the project Ladeinfrastruktur 2.0 (LI2.0, Charging Infrastructure 2.0), it is determined on the basis of regionalization at the community level (Gauglitz et al., 2020) and validated in the project on the basis of local experience (Gauglitz, 2020).
The total size of the scores is distributed to individual objects using a top-down procedure. In this case, a fixed total score is divided into individual objects, which can later be divided into parking spaces. The (unitless) size and meaning of this scoring remains the same. First, the total scoring is divided into the two groups POI and vehicle without home charging. The number of vehicles without home charging first determines the share that is allocated to a certain area, while the remainder is allocated to the POI scoring. When scoring vehicles, each vehicle is considered equally. The scoring for the POI is carried out in two steps. In the first step, we use categories for path types in the MiD survey that differentiate different destinations (e.g. everyday necessities or sports). The frequency of arrival at the different MiD categories allows the scoring of the MiD category as a whole. This assumption seems plausible since the number of trips (filtered as described in Sect. 2.1) provides a clear reference to possible charging opportunities. In the second step, the category score is transferred to an individual POI. A size-dependent weighting is taken into account, where every POI is given one of three size classes, in order to distinguish, for example, a large hospital from a single doctor's practice. The differentiation into exactly three size classes is arbitrary and is justified by pragmatism. An allocation is performed for each MiD category according to the following Eq. (3):
Where j is the size class, i is the considered size class, h is the highest size class, si is the scoring of one POI (depending on category and size class), sges is the scoring of the category in total, ni is the number of POI objects in one category and fi is a factor for the weighting per size class (determined by estimation and documented in Sect. 3.2).
2.3 Methodology: Raster calculation
This section presents a series of raster calculations to provide, first, a scenario with charging point distributions (e.g. for the power grid calculation) and, second, a map with suitability ratings that allows for comparisons with other models.
In the first step, the drivers (POIs and vehicles) and potentials, which are initially object-based in the methodology described in Sect. 2.2, are rasterized and the evaluations of the drivers carried over. The parking lots are rasterized, resulting in a true/false map. The input data and this first step are shown schematically in Fig. 1a and b. The raster pixels are shown enlarged in the schematic representation. In the calculation, the area of one raster pixel corresponds to one parking slot with 15 m2 (resulting in a raster pixel length of 3.873 m) – compare specifications with Forschungsgesellschaft für Straßen- und Verkehrswesen e.V. (2005). This allows for a simple boolean storage for the later allocation of parking spaces.

In the next step, the sum of the surrounding parking spaces is determined for each pixel with a demand score (see Fig. 1c), using a kernel raster calculation with a radius of 300 m, following common bus stop spacings that seem plausible for vehicle accessibility (Christian Scheler, personal communication, 2021; Moos, 2021). In contrast to the schematic representation with a few pixels for the circumcircle, the radius in the actual calculation method thus corresponds to 300 m/3.873 m ≈ 77. In the next step (see Fig. 1d), the scoring of the demand pixels per surrounding parking slot is derived from the division of the previous matrices. After that, the sum of the surrounding (divided) scorings is formed for each parking space pixel (Fig. 1e). The splitting of the scoring ensures that in the end again an equal scoring is mapped in the vicinity of the charging demands, and represents the optimal distribution. In contrast, a pure summation would ensure that more parking areas would automatically lead to more total points in a region and an over-representative mapping of demand. This is followed by a weighted random draw to generate a possible distribution of charging points (which can only be full number). Figure 1f shows schematically a possible random spatial distribution of three charging points (pixels with “1”). Zeros marked in white are pixels that cannot be drawn because they lack evaluation, while zeros marked in black are pixels that could have been drawn in principle. In this example, there is a shortfall of 0.6 for the parking areas on the upper right (demand of compared to 1 charging station). In a different random distribution, there could also be two charging points, which would result in a shortfall of 0.4 for the parking area at the bottom left. To summarize the methodology, using Fig. 1: Various loading requirements are quantified, including the high loading requirement with a score of 2.1. In this example (with reduced radius), there are exactly three parking spaces within its radius. Accordingly, all three parking spaces also receive a high score (0.7; 0.8; 0.9) and thus a high probability of being assigned a charging point.In contrast to the methodology for the power grid calculation, no detailed charging point distribution is determined for the model comparison. In order to map a quantity that can be compared with other models, only the scoring of the demand is determined (see Fig. 1b) and distributed according to a radius (again 300 m), thus generating a heat map that shows the rating of the areas in a municipality from the demand's point of view (without mapping the parking space potentials).
2.4 Methodology: Model comparison
In order to investigate the influence of the methodology on a consideration of charging point suitability in space, a model comparison is carried out. A total of four different models are compared with each other by examining the correlation of the spatial suitability for charging points. In the following, we first summarize the four models to then explain the methodology of the correlation comparison.
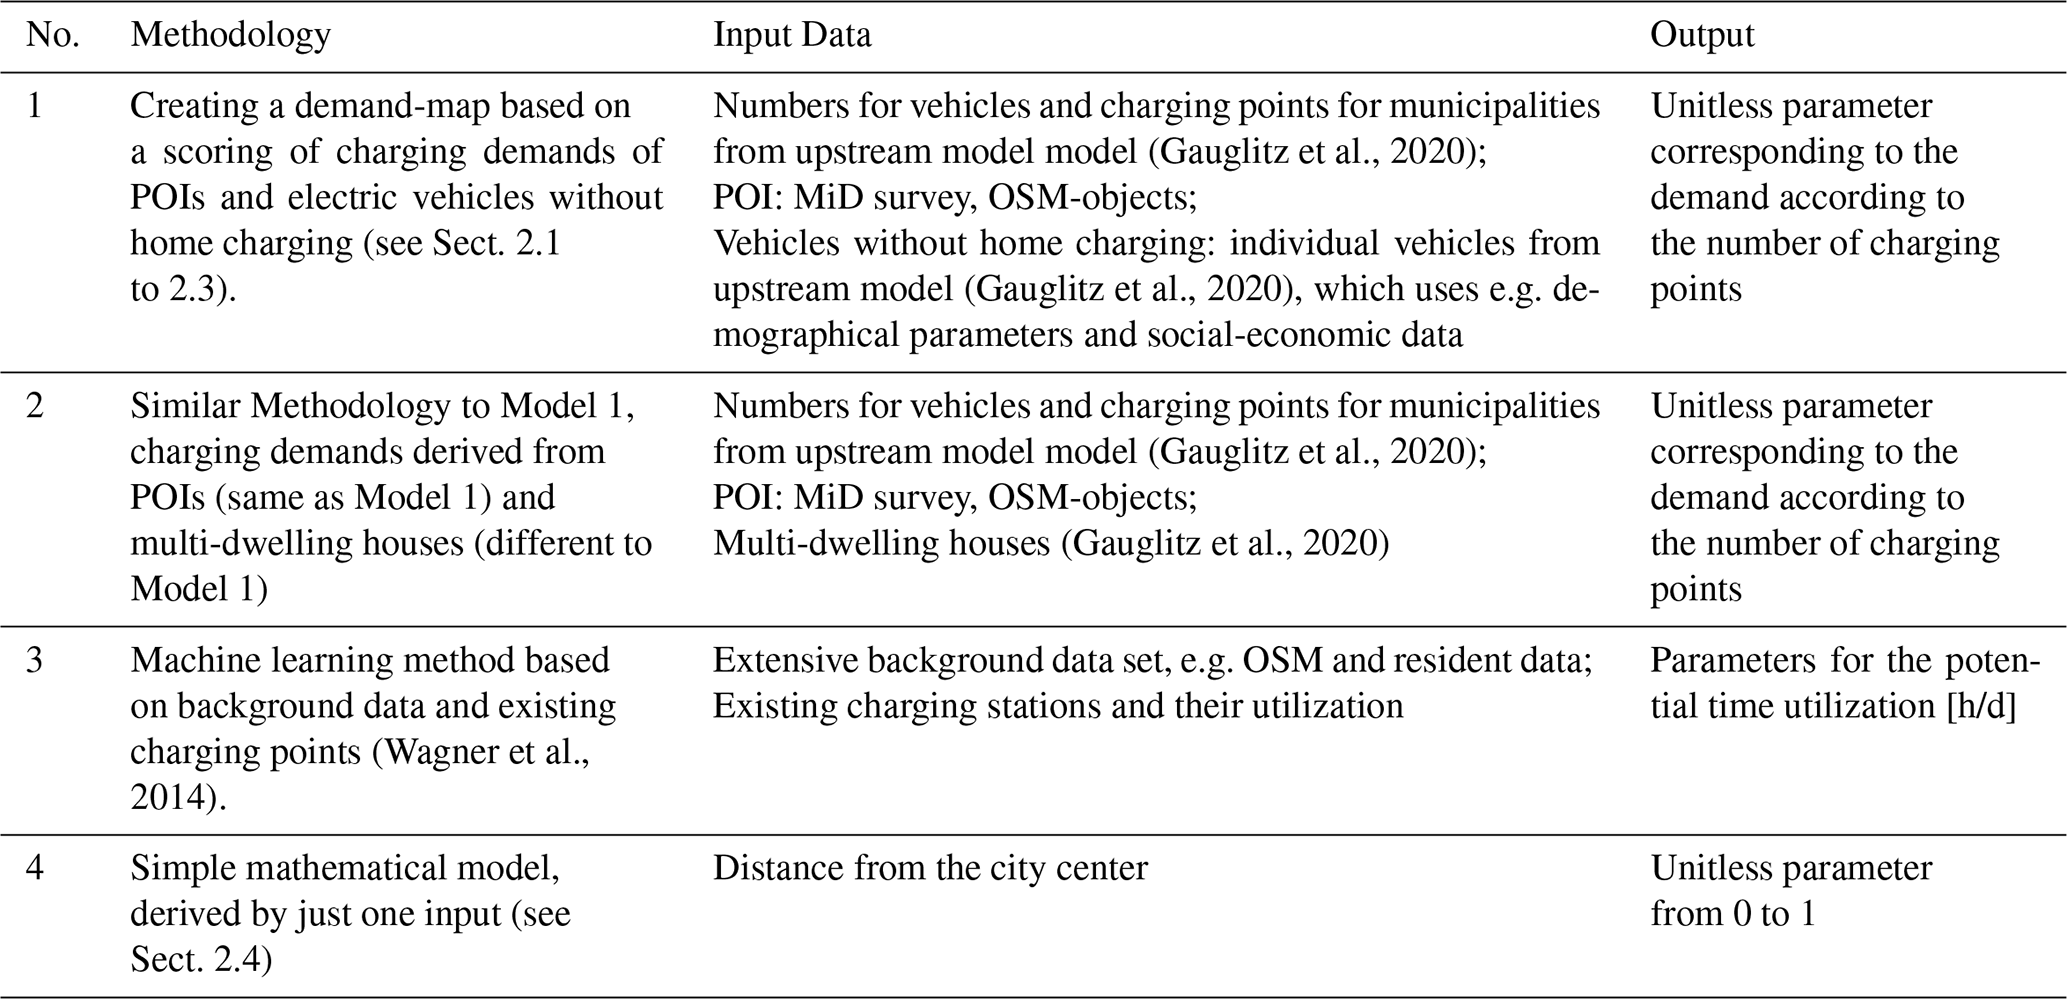
The first model is the model we developed and whose methodology is described in Sect. 2.1 to 2.3. The model provides a heat map with a quantified demand for charging points, which is derived from POIs and vehicles without home charging options. The second model is a sensitivity variant of the first model in which a simplified input data set is used to decouple the model from the vehicle model (see Sect. 2.1). Instead of a point distribution of vehicles without home charging points, the corresponding scoring is (equally) distributed to households in apartment buildings. By comparing models 1 and 2, the level of influence of model coupling and the dependence of certain input data on the results can be quantified. The third model is based on a different methodology using machine learning methods, which connect empirical utilization data from 6000 existing charging points in Germany to POI and spatial census data. The algorithm determines influential surrounding factors and evaluates their impact to calculate the relative utilization of a possible charging point in other areas. The methodology is described in Wagner et al. (2014). This means that, here, the physical equivalent is different than in models 1 and 2 (scoring vs. potential utilization), but it can be reconciled via a correlation comparison, as both fundamentally represent the suitability of the location for public charging infrastructure. We selected the model for two reasons. First, it uses similar source datasets, but a different methodology. Second, it provides a direct link to the view of the German Distribution System Operators (developed by a subsidiary of Thüga Aktiengesellschaft), and is thus an important comparative model from the stakeholder perspective. By comparing model 3 to models 1 and 2, it is possible to examine and quantify what distinction is made by a fundamentally different modeling methodology. As a fourth model, a trivial evaluation is used where a shorter distance to the city center results in a higher score. The data set is to be understood as a test data set by which the level of correlation between the other models can be made clear. A summary overview of the most important aspects of the models is shown in Table 1.
To establish a correlation comparison, the model data are evaluated at 1000 random spatial points and put into a correlation matrix, where each of the four models is compared to the others.
The example used for application is the German city of Wiesbaden. Due to the availability of data for the whole of Germany and the generally applicable methodology, results can generally be generated for all municipalities in Germany, compare Sect. 2.1.
3.1 Results: Input data preparation
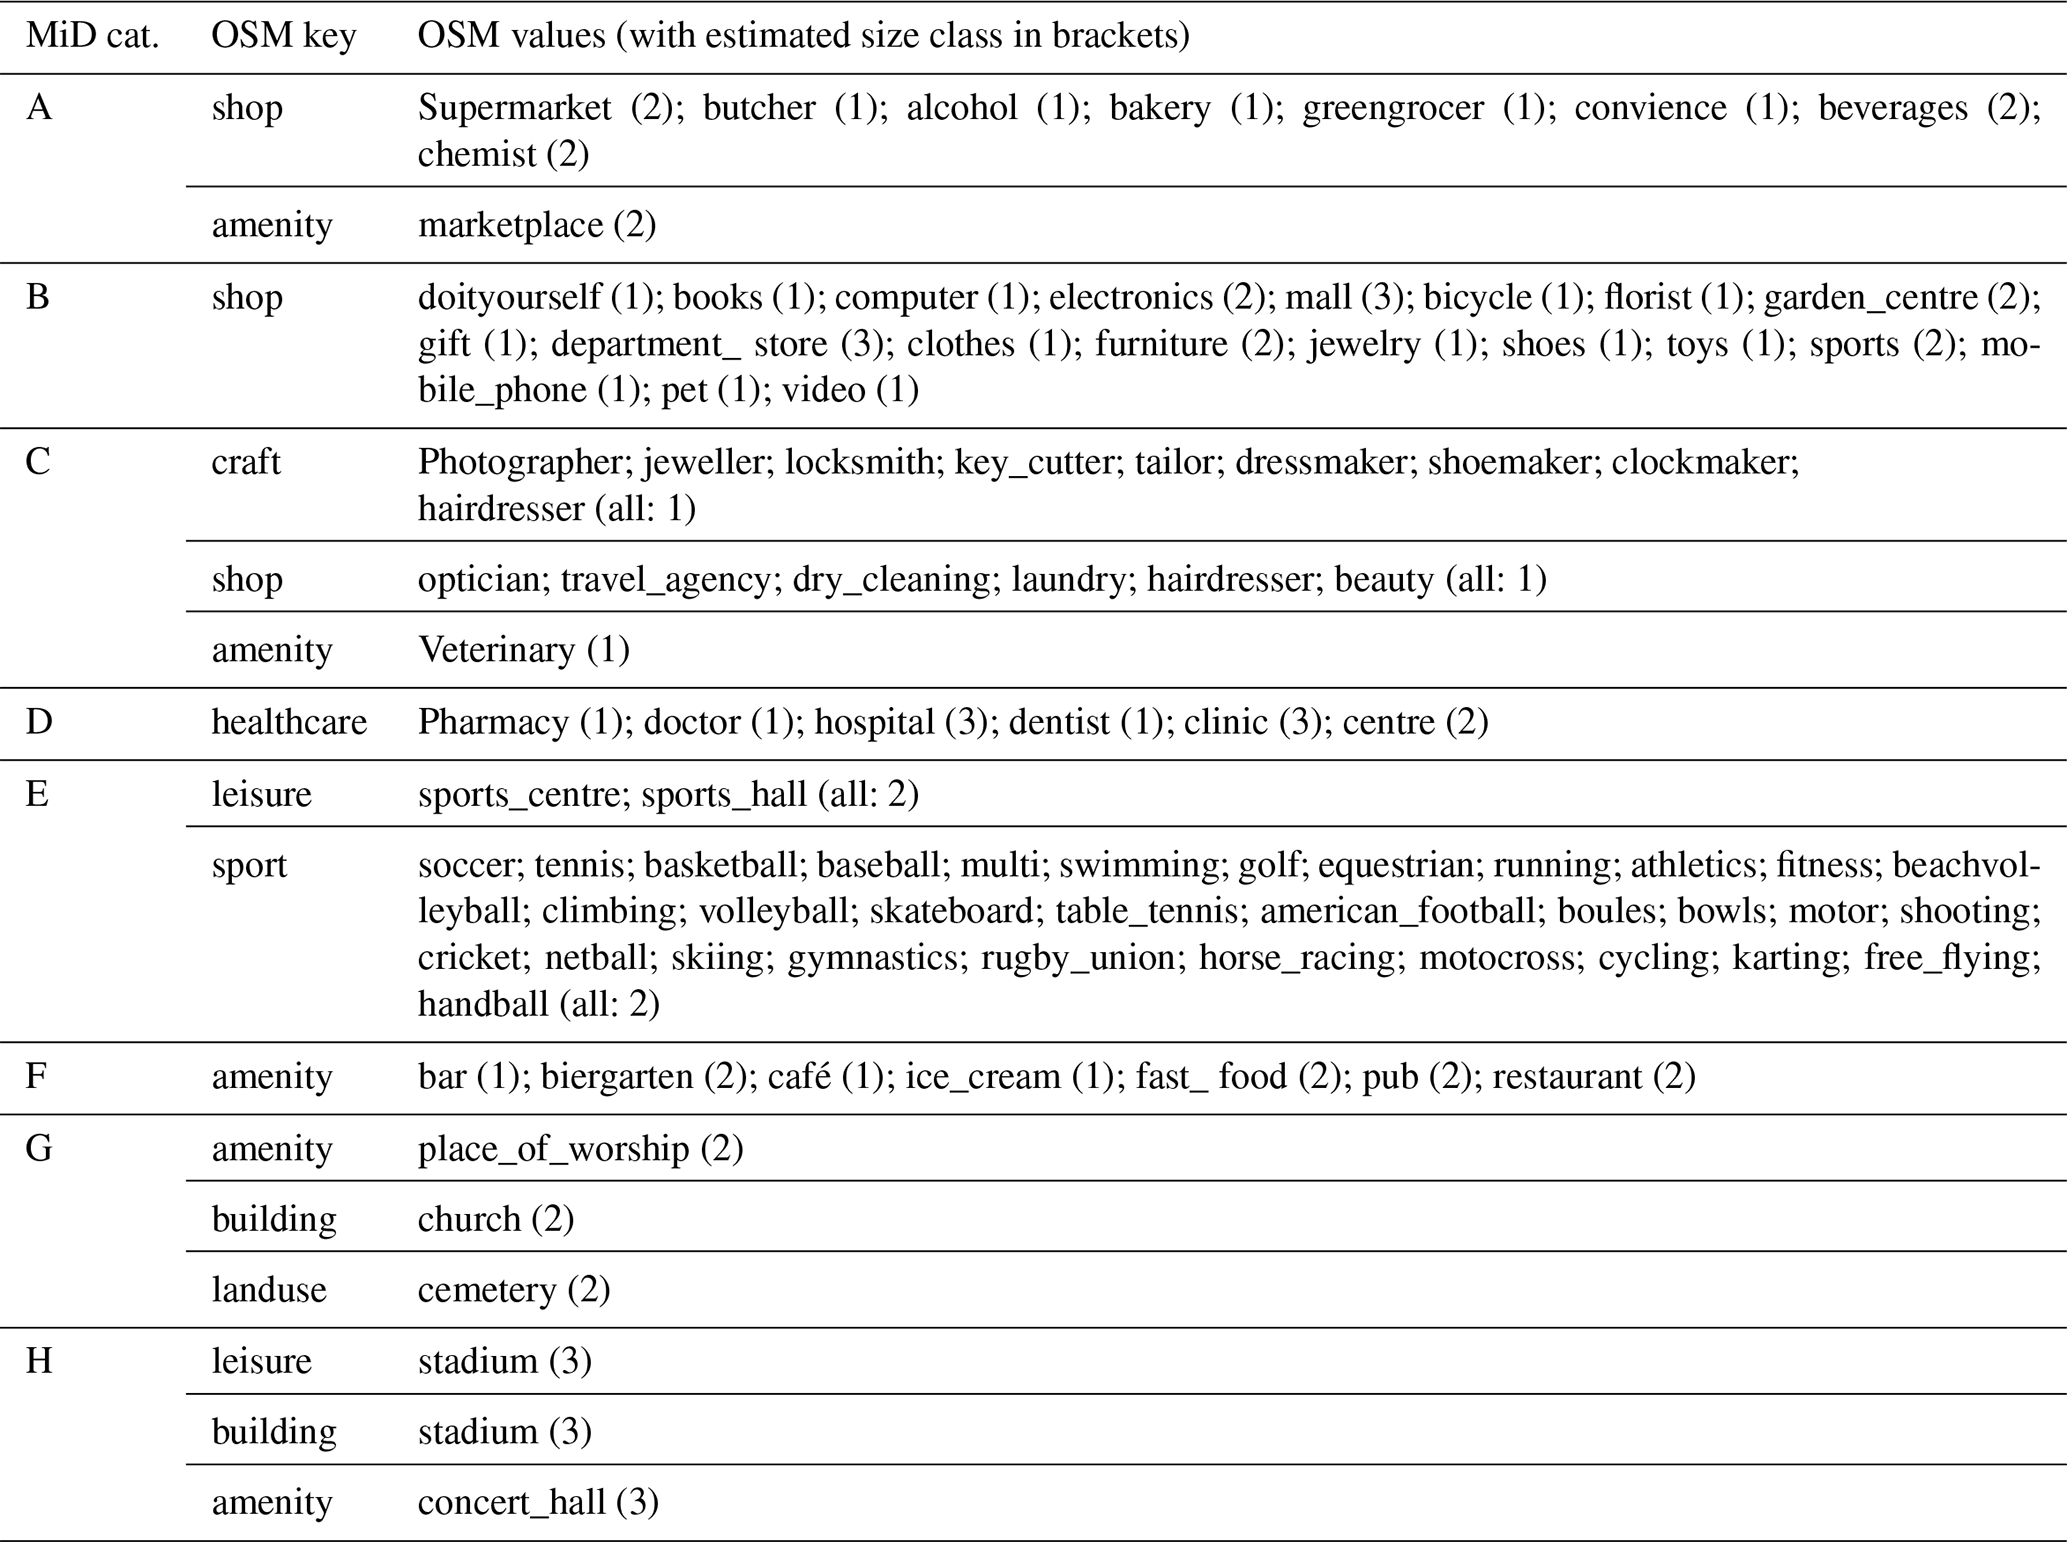
The methodology described in Sect. 2.1 is used to map both the demand and potential for public charging. The results of data selection and preparation are presented here. An evaluation of the MiD categories shows the frequency of visits to POIs by categories. All shopping, errand and leisure trips in the MiD survey, divided into 31 categories, add up to a total of 246 226 trips. Of these, 84 788 trips are made by car (driver or passenger) in large cities. 82 % of these trips are covered by the top 14 categories shown in Table 2. For most of them (11 out of 14, and still about 65 % of the trips), suitable key/value pairs can be found in OSM.
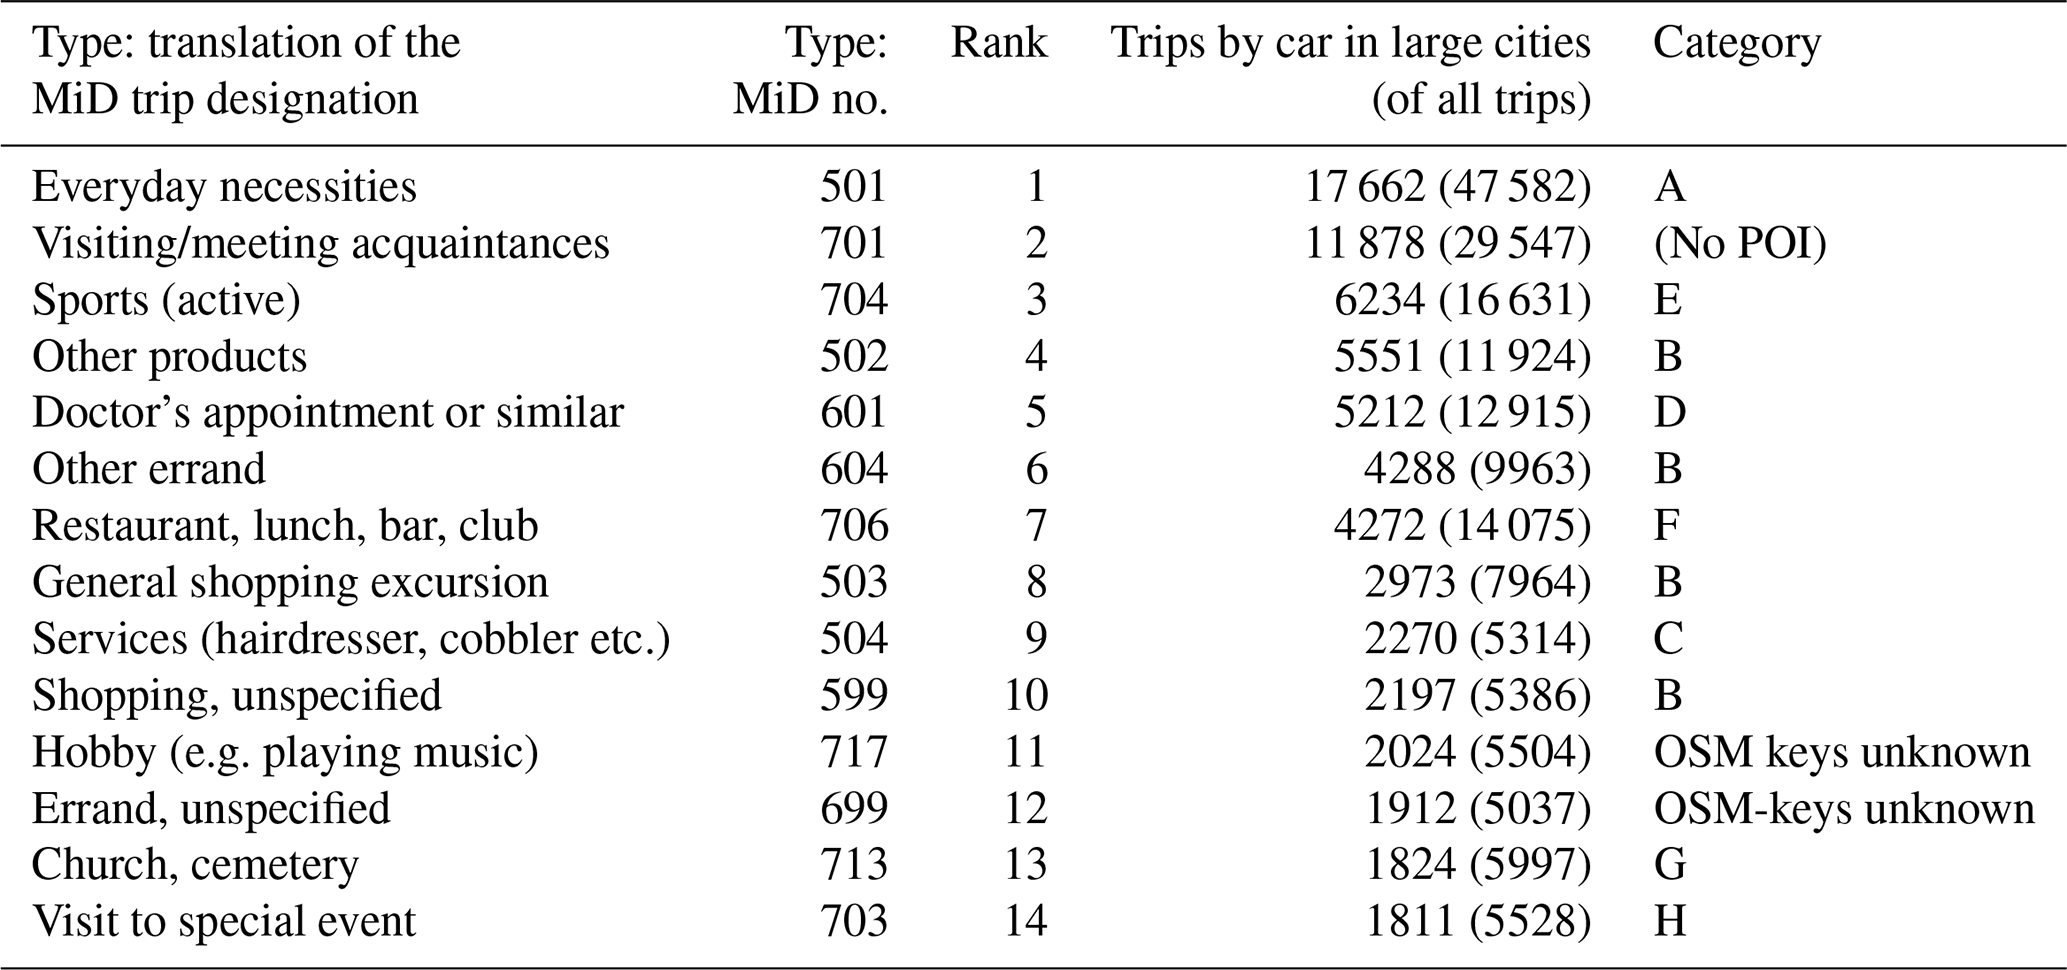
A list of all OSM keys and values used is found in Appendix A, Table A1. The objects were assigned a size class from 1 to 3 according to the authors' estimation. In addition to the POIs from OSM, the vehicles without home charging capability represent another type of demand. The data are taken from the model described in Gauglitz et al. (2020) and are available as point distributions. In summary, the following data are available now: Point-type POIs with assignment of a MiD category and area-type parking lots (see Appendix A, Table A2).
3.2 Results: Scoring
The methodology described in Sect. 2.2 yields a scoring that is dependent on the type of demand (replacement of a missing home charging facility or POI) and, in the case of POIs, dependent on the MiD category and size class. Each of the size classes gets a factor, which needs to be assumed to differentiate different charging demands of POI. Assuming three size classes and the size class factors , and , the values shown in Table 3 result.
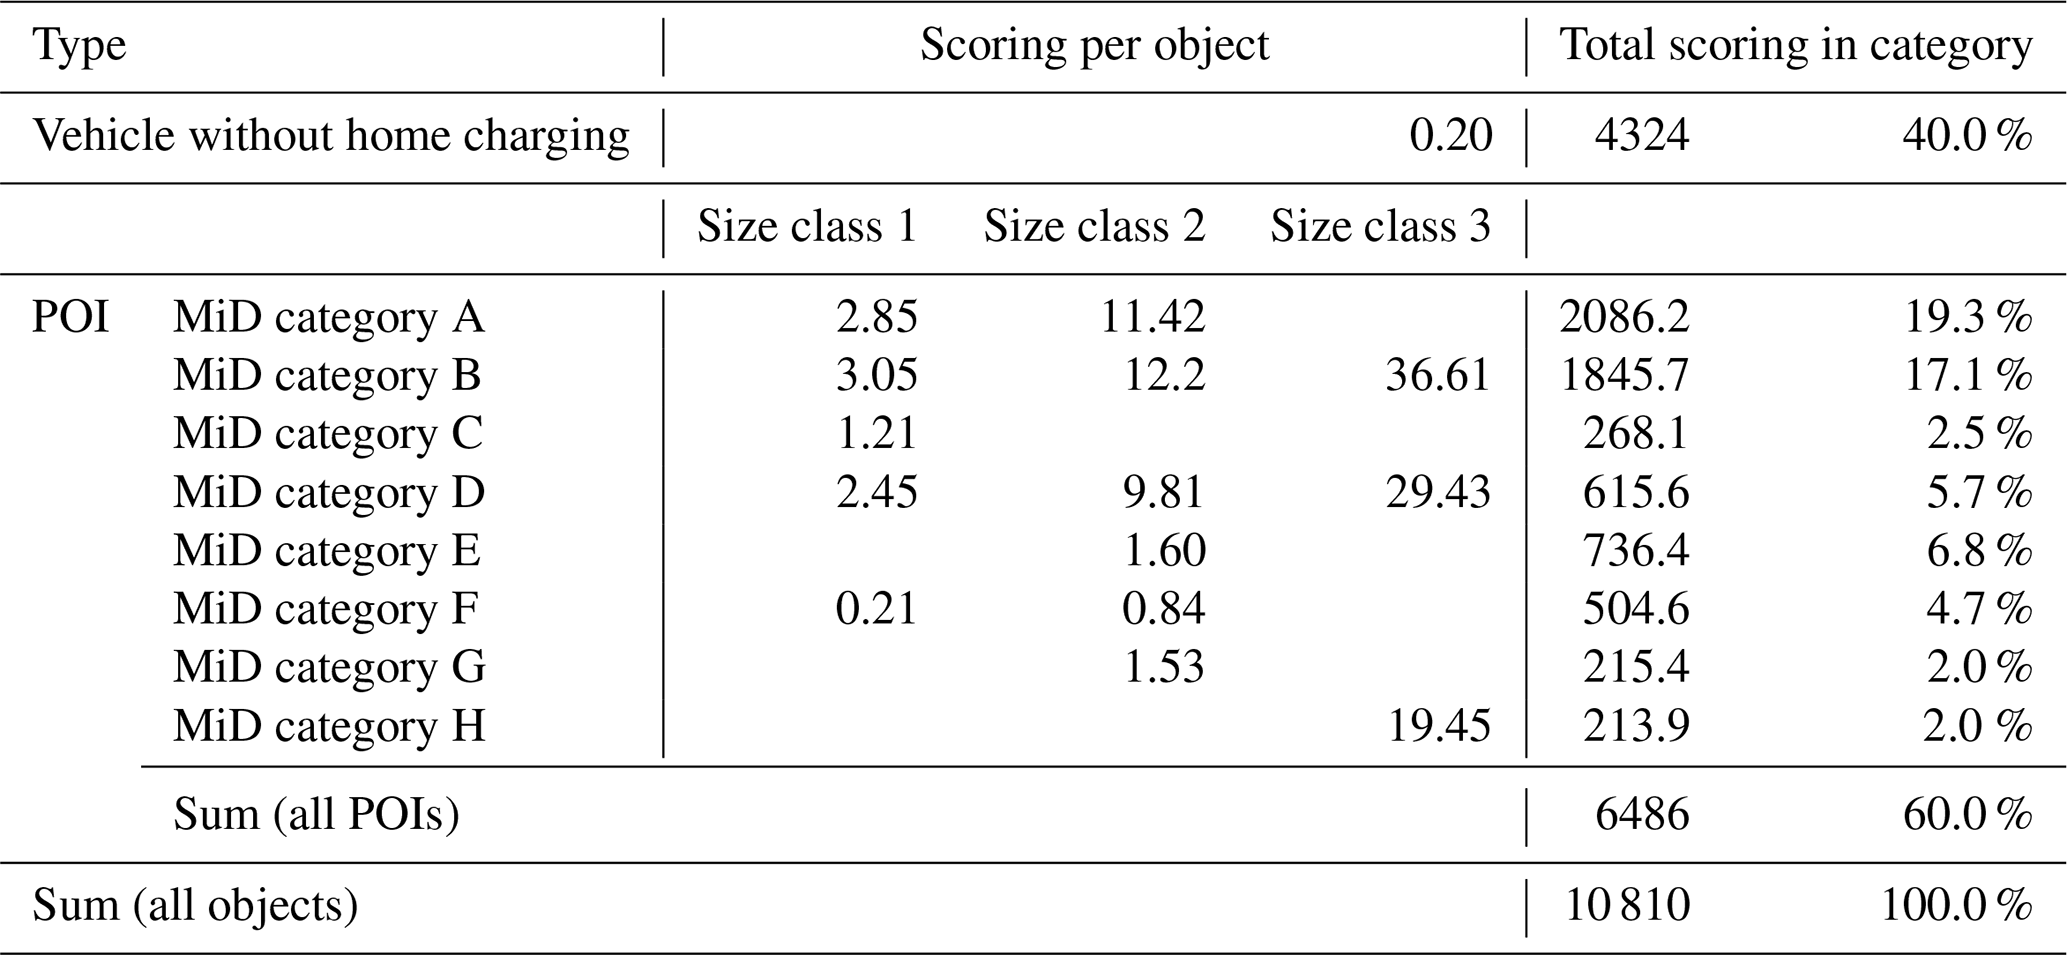
The following example is given for the interpretation of the Table 3: The MiD category of Doctor's appointment or similar (category D) gets in total 5.7 % (615.6) of all scoring points (10 810) in Wiesbaden. These are divided into individual POIs, taking into account the size class. So a doctor's office (size class 1) gets a scoring of 2.45 and a hospital (size class 3) gets a scoring of 29.43. Together with the results from 3.1, georeferenced scores are obtained.
3.3 Results: Raster calculation
The rasterized demands (formerly point-type) and parking potentials (formerly area-type) result in two layers of a raster map as shown in Fig. 2a. They correspond to the schematic representation in Fig. 1b from Sect. 2.3. It should be noted that there are 50 variants for the demand according to the vehicle distributions, which differ in certain details. The methodology described in Sect. 2.3 (see Fig. 1c to e) provides an allocation of the points to the parking areas and a 50 distributions of charging points (Fig. 2b).

Figure 2Raster calculation: Inputs (a) and outputs (b).
The calculations for model comparison are similar, with fewer intermediate steps: the parking areas are not taken into account, but the scoring of the demands is assigned uniformly to a radius of 300 m.
In summary, the result is, first, a scenario with 50 different spatial distributions of public charging points, which, for example, can be used for the grid calculation. The second result is a map for a model comparison with a quantified evaluation of the area, which is independent of the parking potential for the purpose of the model comparison.
As can be seen in Fig. 2b, the increased density of charging points (gray circles) per parking space is seen for areas with higher scoring. The model results thus offer the possibility of incorporating the high-resolution data into detailed grid calculations including probabilistic methods, compare Gauglitz et al. (2020), thus providing the basis for mapping possible boundary violations in the distribution system at an early stage. The more general result of suitability via a demand map offers the possibility of model comparisons and model validation.
3.4 Results: Model comparison
According to the methodology in Sect. 2.4, the quantified suitabilities of two models can be compared. Figure 3 shows the evaluation of 1000 random points for all possible locations in Wiesbaden as a comparison between models 1 and 2 (the model presented here and the simplified model variant, see Fig. 3a) and models 1 and 3 (the model presented here and the model using machine learning methods, see Fig. 3b).


Models 1 and 2 show a strong match. Models 1 and 3 show a relatively weak match. The correlations between all models are shown in Table 4, including the simple model 4, where a shorter distance to the city center results in a higher score.
Although, in the cartographic representation, similar areas seem to yield weaker and stronger suitability (cf. Fig. 4). Thus, the exact input data set appears to be rather subordinate in contrast to the applied model methodology.
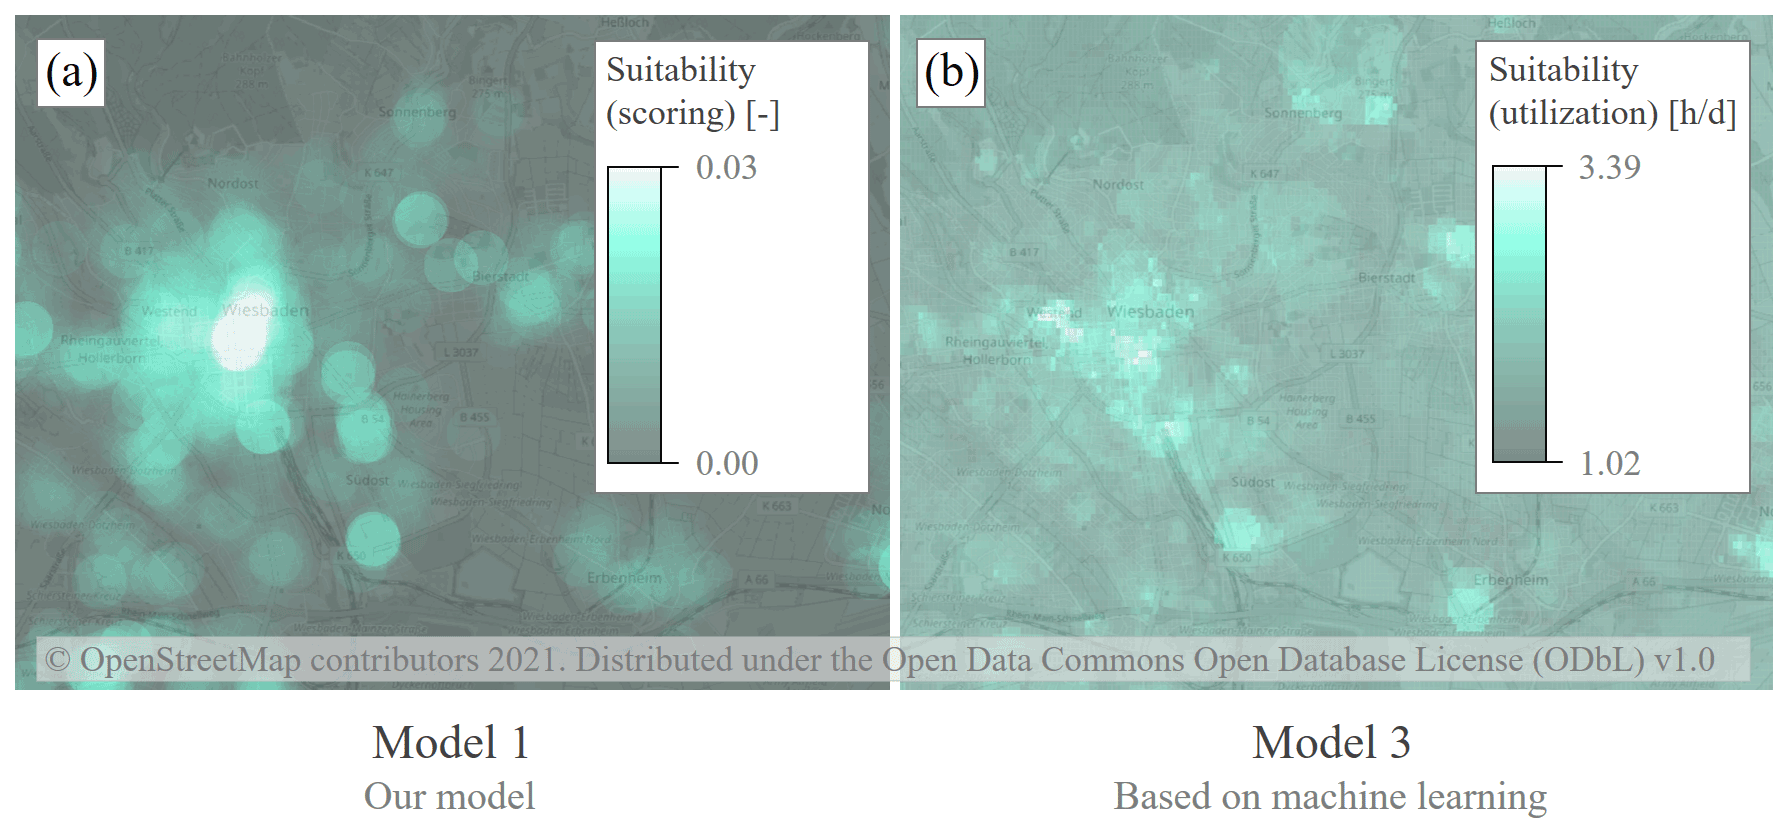
Figure 4Maps of model 1 and model 3.

Figure 5Difference and Ratio of model 1 and model 3.
To more clearly depict differences in the models, a plot of the difference in the (normalized) models has been included in Fig. 5a. However, this only represents the fact that a different distribution of values prevails over the (normalized) scale: While model 1 has some high peak values, the normalized values appear relatively small in comparison in most places. Therefore, the ratio of the normalized models was also calculated, see Fig. 5b. The neutral white corresponds to the quotient of the mean values of the models: The scale is therefore non-linear, but indicates the qualitative differences between the models. In particular areas outside the settlement areas have a positive evaluation in model 3, but not in model 1 (see Fig. 5b).
We presented a model to generate possible future distributions of charging points in public spaces. To investigate the influence of different model approaches, a model comparison was carried out in which four different models were compared in a correlation analysis. By generating a charging point distribution at a high resolution, our model allows for a more detailed approach to strategic planning processes for the electricity grid than is currently used in practice. Contemporary strategic grid planning focuses on medium-voltage grids, whereas low-voltage grids are planned according to general objectives based on statistical data, not individual connection points. The model thus offers a practical benefit, but further validation is necessary.
The correlation analysis shows a high correlation (of 0.999) between the two models, which use similar methodology but slightly different input data. In contrast, the correlation of the two model variants with a third model based on a machine learning approach is low (0.399 and 0.394, respectively). To put the correlation coefficients into perspective, the correlation of all models with a trivial model is between 0.178 and 0.300. In principle, the correlation analysis cannot evaluate the quality of the models. Nevertheless, the following conclusions can be drawn from the present work: The model's design is much more important than the exact input for the lack of home charging infrastructure. The type of model input (complex modeling of vehicles vs. apartment buildings) may play a minor role because the demand for public charging infrastructure is modeled for a surrounding area (in this case, with a radius of 300 m). Furthermore, the correlation analysis shows that different models making fundamentally comparable basic assumptions and modeling similar aspects (influence of POIs and socioeconomic data on public charging demand) do not necessarily produce similar results and, without an objective evaluation standard, measuring the quality of a model is non-trivial.
Further examinations and model extensions can be divided into the following three groups: First, there are model aspects and investigations that are currently being implemented but are not the focus of this paper. This includes distinguishing public parking spaces with varying suitability for charging point use (parking structures versus roadside). Furthermore, we plan to combine the data output with allocations of home charging points, merging it with other distributed consumers (such as heat pumps) and generators (such as PV systems) and using it in grid calculations. This also includes a link to driving and loading profiles, with which studies on waiting time and utilization become possible. Second, the work presented here raises some questions requiring further investigation. These include further investigations about comparative model quality, and also issues of data quality, since OSM is a user-generated dataset, for which a uniformly high data availability and data quality cannot be guaranteed. This was particularly evident in our work with the data on roadside parking areas. Also related to POIs, data gaps cannot be ruled out, which generally leads for a spatial shift of demand mapping. Our top-down method with intermediate categories can at least prevent effects on the total demand, but of course cannot completely exclude inaccuracies in the spatial mapping. Third, interdisciplinary model extensions – involving transportation and urban planning, for example – are a possibility. These could offer added value, but it must be weighed against their higher degree of complexity.
In summary, this paper has provided a comprehensive model for determining possible charging point distributions in public spaces at a high resolution that opens up new methods of grid calculation.
Data from the MiD-survey, version 2017, is used in this paper and can be requested from Kelpin (2021, https://daten.clearingstelle-verkehr.de/279/). Data from OpenStreetMap is used in this paper and can be downloaded from OpenStreetMap (2021, https://www.openstreetmap.org/). Data from the Geospin Portal, layer “Potenzialanalyse Ladeinfrastruktur”, is used and can be downloaded with appropriate access from Geospin GmbH (2021, https://lia.geospin.ai/login).
PG designed the model structure and the model comparison. DG and PG prepared the input data. DG created the model's Python framework. JU and PG worked out the format for the point distribution and the connection to possible grid calculations. EZ initiated the integration of the comparative model 3 and contributed practical experience from the perspective of public utilities. PG prepared the figures and wrote Sects. 1–3. All authors contributed to Sect. 4 and were involved in checking and revising all the sections.
Evamaria Zauner is an employee of Thüga Aktiengesellschaft.
The authors are responsible for the content of this publication.
Publisher’s note: Copernicus Publications remains neutral with regard to jurisdictional claims in published maps and institutional affiliations.
This article is part of the special issue “European Geosciences Union General Assembly 2021, EGU Division Energy, Resources & Environment (ERE)”. It is a result of the EGU General Assembly 2021, 19–30 April 2021.
This research has been supported by the German Ministry for Economic Affairs and Energy (grant no. FKZ 0350048).
This paper was edited by Viktor J. Bruckman and reviewed by Johannes Schmidt and one anonymous referee.
50Hertz Transmission GmbH, Amprion gmbH, Tennet TSO GmbH, TransnetBW GmbH (Eds.): Szenariorahmen für den Netzentwicklungsplan Strom 2030 (Version 2019): Entwurf der Übertragungsnetzbetreiber, 121 pp., available at: https://www.netzentwicklungsplan.de/sites/default/files/paragraphs-files/%C3%9CNB-Entwurf_Szenariorahmen_2030_V2019.pdf (last access: 6 September 2021), 2018.
Braun, M., Krybus, I., Becker, H., Bolgaryn, R., Dasenbrock, J., Gauglitz, P., Horst, D., Pape, C., Scheidler, A., and Ulffers, J.: Verteilnetzstudie Hessen 2024–2034: Studie im Auftrag des Hessischen Ministeriums für Wirtschaft, Energie, Verkehr und Landentwicklung, Frankfurt/Main, Kassel, 243 pp., 2018.
Bundesministerium für Verkehr und digitale Infrastruktur: Ausbaupotenzial – StandortTOOL, available at: https://www.standorttool.de/strom/ausbaupotenzial/, last access: 26 March 2021.
Forschungsgesellschaft für Straßen- und Verkehrswesen e.V.: Empfehlungen für Anlagen des ruhenden Verkehrs EAR 05: EAR 05, Ausg. 2005, FGSV, 283, Forschungsgesellschaft für Strassen- und Verkehrswesen, Köln, 108 pp., 2005.
Gauglitz, P.: LI2.0 3. Konsortialtreffen: Arbeitspaket 3: Szenarien, Fraunhofer IEE, Kassel/online, 4 September 2020, 2020.
Gauglitz, P., Ulffers, J., Thomsen, G., Frischmuth, F., Geiger, D., and Scheidler, A.: Modeling Spatial Charging Demands Related to Electric Vehicles for Power Grid Planning Applications, IJGI, 9, 699, https://doi.org/10.3390/ijgi9120699, 2020.
Geospin GmbH: Potenzialanalyse Ladeinfrastruktur, Geospin Portal [data set], available at: https://lia.geospin.ai/login, last access: 2 September 2021.
Kelpin, R.: Mobilität in Deutschland 2017/Zeitreihendatensatz [data set], available at: https://daten.clearingstelle-verkehr.de/279/, last access: 2 September 2021.
Moos, M.: ÖPNVKarte: Öffentliche Verkehrsmittel – Weltweit, Memomaps, available at: https://www.xn--pnvkarte-m4a.de/#8.2417;50.0824;15, last access: 9 April 2021.
Nobis, C. and Kuhnimhof, T.: Mobilität in Deutschland – MiD Ergebnisbericht: Studie von infas, DLR, IVT und infas 360 im Auftrag des Bundesministers für Verkehr und digitale Infrastruktur, Bonn, Berlin, 2018.
OpenStreetMap: Map data, © OpenStreetMap [data set], Open Database License ODbL, available at: http://opendatacommons.org/licenses/odbl/, https://www.openstreetmap.org, last access: 1 September 2021.
Pagany, R., Marquardt, A., and Zink, R.: Electric Charging Demand Location Model – A User- and Destination-Based Locating Approach for Electric Vehicle Charging Stations, Sustainability, 11, 2301, https://doi.org/10.3390/su11082301, 2019a.
Pagany, R., Ramirez Camargo, L., and Dorner, W.: A review of spatial localization methodologies for the electric vehicle charging infrastructure, Int. J. Sustain. Transp., 13, 433–449, https://doi.org/10.1080/15568318.2018.1481243, 2019b.
Rothfuchs, K., Scheler, C., and Ludwig, C.: Elektromobilitätsentwicklung auf städtischer Mikroebene: Ein Standort-Tool zur Dimensionierung und Allokation von e‐Carsharing Flotten Teilbericht C der Wissenschaftlichen Begleitforschung im Bundesförderprojekt “e-Quartier Hamburg”, Integration von Elektromobilitätsangeboten in Neubau und Bestand aus der Perspektive der Stadtplanung und -entwicklung, Abschlussbericht der Wissenschaftlichen Begleitforschung im Bundförderprojekt “e‐Quartier Hamburg”; Teilbericht C, edited by: Dickhaut, W., HafenCity Universität, Hamburg, 64 pp., 2018.
Vopava, J., Thormann, B., and Kienberger: Development of a Model for Power grids Based on the Cellular Approach for an Optimum Integration of Electric Charging Infrastructure, in: 1st E-Mobility PowerSystem Integration Symposium, 23 October 2017, Berlin, Germany, 2017.
Wagner, S., Brandt, T., and Neumann, D.: SMART CITY PLANNING – DEVELOPING AN URBAN CHARGING INFRASTRUCTURE FOR ELECTRIC VEHICLES, in: Proceedings of the European Conference on Information Systems (ECIS) 2014, Tel Aviv, Israel, 9–11 June 2014, 22th European Conference on Information Systems, 2014.
Xu, M. and Meng, Q.: Optimal deployment of charging stations considering path deviation and nonlinear elastic demand, Transport. Res. B-Meth., 135, 120–142, https://doi.org/10.1016/j.trb.2020.03.001, 2020.