 | 07 Jun 2023
A conceptual model for the estimation of flood damage to power grids
Panagiotis Asaridis
Daniela Molinari
Flood damage assessment is a critical aspect in any decision-making process on flood risk management. For this reason, reliable tools for flood damage estimation are required for all the categories of exposed elements. Despite infrastructures can suffer high economic losses in case of flood, compared to other exposed sectors, their flood damage modelling is still a challenging task. This is due, on the one hand, to the structural and dynamic complexity of infrastructure networks, and, on the other hand, to the lack of knowledge and data to investigate damage mechanisms and to calibrate and validate damage models. Grounding on the investigation of the state-of-the-art, this paper presents a conceptualization of flood damage to power grids and reviews the methodologies in the field for an in-depth understanding of the existing modelling approaches, challenges, and limitations. The conceptual model highlights: (i) the different kinds of damage (i.e., direct, indirect, and systemic) the network can suffer, (ii) the hazard, exposure, and vulnerability parameters on which they depend, (iii) the spatial and temporal scales required for their assessment, (iv) the interconnections among power grids and economic activities, and (v) the different recipients of economic losses. The development of the model stresses the importance of dividing the damage assessment into two steps: the estimation of damage in physical units and the consequent economic losses in monetary terms. The variety of damage mechanisms and cascading effects shaping the final damage figure arises, asking for an interdisciplinary and multi-scale evaluation approach. The ultimate objective of the conceptual model is to be an operative tool in support of more comprehensive and reliable flood damage assessments to power grids.
- Article
(1713 KB) - Full-text XML
- BibTeX
- EndNote


Floods are among the most frequent and destructive natural hazards worldwide (UNDRR, 2019; IPCC, 2021). They are responsible for large number of fatalities, widespread destruction of property and livelihoods, cause significant economic losses, severe damage to infrastructures, and may have adverse impacts on cultural heritage and the environment. Besides, there is a growing concern that the frequency and intensity of flooding events will increase in the future, a trend that seems to be highly associated with climate change and socio-economic development (Hall et al., 2014). Hence, there has been a raising global awareness for flood risk mitigation over the past decades.
The assessment of flood damage constitutes a key prerequisite in any deliberations on flood risk management. It is fundamentally important for the cost–benefit analysis of flood risk mitigation and control measures, and the flood risk mapping of assets, people, and the environment to prioritize the intervention options. Moreover, it is essential for the comparative risk analysis between different types of natural hazards for the allocation of financial resources, as well as for economic appraisals of both the insurance sector and the governances to estimate premiums and damage compensations, respectively (Merz et al., 2010). The operative tools used for flood damage assessment are the flood damage models. They describe the relationship between hazard, exposure, and vulnerability parameters and the damage itself. Despite flood damage assessment is a quite recent topic in flood risk management, there is a wide variety of models now available in the literature (Pregnolato et al., 2015; Gerl et al., 2016; Bombelli et al., 2021).
Yet, flood damage modelling has been mainly focused on the estimation of direct damage to residential buildings and their contents (Gerl et al., 2016). Current methodologies for estimating flood damage to other exposed sectors, such as infrastructures, are not as well developed (Jongman et al., 2012). This is mainly due to the structure and dynamics of their complex networks, the lack of knowledge and scarcity of data to identify, understand, and analyse damage mechanisms, and thereby the absence of validation and calibration process for the damage models. However, the analysis of few empirical data shows that flood damage to infrastructures made up a significant share of the total economic losses, as compared to economic losses of other exposed sectors (Bubeck et al., 2011; Jongman et al., 2012; Thieken et al., 2016).
Infrastructures are large scale, man-made, and complex systems that operate interdependently, consisting of numerous heterogeneous components that interact with each other in a network structure. Power grid is one of the most critical infrastructures (CIs). It constitutes the physical backbone of modern societies and economies. It is ever-present in the daily life of people with majority of essential goods and services depending, to a greater or lesser extent, on its safe, secure, and reliable supply and delivery (Council Directive 2008/114/EC). Being simply connected to power grid does not guarantee reliable services. Power grids are subject to random failures, natural hazards, or intentional attacks. Natural hazards are a leading driver of power outages around the world (Panteli and Mancarella, 2015; Mukherjee et al., 2018). Generally, they are responsible for power interruptions that last significantly longer, ranging from hours to days, than those due to non-natural hazards (Rentschler et al., 2019b). Among other effects, long-term power interruptions impede the regular performance of household tasks, bring the activity of businesses, industries, and agricultures to a halt, and cause the disruption of other CIs (see Sect. 2.1.3). Indeed, floods may have a significant impact on power grids functionality in terms of frequency, magnitude, and duration of the power outage. For example, hundreds of thousands of people left without power for long periods of time during past floodings events, such as those in the United Kingdom (Pitt, 2007; Kemp, 2016), or that in Germany, Belgium, and the Netherlands (Koks et al., 2022), demonstrating in this way the catastrophic impact that flood-induced power supply disruptions can have on costumers. The ever-increasing dependency of modern societies and economies on electricity access for their proper functioning, combined with the potential increase in the frequency and intensity of floods, may expose them to previous unseen risks (Forzieri et al., 2018). Thus, maintaining the security of power supply under emergency conditions triggered by natural hazards, such as floods, is becoming of utmost importance.
For this purpose, modelling and simulation tools for the assessment of flood damage can enable stakeholders, authorities, and policy makers to formulate effective risk mitigation strategies. Still, flood damage assessments must take a comprehensive view of infrastructures that requires the consideration of many more aspects than the physical damage to components. This is due to the heterogeneity of power grid components and their interconnections, which makes them particularly vulnerable to natural hazards. Indeed, large-scale cascades may be triggered by damage to a single key node, capable of disabling even almost the entire network (Motter and Lai, 2002). Furthermore, the vulnerability of an infrastructure to a wide range of hazards is shaped by dependencies and interdependencies that lead in cascade effects across multiple sectors and infrastructures (Rinaldi et al., 2001). Therefore, it is essential to analyse the hazard variables, characterize the physical vulnerability of infrastructure components, analyse the network effects, and analyse the interdependencies between other sectors and infrastructures to assess the systemic risks that lead to socio-economic impacts, in order for flood damage assessment to support the implementation of effective and efficient adaptation measures (Dawson et al., 2018).
Despite many research efforts have been made in the last decade to improve modelling capabilities of flood damage to power grids, to our knowledge, there is not consolidated practice to estimate damage in a comprehensive way, that is by considering all the aspects previously identified (see Sect. 3).
Drawing from an exhaustive literature review, this paper presents the first step towards the required standardisation, that is the development of a conceptual model for the comprehensive estimation of flood damage to power grids. The objective is to supply a general framework to be followed for the assessment of direct, indirect, and systemic damage, as well as the consequent economic losses, in different physical and socio-economic contexts. Integrating information coming from different disciplines, the conceptual model identifies which damage mechanisms must be considered (by means of specific models) for a comprehensive estimation of flood damage, their explicative variables, the results expected from their modelling, as well as the required spatial and temporal scale for the assessment, while representing the way in which the various damage mechanisms are connected to each other. Key concern of this study is the consistency among physically based and cost-based sub-models, the consistency between the different set of input and output variables for the sub-models at stake, and the integration of multiple scales of analysis in the assessment of the full damage range. In this way, the conceptual model develops an entire map of flood damage propagation, in the support of more effective risk management.
The reminder of this paper is organized as follows. The conceptual model is described in Sect. 2, along with literature sources that supported its development. Section 3 discusses strengths and weaknesses of existing modelling approaches in comparison with the one proposed by the conceptual model; in doing so knowledge gaps for its full implementation are revealed. Key challenges and opportunities that arise from the development of the conceptual model and potential future research priorities are finally discussed in Sect. 4.
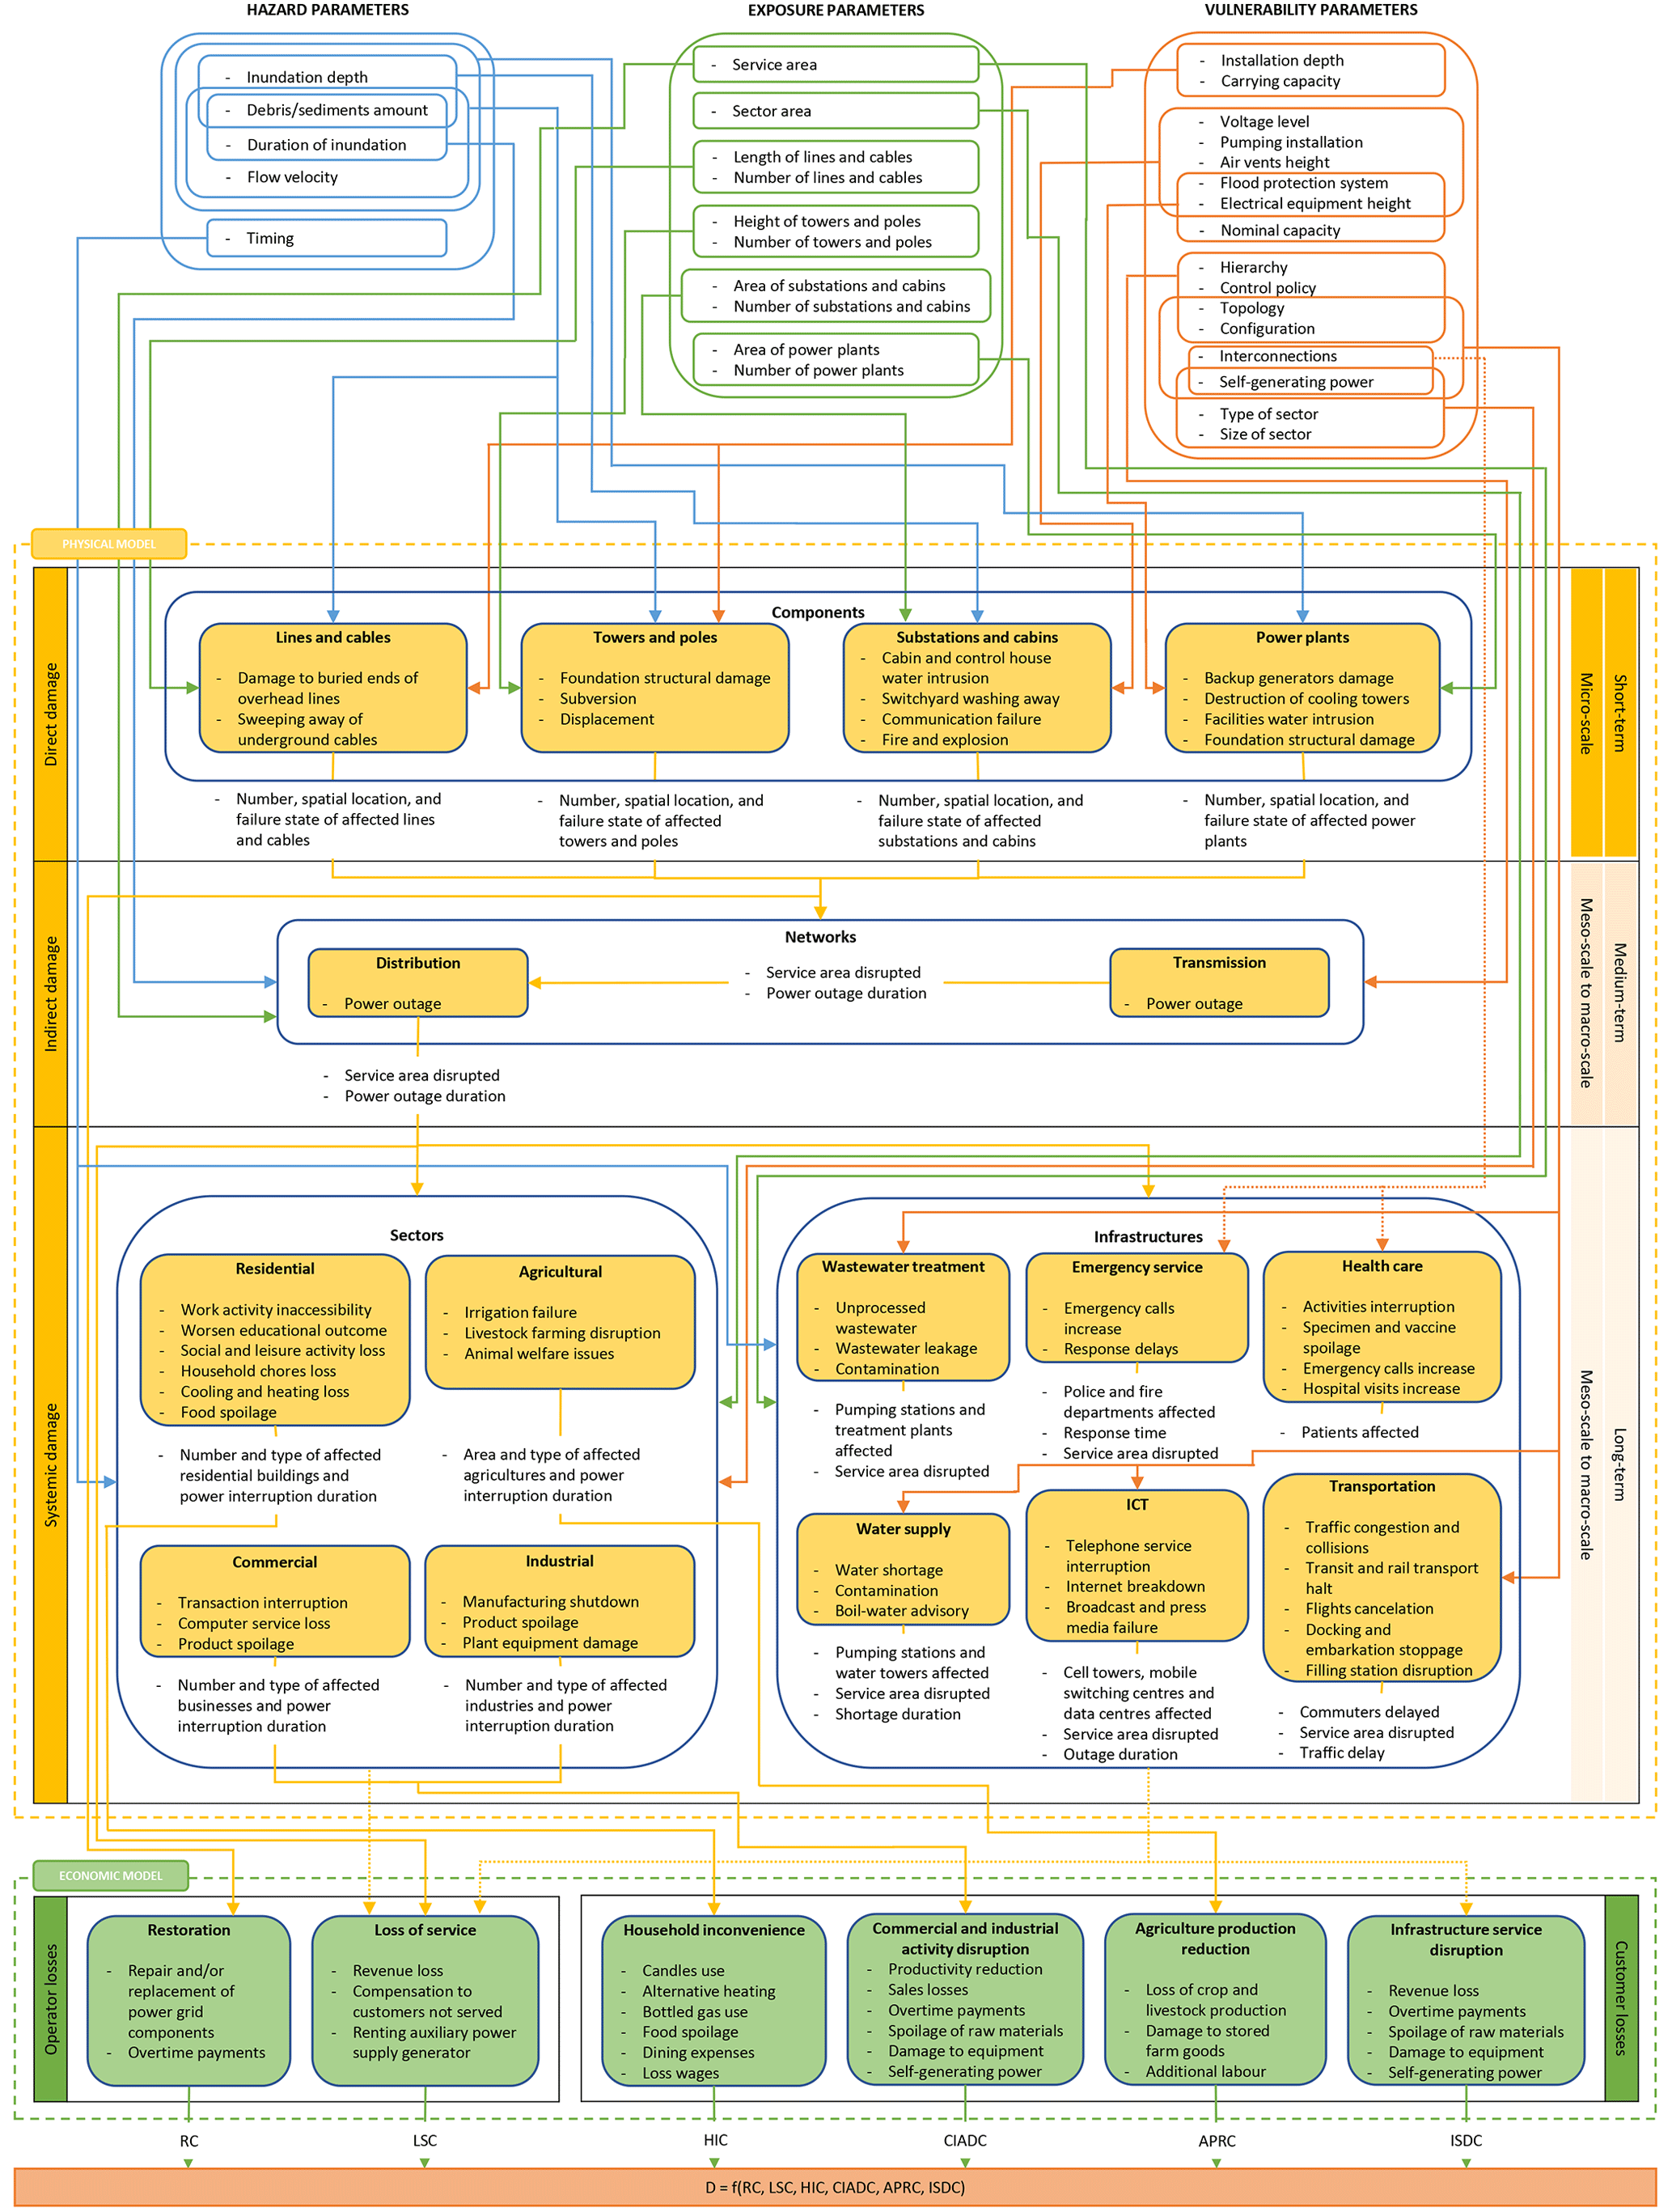
The conceptualization of flood damage to power grids derives from a thorough literature review. The conceptual model has been conceived to handle the complexity of damage mechanisms and identify the full range of cascading effects by adopting an interdisciplinary and multi-scale evaluation approach (Fig. 1). The model highlights:
-
the different kinds of damage for which a model is required (i.e., direct, indirect, and systemic)
-
the hazard, exposure, and vulnerability parameters on which damages depend on
-
the spatial and temporal scales of analysis
-
the interconnections among power grids and economic activities (i.e., residential, commercial, industrial, agricultural sectors and other infrastructures)
-
the different recipients of economic losses for which a model is required (i.e., grid operators and customers)
The conceptual model is distinguished between a physical and an economic model. While the physical model is composed of sub-models that estimate flood damage to power grids in quantitative terms (e.g., number of substations affected, service area disrupted, power outage duration), the economic model consists of sub-models that express losses in monetary values (e.g., overtime payments, wages loss, revenues loss).
2.1 Physical model
In this subsection, the damage mechanisms and cascading effects that shape the entire figure of flood damage to power grids, are summarized. In particular, the physical model consists of sub-models to estimate the direct damage to components, the indirect damage to networks, and the systemic damage to economic activities, specifying the required input and output variables, and the spatial and temporal scales of analysis.
2.1.1 Direct damage
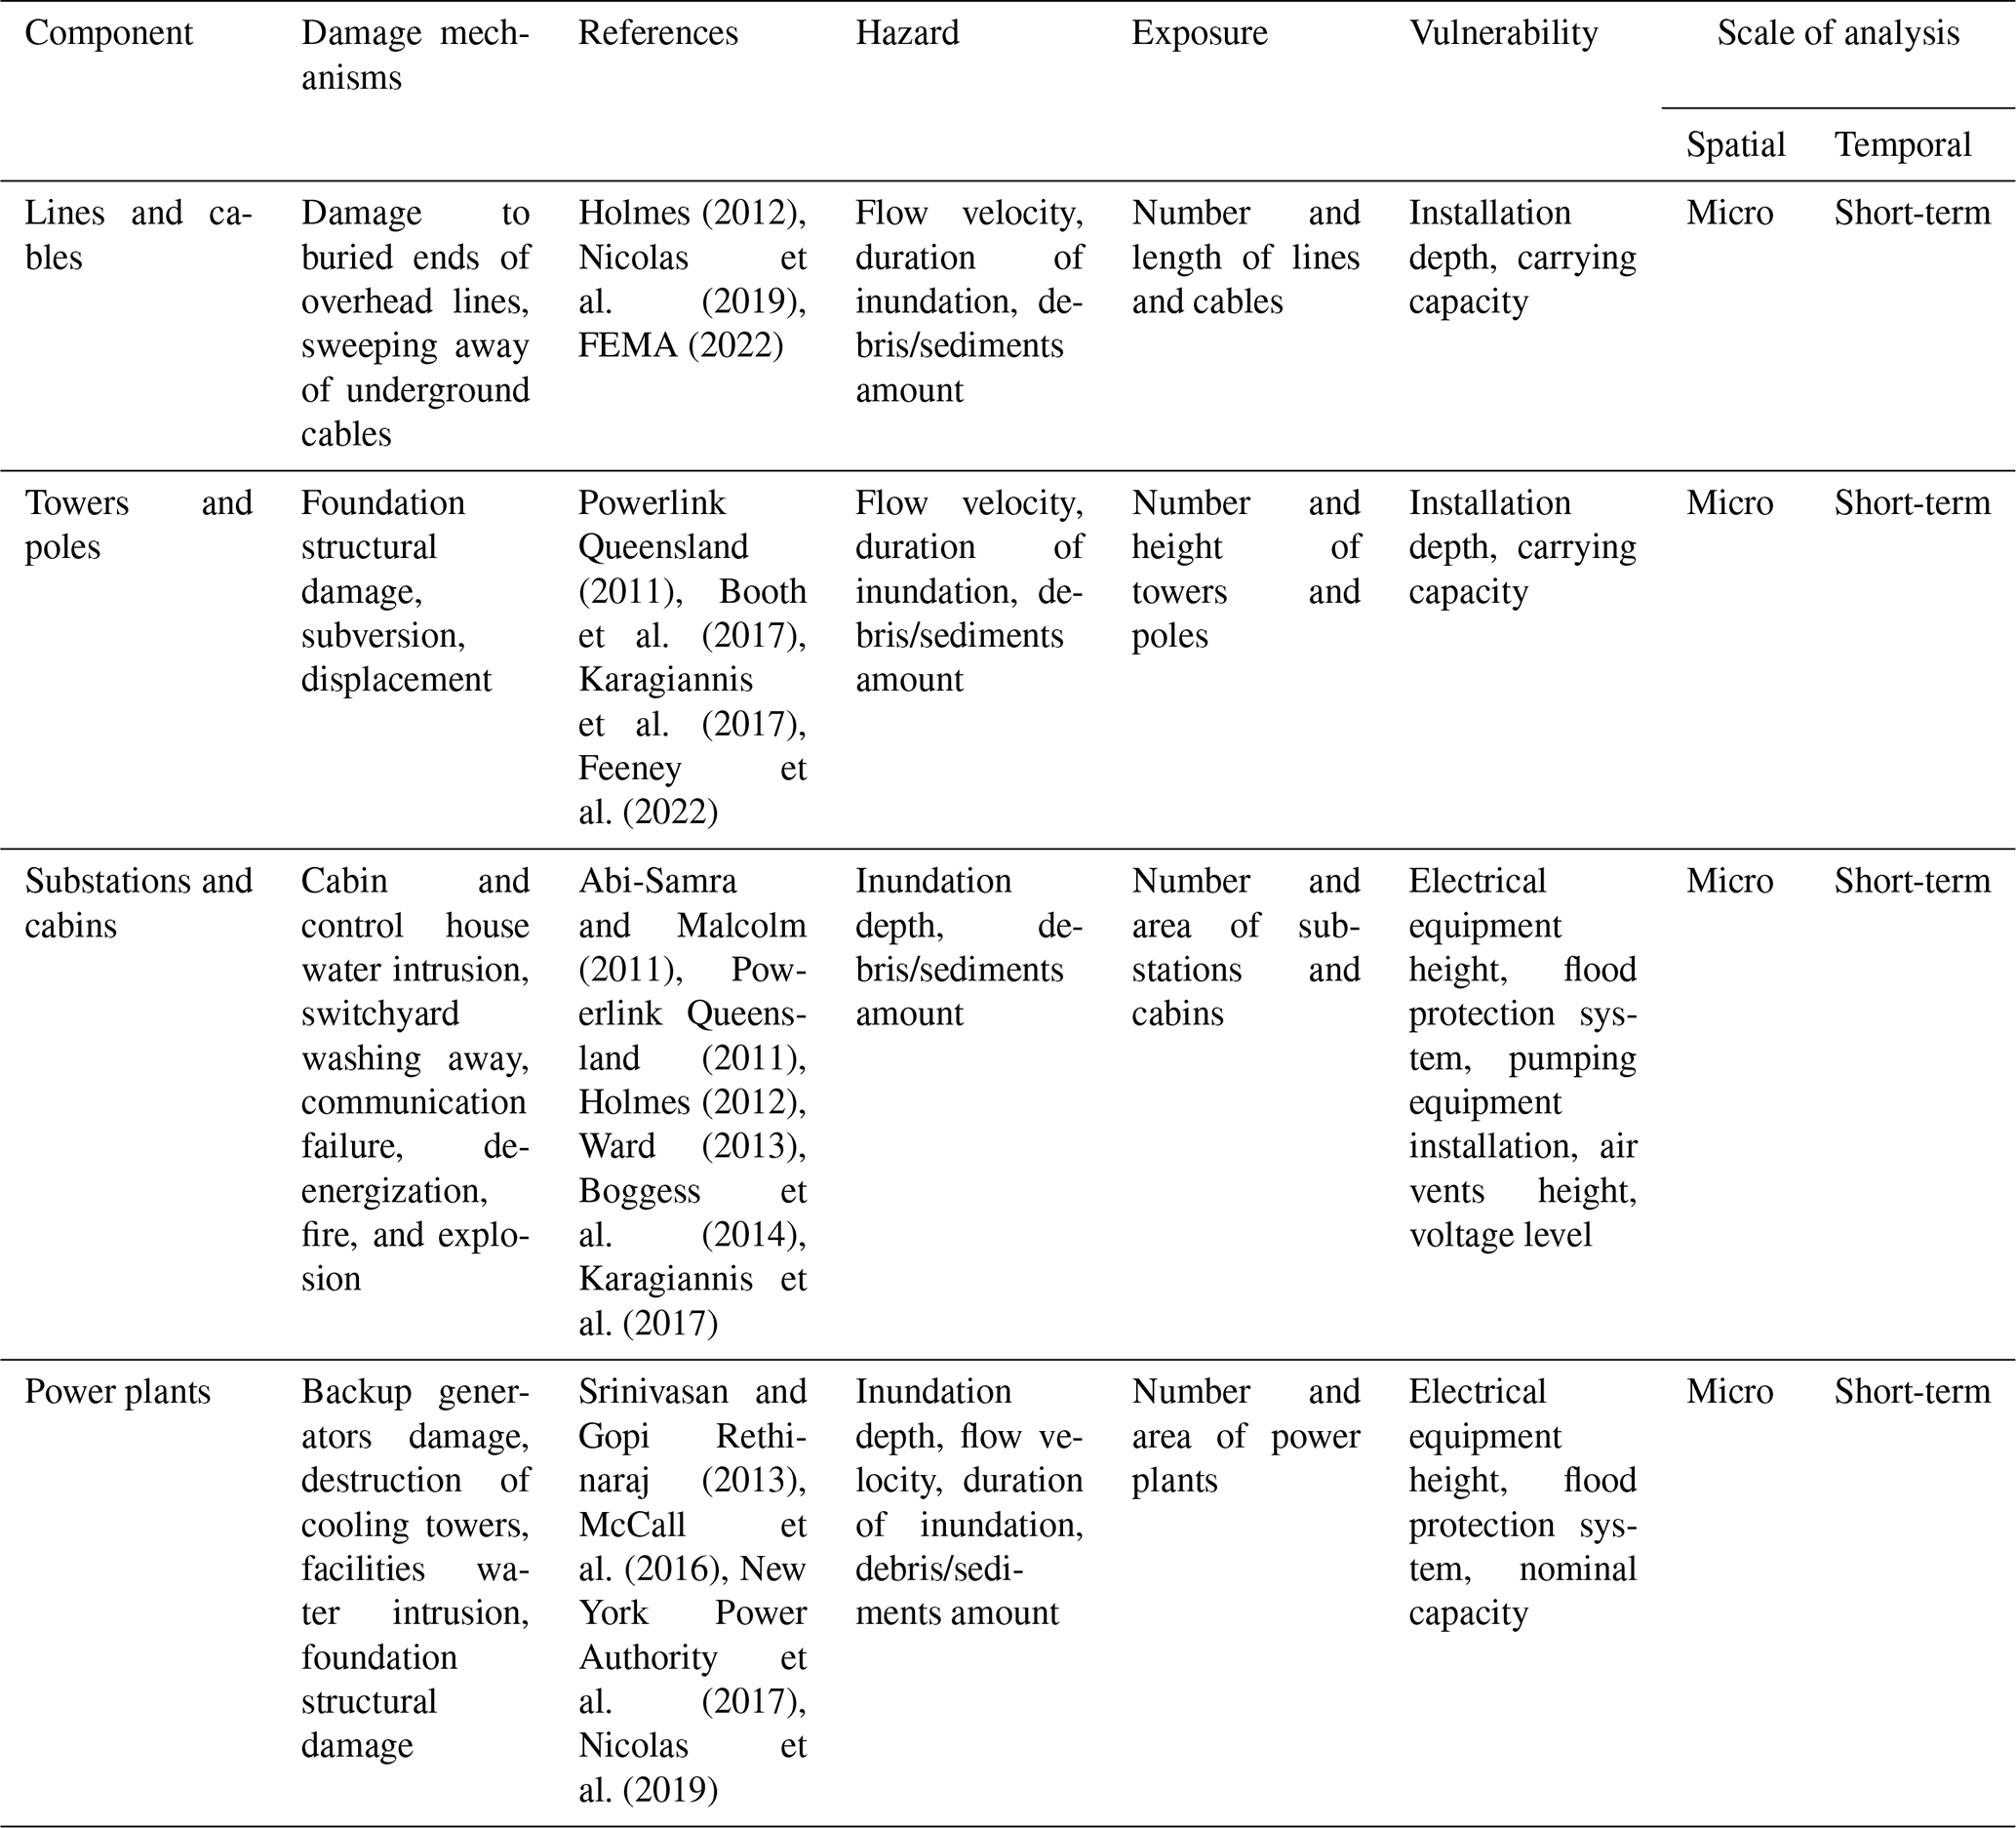
Direct damage is here defined as the physical damage and functional failure that occurs to power grid components due to their physical contact with floodwater or due to the riverbank erosion induced by floods. Traditionally, power grids include the generation in large power plants, the long-distance transmission network, and the regional distribution network. Their components, such as lines and cables, towers and poles, substations and cabins, and power plants, are highly exposed to natural hazards (Nicolas et al., 2019), containing vulnerable electrical equipment. In fact, water is a good conductor of electricity, and thus, electrical equipment suffers significant damage in the presence of even minute quantities of moisture and dirt. During a flooding event, various types of incidents at each power grid component can lead to system disruption (Table 1). It should be noted that, the conceptual model does not consider the indirect physical damage to power grid components due to floods, such as trees failures on overhead lines due to saturated ground conditions (Slegg and Faiers, 2014), damage to underground cable crossings due to bridge collapse (Booth et al., 2017), or hydroelectric power plant failure due to overtopping of dam spillways (Koskinas et al., 2019). The estimation of direct damage to power grid components requires an analysis at the micro-scale, namely the assessment based on single elements at risk.
Lines and cables
The vulnerability of overhead lines to inundation is relatively low (Nicolas et al., 2019; FEMA, 2022), while to the best of our knowledge, that of underground cables have yet to be clarified. Floodwater may cause substantial damage to the buried ends of overhead lines, found close to towers and poles, for their transition to underground cables (FEMA, 2022). Underground cables located near the riverbank may be exposed to floods by the following erosion phenomena as they are at risk of being swept away by the floodwater (Holmes, 2012). Damage and failures to lines and cables depend on the flow velocity, the duration of inundation, and the amount of debris/sediments (hazard parameters), the number and length of the lines and cables (exposure parameters), the installation depth and carrying capacity (vulnerability parameters). Their modelling must supply the number, the spatial location, and the failure state of the affected lines and cables.
Towers and poles
Floodwater pose a serious threat to steel lattice towers and steel, concrete, or wooden poles situated close to rivers (Karagiannis et al., 2017; Feeney et al., 2022). Riverbank erosion due to saturated ground may severely undermine the foundations of towers and poles, causing their exposure and putting in doubt their structural integrity. This has as a potential consequence their displacement or even worse their subversion (Powerlink Queensland, 2011; Booth et al., 2017). Damage and failures to towers and poles depend on the flow velocity, the duration of inundation, and the amount of debris/sediments (hazard parameters), the number and height of the towers and poles (exposure parameters), the installation depth and carrying capacity (vulnerability parameters). Their modelling must supply the number, the spatial location, and the failure state of the affected towers and poles.
Substations and cabins
Electrical substations, primary, and secondary cabins are at high risk of flooding due to their ubiquity and vulnerable equipment. In substations, large amounts of water and mud may be trapped in electrical equipment following submersion (Abi-Samra and Malcolm, 2011; Karagiannis et al., 2017). The inundation in switchyard may cause significant damage to high voltage equipment items mounted at ground level such as transformers, switchgears, and circuit breakers. Furthermore, control house may suffer water intrusion causing damage to protection, automation, and control equipment. Finally, any damage to the above equipment items may lead to communication failure between substations and/or operation centres, de-energization of substations, or even so fire and explosion (Powerlink Queensland, 2011; Ward, 2013; Boggess et al., 2014). Cabins are susceptible to flooding due to water intrusion through the sealing vents that can damage the electrical equipment (Holmes, 2012). Damage and failures to substations and cabins depend on the inundation depth and the amount of debris/sediments (hazard parameters), the number and area of the substations and cabins (exposure parameters), the installation height of electrical equipment and air ventilation holes, the presence of flood protection system and pumping equipment, and the voltage level (vulnerability parameters). Their modelling must supply the number, the spatial location, and the failure state of the affected substations and cabins.
Power plants
The classification of power generation plants is based on the type of fuel harnessed. In the event of flooding, diesel, nuclear, oil, solar, and hydroelectric power plants could be severely damaged. Among all different types, wind power generators seem to be less vulnerable (Nicolas et al., 2019). Diesel generators are often stored in the basement of a facility or at the ground level. When a flooding event occurs, the generators may be inundated and thus become inoperable. Flood damage to diesel generators was a major contributor to the meltdown of reactors in Fukushima Daiichi nuclear plant due to the lack of backup power (Srinivasan and Gopi Rethinaraj, 2013). A typical flood damage mechanism of nuclear and oil power plants is the disablement of the cooling system due to threating of cooling towers by high levels of inundation depth. These facilities are vulnerable to floods because they rely on intake water for circulation in the cooling system (McCall et al., 2016). Solar power plants are vulnerable to floods due to structural damage caused to foundations by erosion. Hydroelectric power plants may suffer damage to administration facilities due to water and mud intrusion (New York Power Authority et al., 2017). Damage and failures to power plants depend on the inundation depth, the flow velocity, the duration of inundation, and the amount of debris/sediments (hazard parameters), the number and area of the power plants (exposure parameters), the installation height of electrical equipment, the presence of flood protection system, and the nominal capacity (vulnerability parameters). Their modelling must supply the number, the spatial location, and the failure state of the affected power plants.
2.1.2 Indirect damage
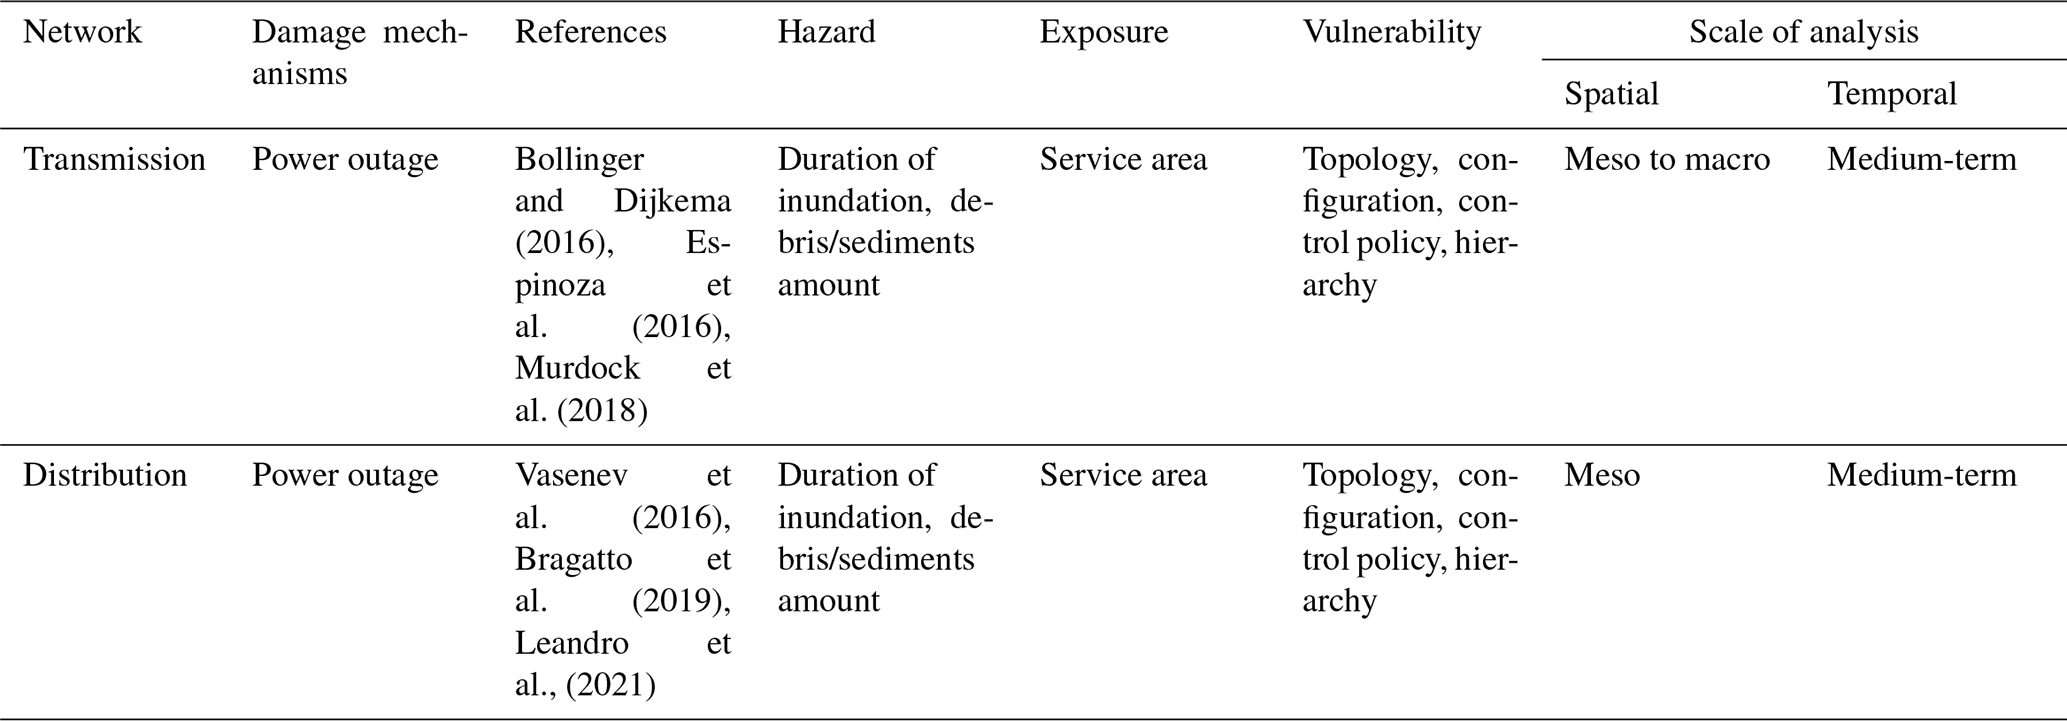
Indirect damage is here defined as the loss of network functionality due to the physical damage and functional failure of its components. Since complex networks, and particularly power grids, are made up of strongly interconnected components, the failure of a single component may trigger large cascade failures, causing even the loss of functionality of the entire transmission (Bollinger and Dijkema, 2016; Espinoza et al., 2016; Murdock et al., 2018) and distribution (Vasenev et al., 2016; Bragatto et al., 2019; Leandro et al., 2021) network (Table 2). Typically, cascading failures are responsible for extended and long-term power outages. It is worth mentioning that, in certain circumstances, a power outage may or may not cause an interruption of service to customers (Billinton and Allan, 1996).
Transmission and distribution network
Key parameters affecting the network performance concern, first, the initial topology of power grid, including lines and cables redundancy, second, the electrical configuration features, such as generation/demand layout, third, the control policies employed in the system throughout the evolution of the event, as for example re-dispatch strategies (Azzolin et al., 2018), and fourth, the hierarchical structure of the network, especially when it comes to a distribution network (Buriticá Cortés et al., 2015; Ferrario et al., 2016). The duration of inundation, and therefore, the lack of access to the inundated facilities and components is major determinant of the power outage duration (Slegg and Faiers, 2014). Irrespective of the effectiveness of power grid restorative capacity, many types of repairs cannot start until the waters recede. Recovery time also depends on the amount of mud trapped in electrical equipment, as these must be dismantled and thoroughly cleaned before they can be put back into service (Karagiannis et al., 2017).
Modelling cascading failures in power grids requires the number, the spatial location, and the failure state of the affected components (input variables). Loss of transmission and distribution network functionality depends on the duration of inundation and the amount of debris/sediments (hazard parameters), the service area of the network (exposure parameter), the hierarchy, topology, electrical configuration, and control policy of the network (vulnerability parameters). Their modelling must supply the disrupted service area and the power outage duration. The estimation of indirect damage to power grid transmission and distribution network requires the performance of analysis at the meso-scale or macro-scale, depending on the level of spatial aggregation units affected by the power outage (e.g., municipalities, regions, countries).
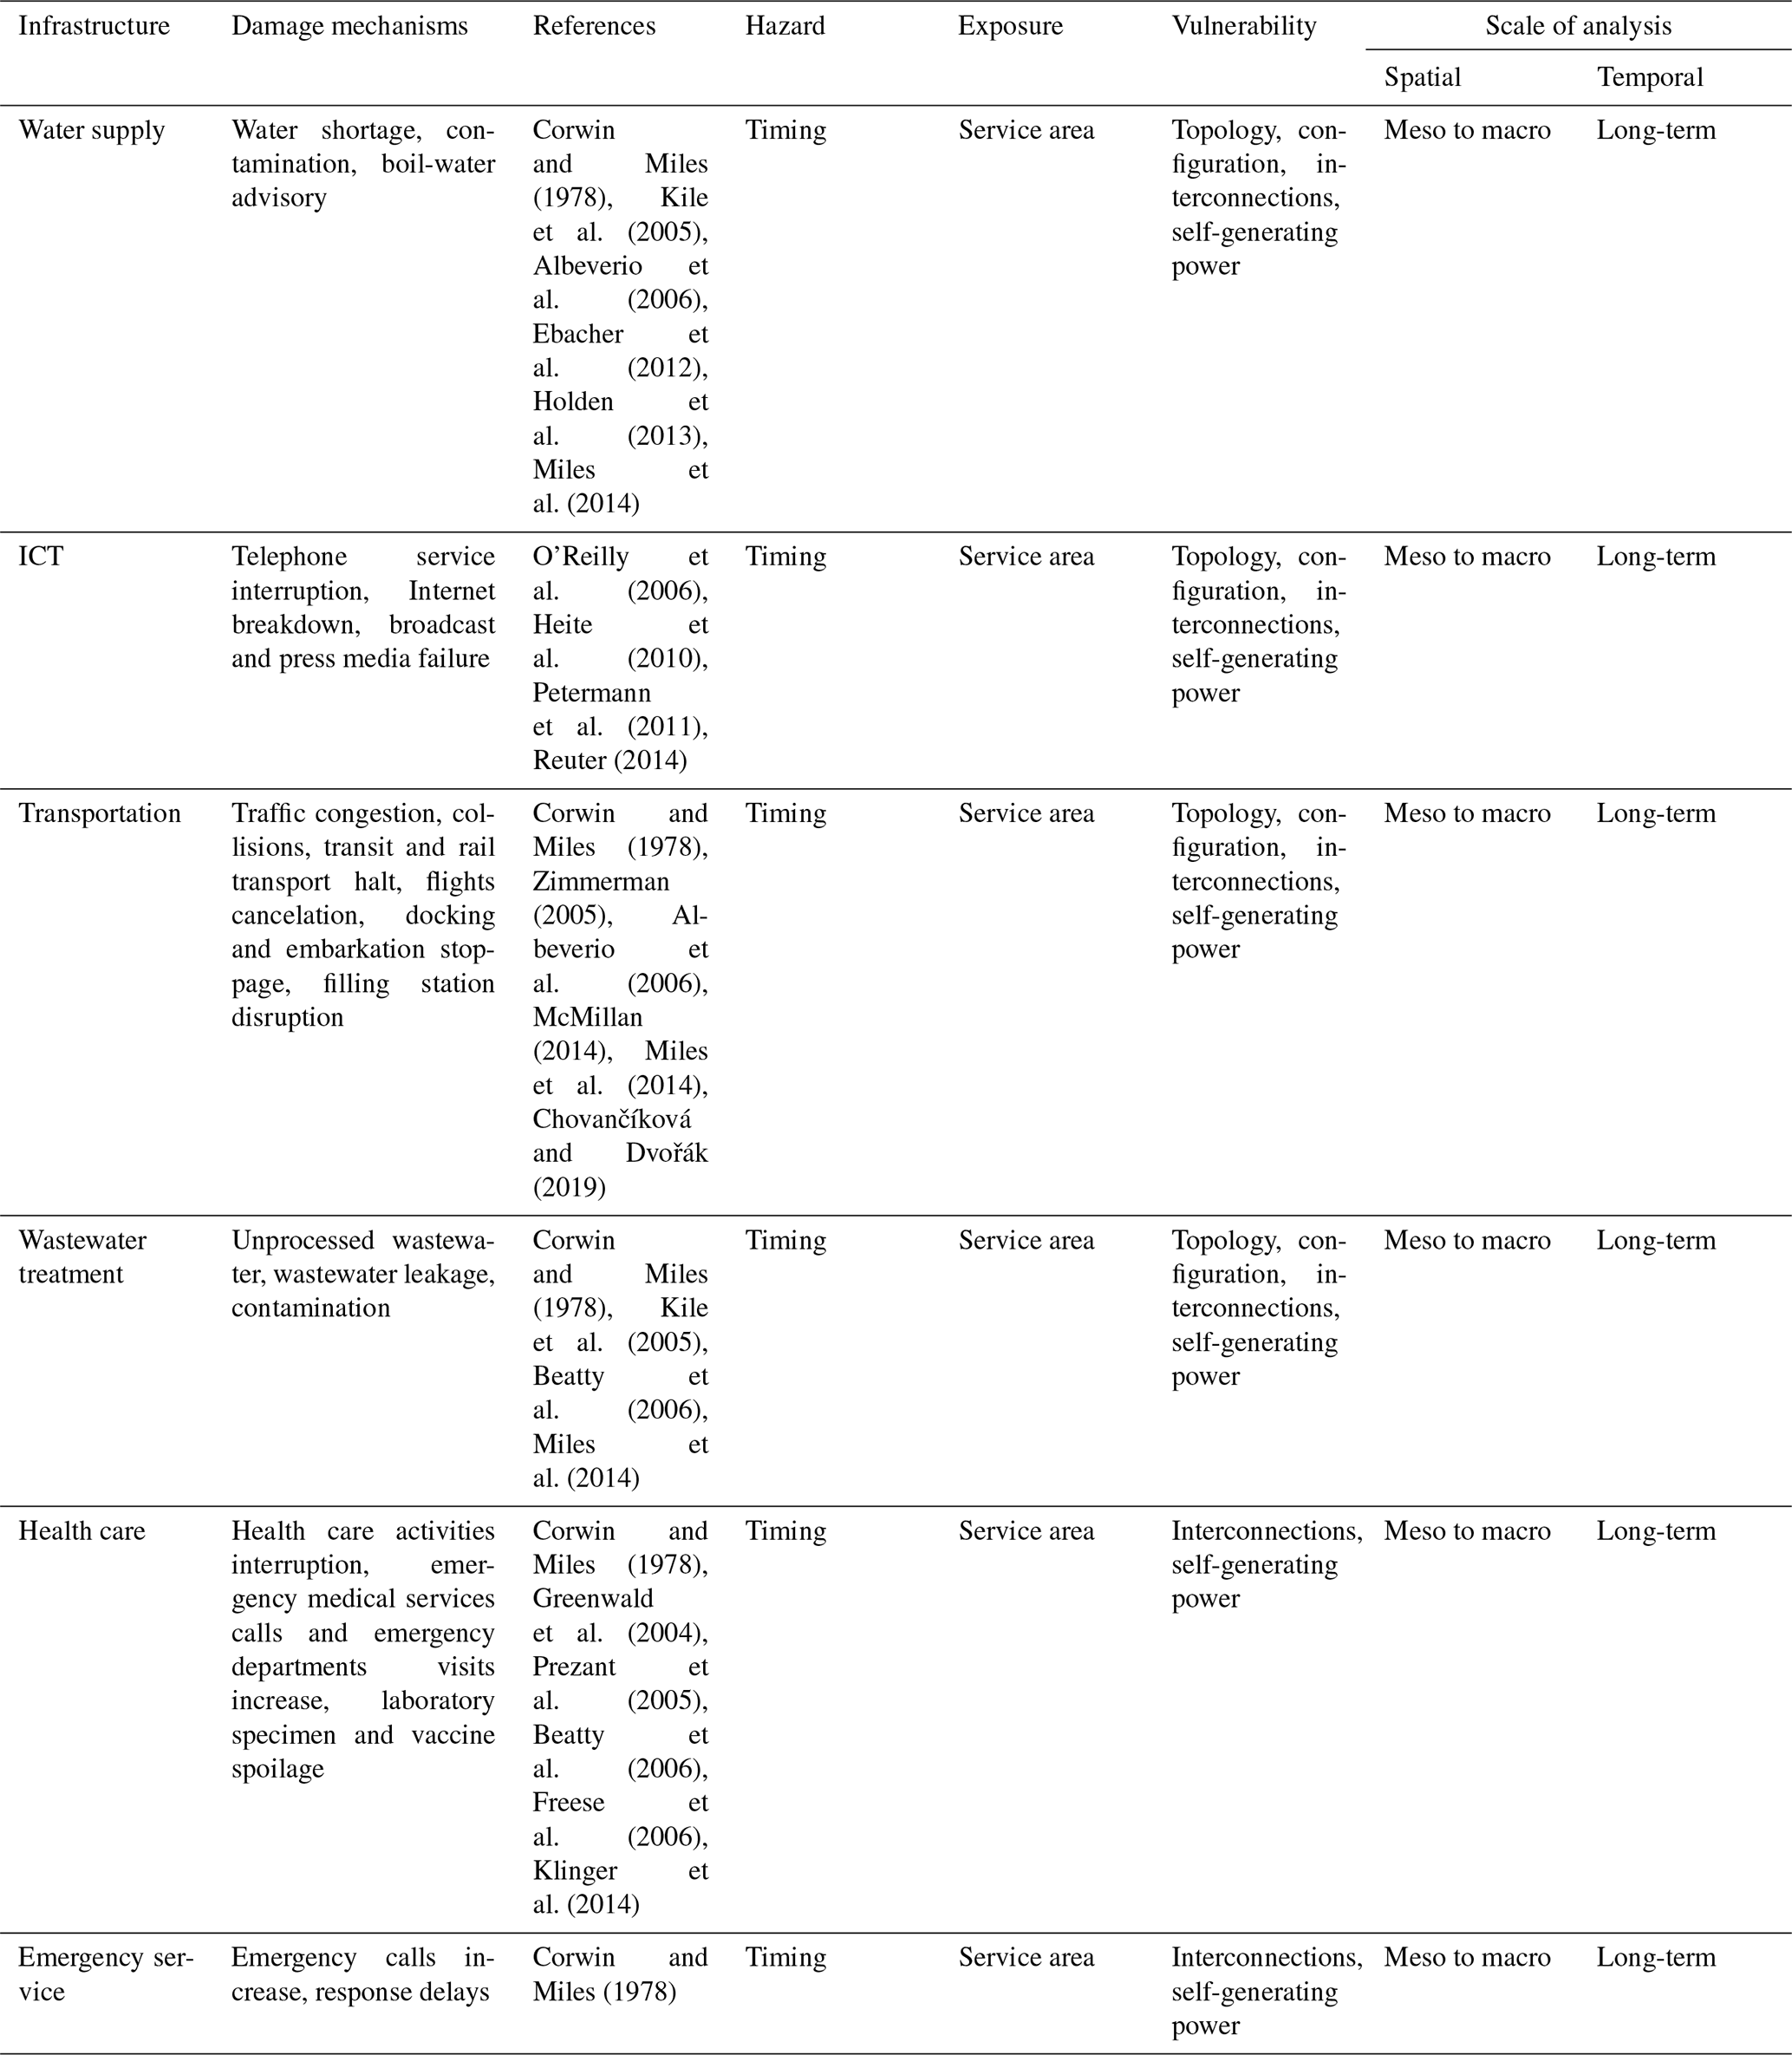
2.1.3 Systemic damage
Systemic damage is here defined as the damage arises due to the dependencies and interdependencies between the power grid and economic activities. Loss of functionality of the transmission and/or distribution network affect households, induce the cessation of commercial and industrial activities, has negative consequences for agriculture (Table 3), and trigger cascading failures in interconnected infrastructure networks (Table 4). Indeed, people's domestic life is strongly dependent on power supply, businesses, industries, and agriculture rely on it for the daily production of goods and services, while it is also crucial for the operation of many other infrastructures (Sebastian et al., 2017). At this point, it is important to clarify that this study investigates only the infrastructure dependencies, naming the unidirectional relationships that exist between them. Dependency is “a linkage or connection between two infrastructures, through which the state of one infrastructure influences or is correlated to the state of the other” (Rinaldi et al., 2001). More specifically, it only evaluates the disruption of infrastructure services due to their dependency on power supply. Infrastructure service disruptions due to other types of dependencies or due to interdependencies even with power grid are not evaluated.
Modelling power interruption impacts to economic activities requires the disrupted service area of transmission and distribution network and the duration of power outage (input variables). The estimation of systemic damage to power grid customers requires the performance of analysis at the meso-scale or macro-scale, depending on the level of spatial aggregation units affected by the disruption of sector activities and infrastructure services due to power interruption (e.g., municipalities, regions, countries).
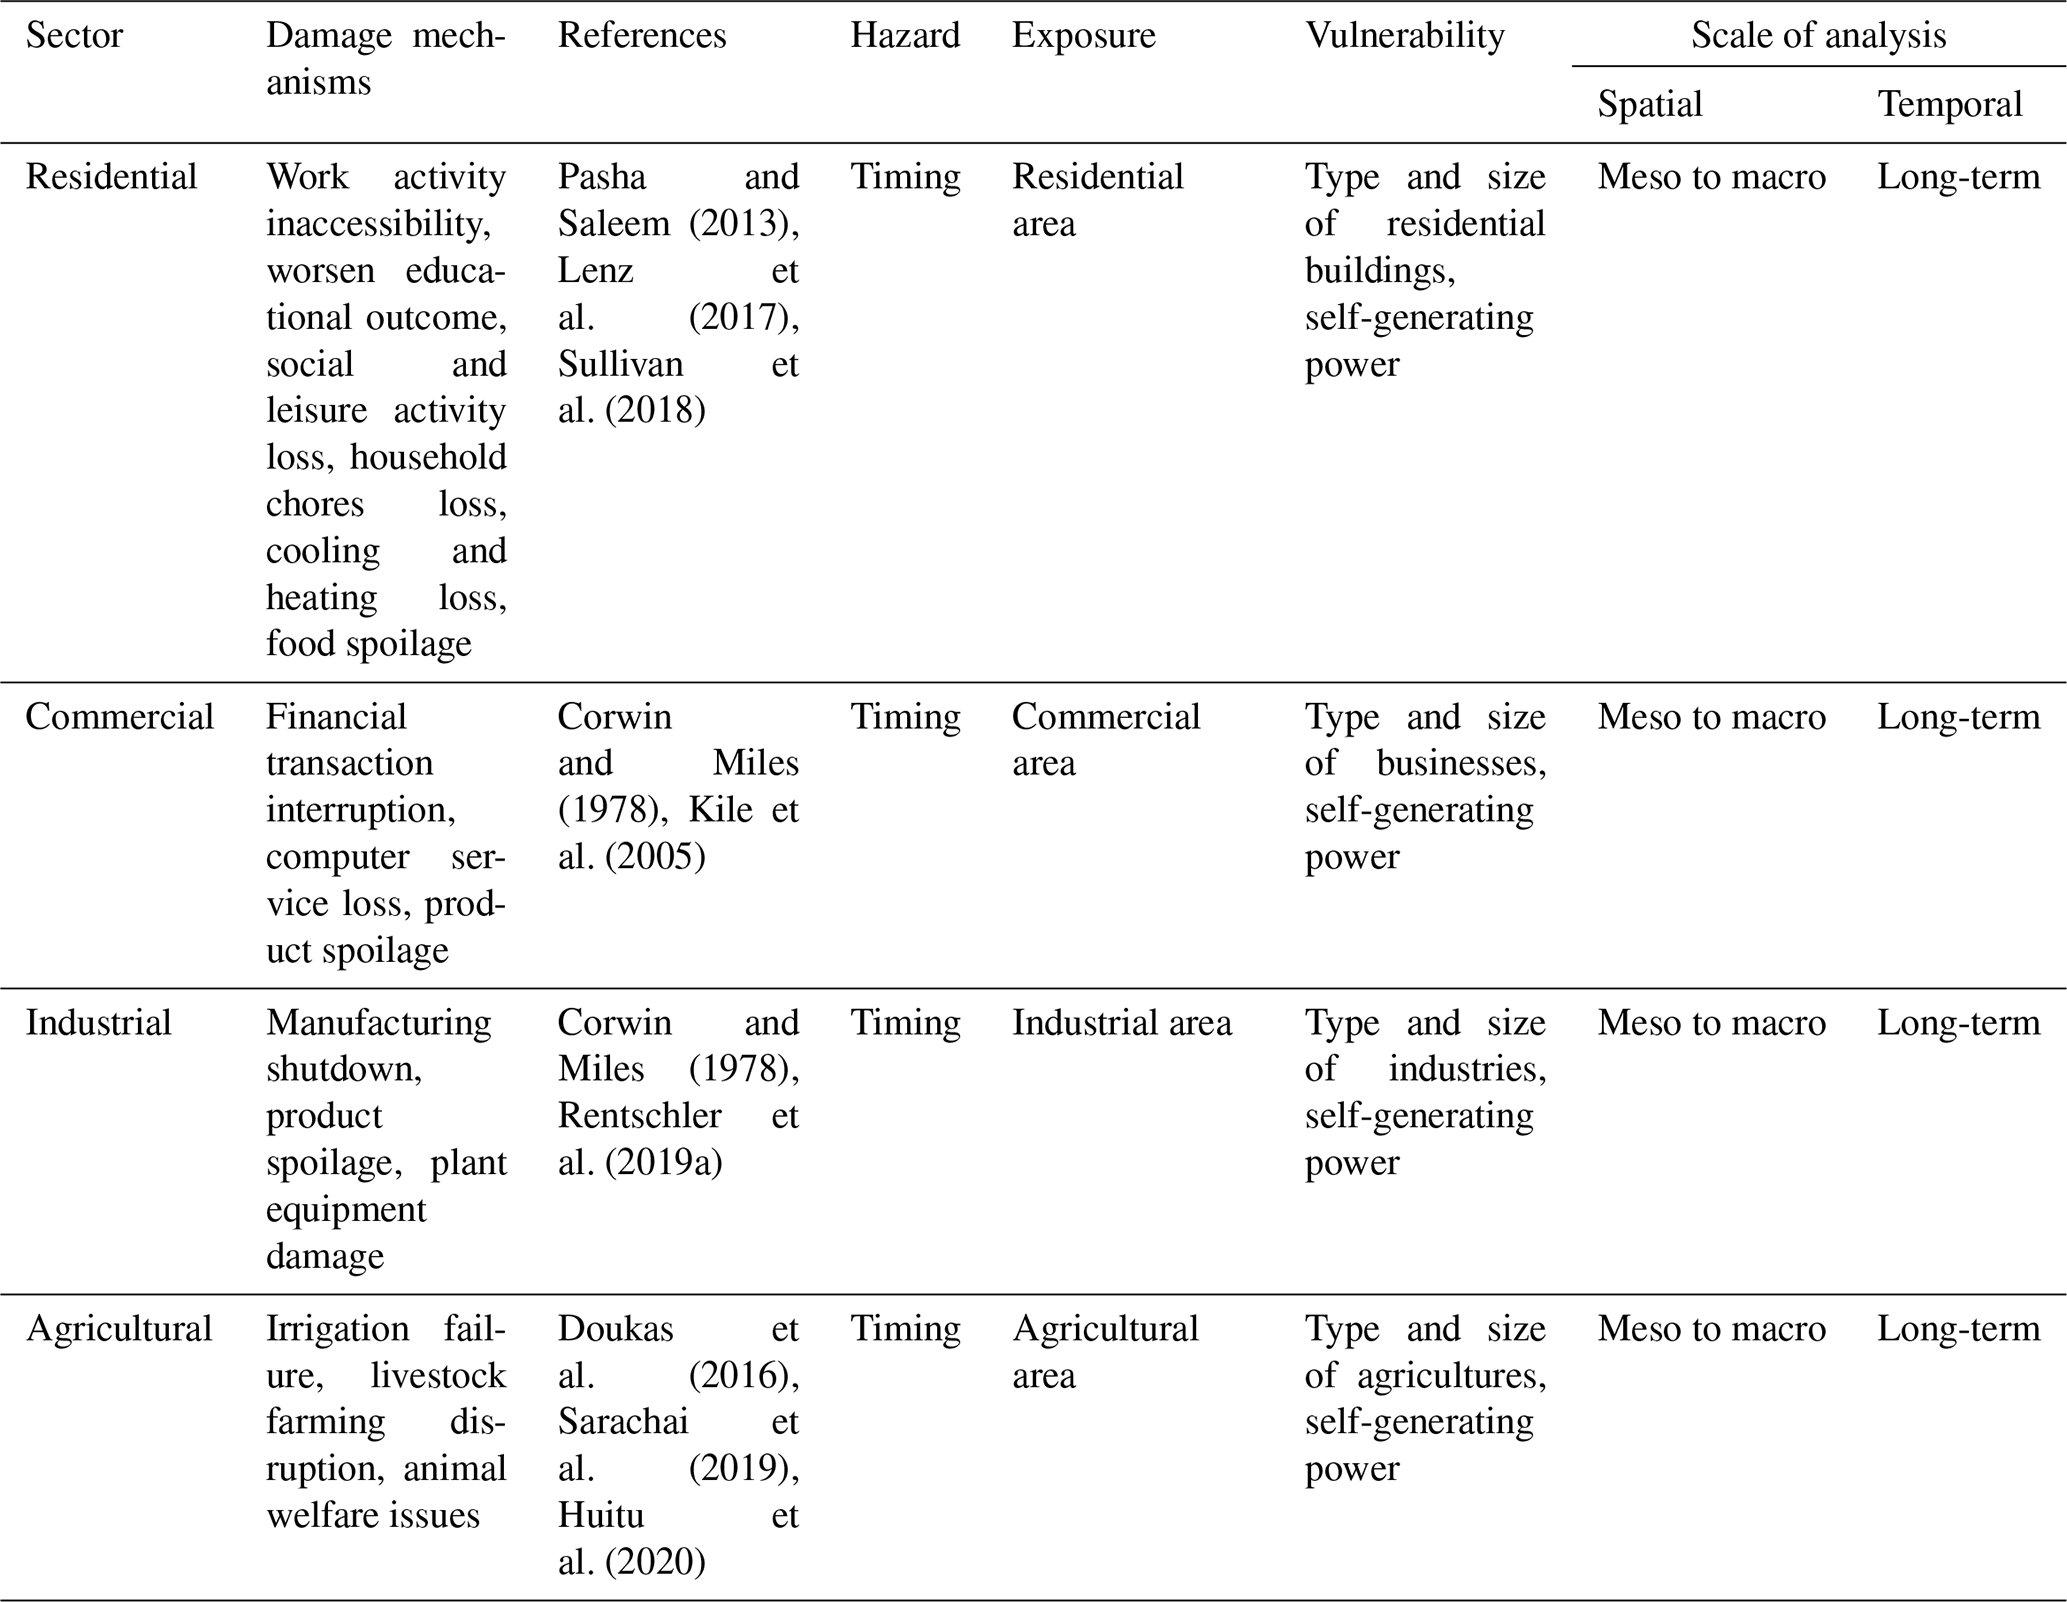
Residential
Power interruptions impedes the regular performance of household activities. They affect accessibility to work and income (Sullivan et al., 2018), children's educational outcome during night (Lenz et al., 2017), social and leisure activities, and household chores, such as cooking and cleaning, due to electronic appliances malfunction. Furthermore, they affect heating and air-conditioning, and result in food spoilage due to refrigeration failures, which, in turn, may have heath implications (Pasha and Saleem, 2013). Power interruption impacts on residential sector depend on the timing of flood occurrence (hazard parameter), the residential area (exposure parameter), the type and size of residential buildings and the possession of self-generating power (vulnerability parameters). Their modelling must supply the number and type of affected residential buildings and the duration of power interruption.
Commercial
Power interruptions restrict the ability to trade goods and services. Commercial activities come to a standstill because financial transactions cannot be completed due to loss of electronic services, as for example in banking services. The ever-growing dependency of business on computer-based systems makes them particularly susceptible to the failure of several key functions due to damage to computers, to their peripheral equipment, and loss of electronic data (Corwin and Miles, 1978). Food service facilities must cope with product spoilage, due to the loss of refrigeration (Kile et al., 2005). Power interruption impacts on commercial sector depends on the timing of flood occurrence (hazard parameter), the commercial area (exposure parameter), the type and size of businesses and the possession of self-generating power (vulnerability parameters). Their modelling must supply the number and type of affected businesses and the duration of power interruption.
Industrial
Power interruptions hinder industrial production capacity, affecting the proper functioning of supply chains. Industrial activities suffer manufacturing shutdown, product spoilage, and damages on plant equipment (Corwin and Miles, 1978). Larger industries are prone to experience fewer power interruptions, whereas at the same time power interruptions are significantly more common within certain industrial activities than others, due to the effective measures taken to prevent the spreading of damage and the investment on backup generators (Rentschler et al., 2019a). Power interruption impacts on industrial sector depends on the timing of flood occurrence (hazard parameter), the industrial area (exposure parameter), the type and size of industries and the possession of self-generating power (vulnerability parameters). Their modelling must supply the number and type of affected industries and the duration of power interruption.
Agricultural
Power interruptions prevent farmers from carrying out many agricultural activities that rely on electricity. Particularly, they disrupt the irrigation of agricultural land and have negative consequences for the rearing of livestock products (Doukas et al., 2016). For example, modern dairy farms suffer significant milk production losses (Huitu et al., 2020). Moreover, long-term power interruptions may cause issues in the animals' well-being. In poultry farms, they are responsible for the malfunction of evaporator cooling system due to fan failures, which is a key determinant of animal welfare (Sarachai et al., 2019). Power interruption impacts on agricultural sector depends on the timing of flood occurrence (hazard parameter), the agricultural area (exposure parameter), the type and size of agricultures and the possession of self-generating power (vulnerability parameters). Their modelling must supply the area and type of affected agricultures and the duration of power interruption.
Table 3Systemic damage mechanisms for residential, commercial, industrial, and agricultural sectors.
Water supply
Power interruptions affect water supply networks as pumping stops in lifting stations, thereby leading to a drop in water pressure and subsequent infections. Exception are parts that are gravity fed or use backup diesel generators to maintain their functionality. For example, water tanks can supply water to customers even during power interruptions due to the hydrostatic pressure produced by their elevation (Corwin and Miles, 1978). However, water supply networks are subject to long-term power interruptions because the power demand of lifting stations to pump the water into the tank cannot be met over the time (Holden et al., 2013). Moreover, rural areas that rely on drinking wells loss their accessibility on potable water when power supply is disrupted, as water pumps stop functioning (Miles et al., 2014). Pressure fluctuations or low pressures may lead to contamination of water from leakage orifices and air vacuum valves (Ebacher et al., 2012). In case of pressure loss, boil-water advisories are issued, although public confusion may be created due to impaired information access and the difficulties in compliance with these advisories without electricity (Kile et al., 2005; Albeverio et al., 2006; Miles et al., 2014). Power interruption impacts on water supply depend on the timing of flood occurrence (hazard parameter), the service area of water supply network (exposure parameter), the topology and configuration of water supply network, its interconnections with the power grid, and the possession of self-generating power (vulnerability parameters). Their modelling must supply the disrupted service area of water supply network, the number of affected water towers and pumping stations, and the duration of water shortage.
Information and Communications Technology (ICT)
Although telecommunication networks dispose of a high level of reliability, they are likely to gradually lose their functionality over the time during long-term power interruptions (O'Reilly et al., 2006; Petermann et al., 2011). The consequences are expected to be devastating, including telephone service interruption, Internet breakdown, and failure of broadcast and press media. In fixed-network telephony, telephones that do not rely on external power supply stop working immediately, while telephones capable of operating on emergency power can still operate until the switching centres fail. The mobile telephone system seems to be more resilient to power interruptions than the fixed-network telephony because mobile switching centres are usually protected by backup power generation and cell towers go out of service only when the backup batteries run out (Hiete et al., 2010). Despite that, mobile telephone system functionality gradually collapses or becomes heavily overloaded after a while because of the increased traffic volume (Reuter, 2014).
Regarding Internet, digital devices that rely on power supply and do not have backup batteries (e.g., desktop computer, servers) stop working immediately, whereas battery-operated devices (e.g., laptops, smartphones) may still work for a few more days, depending on their battery charge level. However, similarly to telephony, the Internet access is not possible if switching centres have lost their functionality. Data centres for the Internet provision and data storage stop operating when there is a shortage of fuel for the emergency power generation (Hiete et al., 2010). Concerning media, although television companies can continue broadcasting, it is generally impossible for households to receive television signals, as they are unlikely to have emergency power supply. Newspaper publishing houses are in most cases able to maintain their operation with the aid of emergency power generators, the extent of which depends on what degree replenishments of fuel can be ensured. Radio broadcasting proved to be reliable source of information, as radio can transmit continuously, and it can be received via battery-operated devices (Petermann et al., 2011).
Power interruption impacts on ICT depend on the timing of flood occurrence (hazard parameter), the service area of telecommunication network (exposure parameter), the topology and configuration of telecommunication network, its interconnections with the power grid, and the possession of self-generating power (vulnerability parameters). Their modelling must supply the disrupted service area of telecommunication network, the number of affected mobile switching centres, cell towers, and data centres, and the duration of outage.
Transportation
Means of transportation are heavily reliant on power supply due to the complexity of traffic management and signals. Airlines stop providing transportation services when power interruptions affect air traffic control centres. Even if airports remain open, flights may be cancelled, delayed, or diverted (McMillan, 2014). Ferries, cruise ships, and ocean liners grind to a halt docking and embarkation to passenger terminal (Corwin and Miles, 1978). Rapid transit comes to a standstill without electricity, imprisoning thousands of people in subways stuck in tunnels (Zimmerman, 2005). Rail transportation is limited or stopped due to the disruption of power supply to electrified routes (Chovančíková and Dvořák, 2019). Buses and cars face safety problems and major delays to roads. Traffic lights that do not have backup batteries switch off or revert to flashing red, causing extensive traffic congestions and collisions. Lastly, filling stations cannot pump fuel due to lack of electricity, making consumers, repair crews, and law enforcement unable to access gasoline and diesel (Albeverio et al., 2006; Miles et al., 2014). Power interruption impacts on transportation depend on the timing of flood occurrence (hazard parameter), the service area of transportation network (exposure parameter), the topology and configuration of transportation network, its interconnections with the power grid, and the possession of self-generating power (vulnerability parameters). Their modelling must supply the disrupted service area of transportation network, the number of delayed commuters, and the traffic delay.
Wastewater treatment
Power interruptions affect treatment and pumping of wastewater in case of inadequate backup generation. In treatment plants, wastewater bypasses the treatment process and flow as raw, while in pumping stations, wastewater is leaking (Miles et al., 2014) or wastewater does not flow and eventually returns to lower entry points (Corwin and Miles, 1978). All phenomena have negative consequences for health and the environment due to the resulting contamination (Corwin and Miles., 1978; Kile et al., 2005; Beatty et al., 2006; Miles et al., 2014). Power interruption impacts on wastewater treatment depend on the timing of flood occurrence (hazard parameter), the service area of wastewater treatment network (exposure parameter), the topology and configuration of wastewater treatment network, its interconnections with the power grid, and the possession of self-generating power (vulnerability parameter). Their modelling must supply the disrupted service area of wastewater treatment network and the number of affected pumping stations and treatment plants.
Health care
Health care provision in public and private facilities is disrupted by power interruptions. Traditionally, these facilities have emergency backup generators that are designed to operate during periods of crises and disasters. However, long-term power interruptions may render emergency backup generators insufficient to ensure the proper functioning of critical health care activities, including operating rooms, intensive care facilities, and emergency rooms. Equally significant are the effects on other essential facilities that may not be maintained by emergency power, namely x-ray rooms, elevators nurse call systems, air conditioning in emergency and operating rooms, medical gas and fire alarms, and premature nurseries (Corwin and Miles, 1978). Essential medical devices used in health care, such as ventilators, oxygen conservers, nebulizers, and airway suction devices, rely on power supply. Consequently, power interruptions increase the emergency medical services calls and emergency department visits from patients who rely on these electrically powered medical devices (Greenwald et al., 2004; Prezant et al., 2005; Freese et al., 2006; Klinger et al. 2014). Finally, laboratory specimen and vaccine spoilage occur due to loss of refrigeration (Beatty et al., 2006). Power interruption impacts on health care depend on the timing of flood occurrence (hazard parameter), the service area of health care facilities (exposure parameter), the interconnections between the health care facilities and power grid and the possession of self-generating power (vulnerability parameters). Their modelling must supply the number of affected patients.
Emergency service
Police and fire departments have a vital role to play during power interruptions, as they are responsible for responding to emergency calls from people seeking help. However, the disruption of power supply severely affects the proper functioning of emergency services, resulting in long delays in response actions (Corwin and Miles, 1978). Power interruption impacts on emergency services depend on the timing of flood occurrence (hazard parameter), the service area of emergency service facilities (exposure parameter), the interconnections between the emergency service facilities and power grid and the possession of self-generating power (vulnerability parameters). Their modelling must supply the disrupted service area of the emergency service facilities, the number of affected police and fire departments, and the emergency response time.
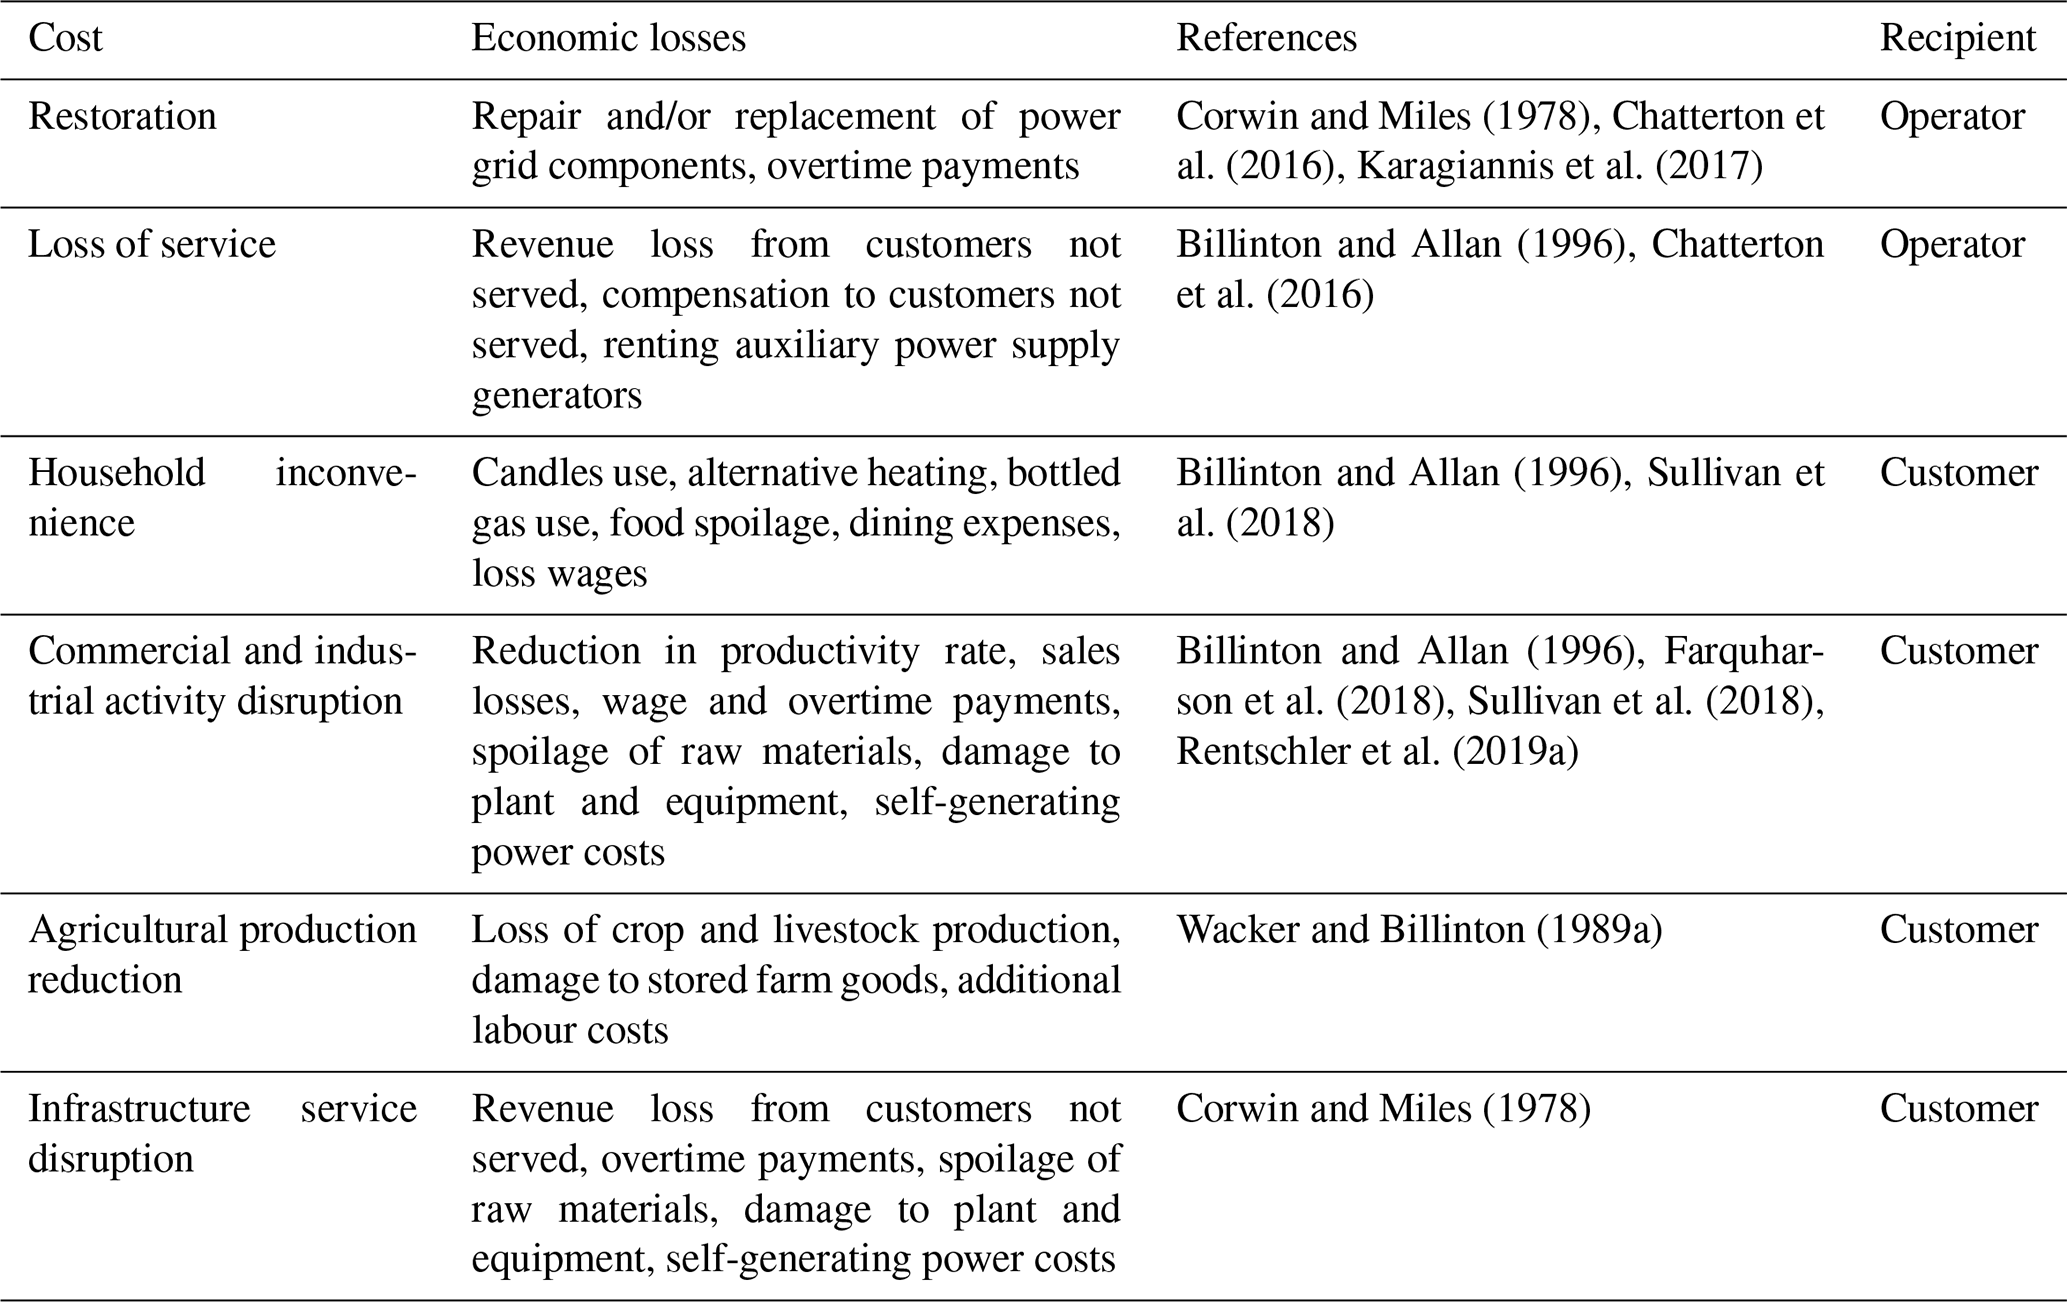
2.2 Economic model
The costs of power outages are broadly divided into two categories: the one concerning the grid operators and that concerning the society or the customers (Billinton and Allan, 1996). In a similar way, the economic model includes sub-models for the estimation of both kinds of economic losses (Table 5). More specifically, economic losses are expressed as the sum of the costs due to the repair or replacement of power grid components (RC), the economic losses related to the loss of power supply services to customers (LSC), the inconvenience of households (HIC), the disruption of commercial and industrial activities (CIADC), the reduction in agricultural production (APRC), and the disruption of other infrastructures services (ISDC).
2.2.1 Operator losses
The costs borne by operators of power grids concern, on the one hand, the costs due to the physical damage of components, on the other hand, the economic losses linked to the loss of transmission and/or distribution network functionality.
Restoration cost
Physical damage incurs to power grids due to floods lead to costly repairs or replacements of their components (Chatterton et al., 2016). Floodwater may cause irreversible damage to electrical equipment of the facilities which needs to be replaced or complete disassembled and thoroughly cleaned before it can be put back into service. The amount and type of equipment affected is a major determinant of restoration effort (Karagiannis et al., 2017). Operators bear additional costs arising from the overtime payments of their workers to ensure the restoration of power supply (Corwin and Miles, 1978). Economic losses due to repair or replacement of power grid components depend on the number and type of components affected (input variables). Their estimation requires relevant information regarding the depreciated and/or replacement values of components and the salary range of workers.
Loss of service cost
Power interruptions induce economic losses to grid operators due to the loss of services that they provide. They include revenue losses due to non-power supply, compensation payments to customers not served under insurance contracts, and increased expenditure due to maintenance costs (i.e., renting of auxiliary power supply generators) to avoid the prolongation of power interruption (Billinton and Allan, 1996; Chatterton et al., 2016). Economic losses due to loss of power supply services depend on the power interruption duration and the number and type of customers affected (input variables). Their estimation requires relevant information regarding the electricity price, the compensation cost to customers, and the generator rental price.
2.2.2 Customer losses
Power interruption costs from the customer perspective varies and are related, on the one hand, to the number and type of customers affected, and, on the other hand, to the duration, frequency, and occurrence time (i.e., day, week, and season) of power interruption (Wacker and Billinton, 1989b). For this reason, the separate modelling and analysis of each customer category is essential.
Household inconvenience cost
Power interruptions entail substantial costs on residences due to the disruption of household activities. They produce inconvenience or hassle and imply extra expenses (Billinton and Allan, 1996; Sullivan et al., 2018). Inconvenience costs are associated with the use of candles for lighting, alternative heating, or the use of bottled gas for cooking. Extra expenses include food spoilage due to loss of refrigeration, dining out, or losses of wages due to the lost time in case of working at home. Economic losses due to the inconvenience of households depend on the power interruption duration and the number and type of residential customers affected (input variables). Their estimation requires relevant information regarding the market prices of products and the salary range of residents.
Commercial and industrial activity disruption cost
Power interruptions impose significant costs on businesses and industries due to the disruption of their daily activities. Their productivity rate decreases as the spoilage of raw materials and damage to manufacturing plant or equipment force them to stop production or at least slow it down, operating below their full capacity. Consequently, additional labour costs arise, such as wages to staff who is unable to work or overtime payments to restore operations (Billinton and Allan, 1996; Sullivan et al., 2018). In addition, businesses and industries are subject to sales losses due to the restricted ability to trade and compete. They usually invest in diesel backup generators to cope with power interruptions (Rentschler et al., 2019a), but diesel backup power generation is much more expensive than conventional power grid supply (Farquharson et al., 2018). Economic losses due to the disruption of commercial and industrial activity depend on the power interruption duration and the number and type of commercial and industrial customers affected (input variables). Their estimation requires relevant information regarding a gross economic measure, the salary range of employees, and the generator rental price.
Agricultural production reduction cost
The effects of power interruption have a strong impact on agriculture. This is mainly due to the loss of crop and livestock production, damage caused to stored farm goods, and additional labour costs (Wacker and Billinton, 1989a). Economic losses due to the reduction in agricultural production depend on the power interruption duration and the number and type of agricultural customers affected (input variables). Their estimation requires relevant information regarding a gross economic measure.
Infrastructure service disruption cost
The service disruption of power grids affects the normal operation of other infrastructures causing significant economic losses. Water supply and wastewater treatment facilities experience costs due to damage to plant or equipment. Transportation is subject to revenue losses from customers not served, overtime payments of their employees, and additional costs to run a backup generation. Hospitals face economic losses including overtime payments due to increase emergency room activity, costs related to backup generation, costs of food and medical specimen spoilage caused by the lack of refrigeration, and revenue losses from patients not served in case of a private health system. Emergency services are subject to overtime payments because police and fire forces are required to be on duty over the period of power interruption, in the case of private services (Corwin and Miles, 1978). Economic losses due to the disruption of other infrastructure services depends on the power interruption duration and the number and type of infrastructures affected (input variables). Their estimation requires relevant information regarding a gross economic measure, the salary range of employees, and the generator rental price.
As fully explained by the conceptual model, modelling the physical and functional vulnerability of power grid components to floods, the consequent power outage of the network, and, in turn, the cascading effects across the economic activities is complex, asking for multidisciplinary expertise and multi-scale analysis. In fact, comprehensive modelling of damage to power grids is still a challenging task. This is mainly due to, on the one hand, the structural and dynamic complexity of power grids, and, on the other hand, the lack of knowledge and data to investigate damage mechanisms and to calibrate and validate models. Section 3 provides a review of the methodologies found in literature to improve the understanding of existing modelling approaches, challenges, and limitations for the estimation of direct, indirect, and systemic flood damage to power grids. The investigation of methodologies for the estimation of the resulting economic losses is outside the scope of this study, as more related to the economic domain.
3.1 Direct damage
The estimation of direct damage to power grids is highly associated with the assessment of physical and functional vulnerability of their components. Physical vulnerability concerns the probability of a network component being physically damaged, while functional vulnerability refers to the probability of a network component to suffer functional failure.
The assessment of physical vulnerability is usually performed with the use of damage functions. Damage functions describe the relationship between flood hazard parameters and damage ratio of components (with respect to their exposed value). Several damage functions are now available in the literature for network infrastructures, which can be distinguished into two main categories according to their scale of analysis: meso-scale or micro-scale. At the meso-scale, damage is computed per homogeneous land use areas (i.e., considering the exposed surface area occupied by the infrastructures). Typical examples are the Damage Scanner (Klijn et al., 2007), the Flemish model (Vanneuville et al., 2006), the Rhine-Atlas (ICPR, 2001), and the JCR model (Huizinga, 2007). However, these models do not distinguish among different types of infrastructures, but a single depth–damage function is considered for all typologies. The classification of network infrastructures into different types is allowed by Hazus Flood Model (Hazus) (FEMA, 2022) and Multi-Coloured Manual (MCM) (Penning-Rowsell et al., 2013), which follow object-based approaches at the micro-scale. The MCM provides an absolute depth–damage function for wastewater treatment facilities. The Hazus estimates physical damage to water supply, wastewater treatment, natural gas networks, and is unique in the physical vulnerability assessment of power grid components, classified as: power plants, substations, and distribution circuits (i.e., a unified system including towers or poles and lines or cables).
The assessment of functional vulnerability is performed with the use of fragility curves. Fragility curves express the relation between flood hazard parameters and failure probability of components. Multiple or binary (functionality thresholds) failure states are assigned which derive from empirical data or expert knowledge. For instance, power plants manifest multi-state behaviour because their overall performance can settle on different levels of the nominal capacity, depending on the portion of operative generators that are composed of. At the same time, other components such as overhead lines and underground cables have binary states: normal or failed. Espinoza et al. (2016) provide fragility curves that evaluate the multiple failure state of power plants and substations compared to historical data of accumulated rainfall. The Hazus, instead, assign binary failure states, derived from a less refined evaluation of the functional vulnerability, by determining specific values of water depth over which substations and power plants becomes inoperable (functionality thresholds). Fragility curves of binary failure states (i.e., substations are flood-proofed and fully working up to a certain water depth) were also applied in the study conducted by Dullo et al. (2021), who evaluated the functional vulnerability of substations under potential climate change scenarios and assessed the adequacy of flood protection measures.
Despite direct damage is the most investigated one and considerable research effort has been made to develop depth–damage functions and fragility curves for the components of power grid, still major challenges and limitations arise from the literature review that hamper reliable and comprehensive estimations. The first is related to depth–damage functions, in particular, to the absence of separate relationships for components with distinct damage mechanisms (see Sect. 2.1.1). The second concerns fragility curves, as these are still not able to assess the failure of all components: towers, poles, and cables which are subject to erosion are not considered vulnerable and therefore excluded from the assessment. The third regards the correlation of both with a limited number of hazard parameters (accumulated rainfall and water depth are yet the only options): flow velocity, duration of inundation, and debris/sediments amount may also be considered.
3.2 Indirect damage
The estimation of indirect damage to power grids is strongly related to the performance assessment of transmission and distribution networks. On the base of the approaches used to carry out the assessment, four main categories of models can be identified that view this complex problem from different perspectives: topological, logical, phenomenological, and flow methods (Zio, 2016).
Topological methods (e.g., graph theory, statistical physics, etc.) describe the structural connectivity of power grids by a graph composed of nodes and links. Logical methods (e.g., hierarchical logic trees, game theory, etc.) record the logic of power grid functionality in perturbations and diagram all the possible combinations of components failure. Both approaches assess network performance by considering discrete failure states for each component, which in most cases are binary (i.e., fully operative, or completely failed). They are commonly used to examine network functionality and cascading failures within it, as well as to identify the most critical components by estimating centrality measures of nodes (e.g., degree, closeness, betweenness, clustering coefficient) or by highlighting critical links, from a topological or logical perspective, respectively. Nonetheless, both these two approaches are unable to interpret the dynamic behaviour of the network, which emerge from its functional properties (i.e., level of power supply services exchange between nodes in the graph), but only evaluate the structural and logical relations between the components, based on its static formulation. To overcome this limitation, phenomenological or flow methods are preferred. Phenomenological methods (e.g., input–output models, agent-based models, etc.) capture the dynamics of interrelated operations between the components of power grids and with the environment or society. Flow methods based on simulation models depict, in a way closer to reality, the power flow between nodes in the graph, describing the physical processes of network functionality, monitoring, and control. Power flow analysis is performed either by Active Current (AC) power flow equations (i.e., electric current periodically switches direction) or Direct Current (DC) approximation (i.e., electric current constantly flows in one direction). Phenomenological and flow approaches measure the level of power grids response to threats by relying on metrics that estimate the amount of power not supplied or the fraction of demand served.
The implementation of the four categories of models to flood-related problems is, however, limited and unbalanced. For instance, Bollinger and Dijkema (2016) evaluated transmission network performance against floods adopting a flow method. In particular, the authors derived water depth values from publicly available flood risk data (for a dike breach scenario) and determined binary failure states to substations with an empirical functionality threshold, based on the height of flood protection system. The study represented transmission network by a set of interconnected components assigned with electrical properties (i.e., generation capacity and peak demand) and analysed power flow by solving the DC approximation. Network performance was calculated through structural vulnerability analysis (i.e., evaluates how the successive removal of nodes or edges from a network affects its performance; Albert et al., 2004), in terms of the fraction of demand served across the range of flood magnitudes (i.e., defined as the increased number of failed substations).
Likewise, Espinoza et al. (2016) adopted a flow method within a multi-phase framework to evaluate the performance of transmission network during flooding events. The authors characterized flood hazard by defining its magnitude, probability of occurrence, and spatiotemporal variability, related to the accumulated rainfall. The failure probability of power plants and substations was estimated by applying the fragility curves mentioned in the previous Sect. 3.1. Finally, the network performance was evaluated, carrying out sequential Monte Carlo simulations and using AC optimal power flows at each simulation step. The whole process was described in a time-dependent way by measuring the expected power not supplied within the event period.
Vasenev et al. (2016) developed, instead, a procedure to qualitatively investigate the performance of distribution network upon the occurrence of a flood, following a logical approach. According to the proposed step-by-step process, the functional vulnerability of components can be assessed using the functionality thresholds of the Hazus, by essentially linking the vulnerability parameters of power plants and substations (i.e., flood protection system and equipment height) to the hazard parameters (i.e., return period and water depth). To account for the network functionality, the study captured the logical connections of components, taking also into consideration the (inter)dependencies between overhead lines and underground cables. In doing so, the components that expected to remain properly in operation during the event are listed.
Two main drawbacks have been identified to the abovementioned methodologies aimed at investigating the loss of power grid functionality, when exposed to floods. First, there is an absence of studies that evaluate network performance from a topological perspective or by phenomenological methods. Studies mainly applied simulation-based (Bollinger and Dijkema 2016; Espinoza et al., 2016) or even logical approaches (Vasenev et al., 2016), while some of them went a step further, by estimating other crucial features, such as the response and restoration process (Espinoza et al., 2016). This, however, hamper the analysis of indirect damage given that the sensitive data required for the complex modelling of power flow are hard to obtain and the computational cost is extremely high. Second, there is a lack of fragility curves that are a necessary input for estimating indirect damage. Consequently, the authors are forced to empirically develop their own fragility curves or to make over-simplified assumptions and approximations that nevertheless introduces uncertainty into the modelling results.
3.3 Systemic damage
The estimation of systemic damage to power grids focuses on the assessment of power interruptions impact on costumers due to the dependencies and interdependencies among power grids and economic activities.
The (inter)dependencies with the residential, commercial, industrial, and agricultural sectors can be modelled through analytical or synthetic approaches. Analytical approaches rely on the construction of a Voronoi diagram (Poljanšek et al., 2012) to assign people served by or customers connected to substations and cabins, where data derive either from spatial information of population densities (e.g., census blocks) or through geospatial modelling of customer locations (e.g., Corine Land Cover (CLC) dataset), respectively. Synthetic approaches are based instead on simplified assumptions and hypotheses to fulfil the specific purpose of the study. In both cases, the resulting socio-economic impact is measured by the number of disconnected customers or people affected.
In the scientific literature, examples can be found with respect to both approaches. Bragatto et al. (2019), for example, developed a tool to estimate the impact of flood-induced power supply disruptions on the general connected customers. The procedure was applied to a real distribution network where the failure of cabins was predicted by evaluating, first, their exposure on different flood return periods, and second, their probability of failure by an empirical judgement of the operators. Graph theory (topological method) was adopted to evaluate network performance, providing the topology, typology of components, and the number of customers supplied by each cabin. The impact of power interruptions was assessed by estimating the number of disconnected customers, without however being clear on how this number was calculated, as well as about the categories of affected customers, probably due to privacy policy of the data provided by the operators.
Impacts of power interruption caused by floods on residential customers were investigated by Leandro et al. (2021). The authors estimated the hazard parameters required to evaluate the failure probability of both the outdoor and indoor network components, respectively, by a 2D flood model, and as a function of outdoor water depth. Functionality thresholds to cabins and electrical panels of residential buildings were attributed by field observations and professional experience. The layout of the synthetic distribution network (inspired by a real urban area due to data restriction) was established by a hierarchical representation of its components (logical method) that reflected the failure propagation from the cabins to the subordinate residential buildings. For the sake of simplicity, the study uniformly assigned to the cabins a sub-set of the real number of buildings found in the reference area, in agreement with the network demand. Finally, the power interruption impact was measured by the number of residential buildings remained without electricity during the event phase.
Karagiannis et al. (2019) approximated the impact of power interruptions on commercial and industrial customers. Information on hazard parameters (i.e., water depth, return period) was extracted from flood hazard maps and combined with the depth–damage functions provided by Hazus to estimate the physical damage. The functional failure of components was not assessed, but it was assumed that the operators switched off the substations located inside the inundation area once they received the flood warning. The study did not evaluate network performance, but only defined its structure by spatially distributing the transmission components (i.e., substations, lines). The service area disrupted when a substation is switched off is roughly estimated by determining its influence zone, using a Voronoi diagram. The combination of the affected area with the population density map yielded the number of people affected. After that, this number was multiplied by the gross domestic product for the duration of power interruption to finally express the economic losses in terms of the activity ceased on a per capita basis.
Similarly, Sánchez-Muñoz et al. (2020) investigated the power interruption impact on businesses and industries, this time, however, by assessing the failure probability of components, using the fragility curves of Hazus (functionality thresholds), and regarding a distribution network. Again, the authors estimated the economic losses in terms of the activity ceased on a per capita basis, this time, however, by multiplying this value also with the failure probability of each affected cabin.
Koks et al. (2019) developed a modelling framework to analyse the impact that power supply disruptions triggered by floods have on commercial activity, industrial production capacity, and agriculture. The study determined the functional vulnerability of substations by functionality thresholds that compare the water depth of different frequency floods (derived from hazard maps) with the height of flood protection system. No network structure was defined for the power grid, but only the spatial location of substations. The authors, first, derived detailed information from openly available dataset about the local employment levels of businesses, industries, and agricultures, and then combined this information with the CLC database to define their spatial location. After that, their dependency on the substations was mapped by constructing a Voronoi diagram. The authors showed that employment reduction due to power interruptions can be considered as an alternative measure of impact assessment. Finally, the economic losses were expressed in monetary terms through the estimation of the reduction in value added, making use of a macro-economic model.
Methodologies implemented to estimate the impact of power interruptions on interdependent infrastructure networks are many and have been detailed reviewed by Ouyang (2014). The author catalogued the approaches in a six classes taxonomy, where the methods are not classified on the level of granularity of the data but on the type of information used, including: empirical, agent-based, system dynamics, economic theory based, network-based, and other methods. Still, only empirical and network-based approaches have been adopted in flood-related studies.
In empirical approaches the analysis of the interdependencies is based on historical data or expert experience. An example is supplied by the study of Murdock et al. (2018) that proposed a method to quantify transmission network response to floods in a real area, accounting for its interdependencies with other infrastructure networks. The authors combined water depth values of flood hazard maps with functionality thresholds of substations (developed by site observations and available documentation of case studies) to get insight into their exposure and functional vulnerability. The configuration of the transmission network and the spatial location of its components were defined using open access data, without however being clear by the authors how network performance was evaluated. Afterwards, the cascading effects of power outage to interdependent telecommunications, rails, and roads were analysed through a tool developed by researchers following a workshop, in consultation with stakeholders. Finally, power interruption impact was plotted by a curve that graph the number of people affected by the disruption of all the infrastructures multiplied by the disruption duration versus the flood hazard frequency.
On the other hand, network-based approaches describe infrastructures as networks where nodes represent the connections among them (e.g., topological and flow methods). The study by Pant et al. (2018) can be quoted as an example. The authors presented an integrated framework to assess flood damage to power grids, quantifying the wider spatial impacts to interdependent infrastructures (i.e., water, wastewater, telecommunication, airport, and port). The flood hazard maps of the study area were extracted from a national assessment and used in the framework to assess the functional vulnerability of cabins, under the assumption that these fail once exposed to flood (i.e., binary failure states). Power grid was represented through a spatial network (i.e., a graph in which nodes and links are distributed in space), without evaluating its performance, where interdependent infrastructure networks and assets were connected to the cabins. Network demands were modelled in terms of the number of customers (derived from spatial population statistics) connected to each infrastructure asset, using a Voronoi diagram. The impact of power interruption was expressed in terms of the number of customers affected by the disruption of all the infrastructures.
Overall, the literature review highlights that extensive research has been conducted in recent years to develop methodologies for estimating the systemic damage; however, there are still knowledge and methodological gaps that should be addressed in future studies. First, there is no general framework in the literature that performs a comprehensive modelling and simulation analysis, capturing the full extent of the socio-economic impact on all customers categories. On average, research studies are concentrated on a specific customer category at a time, while some of them are not limited to evaluating systemic damage in physical units but also assess economic losses in monetary terms (Karagiannis et al., 2019; Koks et al., 2019; Sánchez-Muñoz et al., 2020). Second, the modelling approaches to evaluate network performance, if not neglected, are mainly based on empirical knowledge, which could however bring their transferability to different geographical and economic contexts into question.
Effective flood risk management requires a comprehensive knowledge of flood damage to all the exposed sectors. In recent years, there have been significant research efforts in better understanding and quantifying the damage mechanisms of power grids, when exposed to floods. Despite that, the available methodologies cannot yet be considered conclusive as they tend to focus primarily on a specific kind of damage, neglecting or estimating with over-simplified assumptions and tools the others (Sect. 3). Therefore, the need to develop a consolidated framework that is coherent and get the overall picture of the damaging phenomena arises, that is a tool allowing to (i) estimate flood damage to components, (ii) analyse the cascading effects and failures in the network, and (iii) assess the impact of power outage on customers.
In such a context, in this paper, we propose a conceptual model, derived from a thorough analysis of the literature, that sheds light on how to exhaustively assess flood damage to power grids. Its goal is to systemize and broaden the current knowledge about: (i) the kinds of expected damage (mechanisms), (ii) the hazard, exposure, and vulnerability parameters on which they depend on, (iii) the spatial and temporal scales of analysis required, (iv) the interconnections among the different types of damages, and (v) the different recipients of economic losses. As such, it can be easily applied to a variety of geographic and socio-economic contexts, for which specific modelling tools must be developed/implemented for the different damage components.
The development of conceptual model indicates that flood damage assessment to power grids requires the adoption of an interdisciplinary approach and the integration of multiple scales of analysis to deal with the complexity of damaging phenomena under investigation and capture the wide range of cascading effects that emerge; and the problem is even more complex if dynamic aspects are considered. In fact, network performance and its interdependencies with economic activities and other networks could differ under climate change conditions (i.e., increase in the frequency and intensity of floods), due to technological innovations (e.g., transformation to smart grids), socio-economic development (e.g., changes in production–demand balances), and the ever-changing legislation and policy.
The implementation of the conceptual model (i.e., its translation in coherent modelling tools) in real contexts provides decision-makers with a robust and informative tool that underlines all the expected damages in case of flooding of power grids (orange boxes in Fig. 1), as well as their explicative variables (blue, green, and red boxes/arrows in Fig. 1) and interconnections (orange arrows in Fig. 1). In doing so, it supports the identification of the most critical components of the grids and, accordingly, of the best mitigation strategies to be implemented. In detail, it would enhance the cost–benefit analysis of alternatives of intervention in the future, by enabling the comparison of ante-operam and post-operam expected damage. Several actors can take advantage of the conceptual model (i.e., grid managing operators to secure power supply, civil protection authorities to maintain the socio-economic order, insurers to reduce their exposure risk) for the identification of targeted structural (e.g., deployment of flood protection system, raising electrical equipment, raising ventilation holes, installing pumping equipment, sealing cables) and non-structural (e.g., selection of optimal dispatch strategies, use of mobile substations) actions (Abi-Samra and Henry, 2011; Costa and McAllister, 2017; Movahednia et al., 2022).
It is worth noting that, at present, the implementation of the conceptual model in real modelling tools struggle with critical challenges regarding the lack of knowledge and scarcity of data to calibrate and validate the modelling results. In fact, detailed modelling of infrastructure networks and damage requires a big amount of data that are usually difficult to gather, first, because they are related to different power grid systems (i.e., generation, transmission, and distribution), which span over multiple territories, often allocated to multiple jurisdictions, and second, because are considered sensitive by managing authorities as they concern national CIs (Rinaldi et al., 2001). In this regard, the adoption in the future of standardized frameworks to collect information is welcome.
No data sets were used in this article. Information about the conceptual model is available upon request.
Literature review: PA. Conceptual model: PA and DM. Writing (first draft): PA. Writing (final manuscript): PA and DM. Supervision of the research: DM.
The contact author has declared that neither of the authors has any competing interests.
Publisher's note: Copernicus Publications remains neutral with regard to jurisdictional claims in published maps and institutional affiliations.
This article is part of the special issue “Natural hazard impacts on technological systems and infrastructures (EGU2022 NH9.5 session)”. It is a result of the EGU General Assembly 2022, Vienna, Austria, 23–27 May 2022. The session series run from 2012 till 2022. It is an anniversary edition.
The authors would like to acknowledge, with gratitude, Francesco Ballio from the Department of Civil and Environmental Engineering of Politecnico di Milano, for his valuable suggestions and comments during the development of the study.
This paper was edited by Maria Bostenaru Dan and reviewed by Alexandru-Ionut Petrisor and one anonymous referee.
This research has been financially supported by the PhD scholarship “Verso una valutazione esaustiva del danno a supporto della mitigazione del rischio alluvioni” funded by Banca d'Italia and has been developed within the PhD program in Environmental and Infrastructure Engineering at Politecnico di Milano.
Abi-Samra, N. and Henry, W.: Actions Before... and After a Flood, IEEE Power Energy Mag., 9, 52–58, https://doi.org/10.1109/MPE.2010.939950, 2011.
Abi-Samra, N. C. and Malcolm, W. P.: Extreme weather effects on power systems, 2011 IEEE Power and Energy Society General Meeting, 24–28 July 2011, Detroit, MI, USA, 1–5, https://doi.org/10.1109/PES.2011.6039594, 2011.
Albert, R., Albert, I., and Nakarado, G. L.: Structural vulnerability of the North American power grid, Phys. Rev. E, 69, 025103, https://doi.org/10.1103/PhysRevE.69.025103, 2004.
Albeverio, S., Jentsch, V., and Kantz, H. (Eds.): Extreme Events in Nature and Society, The Frontiers Collection, Springer Berlin, Heidelberg, https://doi.org/10.1007/3-540-28611-X, 2006.
Azzolin, A., Dueñas-Osorio, L., Cadini, F., and Zio, E.: Electrical and topological drivers of the cascading failure dynamics in power transmission networks, Reliab. Eng. Syst. Safe., 175, 196–206, https://doi.org/10.1016/j.ress.2018.03.011, 2018.
Beatty, M., Phelps, S., Rohner, C., and Weisfuse, I.: Blackout of 2003: Public Health Effects and Emergency Response, Public Health Rep., 121, 36–44, https://doi.org/10.1177/003335490612100109, 2006.
Billinton, R. and Allan, R.N.: Reliability Evaluation of Power Systems, Springer New York, NY, https://doi.org/10.1007/978-1-4899-1860-4, 1996.
Boggess, J. M., Becker, G. W., and Mitchell, M. K.: Storm & flood hardening of electrical substations, 2014 IEEE PES T&D Conference and Exposition, Chicago, 14–17 April 2014, IL, USA, 1–5, https://doi.org/10.1109/TDC.2014.6863387, 2014.
Bollinger, L. A. and Dijkema, G. P.: Evaluating infrastructure resilience to extreme weather – the case of the Dutch electricity transmission network, Eur. J. Transp. Infrastruct. Res., 16, 214–239, https://doi.org/10.18757/ejtir.2016.16.1.3122, 2016.
Bombelli, I., Molinari, D., Asaridis, P., and Ballio, F.: The “Flood Damage Models” repository, in: 4th European Conference on Flood Risk Management, FLOODrisk 2020, 22–24 June 2021, Virtual Conference, https://doi.org/10.3311/FloodRisk2020.11.3, 2021.
Booth, J., Drye, M., Whensley, D., McFarlane, P., and McDonald, S.: Future of flood resilience for electricity distribution infrastructure in Great Britain, CIRED – Open Access Proceedings Journal, 2017, 1158–1161, https://doi.org/10.1049/oap-cired.2017.0405, 2017.
Bragatto, T., Cresta, M., Cortesi, F., Gatta, F. M., Geri, A., Maccioni, M., and Paulucci, M.: Assessment and Possible Solution to Increase Resilience: Flooding Threats in Terni Distribution Grid, Energies, 12, 744, https://doi.org/10.3390/en12040744, 2019.
Bubeck, P., de Moel, H., Bouwer, L. M., and Aerts, J. C. J. H.: How reliable are projections of future flood damage?, Nat. Hazards Earth Syst. Sci., 11, 3293–3306, https://doi.org/10.5194/nhess-11-3293-2011, 2011.
Buriticá Cortés, J. A. M., Sánchez-Silva, M., and Tesfamariam, S.: A hierarchy-based approach to seismic vulnerability assessment of bulk power systems, Struct. Infrastruct. Eng., 11, 1352–1368, https://doi.org/10.1080/15732479.2014.964732, 2015.
Chatterton, J., Clarke, C., Daly, E., Dawks, S., Elding, C., Fenn, T., Hick, E., Miller, J., Morris, J., Ogunyoye, F., and Salado, R.: The costs and impacts of the winter 2013 to 2014 floods, Environmental Agency, Bristol, SC140025/R1, 2016.
Chovančíková, N. and Dvořák, Z.: Effect of a power failure on rail transport, Transp. Res. Procedia, 40, 1289–1296, https://doi.org/10.1016/j.trpro.2019.07.179, 2019.
Corwin, J. L. and Miles, W. T.: Impact assessment of the 1977 New York City blackout. Final Report, U.S. Department of Energy, United States, https://doi.org/10.2172/6584645, 1978.
Costa, R. E. and McAllister, G. R.: Substation flood program and flood hardening case study, 2017 IEEE Power & Energy Society General Meeting, 16–20 July 2017, Chicago, IL, USA, 1–5, https://doi.org/10.1109/PESGM.2017.8273905, 2017.
Dawson, R. J., Thompson, D., Johns, D., Wood, R., Darch, G., Chapman, L., Hughes, P. N., Watson, G. V. R., Paulson, K., Bell, S., Gosling, S. N., Powrie, W., and Hall, J. W.: A systems framework for national assessment of climate risks to infrastructure, Philos. T. Roy. Soc. A, 376, 20170298, https://doi.org/10.1098/rsta.2017.0298, 2018.
Doukas, H., Xidonas, P., Angelopoulos, D., Askounis, D., and Psarras, J.: Distribution transformers failures: How does it cost? Evidence from Greece, Energy Syst., 7, 601–613, https://doi.org/10.1007/s12667-015-0186-0, 2016.
Dullo, T. T., Darkwah, G. K., Gangrade, S., Morales-Hernández, M., Sharif, M. B., Kalyanapu, A. J., Kao, S.-C., Ghafoor, S., and Ashfaq, M.: Assessing climate-change-induced flood risk in the Conasauga River watershed: an application of ensemble hydrodynamic inundation modeling, Nat. Hazards Earth Syst. Sci., 21, 1739–1757, https://doi.org/10.5194/nhess-21-1739-2021, 2021.
Ebacher, G., Besner, M.-C., Prévost, M., and Allard, D.: Negative Pressure Events in Water Distribution Systems: Public Health Risk Assessment Based on Transient Analysis Outputs, Water Distribution Systems Analysis 2010, 471–483, https://doi.org/10.1061/41203(425)45, 2012.
Espinoza, S., Panteli, M., Mancarella, P., and Rudnick, H.: Multi-phase assessment and adaptation of power systems resilience to natural hazards, Electr. Power Syst. Res., 136, 352–361, https://doi.org/10.1016/j.epsr.2016.03.019, 2016.
Farquharson, D., Jaramillo, P., and Samaras, C.: Sustainability implications of electricity outages in sub-Saharan Africa, Nat. Sustain., 1, 589–597, https://doi.org/10.1038/s41893-018-0151-8, 2018.
Feeney, C. J., Godfrey, S., Cooper, J. R., Plater, A. J., and Dodds, D.: Forecasting riverine erosion hazards to electricity transmission towers under increasing flow magnitudes, Clim. Risk Manag., 36, 100439, https://doi.org/10.1016/j.crm.2022.100439, 2022.
FEMA: Hazus Flood Model Technical Manual, Federal Emergency Management Agency, Washington, D.C., https://www.fema.gov/sites/default/files/documents/fema_hazus-flood-model-technical-manual-5-1.pdf (last access: 6 June 2023), 2022.
Ferrario, E., Pedroni, N., and Zio, E.: Evaluation of the robustness of critical infrastructures by Hierarchical Graph representation, clustering and Monte Carlo simulation, Reliab. Eng. Syst. Safe., 155, 78–96, https://doi.org/10.1016/j.ress.2016.06.007, 2016.
Forzieri, G., Bianchi, A., Batista e Silva, F., Marin Herrera, M. A., Leblois, A., Lavalle, C., Aerts, J. C. J. H., and Feyen, L.: Escalating impacts of climate extremes on critical infrastructures in Europe, Glob. Environ. Change, 48, 97–107, https://doi.org/10.1016/j.gloenvcha.2017.11.007, 2018.
Freese, J., Richmand, N. J., Silverman, R. A., Braun, J., Kaufman, B. J., and Clair, J.: Impact of Citywide Blackout on an Urban Emergency Medical Services System, Prehosp. Disaster Med., 21, 372–378, https://doi.org/10.1017/S1049023X00004064, 2006.
Gerl, T., Kreibich, H., Franco, G., Marechal, D., and Schröter, K.: A Review of Flood Loss Models as Basis for Harmonization and Benchmarking, 11, e0159791, PLoS One, https://doi.org/10.1371/journal.pone.0159791, 2016.
Greenwald, P. W., Ruherford, A. F., Green, R. A., and Giglio, J.: Emergency Department Visits for Home Medical Device Failure during the 2003 North America blackout, Acad. Emerg. Med., 11, 786–789, https://doi.org/10.1197/j.aem.2003.12.032, 2004.
Hall, J., Arheimer, B., Borga, M., Brázdil, R., Claps, P., Kiss, A., Kjeldsen, T. R., Kriaučiūnienė, J., Kundzewicz, Z. W., Lang, M., Llasat, M. C., Macdonald, N., McIntyre, N., Mediero, L., Merz, B., Merz, R., Molnar, P., Montanari, A., Neuhold, C., Parajka, J., Perdigão, R. A. P., Plavcová, L., Rogger, M., Salinas, J. L., Sauquet, E., Schär, C., Szolgay, J., Viglione, A., and Blöschl, G.: Understanding flood regime changes in Europe: a state-of-the-art assessment, Hydrol. Earth Syst. Sci., 18, 2735–2772, https://doi.org/10.5194/hess-18-2735-2014, 2014.
Hiete, M., Merz, M., Trinks, C., Grambs, W., and Thiede, T.: Krisenmanagement Stromausfall Langfassung: Krisenmanagement bei einer großflächigen Unterbrechung der Stromversorgung am Beispiel Baden-Württemberg, Innenministerium Baden-Württemberg und Bundesamt für Bevölkerungsschutz und Katastrophenhilfe, ISBN 978-3-86325-350-4, 2010.
Holden, R., Val, D. V., Burkhard, R., and Nodwell, S.: A network flow model for interdependent infrastructures at the local scale, Saf. Sci., 53, 51–60, https://doi.org/10.1016/j.ssci.2012.08.013, 2013.
Holmes, C. E.: Queensland Floods Commission of Inquiry: Final report, Brisbane, Australia, 2012.
Huitu, H., Kaustell, K., and Pastell, M.: The effect of storms on Finnish dairy farms: electrical outage statistics and the effect on milk production, Nat. Hazards, 104, 1695–1704, https://doi.org/10.1007/s11069-020-04240-0, 2020.
Huizinga, H. J.: Flood damage functions for EU member states, HKV Consultants, Lelystad, the Netherlands, Implemented in the framework of the contract #382441-F1SC awarded by the European Commission – Joint Research Centre, 2007.
ICPR: Rhine Atlas, International Commission for the Protection of the Rhine, Koblenz, https://www.iksr.org/fileadmin/user_upload/Dokumente_de/Rhein-Atlas/english/English_text.pdf (last access: 6 June 2023), 2001.
IPCC: Climate Change 2021: The Physical Science Basis. Contribution of Working Group I to the Sixth Assessment Report of the Intergovernmental Panel on Climate Change, Cambridge University Press, Cambridge, United Kingdom and New York, NY, USA, 2391 pp, https://report.ipcc.ch/ar6/wg1/IPCC_AR6_WGI_FullReport.pdf (last access: 6 June 2023), 2021.
Jongman, B., Kreibich, H., Apel, H., Barredo, J. I., Bates, P. D., Feyen, L., Gericke, A., Neal, J., Aerts, J. C. J. H., and Ward, P. J.: Comparative flood damage model assessment: towards a European approach, Nat. Hazards Earth Syst. Sci., 12, 3733–3752, https://doi.org/10.5194/nhess-12-3733-2012, 2012.
Karagiannis, G. M., Chondrogiannis, S., Krausmann, E., and Turksezer, Z. I.: Power grid recovery after natural hazard impact, European Commission, Luxemburg, EUR 28844 EN, 2017.
Karagiannis, G. M., Turksezer, Z.I., Alfrieri, L., Feyen, L., and Krausmann, E.: Climate change and critical infrastructure – floods, Publications Office of the European Union, Luxemburg, EUR 28855 EN, 2019.
Kemp, R.: Living without electricity: one city's experience of coping with loss of power, Royal Academy of Engineering, London, ISBN 978-1-909327-26-9, 2016.
Kile, J. C., Skowronski, S., Miller, M. D., Reissman, S. G., Balaban, V., Klomp, R. W., Reissman, D. B., Mainzer, H. M., and Dannenberg, A. L.: Impact of 2003 Power Outages on Public Health and Emergency Response, Prehosp. Disaster Med., 20, 93–97, https://doi.org/10.1017/S1049023X00002259, 2005.
Klijn, F., Baan, P., De Bruijn, K., and Kwadijk, J.: Overstromingsrisico's in Nederland in een veranderend klimaat: Verwachtingen, schattingen en berekeningen voorhet project Nederland Later, WL delft hydraulics, Delft, Q4290, 2007.
Klinger, C., Landeg, O., and Murray, V.: Power Outages, Extreme Events and Health: A Systematic Review of the Literature from 2011–2012, PLoS Curr., 6, ecurrents.dis.04eb1dc5e73dd1377e05a10e9edde673, https://doi.org/10.1371/currents.dis.04eb1dc5e73dd1377e05a10 e9edde673, 2014.
Koks, E., Pant, R., Thacker, S., and Hall, J. W.: Understanding Business Disruption and Economic Losses Due to Electricity Failures and Flooding, Int. J. Disaster Risk Sci., 10, 421–438, https://doi.org/10.1007/s13753-019-00236-y, 2019.
Koks, E. E., van Ginkel, K. C. H., van Marle, M. J. E., and Lemnitzer, A.: Brief communication: Critical infrastructure impacts of the 2021 mid-July western European flood event, Nat. Hazards Earth Syst. Sci., 22, 3831–3838, https://doi.org/10.5194/nhess-22-3831-2022, 2022.
Koskinas, A., Tegos, A., Tsira, P., Dimitriadis, P., Iliopoulou, T., Papanicolaou, P., Koutsoyiannis, D., and Williamson, T.: Insights into the Oroville Dam 2017 Spillway Incident, Geosciences, 9, 37, https://doi.org/10.3390/geosciences9010037, 2019.
Leandro, J., Cunneff, S., and Viernstein, L.: Resilience Modeling of Flood Induced Electrical Distribution Network Failures: Munich, Germany, Front. Earth Sci., 9, 572925, https://doi.org/10.3389/feart.2021.572925, 2021.
Lenz, L., Munyehirwe, A., Peters, J., and Sievert, M.: Does Large-Scale Infrastructure Investment Alleviate Poverty? Impacts of Rwanda's Electricity Access Roll-Out Program, World Dev., 89, 88–110, https://doi.org/10.1016/j.worlddev.2016.08.003, 2017.
McCall, J., Macknick, J., and Hillman, D.: Water-Related Power Plant Curtailments: An Overview of Incidents and Contributing Factors, National Renewable Energy Laboratory, United States, https://doi.org/10.2172/1338176, 2016.
McMillan, D.: Disruptions at Gatwick Airport: Christmas Eve 2013, Report by David McMillan to the Board of Gatwick Airport Limited, https://www.gatwickairport.com/globalassets/publicationfiles/business_and_community/all_public_publications/2014/mcmillan_report_feb14.pdf (last access: 6 June 2023), 2014.
Merz, B., Kreibich, H., Schwarze, R., and Thieken, A.: Review article “Assessment of economic flood damage”, Nat. Hazards Earth Syst. Sci., 10, 1697–1724, https://doi.org/10.5194/nhess-10-1697-2010, 2010.
Miles, S. B, Gallagher, H., and Huxford, C. J.: Restoration and Impacts from the September 8, 2011, San Diego Power Outage, J. Infrastruct. Syst., 20, 05014002, https://doi.org/10.1061/(ASCE)IS.1943-555X.0000176, 2014.
Motter, A. and Lai, Y.-C.: Cascade-based attacks on complex networks, Phys. Rev. E, 66, 065102, https://doi.org/10.1103/PhysRevE.66.065102, 2002.
Movahednia, M., Kargarian, A., Ozdemir, C. E., and Hagen, S. C.: Power Grid Resilience Enhancement via Protecting Electrical Substations Against Flood Hazards: A Stochastic Framework, IEEE Trans. Ind. Inform., 18, 2132–2143, https://doi.org/10.1109/TII.2021.3100079, 2022.
Mukherjee, S., Nateghi, R., and Hastak, M.: A multi-hazard approach to assess severe weather-induced major power outage risks in the U.S., Reliab. Eng. Syst. Safe., 175, 283–305, https://doi.org/10.1016/j.ress.2018.03.015, 2018.
Murdock, H. J., de Bruijn, K. M., and Gersonius, B.: Assessment of Critical Infrastructure Resilience to Flooding Using a Response Curve Approach, Sustainability, 10, 3470, https://doi.org/10.3390/su10103470, 2018.
New York Power Authority, Puerto Rico Power Authority, Puerto Rico Energy Commission, Consolidated Edison, Company of New York, Inc., Edison International, Electric Power Research Institute, Long Island Power Authority, Smart Electric Power Alliance, US Department of Energy, Brookhaven National Laboratory, National Renewable Energy Laboratory, Pacific Northwest National Laboratory, Grid Modernization Lab Consortium, PSEG Long Island, Navigant Consulting, Inc.: Build Back Better: Reimagining and Strengthening the Power Grid of Puerto Rico, https://www.governor.ny.gov/sites/default/files/atoms/files/PRERWG_Report_PR_Grid_Resiliency_Report.pdf (last access: 6 June 2023), 2017.
Nicolas, C., Rentschler, J., Potter van Loon, A., Oguah, S., Schweikert, A., Deinert, M., Koks, E., Arderne, C., Cubas, D., Li, J., and Ichikawa, E.: Stronger Power: Improving Power Sector Resilience to Natural Hazards, World Bank Group, Washington, D.C., https://documents1.worldbank.org/curated/en/200771560790885 170/pdf/Stronger-Power-Improving-Power-Sector-Resilience-to-Natural-Hazards.pdf (last access: 6 June 2023), 2019.
O'Reilly, G., Jrad, A., Nagarajan, R., Brown, T., and Conrad, S.: Critical Infrastructure Analysis of Telecom for Natural Disasters, Networks 2006. 12th International Telecommunications Network Strategy and Planning Symposium, 6–9 November 2006, New Delhi, India, 1–6, https://doi.org/10.1109/NETWKS.2006.300396, 2006.
Ouyang, M.: Review on modeling and simulation of interdependent critical infrastructure systems, Reliab. Eng. Syst. Safe., 121, 43–60, https://doi.org/10.1016/j.ress.2013.06.040, 2014.
Pant, R., Thacker, S., Hall, J. W., Alderson, D., and Barr, S.: Critical infrastructure impact assessment due to flood exposure, J. Flood Risk Manag., 11, 22–33, https://doi.org/10.1111/jfr3.12288, 2018.
Panteli, M. and Mancarella, P.: Influence of extreme weather and climate change on the resilience of power systems: Impacts and possible mitigation strategies, Electr. Power Syst. Res., 127, 259–270, https://doi.org/10.1016/j.epsr.2015.06.012, 2015.
Pasha, H. A. and Saleem, W.: The Impact and Cost of Power Load Shedding to Domestic Consumers, The Pakistan Development Review, 52, 355–372, https://doi.org/10.30541/v52i4Ipp.355-373, 2013.
Penning-Rowsell, E., Priest, S., Parker, D., Morris, J., Tunstall, S., Viavattene, C., Chatterton, J., and Owen, D.: Flood and Coastal Erosion Risk Management: A Manual for Economic Appraisal, Routledge, London, ISBN 978-0-415-81515-4, 2013.
Petermann, T., Bradke, H., Lüllmann, A., Poetzsch, M., and Riehm, U.: Was bei einem Blackout geschieht: Folgen eines langandauernden und großräumigen Stromausfalls, Sigma Edition, Berlin, ISBN 978-3-8360-8133-7, 2011.
Pitt, M.: Learning lessons from the 2007 floods: An Independent Review by Sir Michael Pitt, Cabinet Office, London, http://cip.management.dal.ca/publications/Pitt Review.pdf (last access: 6 June 2023), 2007.
Poljanšek, K., Bono, F., and Gutiérrez, E.: Seismic risk assessment of interdependent critical infrastructure systems: The case of European gas and electricity networks, Earthq. Eng. Struct. Dyn., 41, 61–79, https://doi.org/10.1002/eqe.1118, 2012.
Powerlink Queensland: Annual Report 2010/11, Australia, https://documents.parliament.qld.gov.au/tp/2011/5311T5426.pdf (last access: 6 June 2023), 2011.
Pregnolato, M., Galasso, C., and Parisi, F.: A compendium of existing vulnerability and fragility relationships for flood: preliminary results, in: Proceedings of the 12th International Conference on Applications of Statistics and Probability in Civil Engineering, ICASP12, 12–15 July 2015, Vancouver, Canada, 2015.
Prezant, D. J., Clair, J., Belyaev, S., Alleyne, D., Banauch, G. I., Davitt, M., Vandervoorts, K., Kelly, K. J., Currie, B., and Kalkut, G.: Effects of the August 2003 blackout on the New York City healthcare delivery system: A lesson for disaster preparedness, Crit. Care Med., 33, S96–S101, https://doi.org/10.1097/01.CCM.0000150956.90030.23, 2005.
Rentschler, J., Kornejew, M., Hallegate, S., Braese, J., and Obolensky, M.: Underutilized Potential: The Business Costs of Unreliable Infrastructure in Developing Countries, World Bank Group, Washington, D.C., https://doi.org/10.1596/1813-9450-8899, 2019a.
Rentschler, J., Obolensky, M., and Kornejew, M.: Candle in the Wind? Energy System Resilience to Natural Shocks, World Bank Group, Washington, D.C., https://doi.org/10.1596/1813-9450-8897, 2019b.
Reuter, C.: Communication between Power Blackout and Mobile Network Overload, Int. J. Inf. Syst. Crisis Response Manag., 6, 38–53, https://doi.org/10.4018/ijiscram.2014040103, 2014.
Rinaldi, S. M., Peerenboom, J. P., and Kelly, T. K.: Identifying, understanding, and analyzing critical infrastructure interdependencies, IEEE Control Syst. Mag., 21, 11–25, https://doi.org/10.1109/37.969131, 2001.
Sánchez-Muñoz, D., Domínguez-García, J. L., Martínez-Gomariz, E., Russo, B., Stevens, J., and Pardo, M.: Electrical Grid Risk Assessment Against Flooding in Barcelona and Bristol Cities, Sustainability, 12, 1527, https://doi.org/10.3390/su12041527, 2020.
Sarachai, W., Ratnapinda, P., and Khumwichai, P.: Smart Notification System for Detecting Fan Failure in Evaporative Cooling System of a Poultry Farm, 2019 Joint International Conference on Digital Arts, Media and Technology with ECTI Northern Section Conference on Electrical, Electronics, Computer and Telecommunications Engineering (ECTI DAMT-NCON), 30 January–2 February 2019, Nan, Thailand, 296–299, https://doi.org/10.1109/ECTI-NCON.2019.8692266, 2019.
Sebastian, T., Lendering, K., Kothuis, B., Brand, N., Jonkman, B., van Gelder, P., Godfroij, M., Kolen, B., Comes, T., Lhermitte, S., Meesters, K., van de Walle, B., Ebrahimi Fard, A., Cunningham, S., Khakzad, N., and Nespeca, V.: Hurricane Harvey Report: A fact-finding effort in the direct aftermath of Hurricane Harvey in the Greater Houston Region, Delft University Publishers, Delft, https://pure.tudelft.nl/ws/portalfiles/portal/31283193/TU_Delft_Texas_Hurricane_Harvey_Report_Phase_I_20171108.pdf (last access: 6 June 2023), 2017.
Slegg, B. and Faiers, S.: Stage 2 review of Distribution Network Operators' performance during the December 2013 storms, Energypeople, United Kingdom, 2014.
Srinivasan, T. N. and Gopi Rethinaraj, T. S.: Fukushima and thereafter: Reassessment of risks of nuclear power, Energy Policy, 52, 726–736, https://doi.org/10.1016/j.enpol.2012.10.036, 2013.
Sullivan, M., Collins, M. T., Schellenberg, J. A., and Larsen, P.: Estimating Power System Interruption Costs: A Guidebook for Electric Utilities, Lawrence Berkeley National Laboratory, Berkeley, https://eta-publications.lbl.gov/sites/default/files/interruption_cost_estimate_guidebook_final2_9july2018.pdf (last access: 6 June 2023), 2018.
Thieken, A. H., Bessel, T., Kienzler, S., Kreibich, H., Müller, M., Pisi, S., and Schröter, K.: The flood of June 2013 in Germany: how much do we know about its impacts?, Nat. Hazards Earth Syst. Sci., 16, 1519–1540, https://doi.org/10.5194/nhess-16-1519-2016, 2016.
UNDRR: Global Assessment Report on Disaster Risk Reduction, United Nations Office for Disaster Risk Reduction, Geneva, Switzerland, ISBN 978-92-1-004180-5, 2019.
Vanneuville, W., Maddens, R., Collard, C., Bogaert, P., De Mayer, P., and Antrop, M.: Impact op mens en economie t.g.v. overstromingen bekelen in het licht van wijzigende hydraulische condities, omgenvingsfactoren en klimatologische omstandigheden, Vakgroep Geografie, Universiteit Gent, Gent, Belgium, MIRA/2006/02, 2006.
Vasenev, A., Montoya, L., and Ceccarelli, A.: A Hazus-Based Method for Assessing Robustness of Electricity Supply to Critical Smart Grid Consumers during Flood Events, 2016 11th International Conference on Availability, Reliability and Security (ARES), Salzburg, Austria, 31 August 2016–2 September 2016, https://doi.org/10.1109/ARES.2016.12, 2016.
Wacker, G. and Billinton, R. G.: Farm losses resulting from electric service interruptions-a Canadian survey, IEEE Trans. Power Syst., 4, 472–478, https://doi.org/10.1109/59.193818, 1989a.
Wacker, G. and Billinton, R. G.: Customer cost of electric service interruptions, Proc. IEEE, 77, 919–930, https://doi.org/10.1109/5.29332, 1989b.
Ward, D. M.: The effect of weather on grid systems and the reliability of electricity supply, Clim. Change, 121, 103–113, https://doi.org/10.1007/s10584-013-0916-z, 2013.
Zimmerman, R.: Mass transit infrastructure and urban health, J. Urban Health, 82, 21–32, https://doi.org/10.1093/jurban/jti005, 2005.
Zio, E.: Challenges in the vulnerability and risk analysis of critical infrastructures, Reliab. Eng. Syst. Safe., 152, 137–150, https://doi.org/10.1016/j.ress.2016.02.009, 2016.