 | 24 Jun 2022
Experimental and Simulated Spectral Gamma-Ray Response of a NaI(Tl) Scintillation Detector used in Airborne Gamma-Ray Spectrometry
David Breitenmoser
Gernot Butterweck
Malgorzata Magdalena Kasprzak
Eduardo Gardenali Yukihara
Sabine Mayer
The objective of this work is to simulate the spectral gamma-ray response of NaI(Tl) scintillation detectors for airborne gamma-ray spectrometry (AGRS) using the state-of-the-art multi-purpose Monte Carlo code FLUKA. The study is based on a commercial airborne gamma-ray spectrometry detector system with four individual NaI(Tl) scintillation crystals and a total volume of 16.8 L.
To validate the developed model, radiation measurements were conducted using 57Co, 60Co, 88Y, 109Cd, 133Ba, 137Cs and 152Eu calibration point sources with known activities and source-detector geometries under laboratory conditions. In addition, empirical calibration and resolution functions were derived from these measurements combined with additional radiation measurements adopting natural uranium, thorium and potassium volume sources.
The simulation results show superior accuracy and precision compared to previous AGRS simulation models with a median relative spectral error < 10 % for most of the radiation sources. Moreover, the implementation of a lower level discriminator model and detailed modelling of the laboratory result in a significant improvement in model accuracy for spectral energies < 100 keV compared to previous studies. Yet thorough statistical analysis incorporating statistical and systematic uncertainty estimates revealed statistically significant deviations between the simulated and measured spectra in the spectral region around the Compton edge, which could be attributed to the scintillator non-proportionality.
These findings imply that the linear energy deposition model applied in this and previously developed AGRS simulation models should be revised and considered to be replaced by more accurate non-proportional models.
- Article
(3838 KB) - Full-text XML
- BibTeX
- EndNote


Airborne gamma-ray spectrometry (AGRS) is an established technique to identify and quantify terrestrial radionuclides using a gamma-ray spectrometer mounted in an aerial vehicle (Erdi-Krausz et al., 2003). This technique was originally developed in the early second half of the past century for radioactive mineral exploration and geological mapping (Grasty, 1975). In the years that followed the first successful geological and mineral exploration surveys, AGRS has proven to be also an essential tool in a variety of other fields, including emergency response to severe nuclear accidents, orphan source location, non-radioactive mineral exploration, nuclear facility monitoring, soil mapping, snow coverage quantification, geothermal exploration and landslide mapping (Connor et al., 2016; Li et al., 2020; Pradeep Kumar et al., 2020). The severe nuclear accident at the Fukushima Daiichi nuclear power plant in 2011 (Torii et al., 2013) as well as the concerns regarding nuclear terrorism prompted new research efforts leading to the development of new innovative AGRS systems, especially in the field of unmanned aerial vehicles (UAV) and directional-sensitive-based AGRS systems (Connor et al., 2016; Kulisek et al., 2018).
As pointed out by Fortin et al. (2017), despite decades of development, there are still some unsolved problems in the processing as well as in the evaluation of AGRS data. Due to the complexity of the radiation transport and the detector response, the calibration of AGRS systems, i. e. the derivation of a reference system to quantify the terrestrial radionuclide concentrations based on the spectral detector response, remains a challenge.
Up to now, experimental calibration procedures based on calibration pads are the suggested approach according to the technical guidelines published by the International Atomic Energy Agency (IAEA) (Erdi-Krausz et al., 2003). However, these calibration-pads-based methods have two main limitations. First, the required calibration pads are expensive to build as well as to decommission. Second, due to the required source activities and radiation protection legislation, only a very limited range of radionuclides is available for experimental calibration purposes of AGRS systems.
With increasing computational capabilities and development of high-fidelity Monte Carlo based radiation transport codes over the past two decades, simulation-based calibration approaches are now commonly used for laboratory and in-situ spectrometry (Van der Graaf et al., 2011), in the marine environment (Androulakaki et al., 2016) or in space exploration (Prettyman et al., 2006). Despite the apparent advantages, i. e. unrestricted capabilities in terms of source characteristics and detector modelling as well as cost effective and fast evaluation, simulation-based calibration has not established itself as an equivalent methodology for standard AGRS systems, which are defined in this study as manned aircraft systems using a spectrometer with multiple 10.2 cm × 10.2 cm × 40.6 cm prismatic NaI(Tl) scintillation crystals.
First attempts to simulate the detector response of a standard AGRS system were performed by Allyson and Sanderson (1998) using an in-house Monte Carlo code. Significant systematic deviations (> 10 %) between measurement and simulation results were found and attributed to the simplified model, i. e. the multi-component detector system was simplified to a single crystal together with an equivalent aluminum casing. Billings and Hovgaard (1999) adopted a modified version of the Monte Carlo code developed by Allyson and Sanderson (1998) and performed extensive simulations to characterize the angular detector response of a standard AGRS detector system. Again, the multi-component detector system was simplified to a single crystal. In addition, only the scintillation crystal was incorporated in the model, i. e. all casing materials were neglected, and no spectral analysis was performed. Torii et al. (2013) adopted the EGS5 Monte Carlo code to calibrate their standard AGRS system for the aerial radiological surveys, which were performed to quantify the dispersion of 131I and 134Cs in the aftermath of the nuclear accident in the Fukushima Daiichi nuclear power plant. Similar to Billings and Hovgaard (1999), Torii et al. (2013) did not perform spectral analysis but used the simulation to derive some empirical parameters for their analytical mono-energetic model. Sinclair et al. (2016) utilized the EGSnrc Monte Carlo code to calibrate their standard AGRS system for the quantification of the radionuclide 140La. Again, only peak count rate measures were extracted from the performed simulations. In contrast to the earlier studies, Torii et al. (2013) as well as Sinclair et al. (2016) kept the multi-component crystals and included also additional detector components such as insulation materials, photomultiplier tubes (PMT) and multi-channel analyzers (MCA) in their simulation models. Zhang et al. (2018) adopted the MCNP Monte Carlo code to simulate the spectral detector response of a standard AGRS system. They included primitive cubic shells to model the aircraft but did not provide any evidence for model validation using measurement data.
As it emerges from this introduction, studies covering simulation-based calibration of standard AGRS systems are scarce. Moreover, most of the studies focus on full energy peak characterization for single radionuclides, adopted significant geometrical as well as physical simplifications, did not assess systematic uncertainties and, for some cases, lack experimental validation.
To address this gap, we performed high-resolution Monte Carlo simulations of a standard AGRS system under laboratory conditions using the state-of-the-art radiation transport code FLUKA (Böhlen et al., 2014; Battistoni et al., 2015). The detector model includes all relevant components such as scintillation crystals, casings, insulation materials, PMT and MCA in high detail. In addition, benchmark measurements were performed with various radionuclides adopting a centered source-detector configuration in the calibration laboratory at the Paul Scherrer Institute. As a first step towards a simulation-based calibration methodology, this study is concerned with centered source-detector configurations and not with angular detector response analysis. By comparing the experimental and simulated spectral results, new insights in the current understanding of the detector response can be obtained. Furthermore, adopting rigorous uncertainty quantification, the statistical as well as systematic uncertainties of the current model can be assessed and included in a statistically sound interpretation of the simulation results. For the reader's convenience, a full list of all symbols and acronyms used in this study is attached in Appendix C.
2.1 Radiation measurements
The goal of the laboratory-based radiation measurements are twofold. First, the spectral measurements are used to derive crystal-specific energy calibration and detector resolution parameters. Second, the radiation measurements can be adopted to validate the simulated spectral detector response and thereby quantify the model accuracy and precision.
2.1.1 Experimental setup
This study focuses on a commercial AGRS system, which is used regularly in annual survey campaigns by civil and military institutions in Switzerland for nuclear facility monitoring, geophysical studies and radiological emergency response training (Butterweck et al., 2021). This standard AGRS system was developed by Mirion Technologies Inc., France, and consists of four 10.2 cm × 10.2 cm × 40.6 cm prismatic NaI(Tl) scintillation crystals protected by individual aluminum casings together with related PMT and MCA. The scintillation crystals as well as the associated electronics are embedded in a thermal-insulating and vibration-damping polyethylene (PE) foam and installed in an aluminum box as illustrated in Fig. 1c. The spectrometer features 1024 channels for an energy range between 30 and 3000 keV together with automatic linearization of the individual scintillation crystal spectra.
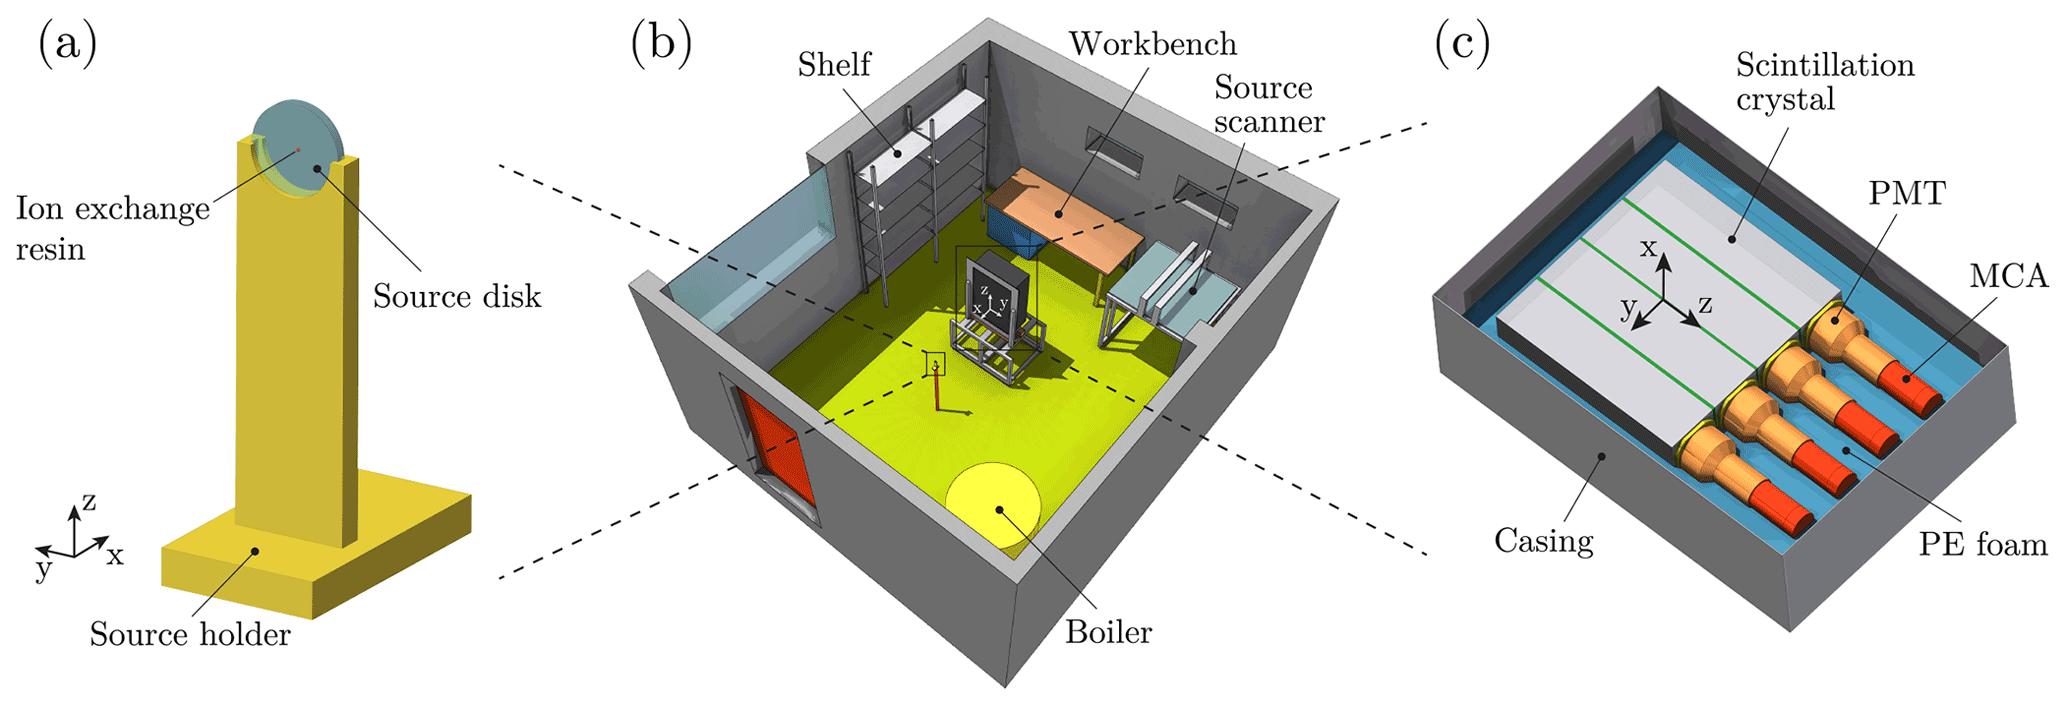
Figure 1Experimental setup in the calibration laboratory at the Paul Scherrer Institute (PSI). (a) Radiation source including the source holder, the radiation source disk (25 mm × 3 mm) and the ion exchange resin sphere (1 mm), in which the activity mass is embedded. (b) Cut view of the laboratory room (5.3 m × 4.5 m × 3 m) with the detector mounted on an aluminum frame and the source on a tripod. (c) Cut view of the detector box (86 cm × 60 cm × 30 cm) including the internals such as the scintillation crystals, photomultiplier tubes (PMT), multi-channel analyzers (MCA) and polyethylene (PE) foam. All figures were created using the graphical interface FLAIR (Vlachoudis, 2009). For better visibility and interpretability, false colors are adopted.
Radiation measurements where performed in the calibration laboratory at the Paul Scherrer Institute in Switzerland using standard calibration disk sources from the Eckert & Ziegler Nuclitec GmbH (57Co, 60Co, 88Y, 109Cd, 133Ba, 137Cs and 152Eu). These sources consist of a 3 mm thick plastic disk with a 25 mm diameter, in which the active source mass is embedded in a 1 mm diameter ion exchange resin sphere (cf. Fig. 1a). Specific source properties including the activity at the corresponding measurement date, half life and major photon emission lines together with corresponding uncertainty values are summarized in Table A1 in Appendix A. Additional volume sources with unknown activities were used for energy and spectral resolution calibration, i. e. natural potassium Knat, natural uranium Unat and natural thorium Thnat (cf. Sect. 2.1.2).
The detector box was placed on an aluminum frame and vertically oriented along the detector axis of symmetry, i. e. the z-axis, for all laboratory-based radiation measurements as illustrated in Fig. 1b. The standard calibration disk sources were inserted in a low absorption source holder and mounted on a tripod (cf. Fig. 1a). The source holder was specifically developed and constructed for these measurements using additive manufacturing techniques. The ion exchange resin sphere inside the calibration disk source was then aligned on the detector x-axis and placed in (1.00 ± 0.01) m distance to the detector box, where the outer surface of the detector box was defined as the reference surface. The detector x-axis is centered on the scintillation crystals as shown in Fig. 1c. To measure the source-detector distances and to position the sources accurately, distance as well as positioning laser systems were used. Between radiation measurements, background measurements were performed regularly for background correction and gain stability checks. For all measurements, the air temperature as well as the air humidity in the calibration laboratory was controlled by an air conditioning unit and logged by an external sensor. The air temperature was set at (18.8 ± 0.4) ∘C and the relative air humidity at (42 ± 3) %. The ambient air pressure, which was also logged by the external sensor, fluctuated around (982 ± 5) hPa. If not otherwise stated, uncertainties are provided as 1 standard deviation (SD) values in this study (coverage factor k = 1).
During measurements, additional instruments and laboratory equipment were located in the calibration laboratory, e. g. shelves, a workbench, a source scanner or a boiler as shown in Fig. 1b. The effect of these features on the detector response is carefully assessed in a sensitivity analysis discussed in Sect. 2.2.1.
2.1.2 Spectral postprocessing
As a first step in the postprocessing of the measured pulse-height spectra, the gross count spectra Cgr,k are transformed to background and dead-time-corrected net count rate spectra cexp,k normalized by the source activity A by subtracting the background count rate spectrum cbg,k from the gross count rate spectrum cgr,k for each channel k:
The dead time corrected background and gross count rate spectra cbg,k and cgr,k are obtained by dividing the corresponding count spectra Cbg,k and Cgr,k by the recorded measurement live time tbg and tgr, respectively. The resulting net spectra are computed in units of counts per second [cps] and per source activity [Bq], i. e. [cps Bq−1]. Additional information on the uncertainty analysis for the net count rate spectra cexp,k as well as the source activity A can be found in Appendix A.
To characterize the relationship between the spectral energy and the detector channel as well as to quantify the detector resolution, statistical measures for the center and dispersion of the full energy peaks (FEP) in the pulse height spectra are required. In this study, the center and dispersion of the FEP are quantified by the mean μ and standard deviation σ of a Gaussian model (Knoll, 2010). The net count rate spectrum containing a general multiplet of Npk FEPs is then described as the sum of Npk independent Gaussian peaks together with a baseline model over a predefined connected subset of channels :
where al is an additional normalizing model parameter for each FEP. For the baseline, a physics-oriented empirical model was adopted (Westmeier, 1992). Weighted non-linear least-squares (WNLLS) regression using the interior-reflective Newton method (Coleman and Li, 1996) was utilized to determine the 3Npk statistical model parameters, i. e. al, μl and σl as well as corresponding standard deviation values , and with . For the weights, the squared inverse of the coefficient of variation, i. e. , was used (cf. Appendix A). In this study, the following emission lines were selected for FEP characterization using WNLLS: 1173.228(3), 1332.492(4) keV [60Co]; 898.042(3), 1836.06(1) keV [88Y]; 88.0336(1) keV [109Cd]; 661.657(3) keV [137Cs]; 121.7817(3), 344.279(1) keV [152Eu]; 1460.822(6) keV [Knat]; 2614.51(1) keV [Thnat]; 351.932(2), 609.320(5) keV [Unat], where 1 SD values are provided as least significant figures. Photon energies of those emission lines were taken from the ENDF/B-VIII.0 nuclear data file library (Brown et al., 2018). A representative singlet containing the FEP at 121.7817(3) keV originating from the 152Eu source is shown in Fig. 2a illustrating the experimental net count rate spectrum together with the resulting baseline model, the WNLLS model as well as the 99 % prediction interval (PI). It is important to note that, in order to determine the Gaussian mean μl and standard deviation σl parameters of a multiplet, no activity normalization of the net count rate spectrum according to Eq. (1) is required.
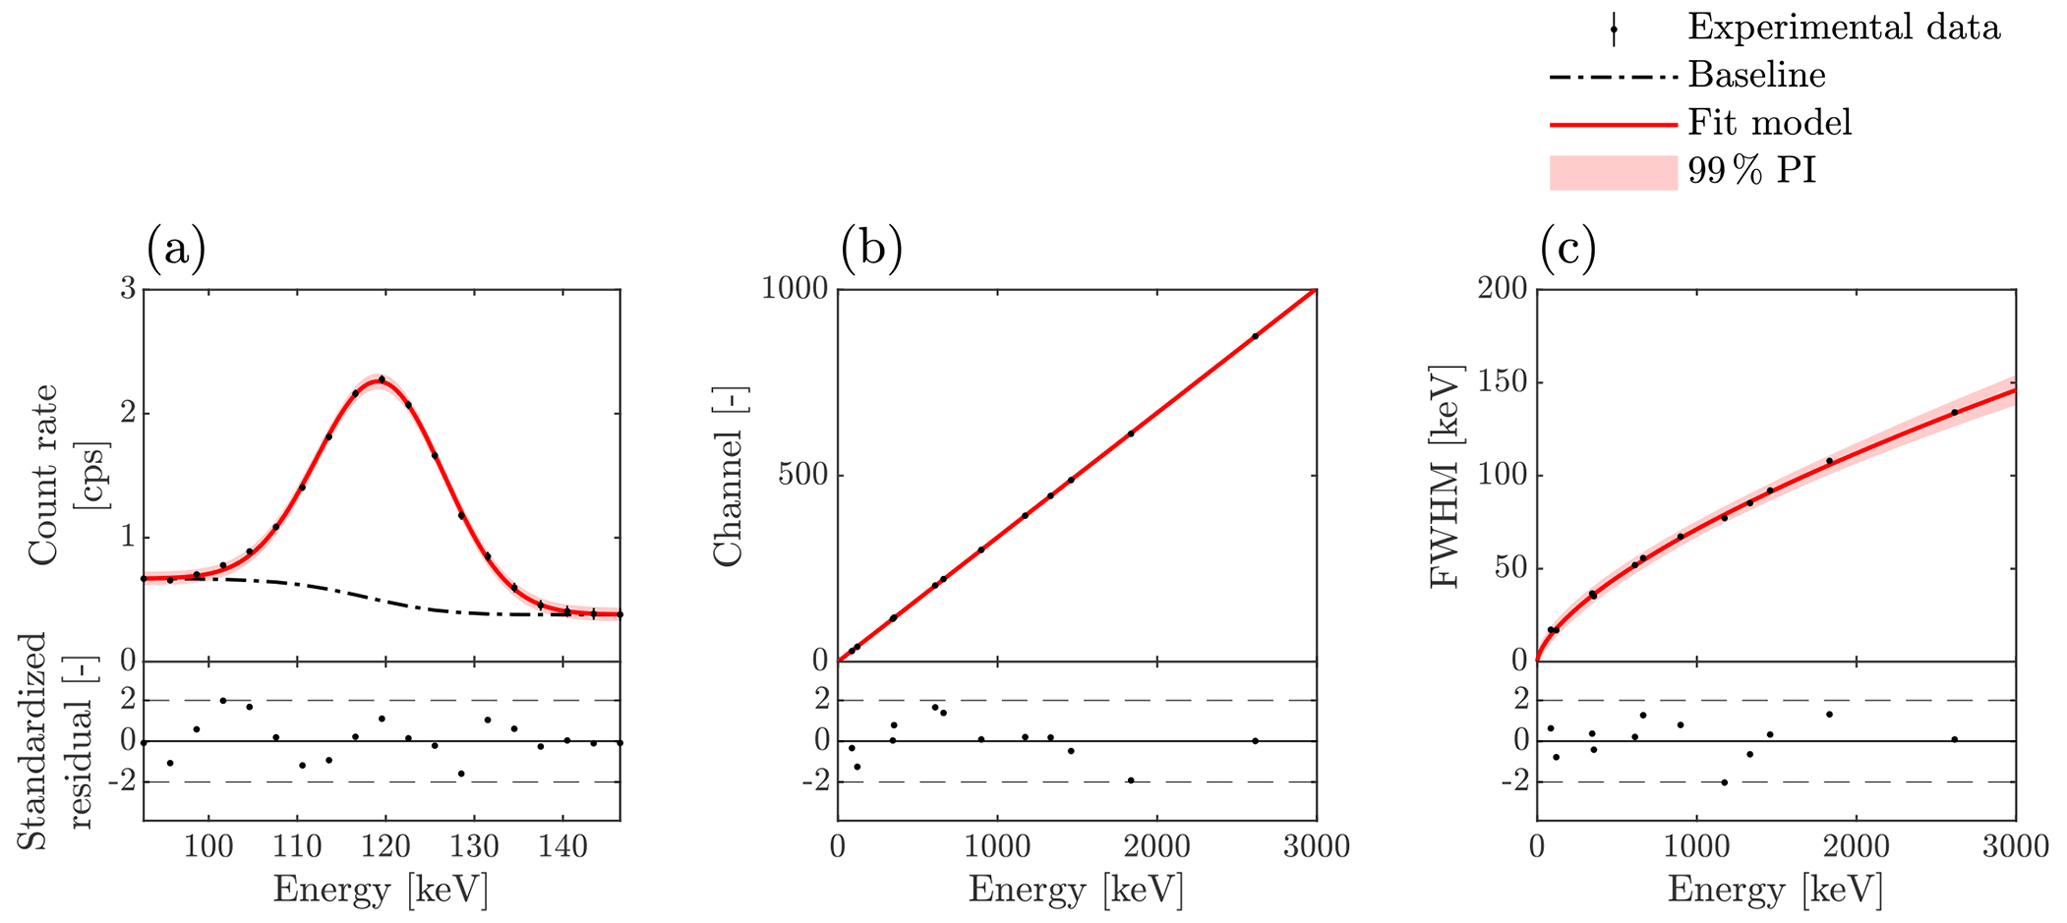
Figure 2Spectral postprocessing of the experimental data for the scintillation crystal 3. (a) Experimental net spectrum of the 152Eu source showing the full energy peak at 121.7817(3) keV together with the resulting peak fit and baseline model. (b) Energy calibration model using peak fit data from various radiation sources, i. e. 60Co, 88Y, 109Cd, 137Cs, 152Eu, Knat, Thnat and Unat. (c) Experimental resolution model characterizing the full width at half maximum (FWHM) and adopting the same peak fit data from radiation sources as for the energy calibration model. The prediction interval (PI) is computed for a significance level of 1 % for all statistical models. Experimental error bars are defined as 1 SD (only visible in Fig. 2a).
2.1.3 Spectral energy calibration and detector resolution model
Using the Gaussian mean parameters μl from the previous spectral postprocessing step and the known true photon emission lines, a calibration regression model can be derived relating the spectral energy E with the detector channel H. Due to the spectral linearization performed by the spectrometer, a simple polynomial model of degree 1:
with the slope parameter d1 proved to be sufficient to describe the relation between the spectral energy E and the detector channel H adequately.
The quantification of the spectral resolution was achieved by deriving an analytical resolution model adopting an exponential function:
where the full width at half maximum (FWHM) parameter is adopted in agreement with the standards in gamma-ray spectrometry (Knoll, 2010). The FWHM is analytically related to the Gaussian standard deviation σres by . In general, the resolution of scintillation detectors, specifically Na(Tl) crystals, can be attributed to a variety of factors, including quantum fluctuation in the number of information carriers, scintillator non-proportionality, crystal impurities or electronic noise (Knoll, 2010). Due to this complexity, there is no consensus in the literature on the functional form of an appropriate resolution model (Casanovas et al., 2012). The selection of the exponential model may seem therefore to a certain degree arbitrary but, due to its simplicity and versatility, has proven to be appropriate not only for this but also for other studies (Shi et al., 2002; Gardner and Sood, 2004).
For both models, WNLLS regression using the interior-reflective Newton method (Coleman and Li, 1996) was adopted with the squared inverse of the coefficient of variation, i. e. and , as weights to determine the model parameters d1, b1, b2 and corresponding standard deviation values , , for each scintillation crystal. Evaluated goodness-of-fit measures showed acceptable prediction properties, i. e. a coefficient of determination R2 > 0.9999 and R2 > 0.997 together with a relative generalization error < 0.02 % and < 0.2 %, for both the calibration and resolution model, respectively. To estimate the relative generalization error, the predicted residual error sum of squares, sometimes also referred to as the leave-one-out cross-validation error, normalized by the variance of the response variable was computed (Tarpey, 2000). In Fig. 2b–c, the resulting calibration and resolution model together with the experimental Gaussian mean μl and standard deviation σl parameters as well as the 99 % PI are shown for the scintillation crystal 3.
2.2 Detector response simulations
In this study, we adopt a single-stage stochastic model using the state-of-the-art multi-purpose Monte Carlo code FLUKA (Böhlen et al., 2014; Battistoni et al., 2015) version 4.2.1 together with the graphical interface FLAIR (Vlachoudis, 2009) version 3.1–15.1 to simulate the radiation transport as well as the energy deposition in the scintillation crystals. All simulations were performed on a computer cluster at the Paul Scherrer Institute utilizing parallel and high-performance computing.
2.2.1 Simulation model
In this study, the most accurate physics mode available in FLUKA, i. e. “precisio”, was used featuring a fully coupled photon, electron and positron radiation transport for our source-detector configuration. Lower transport thresholds were set to 1 keV for the scintillation crystals as well as the closest objects to the crystals, e. g. reflector, optical window and aluminum casing for the crystals. For the remaining model parts, the transport threshold was set to 10 keV to decrease the computational load while maintaining the high-fidelity transport simulation in the scintillation crystals. In accordance with previous studies (Allyson and Sanderson, 1998; Billings and Hovgaard, 1999; Sinclair et al., 2016; Kulisek et al., 2018; Zhang et al., 2018), a linear energy deposition model is applied in this study neglecting the scintillator non-proportionality of NaI(Tl) (Payne et al., 2009; Moses et al., 2012). For the radioactive sources, detailed photon, electron and positron emissions are simulated using the “raddecay” card in a semi-analogue mode according to the corresponding decay schemes allowing an event-by-event analysis.
It is important to add that for the 109Cd source, a software bug was detected in the current FLUKA version and confirmed by the developers. Therefore, a custom source user routine was written using the emission data from the ENDF/B-VIII.0 nuclear data file library (Brown et al., 2018) to simulate the 109Cd source adequately.
The energy deposition events in the scintillation crystals are scored individually on an event-by-event basis using the custom user routine “usreou” together with the “detect” card. The number of primaries Npr was set to 107 for all simulations, which guaranteed a maximum relative statistical standard deviation and a maximum relative variance of the sample variance VOVk < 0.01 % for all detector channels with and with respect to the summed detector crystal spectra (cf. Appendix A and B). For EFEP,max, the maximum photon energy of the corresponding source using a detection threshold of 5 % with respect to the emission probability of the strongest line within the associated decay branch was used (cf. Table A1 in Appendix A).
The simulation model includes all relevant detector components such as scintillation crystals, reflectors, aluminum casings, insulation materials, PMT and MCA in high detail (cf. Fig. 1c). Geometrical as well as material properties were provided by the manufacturer of the Swiss AGRS system. The calibration disk sources as well as the source holder are modelled in high detail with known material and geometrical properties (cf. Fig. 1a). On the other hand, the laboratory room together with additional instruments and equipment, e. g. the workbench, shelves or a source scanner shown in Fig. 1b, are modelled in less detail. For this simplifications, care was taken to preserve the overall opacity as well as the mass density.
To assess the effect of the individual model elements on the detector response, a sensitivity analysis was performed changing one set of model elements at the time (OAT) for the 60Co Monte Carlo simulation as a representative model. More specifically, starting with the high-fidelity model illustrated in Fig. 1 as the reference model (model A), specific element sets were excluded from this model and replaced with air. These element sets are defined as follows: laboratory room related elements {floor, walls, windows, door, ceiling} (model B), detector box related elements {aluminum box, aluminum frame, MCA, PMT, PE foam} (model C), source related elements {source disk, source holder, tripod} (model D) and additional laboratory equipment elements {shelves, workbench, source scanner, boiler} (model E).
In addition, there are some uncertainties regarding the elemental composition and mass density of the reflector, which is located between the aluminum casing and the scintillation crystals. Based on publicly available sources for our detector, the reflector is modelled with a polytetrafluoroethylene (PTFE) foil with an equivalent mass density of 2.25 g cm−3. In contrast, most of the other studies adopted MgO for the reflector with an equivalent mass density of 2 g cm−3 (Shi et al., 2002; Salgado et al., 2012) based on an early study by Saito and Moriuchi (1981). Consequently, an additional model (model F) was defined using MgO instead of PTFE for the reflector to quantify the sensitivity of this element on the detector response.
2.2.2 Spectral postprocessing
The obtained event-by-event energy deposition data is transformed to channel-based count rate spectra in three distinct steps for each of the four scintillation crystals. First, the individual energy deposition events are transformed from the spectral energy space E to the detector channel space H adopting the energy calibration models (Eq. 3) discussed in Sect. 2.1.3.
Second, to account for the finite detector resolution, the individual energy deposition events are broadened according to the derived resolution models for the individual crystals (Eq. 4). In more detail, the energy deposition events Edep are assumed to be normally distributed with a mean and standard deviation equal to the simulated energy deposition Esim and the corresponding standard deviation predicted by the resolution model σres, respectively:
The broadening, sometimes also referred to as Gaussian broadening (Van der Graaf et al., 2011), is performed in parallel with the binning and normalization of the recorded energy deposition events Esim,i with to generate the simulated count rate spectrum for the detector channels Hk with and the half channel width ΔH as follows:
where φ(⋅) and Φ(⋅) are the standard normal probability density and the cumulative distribution function, respectively. The generated spectrum is normalized by the number of simulated primaries Npr, i. e. the number of simulated primary radionuclide decays, resulting in the same physical unit of counts per second [cps] per source activity [Bq] as for the experimental net count rate spectra (cf. Sect. 2.1.2).
As a last step, a lower level discriminator (LLD) model is applied to the generated count rate spectrum to account for the lower spectral threshold in the experimental spectra induced by the MCA:
where μLLD and σLLD are LLD model specific parameters. More information on the motivation and derivation of this LLD model can be found in Appendix B. For additional information on the uncertainty analysis for the simulated net count rate spectra csim,k incorporating statistical and systematic estimates, the reader is referred to Appendix A.
3.1 Spectral comparison
Fig. 3 shows the simulated and measured spectral detector response for the seven calibration sources 57Co, 60Co, 88Y, 109Cd, 133Ba and 137Cs using the count rate spectra summed over the four crystals.
In general, the agreement in both absolute count rate and shape is striking considering the significant deviations previous studies have reported, especially in the lower part of the spectra (Allyson and Sanderson, 1998; Kulisek et al., 2018). Moreover, the spectral range covered by the evaluated calibration sources is significantly larger than in previous studies. For example, Allyson and Sanderson (1998) and Torii et al. (2013) used only one radionuclide, i. e. 137Cs, to validate the spectral detector response in their studies.
Despite these improvements, there are some systematic deviations between the measured and simulated spectra for certain sources, specifically around the Compton edges (CE), the backscatter peaks (BSP) and the characteristic X-ray peaks (XRP) highlighted in Fig. 3. These deviations require further discussion.
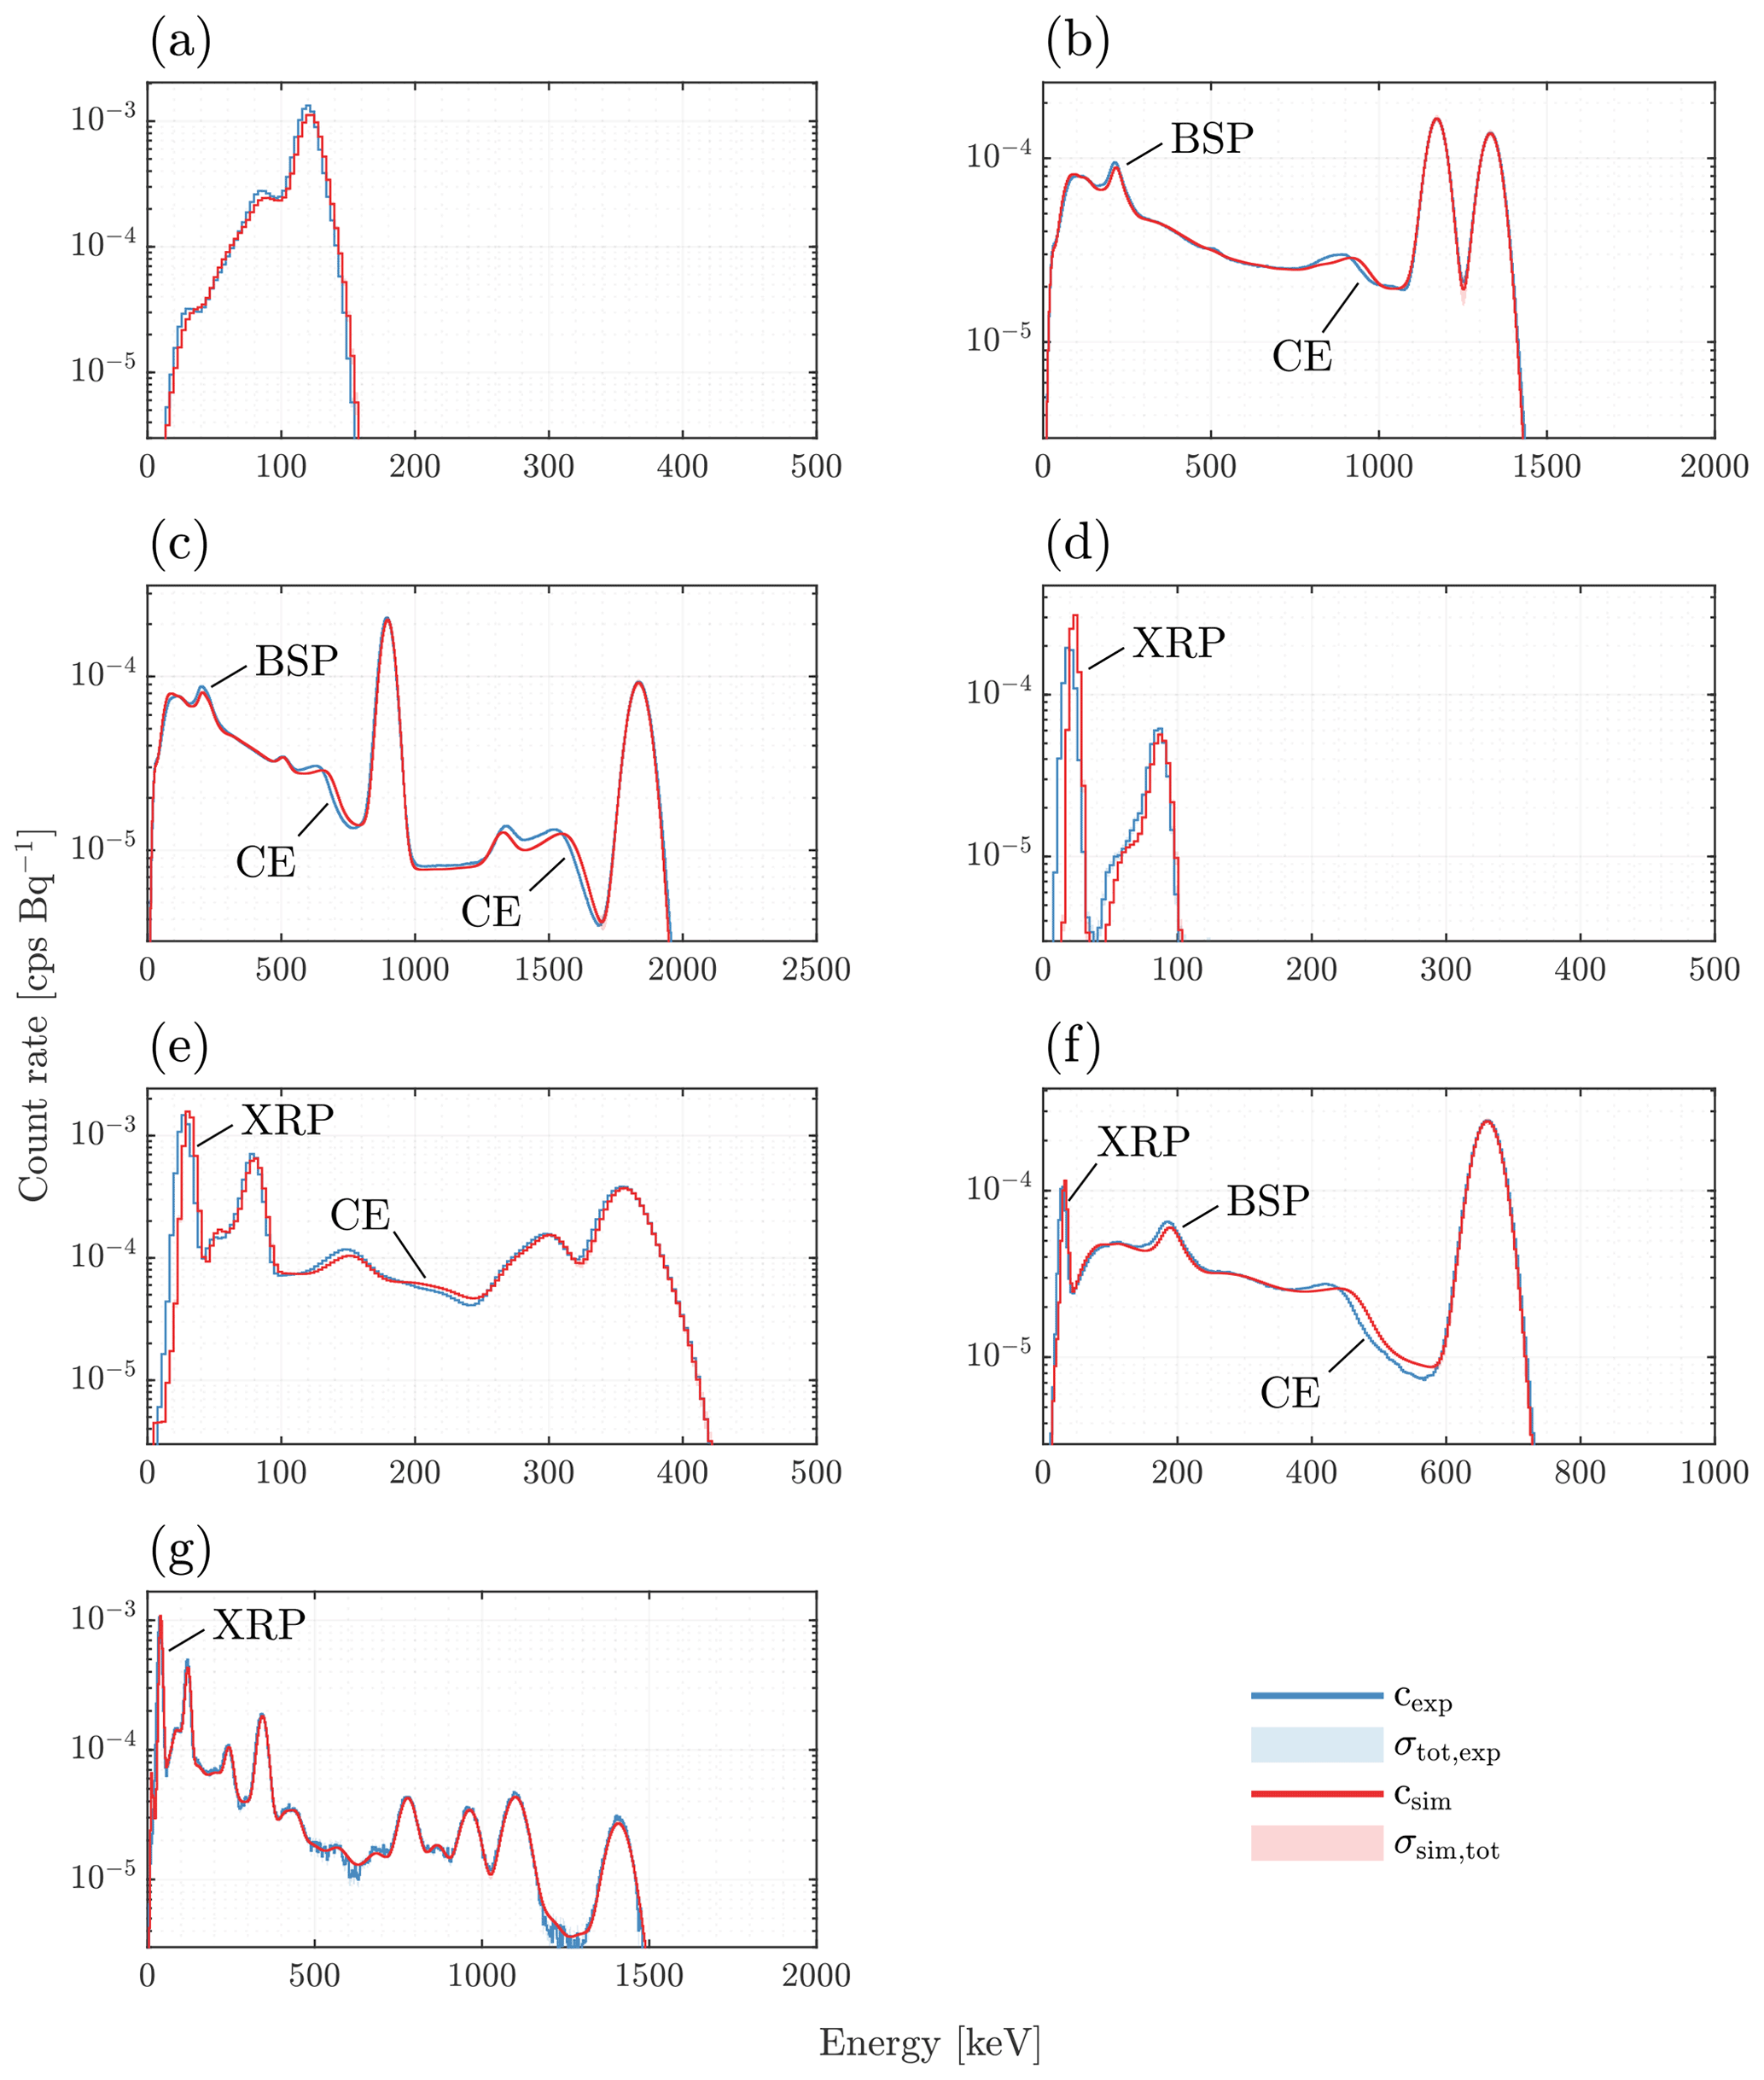
Figure 3Spectral comparison of the experimental and simulated detector response for different radiation sources using the summed scintillation crystal spectra. (a) 57Co. (b) 60Co. (c) 88Y. (d) 109Cd. (e) 133Ba. (f) 137Cs. (g) 152Eu. Uncertainties are provided as 1 SD values (σtot,exp, σtot,sim) for the experimental as well as the simulated spectra (only visible in Fig. 3b). Backscatter peaks (BSP), characteristic X-ray peaks (XRP) and Compton edges (CE) are highlighted.
3.2 Statistical analysis
To quantify the relative spectral error over the entire spectra between simulations and measurements, the corresponding adjusted box plots (Hubert and Vandervieren, 2008) shown in Fig. 4a were computed for all calibration sources using the Library for Robust Analysis (LIBRA) (Verboven and Hubert, 2005). The spectral range considered for the adjusted box plots was defined as . For EFEP,max, the maximum photon energy of the corresponding source using a detection threshold of 5 % with respect to the emission probability of the strongest line within the associated decay branch was used (cf. Table A1 in Appendix A).
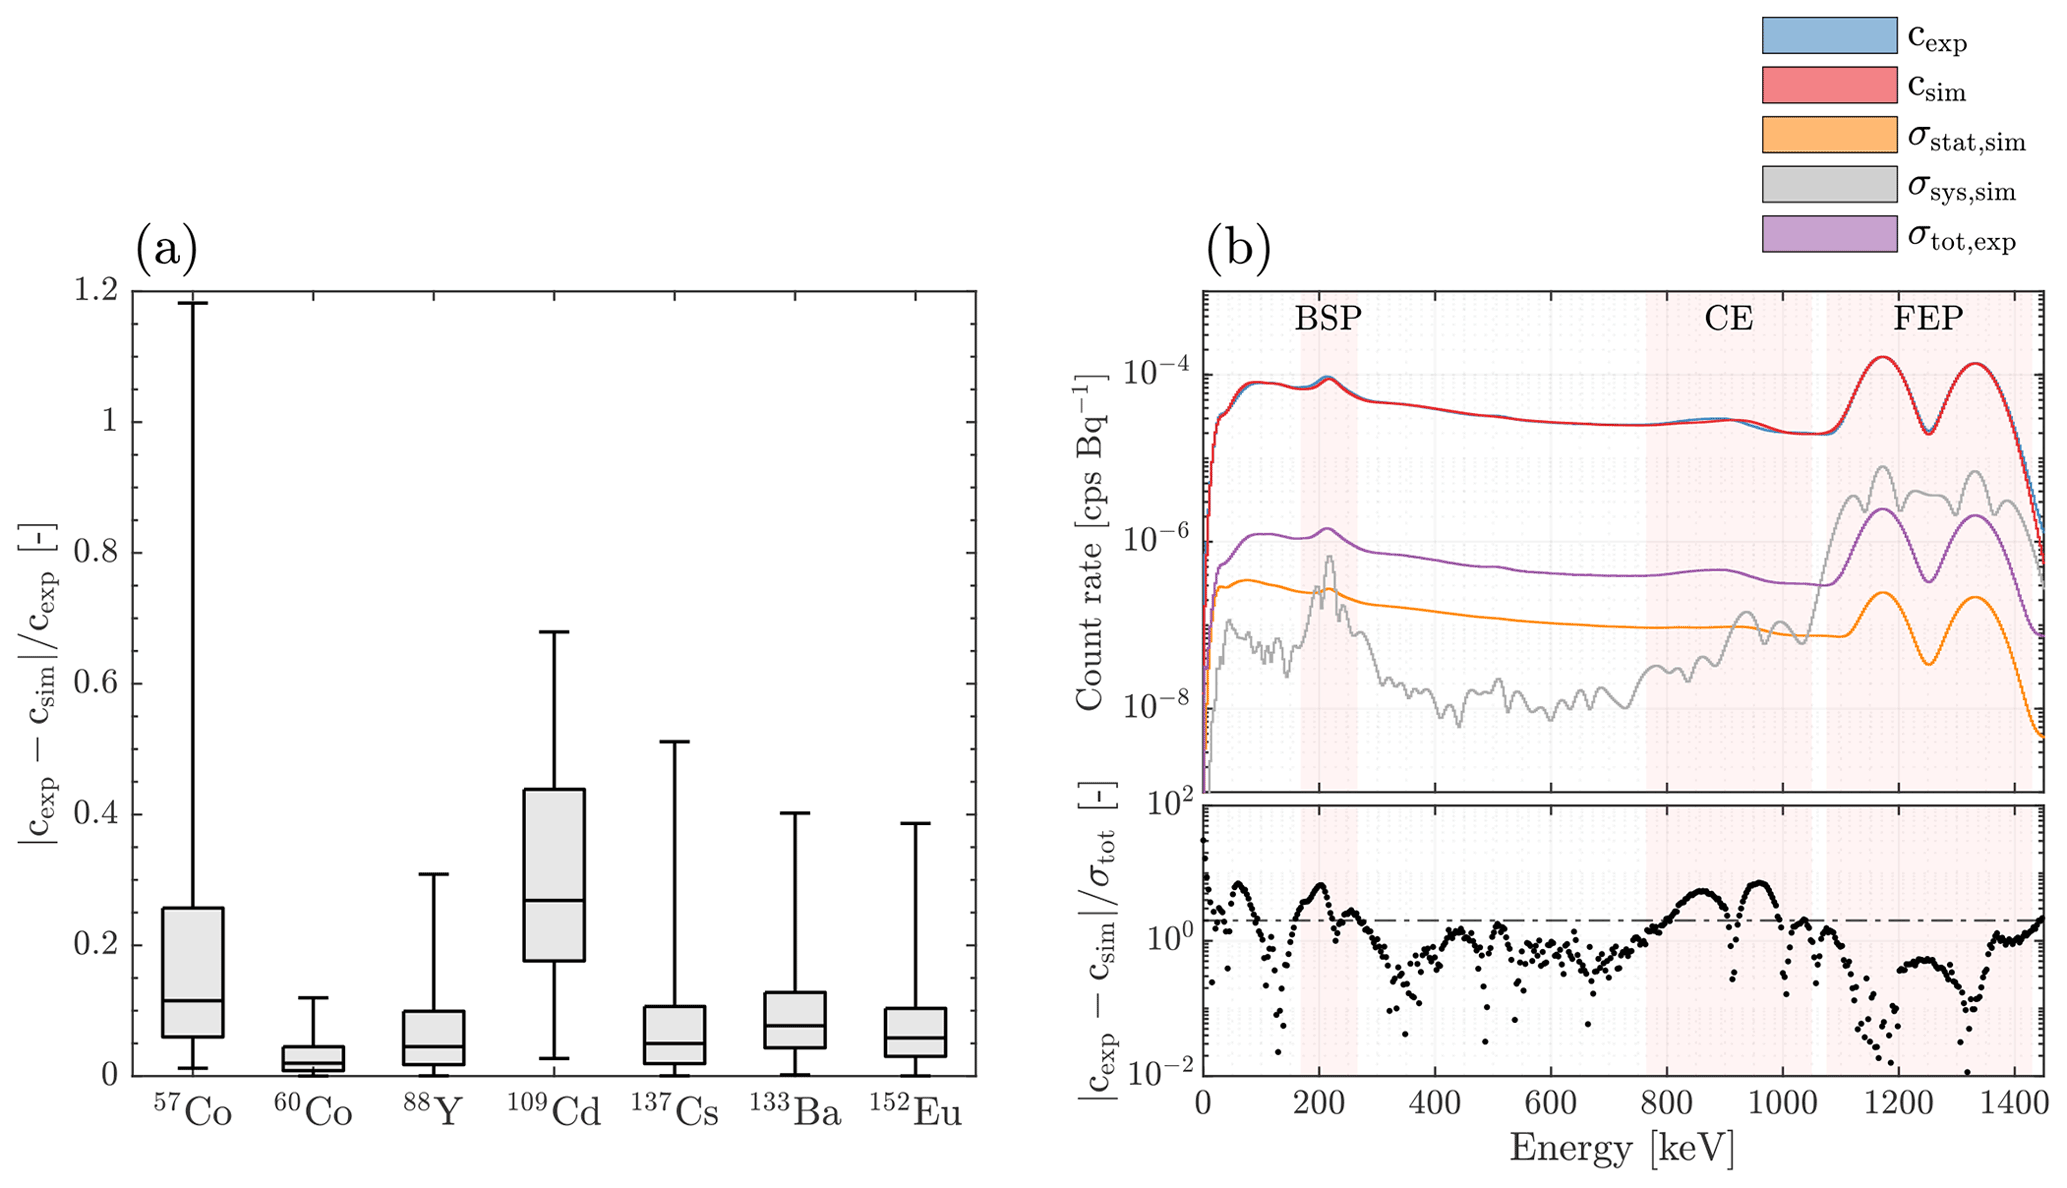
Figure 4Model accuracy and precision analysis for the summed scintillation crystal spectra. (a) Adjusted box plot characterizing the statistical distribution of the relative spectral error between the experimental and simulated spectral detector response for various radiation sources. The statistical analysis was performed using the Library for Robust Analysis (LIBRA) (Verboven and Hubert, 2005). (b) Uncertainty quantification for the 60Co spectral detector response. The mean count rates (cexp, csim) together with the corresponding uncertainty estimates (σtot,exp, σstat,sim, σsys,sim) using 1 SD values are shown both for the experimental and simulated spectral detector response. Distinct spectral regions, i. e. the backscatter peaks (BSP), the Compton edges (CE) as well as the full energy peaks (FEP) are highlighted. The normalized residual level with for a coverage factor of 2 is marked with the horizontal black dash-dotted line.
This statistical analysis shows a median relative spectral error < 10 % for five of the seven sources with respect to the defined spectral range. In contrast, the two low energy photon emitting sources 57Co and 109Cd exhibit a considerably larger median relative spectral error of about 12 % and 27 %, respectively.
This increased deviation can be explained by two factors. First, the empirical detector models, i. e. the energy calibration in Eq. (3) and detector resolution in Eq. (4), are based on calibration sources with the smallest evaluated FEP at 88.0336(1) keV. Consequently, the accuracy of the derived models deteriorates at lower spectral energies and the systematic uncertainty increases, especially due to discontinuities in the calibration and resolution models as a result of the characteristic X-ray lines of the NaI(Tl) itself (Bissaldi et al., 2009). This might also be the reason for the systematic deviations in the XRPs at the very low end of the count rate spectra highlighted in Fig. 3. Second, for the 109Cd source, a custom user routine had to be used (cf. Sect. 2.2.1), which only incorporates photon but no electron emission and related bremsstrahlung. This simplification deteriorates the accuracy and therefore increases the relative spectral error even further.
We want to point out that some of the previous studies adopted integrated detector channels around the FEP to estimate the model accuracy (Allyson and Sanderson, 1998; Billings and Hovgaard, 1999). This error metric is expected to give smaller uncertainty estimates compared to channel-resolved error metrics because the goodness-of-fit is only evaluated around the FEP neglecting most of the remaining spectrum dominated by scattered photons. For example, using the FEP integrated error metric, the relative spectral error for 88Y is equal to 1 % compared to the median relative spectral error of 5 % shown in the box plot in Fig. 4a.
3.3 Uncertainty analysis
To quantitatively assess the statistical significance of the deviations in the BSP and the CE, a detailed spectral uncertainty analysis is presented in Fig. 4b for the representative 60Co source, which includes both features of interest not obscured by other spectral features. Multiple interesting inferences can be drawn from this analysis.
First, the systematic uncertainty for the simulated spectrum csys,sim is the dominant contributor to the total uncertainty in the FEP and the BSP exceeding the statistical uncertainty cstat,sim by more than 1 order of magnitude. This confirms the conjecture of this study that a thorough uncertainty analysis including systematic uncertainties is essential for Monte Carlo based gamma-ray response simulations of AGRS systems.
Second, the residuals normalized by the total uncertainty and presented below the main spectral plot in Fig. 4b are consistently smaller than 2 indicated by the horizontal dash-dotted line except for the BSP, the CE and the very low part of the spectrum below about 100 keV. This implies that the difference between the simulated and measured FEP as well as the major part of the Compton continuum are well within the statistical and systematic uncertainties of the developed model and measurements considering a coverage factor of 2.
In contrast, the difference between the simulated and measured CE and BSP regions are statistically significant. It is worth adding that these findings are also supported by the statistical analysis of the 88Y and 137Cs radiation sources. The reader is referred to Appendix A for more details on these results as well as on the computation of the statistical and systematic uncertainties for both experimental and simulated count rate spectra.
3.4 Sensitivity analysis
As discussed in Sect. 2.2.1, besides the high-fidelity reference model (model A) used for all main simulations, five simplified models were defined to assess the sensitivity of specific model elements on the spectral detector response (model B–F). These additional models were evaluated for the representative 60Co source and the resulting spectra are presented together with the reference model and the measured spectrum in Fig. 5d. To quantify the relative spectral error between these different models and the measured spectrum, adjusted box plots were computed for three different spectral windows highlighting the low, middle and high part of the corresponding spectrum. These box plots are shown in Fig. 5a–c together with the spectral windows highlighted in Fig. 5d.

Figure 5Monte Carlo model sensitivity analysis for the summed 60Co scintillation spectra. (a)–(c) Adjusted box plots characterizing the statistical distribution of the relative spectral error between the experimental and simulated spectral detector response for different Monte Carlo models (A: reference; B: no laboratory elements; C: no detector box elements; D: no source elements; E: no additional laboratory equipment elements; F: MgO reflector) and three spectral windows: (a) low: , middle: (b) and (c) high: . The statistical analysis was performed using the Library for Robust Analysis (LIBRA) (Verboven and Hubert, 2005). (d) Mean count rate spectra for the 60Co radiation measurement (cexp) and the different Monte Carlo models () described above. The three spectral windows used to evaluate the box plots in Fig. 5a–b are highlighted.
The results from these sensitivity analysis can be summarized as follows: In the low spectral window featuring the backscatter peak and tail of the Compton continuum, the laboratory room (model B) has by far the highest impact on the spectrum followed by the detector box (model C) and source materials (model D). In the middle spectral window featuring the Compton continuum, the detector box (model C) shows the highest sensitivity followed by the source materials (model D). For the high spectral window containing the two FEPs, only the detector box materials (model C) seem to have a significant sensitivity on the spectral detector response. The two remaining models, i. e. the laboratory equipment (model E) and the reflector (model F) have negligible impact on the detector response for all three spectral windows.
These findings imply that the laboratory room, the source and the detector box elements are essential parts of the Monte Carlo model for an accurate detector response simulation. In contrast, the additional laboratory equipment and the reflector seem to be of less importance considering the adopted source-detector configuration. It is worth noting that the calibration sources in this study exhibit comparably low attenuation and self-shielding. Consequently, for sources with metal shields or bigger active volume sources, the sensitivity of the source elements on the spectral detector response is expected to be even higher.
3.5 Scintillator non-proportionality
Based on this sensitivity analysis results from the previous section, the bias in the BSP can be explained by the systematic uncertainties in the laboratory room, detector box and source elements. On the other hand, the CE region seems to be unaffected by all analyzed model elements (cf. Fig. 5d).
Interestingly, related studies adopting specialized Monte Carlo codes for NaI(Tl) scintillation detector response simulations under laboratory conditions have reported exactly the same deviations in the CE (Saito and Moriuchi, 1981; Shi et al., 2002; Gardner and Sood, 2004). Using electron spectroscopy and Compton coincidence measurements, this bias in the CE region could be attributed to the scintillator non-proportionality of NaI(Tl) and corrected for by implementing non-proportionality light yield models for the electron response in the scintillation crystals (Zerby et al., 1961; Saito and Moriuchi, 1981; Cano-Ott et al., 1999; Shi et al., 2002; Gardner and Sood, 2004; Payne et al., 2009; Moses et al., 2012). In addition, it was found that the deterioration of pulse-height spectra by the scintillator non-proportionality increases with the volume of the scintillation crystals due to the increased number of ways that the photons can interact with the crystal (Cano-Ott et al., 1999).
These findings suggest that the neglected scintillator non-proportionality is also in this study the cause for the observed bias in the CE. This conjecture is supported by the fact that standard AGRS systems contain typically the largest commercially available prismatic scintillation crystals and based on the results of other studies (Cano-Ott et al., 1999), a significant effect of the scintillator non-proportionality on the spectral detector response is expected for these systems.
The Monte Carlo model developed to simulate the spectral detector response of a standard AGRS system shows excellent accuracy and precision with a median relative spectral error < 10 % for most of the radionuclides, i. e. 60Co, 88Y, 133Ba, 137Cs and 152Eu. This is a significant improvement over previously developed AGRS detector models, which possessed a relative spectral error > 10 % (Allyson and Sanderson, 1998). This superiority in model accuracy and precision can be explained by the high-fidelity physics models adopted in the FLUKA code (Battistoni et al., 2015) compared to the simplified physics models applied in the in-house codes used in previous studies (Allyson and Sanderson, 1998; Billings and Hovgaard, 1999) as well as improved accuracy in the geometric and material properties of the corresponding Monte Carlo model. This implies that, due to the significant improvement in the radiation transport code capabilities, e. g. for FLUKA, EGSnrc, GEANT or MCNP, over the past two decades, the in-house codes specifically developed for AGRS systems (Allyson and Sanderson, 1998; Billings and Hovgaard, 1999) became to a certain degree obsolete.
Moreover, compared to previous studies (Allyson and Sanderson, 1998; Billings and Hovgaard, 1999; Kulisek et al., 2018), a significant improvement in the model accuracy for the low spectral range < 100 keV was achieved by incorporating the surrounding laboratory elements together with a detector specific LLD model. Consequently, the developed model can also be adopted to calibrate AGRS systems for low photon energy emitting radionuclides such as 241Am or 109Cd, which was not possible with previously developed models (Kulisek et al., 2018).
A sensitivity analysis confirmed the conjecture that the laboratory room, the source and the detector box elements are essential parts of the Monte Carlo model for an accurate detector response simulation. In consequence, neglecting the detector box elements, i. e. equipment surrounding the scintillation crystals such as aluminum casings, PMT, MCA or insulating foam as it was done by Allyson and Sanderson (1998) and Billings and Hovgaard (1999), seems to be questionable at best.
Based on a thorough uncertainty analysis incorporating statistical and systematic uncertainties, two important conclusions could be drawn. First, the systematic uncertainty for the simulated spectrum is the dominant contributor to the total uncertainty in the FEP and the BSP exceeding the statistical uncertainty by more than 1 order of magnitude. This systematic uncertainty is likely to be even larger for previous studies due to the reduced number of calibration sources used to derive the empirical detector models in those studies. Consequently, the incorporation of systematic uncertainties is essential in the assessment of the statistical significance for detector response simulations of AGRS systems. Second, deviations between the simulations and the measurements in the FEP as well as in the major part of the Compton continuum are statistically insignificant.
In contrast, differences in the BSP and the CE regions are statistically significant and can be attributed to the systematic uncertainties in the laboratory room model on the one hand and the neglected scintillator non-proportionality on the other hand. Previous studies have shown that the effect of the scintillator non-proportionality on the spectral detector response is increasing for larger scintillation crystals (Cano-Ott et al., 1999). These findings imply that the linear energy deposition model, which was the standard for previously developed simulation models (Allyson and Sanderson, 1998; Billings and Hovgaard, 1999; Torii et al., 2013; Sinclair et al., 2016; Kulisek et al., 2018; Zhang et al., 2018), is not appropriate for standard AGRS systems with 10.2 cm × 10.2 cm × 40.6 cm prismatic NaI(Tl) scintillation crystals in general.
The developed and validated detector model presented herein is an important step towards a simulation-based calibration methodology for AGRS systems. In contrast to previous studies (Billings and Hovgaard, 1999; Torii et al., 2013; Sinclair et al., 2016; Zhang et al., 2018), our detector model allows not only FEP characterization but also accurate simulation-based spectral predictions over the entire spectral domain relevant for AGRS applications. This prediction power can be utilized to build a detector response matrix as a function of the spectral energy and relative angular direction of the gamma-ray photons. In combination with an aircraft and an environmental model, standard spectra could be computed and used for full spectrum analysis (FSA) of the measured spectral data (Dickson et al., 1981; Grasty et al., 1985; Minty et al., 1998). Compared to the standard window evaluation methodology (Erdi-Krausz et al., 2003), FSA is particularly promising for low count rate applications like AGRS as not only the events in the FEPs are used but all the available spectral information is processed. Consequently, improved accuracy and precision for the identification and quantification of terrestrial radionuclide sources as well as reduced minimum detectable activity values can be expected. Moreover, thanks to the simulation-based approach, the standard AGRS systems could be calibrated for a significantly extended range of radionuclides such as 241Am, 131I or 192Ir. This extension is of high relevance for homeland security applications against nuclear terrorism as well as radiation protection applications in case of orphan source incidents or severe nuclear accidents (Acton et al., 2007; Torii et al., 2013).
In summary, the developed model shows superior accuracy and precision compared to previous models and is an important step towards a simulation-based calibration of AGRS systems. Moreover, thorough model validation and uncertainty analysis revealed statistically significant deviations in the BSP and the CE regions. Embedding of scintillator non-proportionality models in the Monte Carlo codes, characterizing and validating the angular spectral gamma-ray response as well as incorporating material and geometrical uncertainties in the systematic uncertainty analysis are necessary steps to improve the model accuracy and uncertainty estimates further and correct for the discussed biases.
Following the standard methodology of uncertainty and uncertainty propagation (Abernethy et al., 1985; Knoll, 2010), the statistical and systematic uncertainties for the experimental and simulated count rate spectra were determined. For the radiation measurements, the statistical uncertainty of the net count rate spectra cexp,k (Eq. 1) characterized by the standard deviation was computed adopting a probabilistic Poisson model (Knoll, 2010):
where Cgr,k and Cbg,k are the gross and background count spectra in channel k together with the gross and background measurement live time tgr and tbg, respectively. The small statistical uncertainty in the live time measurement is neglected. The uncertainty induced by the source activity A normalization in Eq. (1) is quantified using the standard error propagation methodology for independent variables (Abernethy et al., 1985):
with the reference activity A0 and associated uncertainty provided by the vendor, the source half life and associated uncertainty provided by Pearce (2008) (cf. Table A1) as well as the time difference between the reference date t0 and the measurement date t together with the associated uncertainty σΔt. To compute the source activity A as a function of the measurement date t, the fundamental exponential law of decay is adopted, i. e. (Knoll, 2010). The total experimental uncertainty is summarized as follows according to Abernethy et al. (1985):
For the simulations, the statistical uncertainty of the net count rate spectrum csim,k (cf. Eq. 7) was computed adopting the sample standard deviation (Knoll, 2010) as follows:
where csim,ik are the individual broadened energy deposition events in the detector channel k (cf. Eq. 6), Ndep the number of recorded events in a specific crystal and Npr the number of simulated primaries. It is good practice in Monte Carlo studies to report not only the estimated uncertainty in the sample mean csim,k using the sample standard deviation but also the so called variance of the sample variance VOV to quantify the statistical uncertainty in itself (Forster et al., 1994):
Table A1Physical properties of the calibrated radiation sources adopted for detector characterization and simulation model validation measurements. Uncertainty values are stated as 1 SD values and provided as last significant figures, e. g. 0.12(3) corresponds to 0.12 ± 0.03.
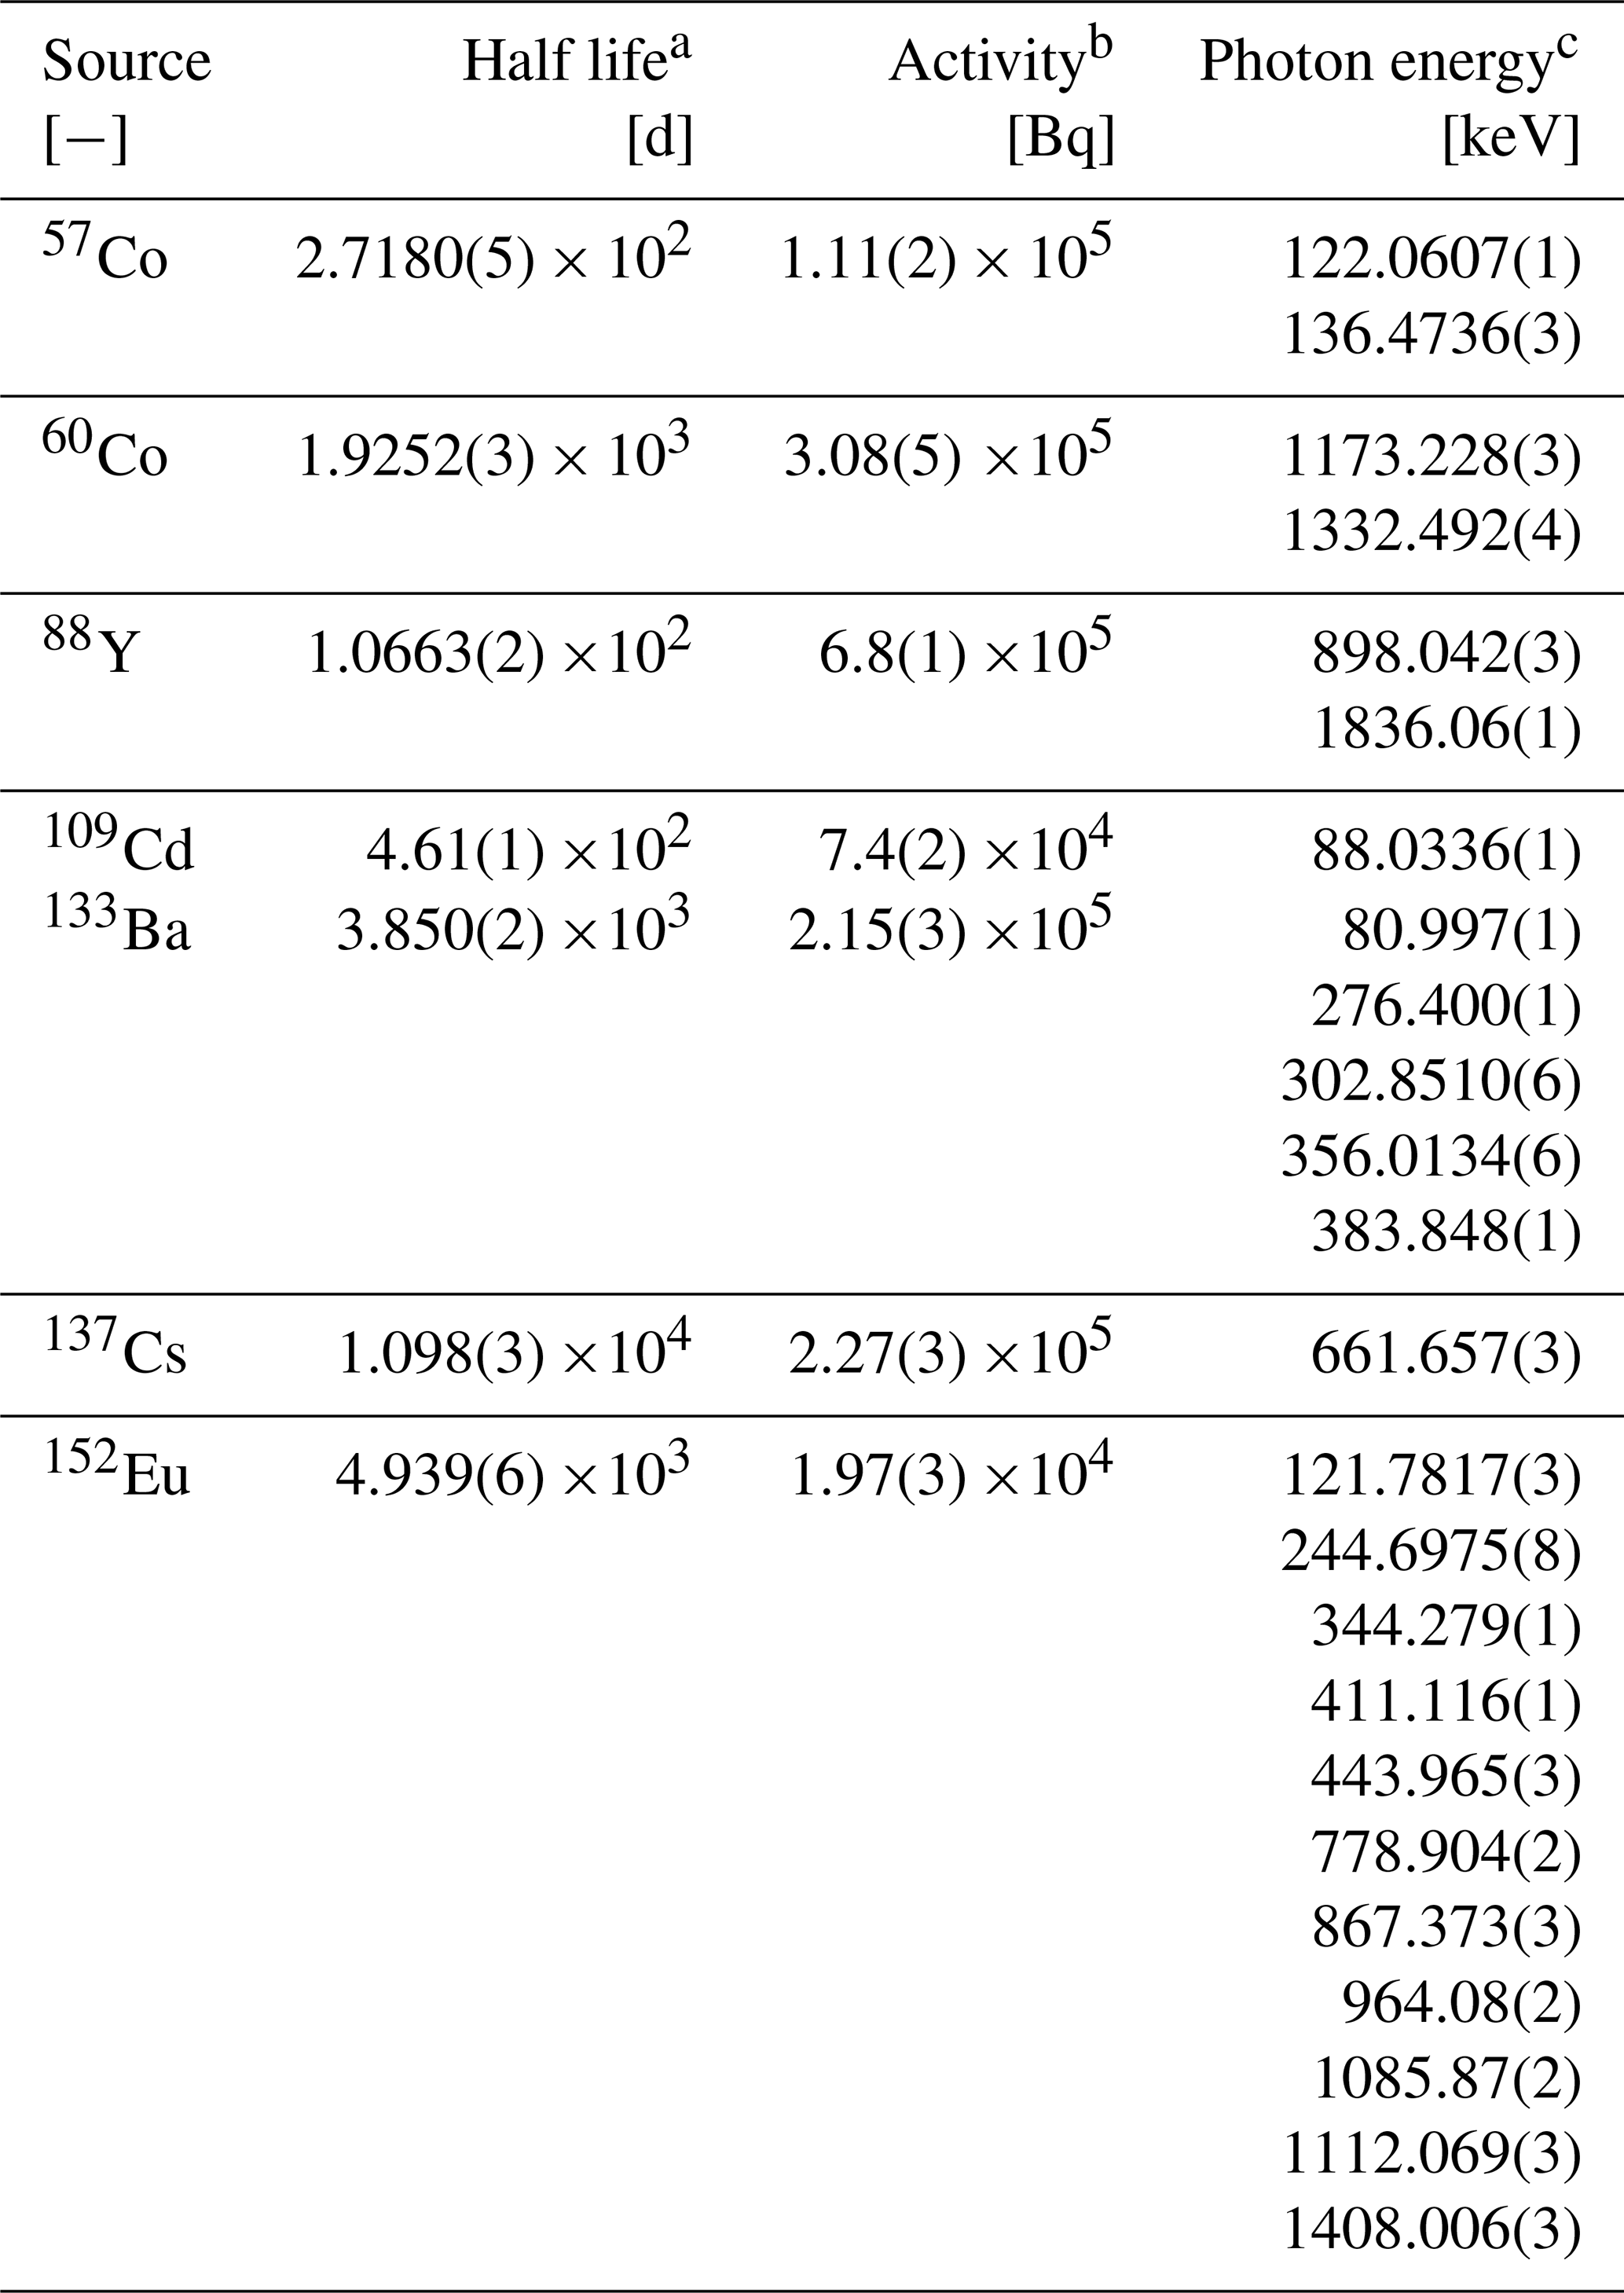
a Half life values are from Pearce (2008). b The activity of the calibrated radiation sources is computed for the corresponding measurement date based on the calibration certificate. c The photon energies are provided for a minimum energy of 50 keV and a detection threshold of 5 % with respect to the emission probability of the strongest line within the corresponding decay branch using the ENDF/B-VIII.0 nuclear data file library (Brown et al., 2018).
The propagation of the systematic uncertainties in the post-processing steps discussed in Sect. 2.2.2 was determined with a Monte Carlo sampling technique. The probabilistic model for the input parameters, i. e. the empirical model parameters interpreted as a random vector (cf. Eqs. 3 and 4), is defined as a multivariate normal distribution adopting the mean and standard deviations derived in the regression analysis (cf. Sect. 2.1.3). The independently drawn input samples are then propagated through the postprocessing pipeline, i. e. the three steps described in Sect. 2.2.2, to obtain the corresponding spectral count rate samples with . These samples can then be used to compute the sample standard deviation and by doing so quantify the systematic uncertainty with respect to the empirical model parameters d1, b1 and b2. The total uncertainty characterized by the sample standard deviation can be summarized in the same way as for the experimental uncertainty according to Abernethy et al. (1985):
We want to point out that, given the spectral trends in the sensitivity analysis presented in Sect. 3.4, the qualitative conclusions are not expected to be overshadowed by the neglected systematic uncertainties in this study.
In Fig. A1, the uncertainty analysis discussed in Sect. 3.3 was repeated for other sources, which, similar to 60Co, contain both spectral features of interest, i. e. the backscatter peak (BSP) as well as the Compton edge (CE), not obscured by other spectral features.
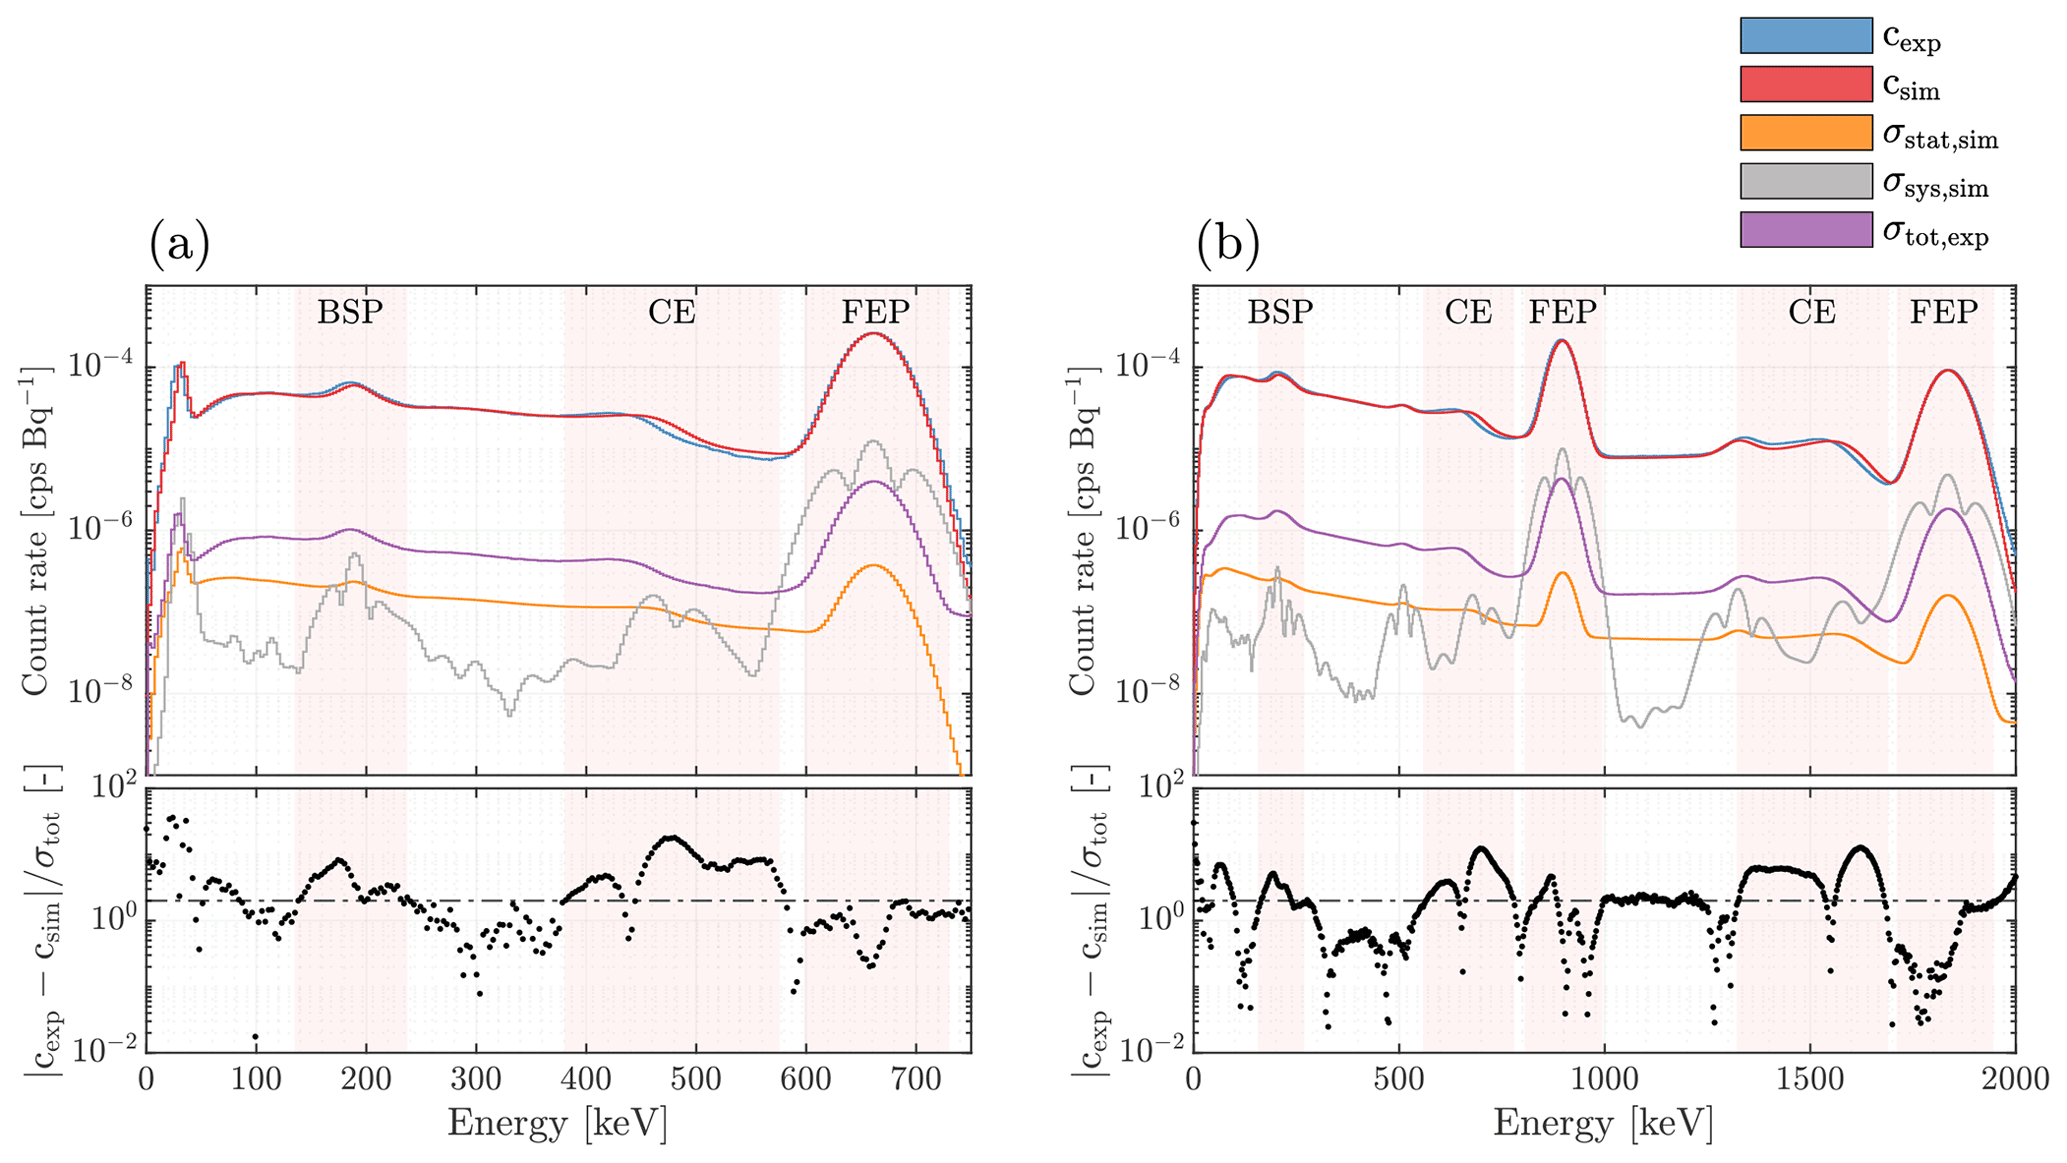
Figure A1Uncertainty quantification of the spectral detector response for the summed scintillation crystal spectra. (a) 137Cs radiation source. (b) 88Y radiation source. The mean count rate spectra (cexp, csim) together with the corresponding uncertainty estimates (σtot,exp, σstat,sim, σsys,sim) using 1 SD values are shown both for the experimental and simulated spectral detector response. Distinct spectral regions, i. e. the backscatter peaks (BSP), the Compton edges (CE) as well as the full energy peaks (FEP) are highlighted. The normalized residual level with for a coverage factor of 2 is marked with the horizontal black dash-dotted line.
As already reported in previous studies (Kulisek et al., 2018), at the very low end of the spectral detector range, typically below 100 keV for AGRS systems, the experimental spectra are significantly lower than the model predictions. This discrepancy can be mainly attributed to the lower level discriminator (LLD) adopted in the MCA (Knoll, 2010). So far, no attempts have been found in the literature to include this effect in a consistent way for AGRS Monte Carlo models. In this study, we apply a Gaussian model to characterize this lower level discriminator:
where Φ(⋅) is the standard normal cumulative distribution function and μLLD, σLLD are the LLD model parameters. This heuristic model is motivated by the idea that the fixed lower level threshold is fluctuating due to inherent electronic noise in the MCA and associated electronics resulting in a normally distributed cut-off with the mean equal to the predefined LLD threshold and a standard deviation determined by the level of electronic noise.
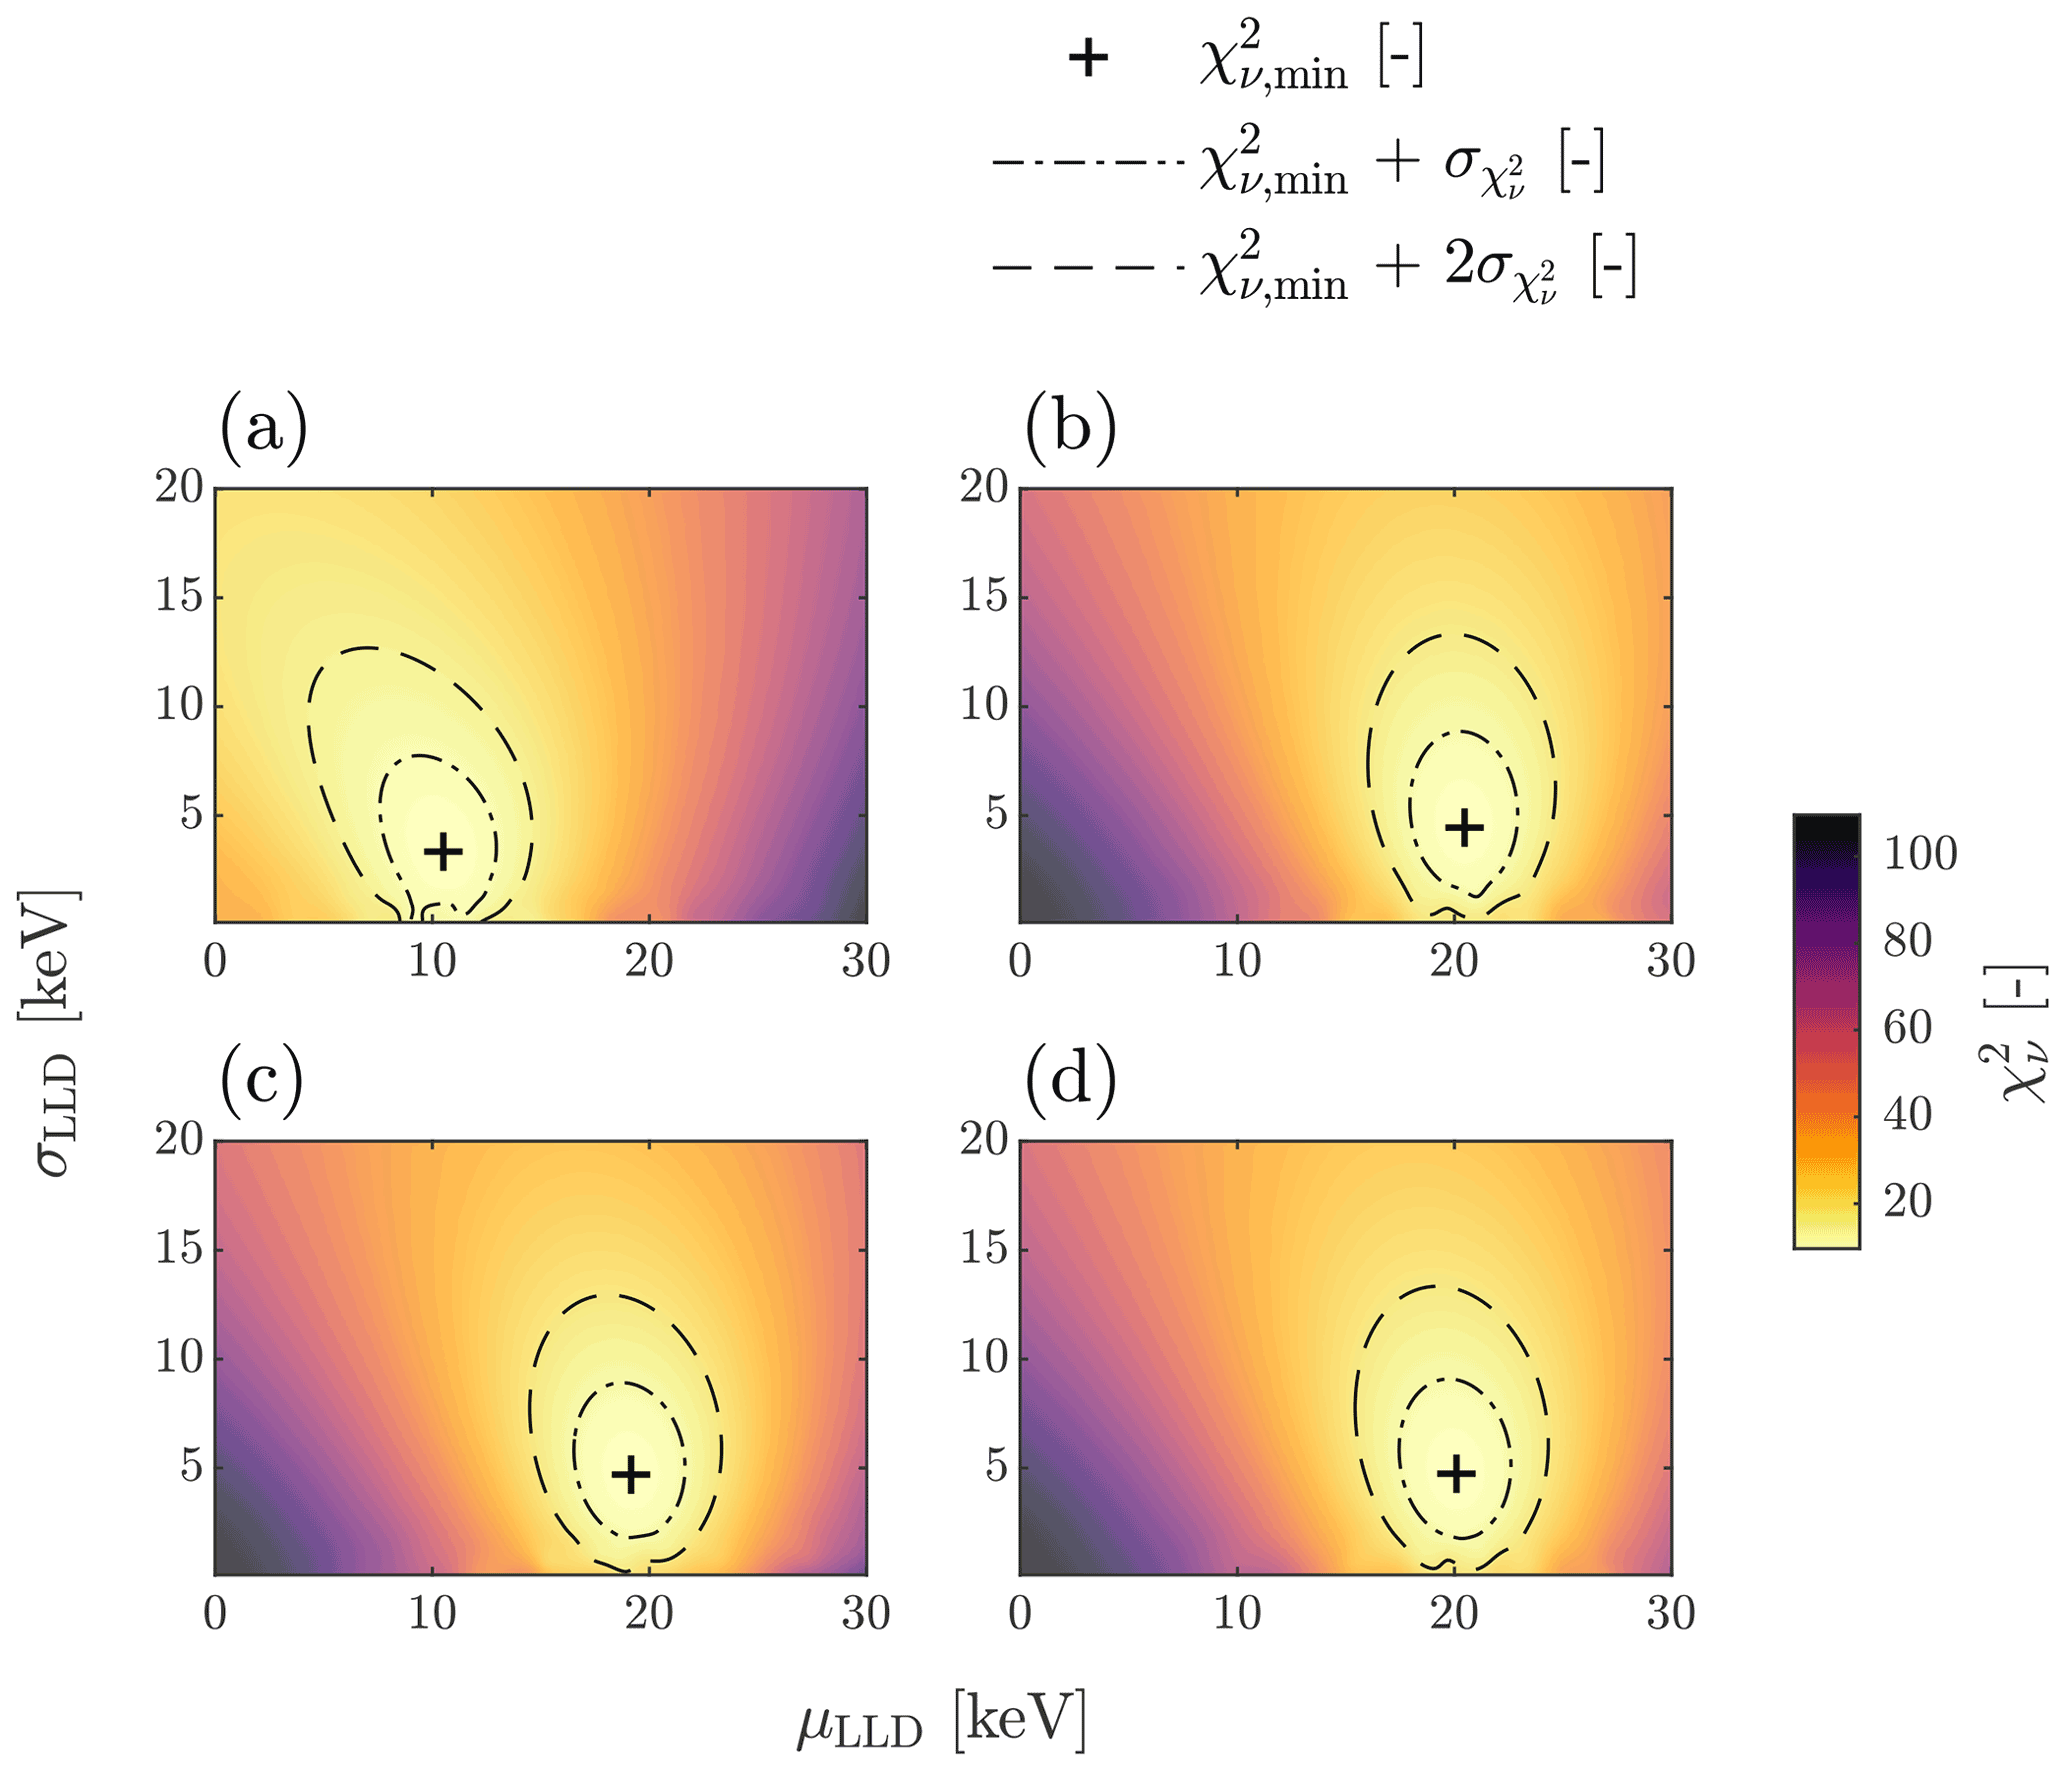
Figure B1 contour maps for the four individual scintillation crystals 1–4 (a–d) as a function of the lower level discriminator model parameters μLLD and σLLD . The global minima () are marked with a plus sign together with the corresponding 1 and 2-σ confidence regions indicated by the dashed-dotted and dashed contour lines, respectively.
The LLD model parameters μLLD, σLLD are determined by a numerical optimization approach, i. e. simulated spectra, which include the LLD model, are compared with experimental spectra and the model parameters are optimized according to some objective function. In this study, we adopt the Chi-squared statistic () as the objective function to solve the global minimization problem:
where the objective function is defined as follows:
with . The global minimization problem in Eq. (B2) is solved by a radial basis surrogate solver (Regis and Shoemaker, 2007) provided by the MATLAB® Global Optimization Toolbox. The sample size of the solver was set to 103 and the convergence was checked by convergence plots. The 60Co measurement and simulation model was selected for the LLD optimization procedure because this source was the only one measured in this study that does not show any characteristic X-ray emission above 10 keV, which could obscure the LLD threshold. The resulting contour maps for the four crystals are presented in Fig. B1. For each crystal, the global minimum () marked by the plus sign was successfully found. Confidence limits are illustrated adopting 1 and 2 SD contour lines (Avni, 1976). As it emerges from this analysis, the mean LLD parameter for the detector crystal 1 is significantly smaller compared to the crystals 2, 3 and 4. The spectra presented in Fig. 3 confirm that the LLD model corrects not only the LLD effect for the 60Co source adequately but also for the other sources, which were not used to fit the LLD model parameters. For the reader's convenience, the optimized LLD model parameters and will be referred to as μLLD and σLLD in the remainder of this study.
| Symbols | |
| A | Source activity [Bq] |
| a | Normalizing Gaussian model parameter [cps Bq−1] |
| B1, B2 | Random spectral resolution model variables [−] |
| b1, b2 | Realizations of B1, B2 [−] |
| C | Count spectrum [−] |
| c | Count rate spectrum normalized by the source activity A [cps Bq−1] |
| D1 | Random slope variable for the spectral energy calibration model [keV−1] |
| d1 | Realization of D1 [keV−1] |
| E | Spectral energy [keV] |
| Edep | Energy deposition [keV] |
| Esim | Simulated energy deposition [keV] |
| H | Channel number [−] |
| k | Coverage factor [−] |
| μ | Mean Gaussian model parameter [−] |
| N | Cardinality of a set [−] |
| R2 | Coefficient of determination [−] |
| σ | Standard deviation Gaussian model parameter [−] |
| t | Measurement live time [s] |
| Source half life [s] | |
| X | Random model parameter vector |
| 𝒳 | Random model parameter set |
| x | Realization of X |
| 𝒴 | Random response variable set |
| Mathematical operators | |
| FWHM (⋅) | Full width at half maximum |
| Normal distribution | |
| VOV (⋅) | Variance of the sample variance |
| μ(⋅) | Sample mean |
| σ(⋅) | Sample standard deviation |
| σres(⋅) | Standard deviation resolution model |
| Φ(⋅) | Standard normal cumulative distribution function |
| φ(⋅) | Standard normal probability density |
| Reduced Chi–squared statistic | |
| Subscripts | |
| 0 | Reference value |
| b | Experimental baseline component |
| bg | Experimental background component |
| exp | Experimental net component |
| gr | Experimental gross component |
| i | Energy deposition event index |
| k | Channel index |
| l | Full energy peak index |
| MC | Monte Carlo |
| max | Maximum |
| min | Minimum |
| pk | Gaussian peak |
| pois | Poisson model component |
| pr | Simulated primary |
| res | Resolution |
| sim | Simulated net component |
| stat | Statistical uncertainty component |
| sys | Systematic uncertainty component |
| tot | Total uncertainty component combining statistical and systematic uncertainty components |
| Superscripts | |
| ′ | Subset |
| Estimator | |
| * | Component without LLD correction |
| m | Monte Carlo sample index |
| Acronyms | |
| AGRS | Airborne gamma-ray spectrometry |
| BSP | Backscatter peak |
| CE | Compton edge |
| cps | Counts per second |
| FEP | Full energy peak |
| FSA | Full spectrum analysis |
| IAEA | International Atomic Energy Agency |
| LIBRA | Library for Robust Analysis |
| LLD | Lower level discriminator |
| MCA | Multi-channel analyzer |
| OAT | One at a time |
| PE | Polyethylene foam |
| PI | Prediction interval |
| PMT | Photomultiplier tube |
| PTFE | Polytetrafluoroethylene |
| SD | Standard deviation |
| WNLLS | Weighted non-linear least-squares |
| XRP | Characteristic X-ray peak |
The custom FLUKA user routines adopted in the Monte Carlo simulations are deposited on the ETH Research Collection repository for open access: https://doi.org/10.3929/ethz-b-000528892 (Breitenmoser et al., 2022a).
The radiation measurement data presented herein are deposited on the ETH Research Collection repository for open access: https://doi.org/10.3929/ethz-b-000528920 (Breitenmoser et al., 2022b).
DB and GB planned the study and performed the measurements; DB performed the Monte Carlo simulations, analyzed the data, and wrote the manuscript draft; EGY and SM acquired the funding for this study; DB, EGY, GB, MMK, SM reviewed and edited the manuscript.
The contact author has declared that none of the authors has any competing interests.
Publisher’s note: Copernicus Publications remains neutral with regard to jurisdictional claims in published maps and institutional affiliations.
This article is part of the special issue “Geoscience applications of environmental radioactivity (EGU21 GI6.2 session)”.
The authors would like to thank Kilian Meier for his support in designing and constructing the source holder for the calibration source disks. Furthermore, the authors gratefully acknowledge the technical support by Dominik Werthmüller for the execution of the Monte Carlo simulations on the computer cluster at PSI.
This research has been supported by the Swiss Federal Nuclear Safety Inspectorate (grant no. CTR00836).
This paper was edited by Gerti Xhixha and reviewed by two anonymous referees.
Abernethy, R. B., Benedict, R. P., and Dowdell, R. B.: ASME measurement uncertainty, J. Fluids Eng., 107, 161–164, https://doi.org/10.1115/1.3242450, 1985. a, b, c, d
Acton, J. M., Rogers, M. B., and Zimmerman, P. D.: Beyond the Dirty Bomb: Re-thinking Radiological Terror, Global Politics and Strategy, 49, 151–168, https://doi.org/10.1080/00396330701564760, 2007. a
Allyson, J. D. and Sanderson, D. C.: Monte Carlo simulation of environmental airborne gamma-spectrometry, J. Environ. Radioactiv., 38, 259–282, https://doi.org/10.1016/S0265-931X(97)00040-4, 1998. a, b, c, d, e, f, g, h, i, j, k, l
Androulakaki, E. G., Kokkoris, M., Skordis, E., Fatsea, E., Patiris, D. L., Tsabaris, C., and Vlastou, R.: Implementation of FLUKA for γ-ray applications in the marine environment, J. Environ. Radioactiv., 164, 253–257, https://doi.org/10.1016/j.jenvrad.2016.08.008, 2016. a
Avni, Y.: Energy spectra of X-ray clusters of galaxies, The Astrophysical Journal, 210, 642–646, https://doi.org/10.1086/154870, 1976. a
Battistoni, G., Boehlen, T., Cerutti, F., Chin, P. W., Esposito, L. S., Fassò, A., Ferrari, A., Lechner, A., Empl, A., Mairani, A., Mereghetti, A., Ortega, P. G., Ranft, J., Roesler, S., Sala, P. R., Vlachoudis, V., and Smirnov, G.: Overview of the FLUKA code, Ann. Nucl. Energy, 82, 10–18, https://doi.org/10.1016/j.anucene.2014.11.007, 2015. a, b, c
Billings, S. and Hovgaard, J.: Modeling detector response in airborne gamma-ray spectrometry, Geophysics, 64, 1378–1392, https://doi.org/10.1190/1.1444643, 1999. a, b, c, d, e, f, g, h, i, j
Bissaldi, E., Von Kienlin, A., Lichti, G., Steinle, H., Bhat, P. N., Briggs, M. S., Fishman, G. J., Hoover, A. S., Kippen, R. M., Krumrey, M., Gerlach, M., Connaughton, V., Diehl, R., Greiner, J., Van Der Horst, A. J., Kouveliotou, C., McBreen, S., Meegan, C. A., Paciesas, W. S., Preece, R. D., and Wilson-Hodge, C. A.: Ground-based calibration and characterization of the Fermi gamma-ray burst monitor detectors, Exp. Astron., 24, 47–88, https://doi.org/10.1007/s10686-008-9135-4, 2009. a
Böhlen, T. T., Cerutti, F., Chin, M. P., Fassò, A., Ferrari, A., Ortega, P. G., Mairani, A., Sala, P. R., Smirnov, G., and Vlachoudis, V.: The FLUKA Code: Developments and challenges for high energy and medical applications, Nucl. Data Sheets, 120, 211–214, https://doi.org/10.1016/j.nds.2014.07.049, 2014. a, b
Breitenmoser, D., Butterweck, G., Kasprzak, M. M., Yukihara, E. G., and Mayer, S.: FLUKA user routines for spectral detector response simulations, Research Collection [code], https://doi.org/10.3929/ethz-b-000528892, 2022a. a
Breitenmoser, D., Butterweck, G., Kasprzak, M. M., Yukihara, E. G., and Mayer, S.: Laboratory based Spectral Measurement Data of the Swiss Airborne Gamma-ray Spectrometer RLL, Research Collection [data set], https://doi.org/10.3929/ethz-b-000528920, 2022b. a
Brown, D. A., Chadwick, M. B., Capote, R., Kahler, A. C., Trkov, A., Herman, M. W., Sonzogni, A. A., Danon, Y., Carlson, A. D., Dunn, M., Smith, D. L., Hale, G. M., Arbanas, G., Arcilla, R., Bates, C. R., Beck, B., Becker, B., Brown, F., Casperson, R. J., Conlin, J., Cullen, D. E., Descalle, M. A., Firestone, R., Gaines, T., Guber, K. H., Hawari, A. I., Holmes, J., Johnson, T. D., Kawano, T., Kiedrowski, B. C., Koning, A. J., Kopecky, S., Leal, L., Lestone, J. P., Lubitz, C., Márquez Damián, J. I., Mattoon, C. M., McCutchan, E. A., Mughabghab, S., Navratil, P., Neudecker, D., Nobre, G. P., Noguere, G., Paris, M., Pigni, M. T., Plompen, A. J., Pritychenko, B., Pronyaev, V. G., Roubtsov, D., Rochman, D., Romano, P., Schillebeeckx, P., Simakov, S., Sin, M., Sirakov, I., Sleaford, B., Sobes, V., Soukhovitskii, E. S., Stetcu, I., Talou, P., Thompson, I., van der Marck, S., Welser-Sherrill, L., Wiarda, D., White, M., Wormald, J. L., Wright, R. Q., Zerkle, M., Žerovnik, G., and Zhu, Y.: ENDF/B-VIII.0: The 8th Major Release of the Nuclear Reaction Data Library with CIELO-project Cross Sections, New Standards and Thermal Scattering Data, Nuclear Data Sheets, 148, 1–142, https://doi.org/10.1016/j.nds.2018.02.001, 2018. a, b, c
Butterweck, G., Bucher, B., Breitenmoser, D., Rybach, L., Poretti, C., Maillard, S., Kasprzak, M., Ferreri, G., Gurtner, A., Astner, M., Hauenstein, F., Straub, M., Bucher, M., Harm, C., Scharding, G., and Mayer, S.: Aeroradiometric measurements in the framework of the Swiss exercise ARM20, Tech. rep., Paul Scherrer Institute, Villigen PSI, Switzerland, https://doi.org/10.13140/RG.2.2.15326.51526, 2021. a
Cano-Ott, D., Tain, J. L., Gadea, A., Rubio, B., Batist, L., Karny, M., and Roeckl, E.: Monte Carlo simulation of the response of a large NaI(Tl)total absorption spectrometer for β-decay studies, Nucl. Instrum. Meth. A, 430, 333–347, https://doi.org/10.1016/S0168-9002(99)00217-X, 1999. a, b, c, d
Casanovas, R., Morant, J. J., and Salvadó, M.: Energy and resolution calibration of NaI(Tl) and LaBr 3(Ce) scintillators and validation of an EGS5 Monte Carlo user code for efficiency calculations, Nucl. Instrum. Meth. A, 675, 78–83, https://doi.org/10.1016/j.nima.2012.02.006, 2012. a
Coleman, T. F. and Li, Y.: An Interior Trust Region Approach for Nonlinear Minimization Subject to Bounds, SIAM J. Otimiz., 6, 418–445, https://doi.org/10.1137/0806023, 1996. a, b
Connor, D., Martin, P. G., and Scott, T. B.: Airborne radiation mapping: overview and application of current and future aerial systems, Int. J. Remote Sens., 37, 5953–5987, https://doi.org/10.1080/01431161.2016.1252474, 2016. a, b
Dickson, B. H., Bailey, R. C., and Grasty, R. L.: Utilizing multi-channel airborne gamma-ray spectra, Can. J. Earth Sci., 18, 1793–1801, https://doi.org/10.1139/E81-167, 1981. a
Erdi-Krausz, G., Matolin, M., Minty, B., Nicolet, J.-P., Reford, W. S., and Schetselaar, E.: Guidelines for radioelement mapping using gamma ray spectrometry data, TECDOC No. 1363, Tech. rep., International Atomic Energy Agency, Vienna, ISBN: 92-0-108303-3, 2003. a, b, c
Forster, R. A., Booth, T. E., and Pederson, S. P.: Ten new checks to assess the statistical quality of Monte Carlo solutions in MCNP, in: 8. International Conference on Radiation Shielding, Los Alamos National Laboratory, Arlington, TX, United States, 24–27 Apr 1994, 10 p., 1994. a
Fortin, R., Hovgaard, J., and Bates, M.: Airborne gamma-ray spectrometry in 2017: solid ground for new development., in: Sixth Decennial International Conference on Mineral Exploration, Toronto, 22–25 October 2017, 129–138, 2017. a
Gardner, R. P. and Sood, A.: A Monte Carlo simulation approach for generating NaI detector response functions (DRFs) that accounts for non-linearity and variable flat continua, Nucl. Instrum. Meth. B, 213, 87–99, https://doi.org/10.1016/S0168-583X(03)01539-8, 2004. a, b, c
Grasty, R. L.: Uranium measurement by airborne gamma-ray spectrometry, Geophysics, 40, 503–519, https://doi.org/10.1190/1.1440542, 1975. a
Grasty, R. L., Glynn, J. E., and Grant, J. A.: The analysis of multichannel airborne gamma‐ray spectra, Geophysics, 50, 2611–2620, https://doi.org/10.1190/1.1441886, 1985. a
Hubert, M. and Vandervieren, E.: An adjusted boxplot for skewed distributions, Comput. Stat. Data An., 52, 5186–5201, https://doi.org/10.1016/J.CSDA.2007.11.008, 2008. a
Knoll, G. F.: Radiation Detection and Measurement, 4th edn., John Wiley and Sons, New York, NY, ISBN: 9780470131480, 2010. a, b, c, d, e, f, g, h
Kulisek, J. A., Wittman, R. S., Miller, E. A., Kernan, W. J., McCall, J. D., McConn, R. J., Schweppe, J. E., Seifert, C. E., Stave, S. C., and Stewart, T. N.: A 3D simulation look-up library for real-time airborne gamma-ray spectroscopy, Nucl. Instrum. Meth. A, 879, 84–91, https://doi.org/10.1016/j.nima.2017.10.030, 2018. a, b, c, d, e, f, g
Li, F., Cheng, Z., Tian, C., Xiao, H., Zhang, M., and Ge, L.: Progress in recent airborne gamma ray spectrometry measurement technology, Appl. Spectrosc. Rev., 56, 255–288, https://doi.org/10.1080/05704928.2020.1768107, 2020. a
Minty, B. R., McFadden, P., and Kennett, B. L.: Multichannel processing for airborne gamma-ray spectrometry, Geophysics, 63, 1971–1985, https://doi.org/10.1190/1.1444491, 1998. a
Moses, W. W., Bizarri, G. A., Williams, R. T., Payne, S. A., Vasil'Ev, A. N., Singh, J., Li, Q., Grim, J. Q., and Choong, W. S.: The origins of scintillator non-proportionality, IEEE T. Nucl. Sci., 59, 2038–2044, https://doi.org/10.1109/TNS.2012.2186463, 2012. a, b
Payne, S. A., Cherepy, N. J., Hull, G., Valentine, J. D., Moses, W. W., and Choong, W. S.: Nonproportionality of scintillator detectors: Theory and experiment, IEEE T. Nucl. Sci., 56, 2506–2512, https://doi.org/10.1109/TNS.2009.2023657, 2009. a, b
Pearce, A.: Recommended nuclear decay data, Tech. rep. (NPL Report IR 6), National Physical Laboratory, Teddington, ISSN number: 1754-2952, 2008. a, b
Pradeep Kumar, K. A., Shanmugha Sundaram, G. A., Sharma, B. K., Venkatesh, S., and Thiruvengadathan, R.: Advances in gamma radiation detection systems for emergency radiation monitoring, Nucl. Eng. Technol., 52, 2151–2161, https://doi.org/10.1016/j.net.2020.03.014, 2020. a
Prettyman, T. H., Hagerty, J. J., Elphic, R. C., Feldman, W. C., Lawrence, D. J., McKinney, G. W., and Vaniman, D. T.: Elemental composition of the lunar surface: Analysis of gamma ray spectroscopy data from Lunar Prospector, J. Geophys. Res.-Planet., 111, 41 p., https://doi.org/10.1029/2005JE002656, 2006. a
Regis, R. G. and Shoemaker, C. A.: A Stochastic Radial Basis Function Method for the Global Optimization of Expensive Functions, INFORMS J. Comput., 19, 497–509, https://doi.org/10.1287/IJOC.1060.0182, 2007. a
Saito, K. and Moriuchi, S.: Monte Carlo calculation of accurate response functions for a NaI(Tl) detector for gamma rays, Nucl. Instrum. Methods, 185, 299–308, https://doi.org/10.1016/0029-554X(81)91225-8, 1981. a, b, c
Salgado, C. M., Brandão, L. E., Schirru, R., Pereira, C. M., and Conti, C. C.: Validation of a NaI(Tl) detector's model developed with MCNP-X code, Prog. Nucl. Energ., 59, 19–25, https://doi.org/10.1016/j.pnucene.2012.03.006, 2012. a
Shi, H. X., Chen, B. X., Li, T. Z., and Yun, D.: Precise Monte Carlo simulation of gamma-ray response functions for an NaI(Tl) detector, Appl. Radiat. Isotopes, 57, 517–524, https://doi.org/10.1016/S0969-8043(02)00140-9, 2002. a, b, c, d
Sinclair, L. E., Fortin, R., Buckle, J. L., Coyle, M. J., Van Brabant, R. A., Harvey, B. J., Seywerd, H. C., and McCurdy, M. W.: Aerial Mobile Radiation Survey Following Detonation of a Radiological Dispersal Device, Health Phys., 110, 458–470, https://doi.org/10.1097/HP.0000000000000491, 2016. a, b, c, d, e
Tarpey, T.: A Note on the Prediction Sum of Squares Statistic for Restricted Least Squares, Am. Stat., 54, 116–118, https://doi.org/10.1080/00031305.2000.10474522, 2000. a
Torii, T., Sugita, T., Okada, C. E., Reed, M. S., and Blumenthal, D. J.: Enhanced Analysis Methods to Derive the Spatial Distribution of 131I Deposition on the Ground by Airborne Surveys at an Early Stage after the Fukushima Daiichi Nuclear Power Plant Accident, Health Phys., 105, 192–200, https://doi.org/10.1097/HP.0b013e318294444e, 2013. a, b, c, d, e, f, g, h
Van der Graaf, E. R., Limburg, J., Koomans, R. L., and Tijs, M.: Monte Carlo based calibration of scintillation detectors for laboratory and in situ gamma ray measurements, J. Environ. Radioactiv., 102, 270–282, https://doi.org/10.1016/j.jenvrad.2010.12.001, 2011. a, b
Verboven, S. and Hubert, M.: LIBRA: A MATLAB library for robust analysis, Chemometr. Intell. Lab., 75, 127–136, https://doi.org/10.1016/j.chemolab.2004.06.003, 2005. a, b, c
Vlachoudis, V.: Flair: A powerful but user friendly graphical interface for FLUKA, in: International Conference on Mathematics, Computational Methods and Reactor Physics (M&C 2009), American Nuclear Society, Saratoga Springs, New York, 3–7 May 2009, 11 p., ISBN: 978-0-89448-069-0, 2009. a, b
Westmeier, W.: Techniques and problems of low-level gamma-ray spectrometry, Int. J. Radiat. Appl. Instrum. Part A. Appl. Radiat. Isot., 43, 305–322, https://doi.org/10.1016/0883-2889(92)90102-K, 1992. a
Zerby, C. D., Meyer, A., and Murray, R. B.: Intrinsic line broadening in NaI(Tl) gamma-ray spectrometers, Nucl. Instrum. Methods, 12, 115–123, https://doi.org/10.1016/0029-554X(61)90119-7, 1961. a
Zhang, Q., Guo, Y., Xu, S., Xiong, S., Ge, L., Wu, H., Gu, Y., Zeng, G., and Lai, W.: A hybrid method on sourceless sensitivity calculation for airborne gamma-ray spectrometer, Appl. Radiat. Isotopes, 137, 68–72, https://doi.org/10.1016/j.apradiso.2018.03.009, 2018. a, b, c, d
- Abstract
- Introduction
- Methods
- Results and discussion
- Conclusions
- Appendix A: Uncertainty analysis
- Appendix B: Lower level discriminator model
- Appendix C: Nomenclature
- Code availability
- Data availability
- Author contributions
- Competing interests
- Disclaimer
- Special issue statement
- Acknowledgements
- Financial support
- Review statement
- References