 | 05 Sep 2019
Permeability of matrix-fracture systems under mechanical loading – constraints from laboratory experiments and 3-D numerical modelling
Guido Blöcher
Christian Kluge
Harald Milsch
Mauro Cacace
Antoine B. Jacquey
Jean Schmittbuhl
The permeability of single fractures is commonly approximated by the cubic law assumption, which is however only valid under the condition of a single phase laminar flow between parallel plates. Departure from cubic law are related to many features like aperture fluctuations due to fracture surface roughness, relative shear displacement, the amount of flow exchange between the matrix and the fracture itself, etc. In order to quantify constitutive relationships among the aforementioned aspects, we have conducted a flow-through experiment with a porous rock sample (Flechtinger sandstone) containing a single macroscopic fracture. Based on this experiment, we obtained range of variations of intrinsic rock parameters, permeability and stress-strain relationships of the combined matrix-fracture system under hydrostatic loading. From the measured deformation of the matrix-fracture system, we derived the evolution in the mechanical aperture of the fracture. In order to quantify the processes behind the laboratory observations, we carried out coupled hydro-mechanical simulations of the matrix-fracture system. Navier–Stokes flow was solved in the 3-dimensional open rough fracture domain, and back-coupled to the Darcy flow and the poroelastic behaviour of the rock matrix. The results demonstrate that the elastic behaviour and the related permeability alteration of the fracture domain could be captured by the numerical simulation. Furthermore, the stress-strain values obtained in the vicinity of the fracture asperities suggest that inelastic deformation develops at low mechanical load. An attempt was made to quantify the inelastic deformation by using the failure envelope obtained by laboratory experiments (whether tensile, shear, compaction, or a combination of those). However, change in permeability observed in the experiments are significantly larger than that in the simulation showing the importance of plastic deformation during opening and closure of the fracture and its impact on the cubic law approximation.
- Article
(10079 KB) - Full-text XML
- BibTeX
- EndNote


Flow along fractures or in fractured systems becomes increasingly important in the context of faulted or Enhanced Geothermal Systems (EGS), shale gas recovery, as well as the stability of underground constructions, such as tunnels or nuclear waste repositories. Fault zones and natural fracture networks are increasingly considered as main reservoir targets, as for example the geothermal exploitation in the Southern German Molasse Basin (Cacace et al., 2013) or at the Rittershoffen site, France (Baujard et al., 2017). Assessing fracture permeability and the subsequent hydraulic-mechanical performance and the sustainability of the embeding fractured reservoir are therefore important topics (Ingebritsen and Sanford, 1999). At the fracture scale, the permeability of fractures is often approximated by using the Hagen–Poiseuille solution of the Navier–Stokes equation (Guyon et al., 2001). For this, the flow behaviour in fractures is assumed to be a laminar flow between two parallel plates separated by the distance a, such that the fracture permeability kfrac can be derived from the cubic law approximation (Witherspoon et al., 1980; Gudmundsson, 2011). Actually, the permeability of fractures is dependent on many aspects: shear displacement, normal load, fracture stiffness, mean fracture aperture, as well as surface roughness and these parameters depend on the mechanical load and, therefore, on the deformation of the matrix-fracture system (Jaeger et al., 2009; Cornet, 2015).
It has been nowadays recognised that the sustainability of the hydro-mechanical performance of fractures is crucial for engineering applications. Field observations indicate that pore pressure changes due to production and injection or fracture relaxation when the well is not operated, will alter the hydro-mechanical behaviour and therefore the fracture permeability (Blöcher et al., 2016). Experimental studies on displaced tensile fractures in granites (e.g. Hofmann et al., 2016) indicate a progressive reduction of the combined matrix-fracture permeability due to changes in the effective stress acting on the fracture plane.
A quantification of the stress and pressure distributions along the fracture surfaces and their alteration due to induced flow and mechanical loading is still missing in the present literature. Furthermore, the processes responsible for permeability changes such as microscopic tensile or shear failure, compaction or fracture mineralisation, as well as their interactions are still poorly understood. To address these issues, numerical simulation of the composite matrix-fracture system under mechanical loading has become increasingly important. Generally, such simulations mostly consider flow within the fracture only (Méheust and Schmittbuhl, 2001, 2003; Neuville et al., 2010, 2011; Kluge et al., 2017b; Wanniarachchi et al., 2018) or use simplifications to represent the hydraulic-mechanical behaviour of the full matrix-fracture system (Pyrak-Nolte and Morris, 2000).
In this study we aim at improving the current understanding on these topics by presenting in a first stage results of flow through experiments under varying effective pressure conditions of a porous rock samples (Flechtinger sandstone) containing a single macroscopic fracture. In a second stage, we make use of these experimental results to carry out a numerical investigation of the hydro-mechanical behaviour of the matrix-fracture system to analyse stress and fluid pressure distribution and potential failure mechanism.
Experiments have been carried out in a MTS tri-axial cell (Pei et al., 2017) using low permeability ( m2) Flechtingen sandstone samples previously fractured in tensile mode (Kluge et al., 2017a). The aim of the experiment is to determine the fracture closure behaviour of a shear-displaced fracture under different effective pressure conditions, varying both confining and pore pressure (Fig. 1). To obtain an open tensile (mode I) fracture, a cylindrical sample of Flechtingen sandstone with the dimensions of 100×50 mm was placed into a Brazilian Disk (BD) set up. The sample was loaded diametrically using an arc-shaped loading stamp thus leading to the creation of a single tensile fracture. Afterwards, a displacement of 0.5 mm was imposed along the fracture plane, along the flow direction before the sample was jacketed in a heat-shrink and placed into the tri-axial cell. Axial and lateral extensometers (LVDTs) record the matrix-fracture deformation. Since the fracture is oriented in axial direction of the sample (vertically in the experimental setup), it was assumed that the axial extensometers were not sensitive to the fracture dilatancy, i.e. displacement normal to the mean fracture plane in the z-direction, but to the matrix deformation only. In contrast, the lateral extensometer which monitored the change in diameter of the sample, measured the deformation of the matrix plus the deformation of the embedded fracture. By subtracting the axial strain from the lateral strain, deformation in terms of fracture closure strain was obtained (Fig. 2). A Quizix pump system with four pumps allows continuous flow through the matrix-fracture and therefore a continuous permeability measurement.
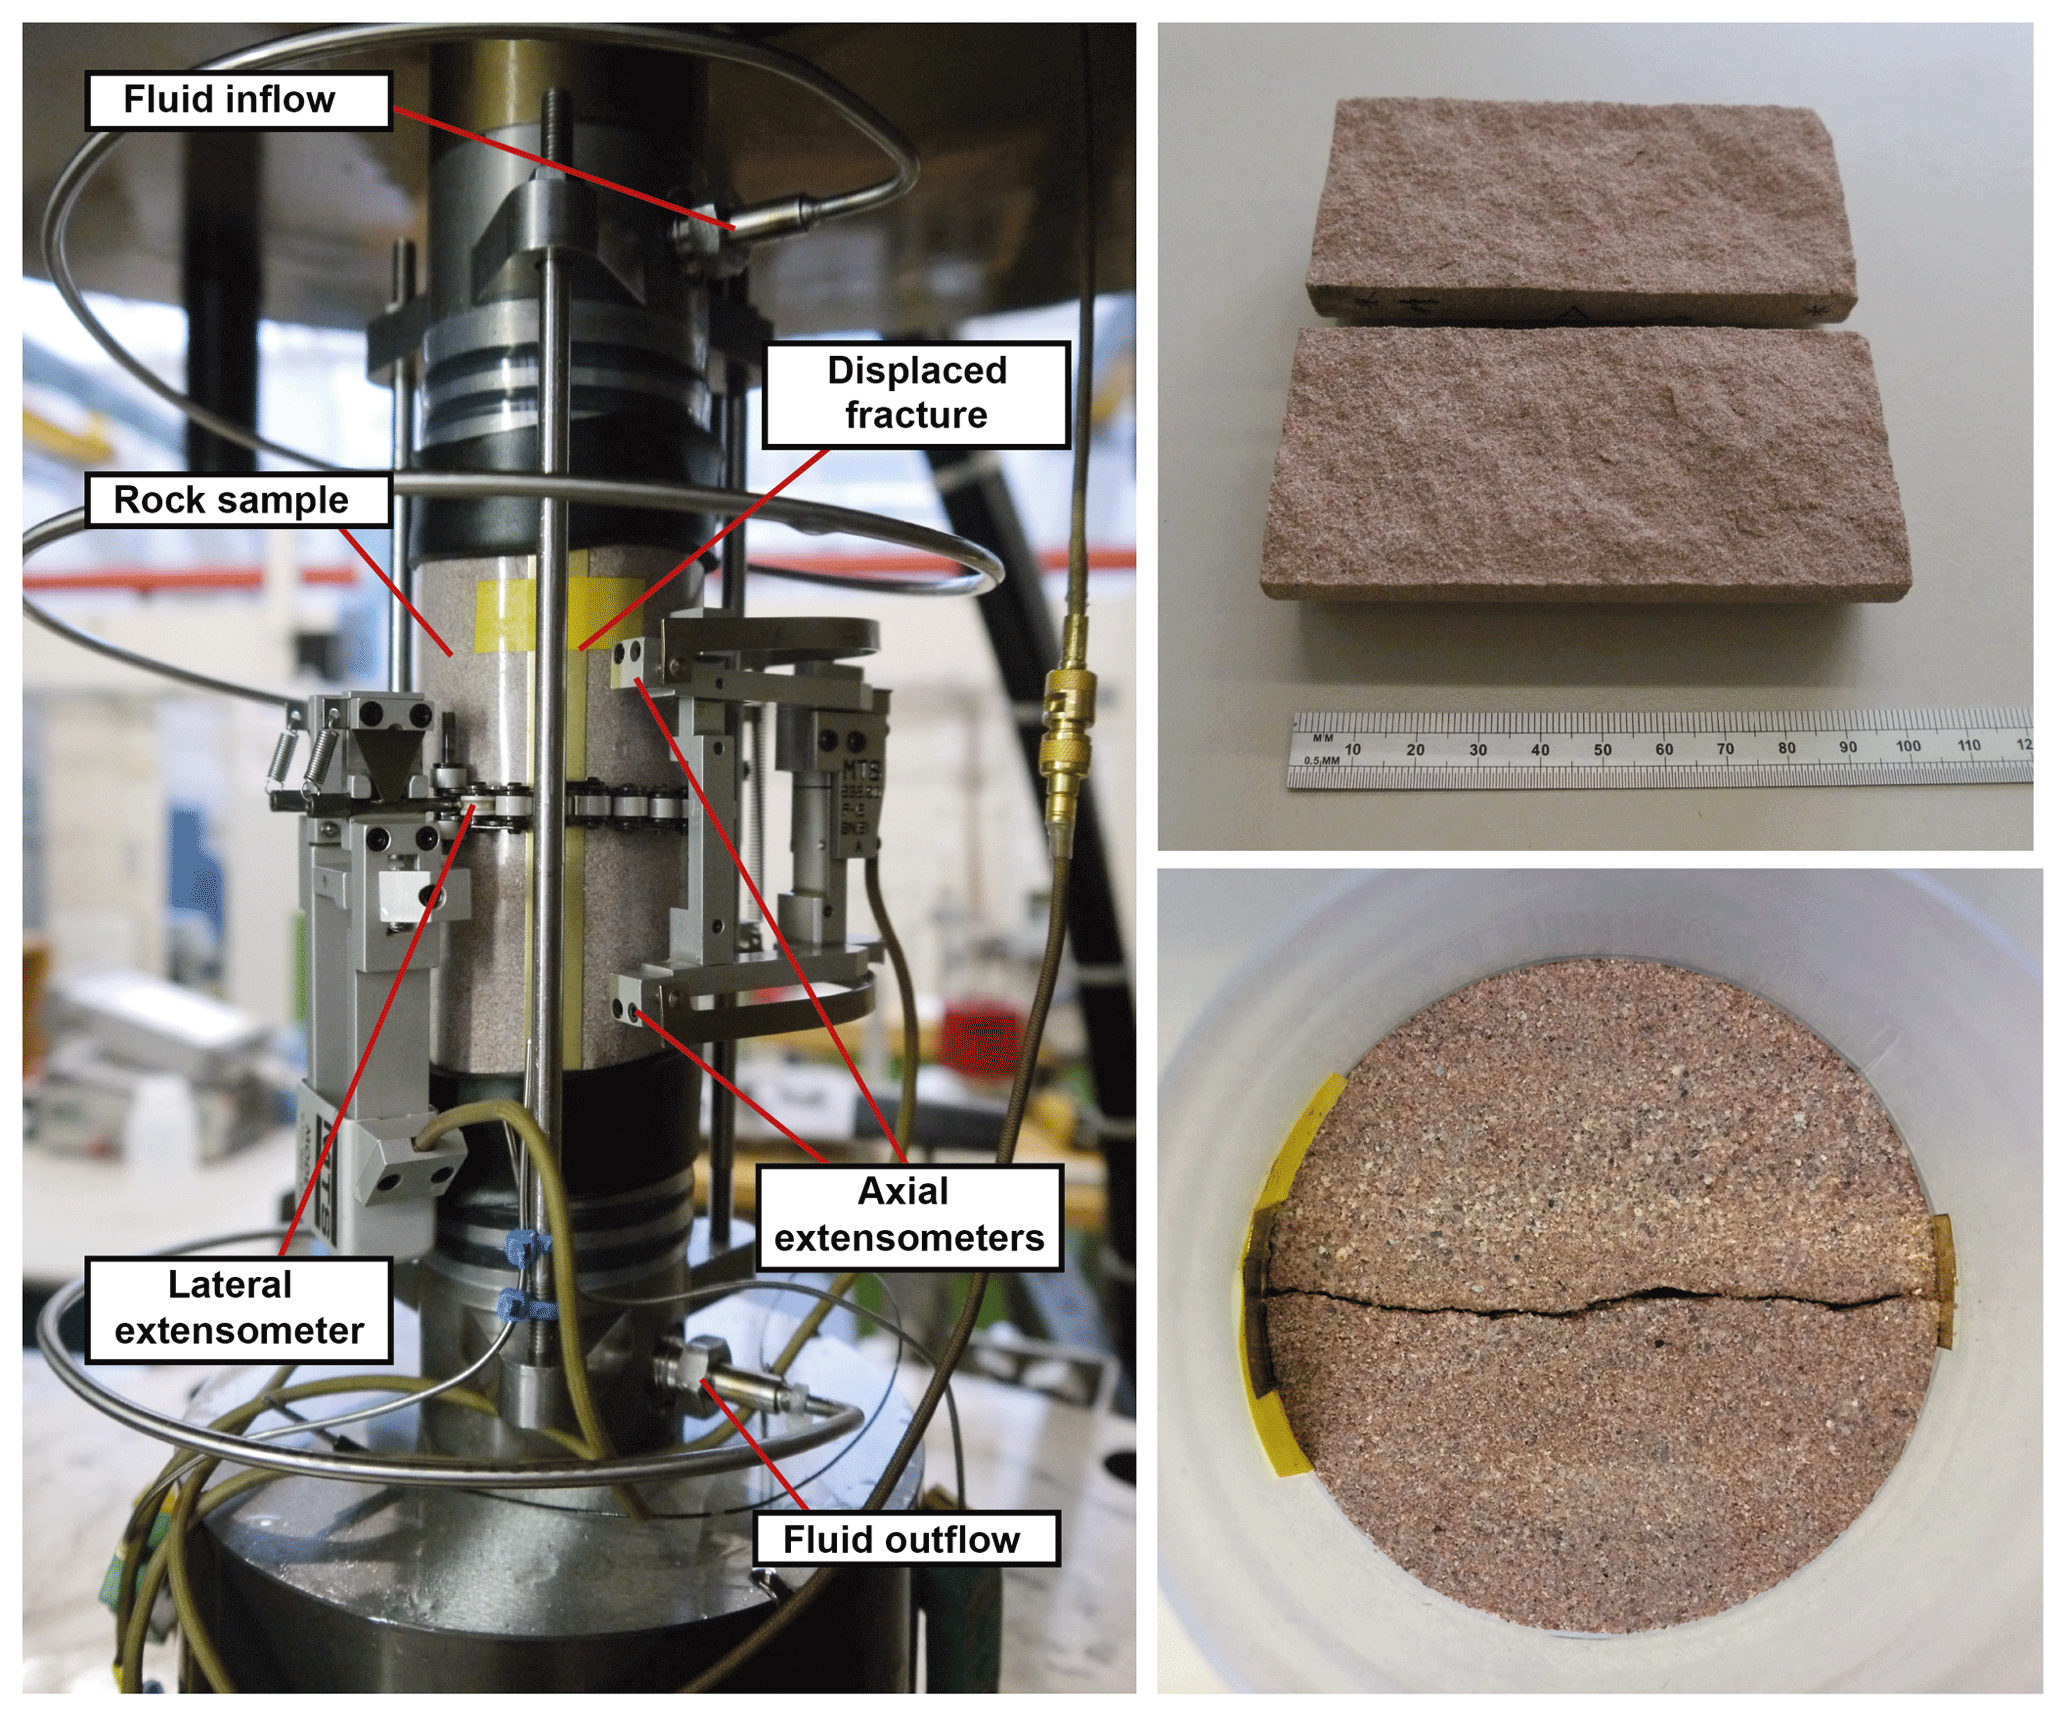
Figure 1Experimental setup and Flechtinger sandstone samples (SBT6-BE) containing a shear-displaced tensile fracture.
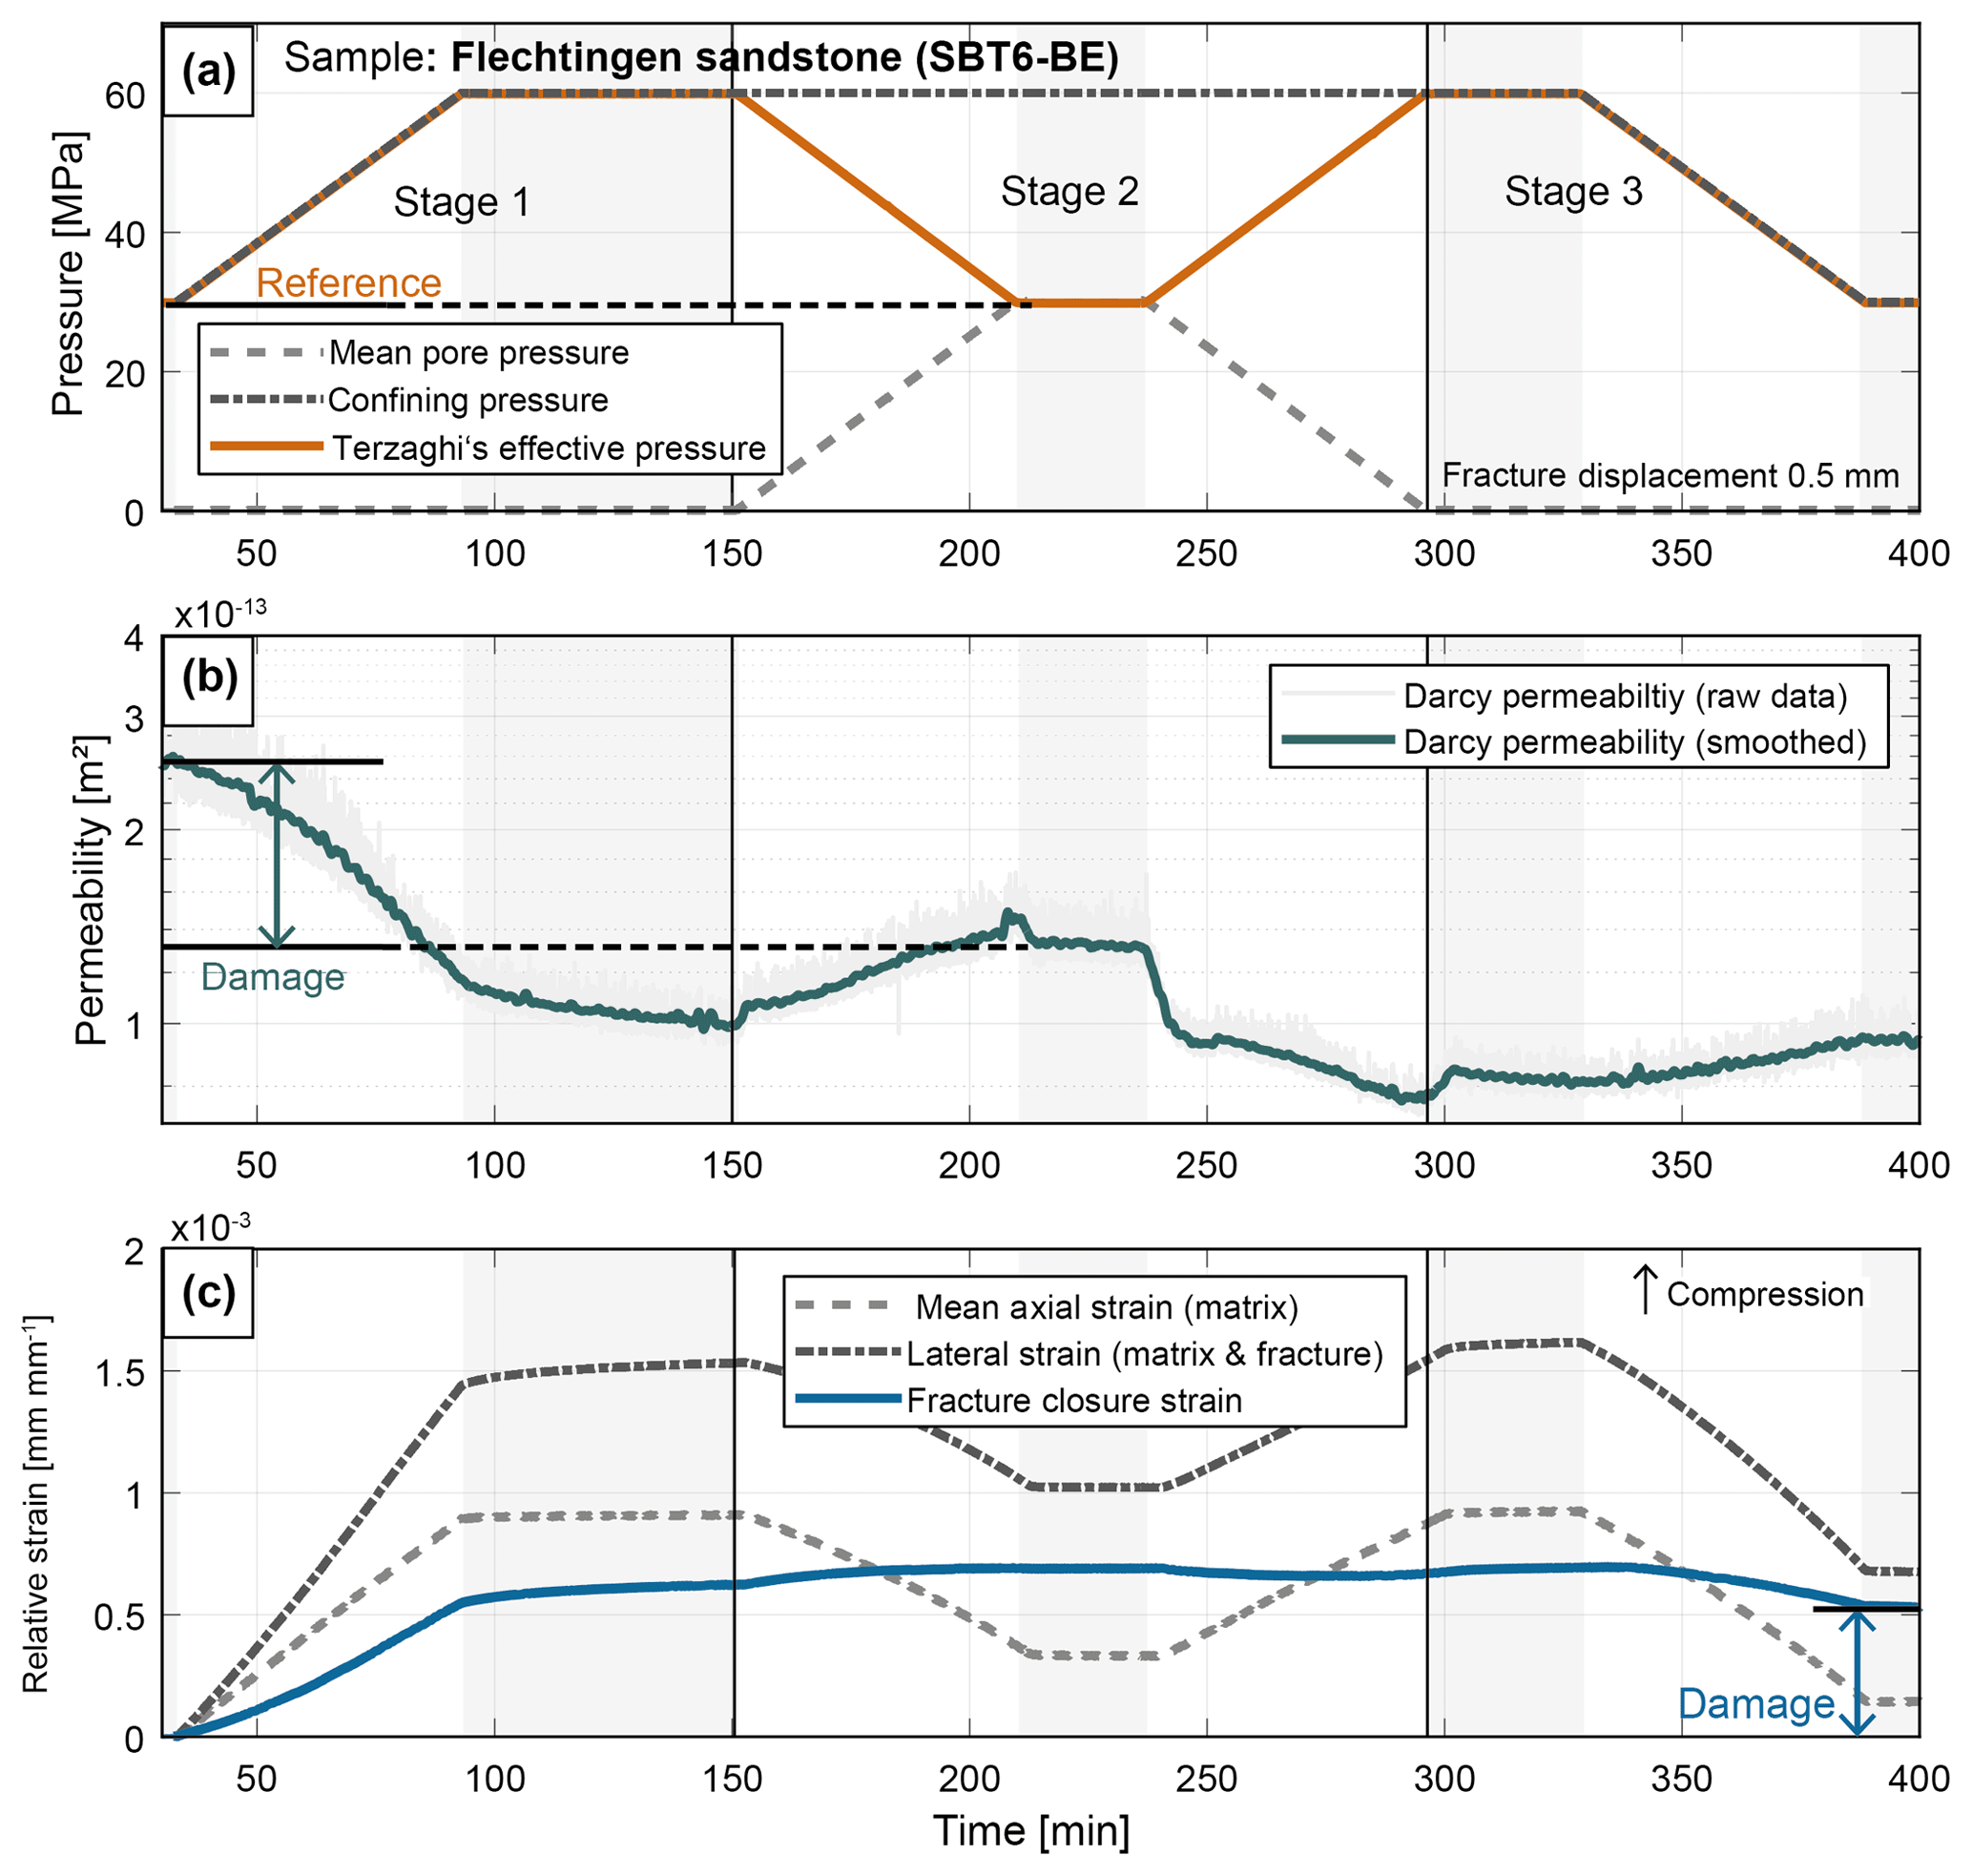
Figure 2(a) Experimental procedure and effective stress changes, (b) sample permeability evolution, (c) fracture closure strain evolution.
The results indicate a permanent damage expressed in terms of an overall reduction of the rock permeability and fracture closure (aperture) when increasing confining pressure (Fig. 2, stage 1). Increasing the pore pressure to the same effective pressure (stage 2) does not allow to recover the permeability and aperture. During the first loading, Terzaghi's effective stress (confining pressure minus pore pressure) increases from 30 to 60 MPa. This increase in effective pressure results in a decrease in permeability from to m2 which is a 62 % decrease and an increase in fracture closure strain from 0 to mm mm−1. Both processes include an elastic and an inelastic component. This becomes obvious during the first unloading stage (from 60 to 30 MPa) in effective pressure where the permeability partially recovers from to m2 and the relative strain slightly increases. Similar observations were made for the second unloading stage where the permeability recovers from to m2 and the strain slightly reduces. The elastic deformation leading to permeability alteration was calculated to be 13 % to 19 % of the total deformation leading to a permeability recovery of 19 % to 30 %.
3.1 Mesh Generation
To represent the geometrical features of the matrix-fracture system, a fracture surface scan (Fig. 3a) of the same sample as used in the experiments was performed before the experiment. A scan resolution of 0.2475 mm × 0.2478 mm was obtained by using a DLP® white light scanner (fringe projection, optical, non-contact, monochromatic (LED), resolution: 2048 × 2048 pixel, measuring accuracy: 30–50 µm). Using this scan as an input structure, a software tool for artificial shear displacement was used for generating an input structure for the Finite Element Mesh (FE-Mesh) generator Gmsh (Geuzaine and Remacle, 2009). By means of the software tool, the shear offset along the y-axis, the aperture, and the minimum aperture for fluid flow can be controlled. In order to mimic the laboratory experiment in terms of shear displacement and fracture contact area, the following values were chosen: shear offset =0.5 mm; offset normal to the fracture plane =0.291 mm and minimum local aperture for fluid flow =0.16 mm. The aperture was discretized by five tetrahedral element layers leading to a minimum edge length of 0.032 mm. These parameters for the mesh generation led to a mean fracture aperture of 0.267 mm and a contact area of 20.1 %. Subsequently, a separate mesh for the fracture and matrix volume was generated (Fig. 3). The total number of tetrahedral elements are 2 256 352 and 2 144 533 elements for the open rough fracture domain and rock matrix domain, respectively. The dimensions of the combined matrix-fracture system in x, y, and z-direction are 23.5, 11.6, and 5.8 mm, respectively. There the fracture plane is oriented in x-y-direction and its normal is pointing to the z-direction (Fig. 3).
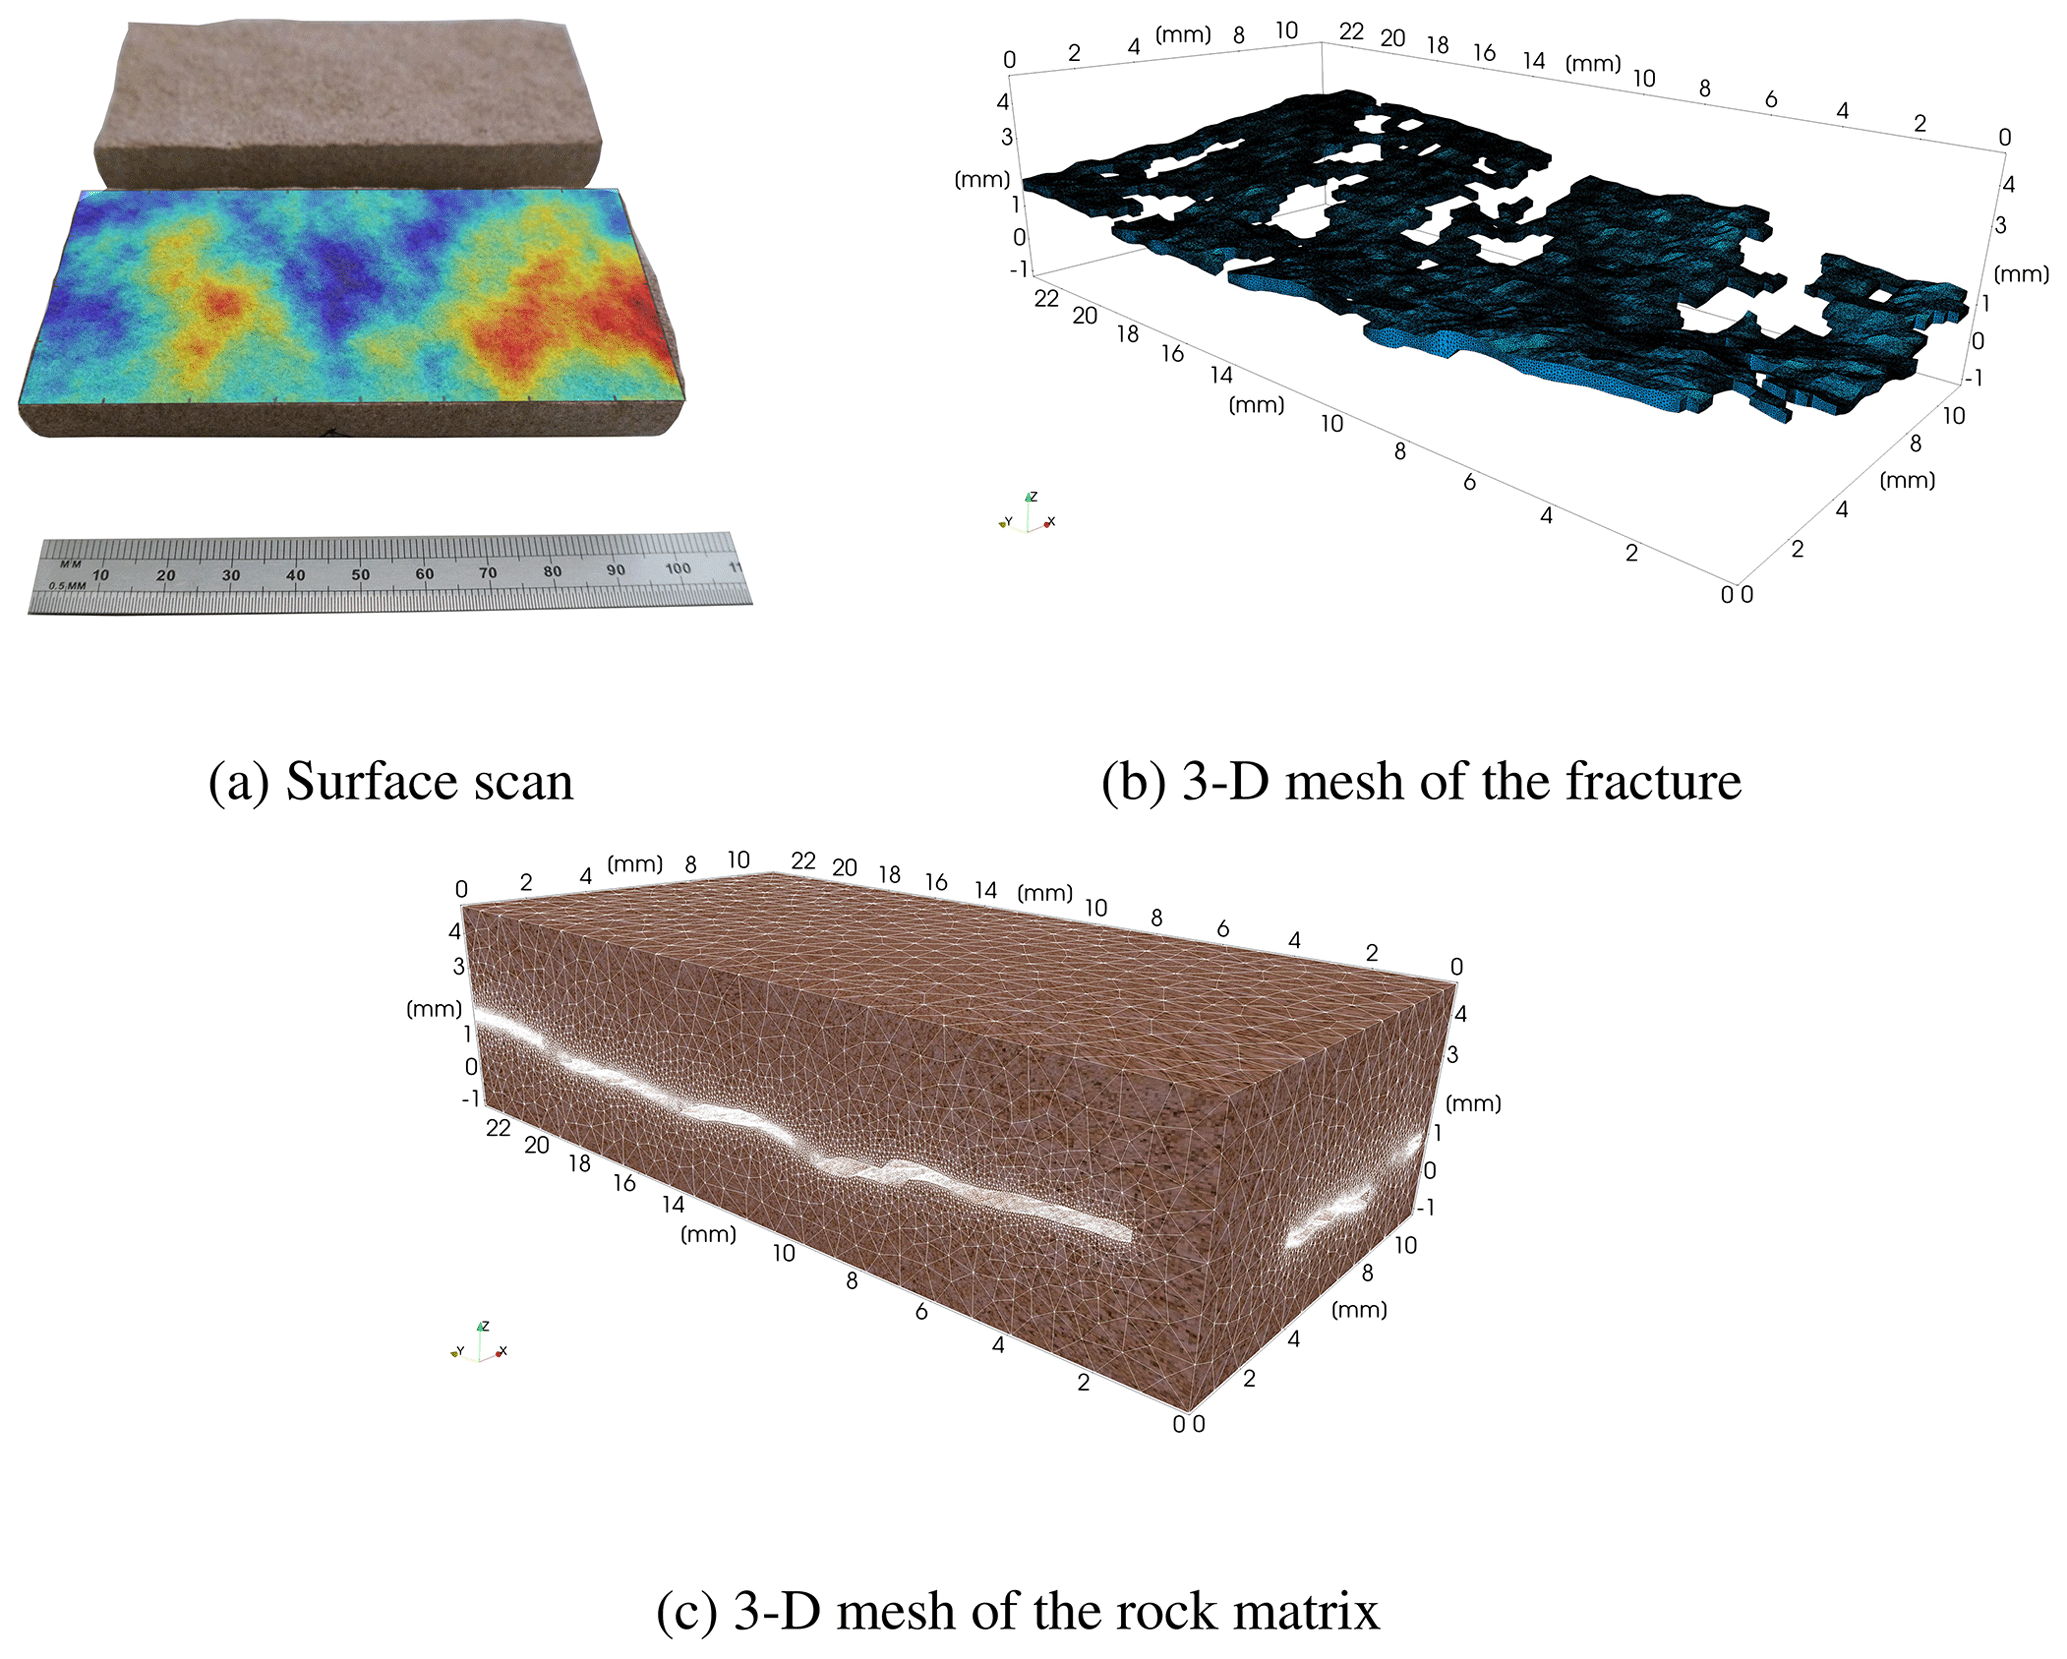
Figure 3FE-Mesh of the fracture (b) and the surrounding rock matrix (c) with a mean fracture aperture of 0.267 mm and a contact area of 20.1 %. The FE-mesh is based on the surface scan (a).
3.2 Numerical Method
To analyse the stress, pressure and velocity field in a matrix-fracture system, an adequate physical model of the involved processes and their coupling is required. The Multiphysics Object Oriented Simulation Environment (MOOSE) in combination with GOLEM (Cacace and Jacquey, 2017), a MOOSE-based application for modelling coupled Thermal-Hydraulic-Mechanical (THM) processes in fractured and faulted geothermal reservoirs were used. To represent the rock matrix, we considered a poroelastic behaviour as implemented in Cacace and Jacquey (2017). For the fluid phase, the incompressible Navier–Stokes flow is implemented (Peterson et al., 2018). The Navier–Stokes module solves for the dynamic pressure and the velocity field inside the fracture opening only. For the rock matrix, the primary variables solved for are pore pressure and displacement. The fluid velocity in the porous matrix as well as the strain and stress field are derived from these primary quantities. To derive a coupling between the two physical systems, i.e. the open fracture domain and the matrix domain, three exchange functions along the interfaces (Fig. 4) between the rock-matrix and the fracture were defined. Since the fluid pressure inside the fracture is solved almost instantaneously when compared to the time scale of pore pressure diffusion in the matrix, we used this pressure as boundary condition for the pore pressure in the rock matrix system (see (1) in Fig. 4). Based on this pore pressure we calculated the fluid velocity in the matrix domain following Darcy's law. This fluid velocity was assigned as a slipping boundary for the fracture flow inside the fracture (see (2) in Fig. 4). To impose the mechanical coupling and the corresponding deformation of the fracture, the displacement values obtained in the rock matrix were assigned as boundary for the fracture surface (see (3) in Fig. 4). Since the incompressible Navier–Stokes flow does not consider the solid displacement as a primary variable, we used the displacement vector field to geometrically alter the fracture input mesh at each time step resulting in a displaced mesh configuration that will update the final solution for the dynamic pressure and fluid velocity field.
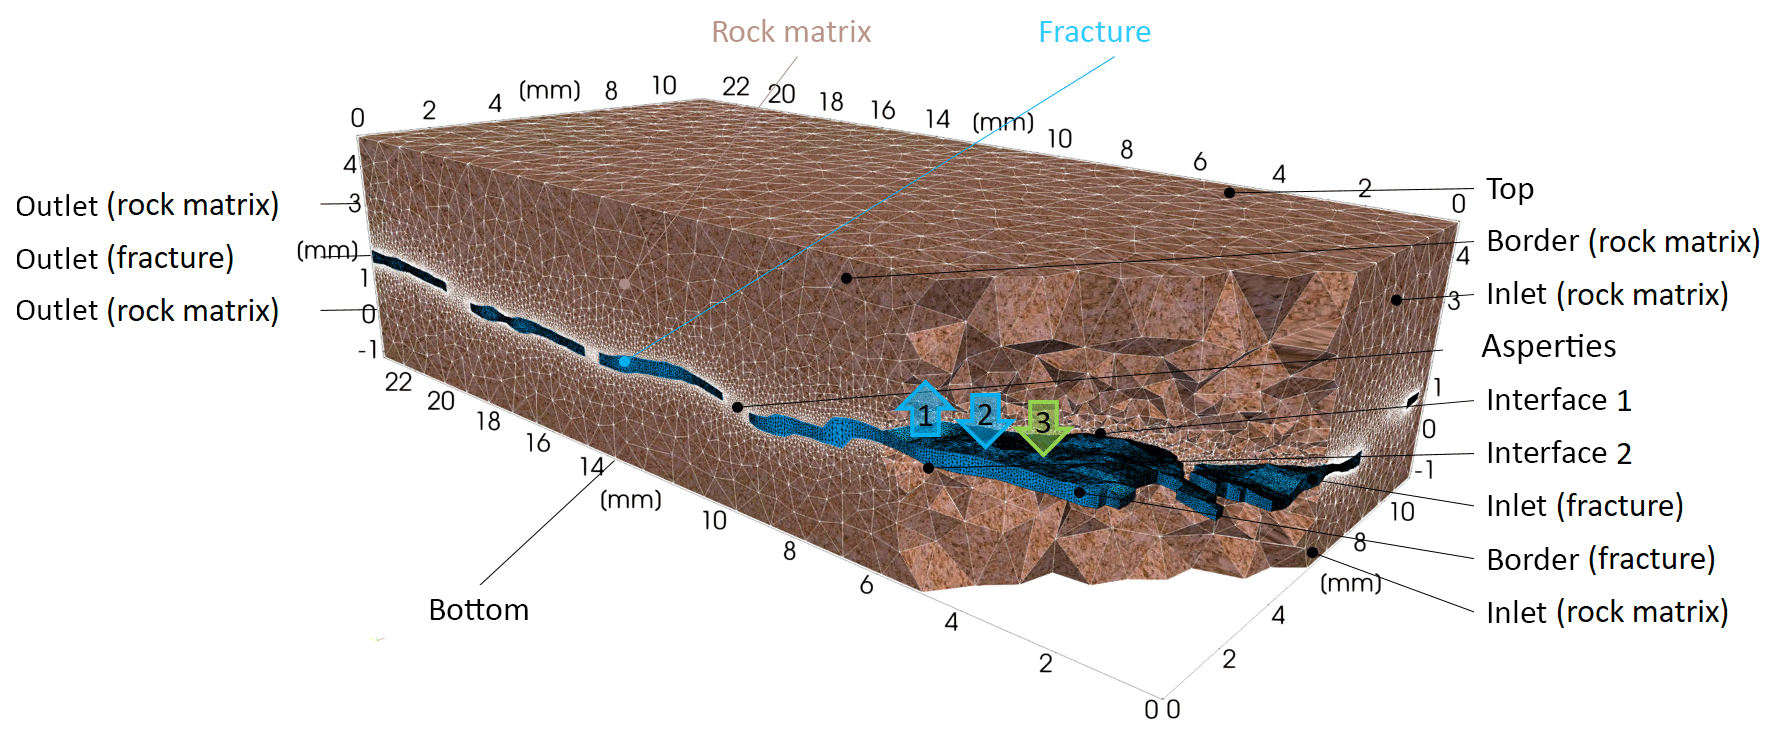
Figure 4Definition of 3-D domains, all physical surfaces, and interfaces between the fracture and the surrounding rock matrix.
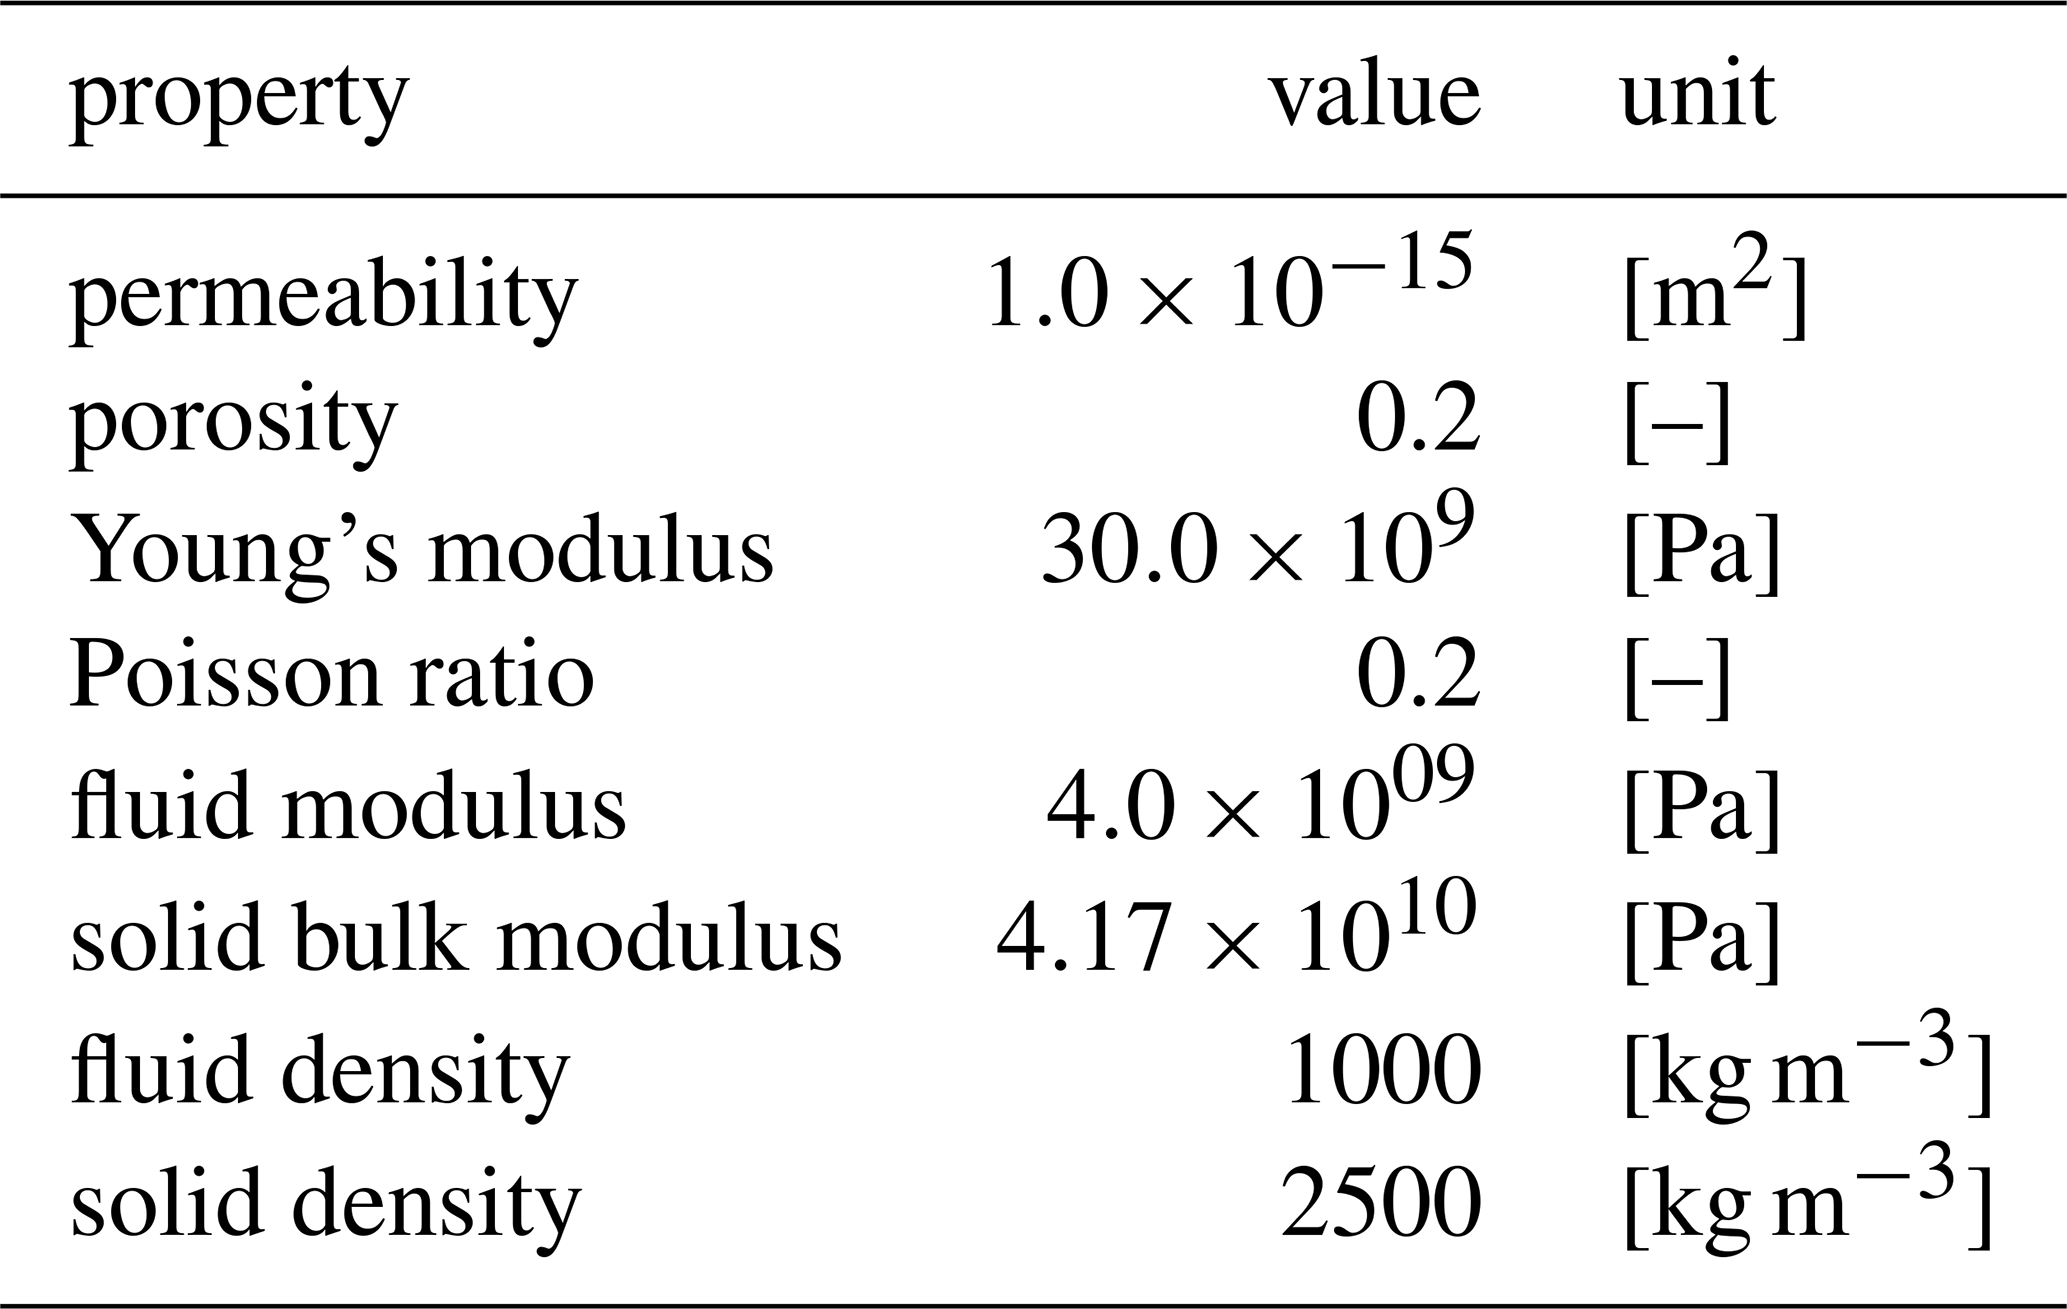
In order to derive a solution for the matrix-fracture system, the following initial and boundary conditions were chosen. The initial condition for the rock matrix is: pore pressure and displacement field equal to zero. Furthermore, the fluid pressure and the velocity inside the fracture are set to zero. In addition to the boundary conditions applied at the interface, we imposed an inflow of 0.16 m s−1 (velocity magnitude) along the whole fracture inlet area. At the outlet of the fracture, we kept the pressure constant at zero during the total transient simulation. At all other borders of the fracture we imposed a no flow boundary by setting the velocity vector to zero. For the rock matrix we constrained the outlet pressure to be zero. All other boundaries (borders, inlet, top and bottom) are assigned as no flow boundaries. For the mechanical part we set a zero displacement in z-direction for the bottom and no displacement in x-y-direction for the lateral borders as well as for the inlet and outlet. At the top of the rock matrix system (i.e. along the z-direction), we applied a compressive stress gradually increasing from 0 to 17 MPa. For higher compressive stresses, the two surfaces of the fracture start to interpenetrate each other due to elastic deformation. Such an interpenetration leads to numerical instabilities and untrustworthy results. The fluid inside the fracture has a density of 1000 kg m−3 and a dynamic fluid viscosity of Pa s. The material properties of the rock matrix are listed in Table 1.
Table 1Material properties of the rock matrix used for the numerical simulation.
3.3 Numerical results
Due to solving Navier–Stokes equation for incompressible fluids, an almost instantaneous steady state pressure field in the fracture was achieved which diffused into the rock matrix. The time required for pore pressure diffusion to the matrix and for establishing a steady state pressure field is about 0.1 s simulation time (Fig. 5). The inlet velocity 0.16 m s−1 led to a maximum velocity in the vicinity of the asperities of approximately 1.4 m s−1 (Fig. 6).
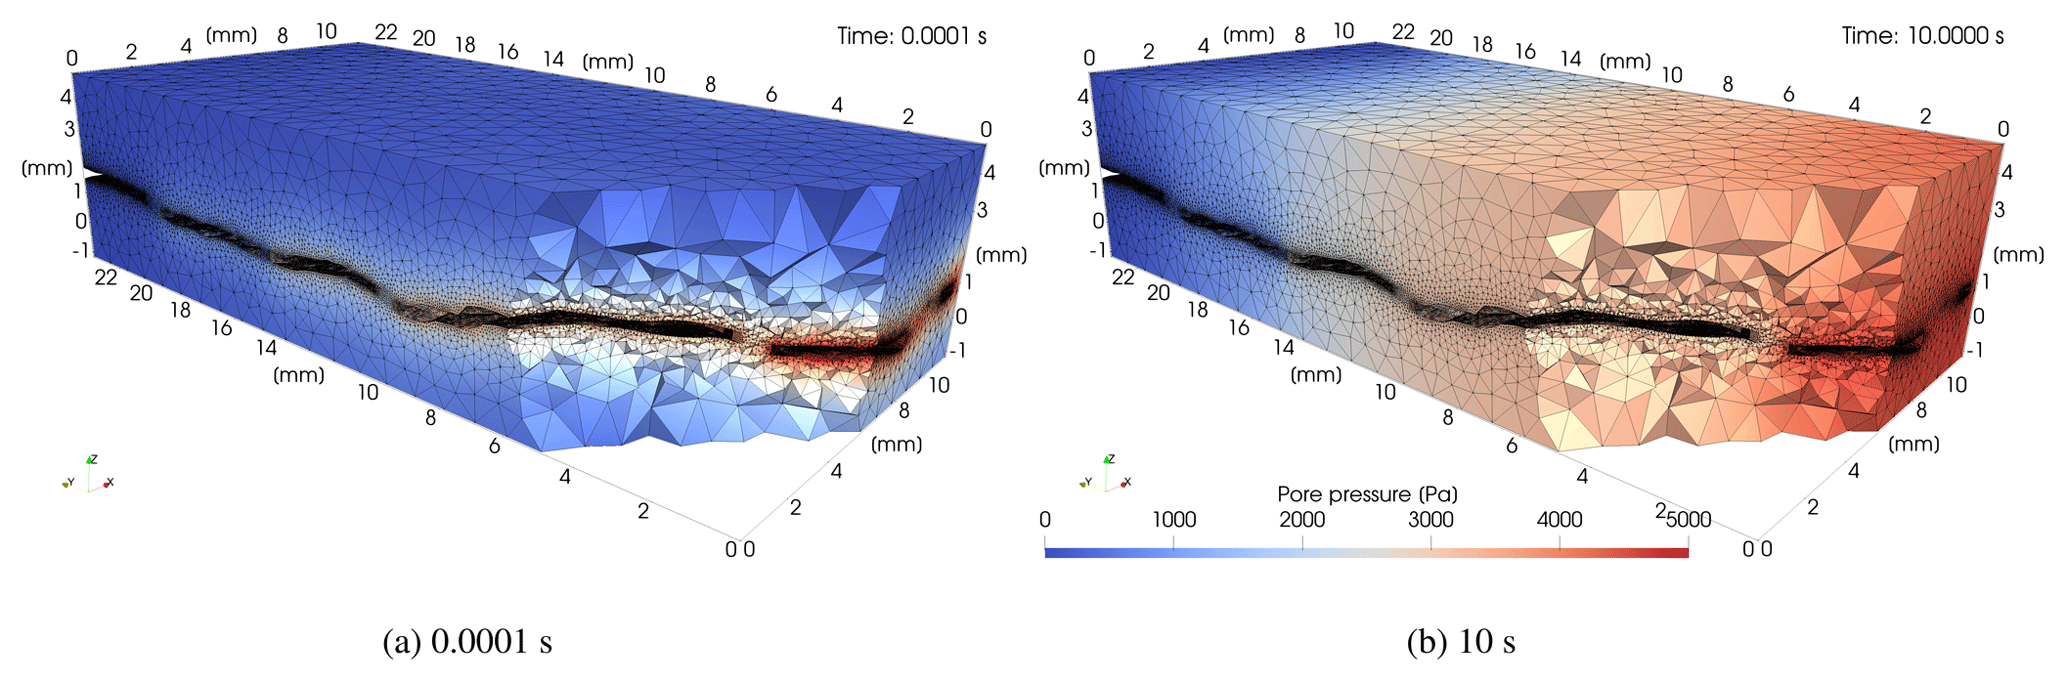
Figure 5Pressure field in the matrix-fracture system after 0.0001 (a) and 10 s (b) of inflow, respectively.

Figure 6Velocity field in the matrix-fracture system after 0.0001 (a) and 10 s (b) of inflow, respectively.
After 10 s of fluid flow, a load ramp in negative z-direction at the top of the matrix-fracture system was imposed with a maximum stress of 17 MPa. The observed stresses indicated both, tensile (positive) and compressive (negative) regime (Fig. 7a). The maximum applied stress of approximately 17 MPa led to a maximum stress concentration of approximately 150 MPa in the vicinity of the asperities. Furthermore, the observed strains indicated compression in z-direction (negative) and dilation in x-y-direction (positive) in the vicinity of the asperities with maximum compressive strain in z-direction of 0.02 mm mm−1 (Fig. 7b). For the rest of the domain of the rock matrix, the compressive strain in z-direction was observed to be below mm mm−1. Maximum displacement was observed above open fracture areas (17 µm) at 17 MPa normal stress at the top surface (Fig. 7c).
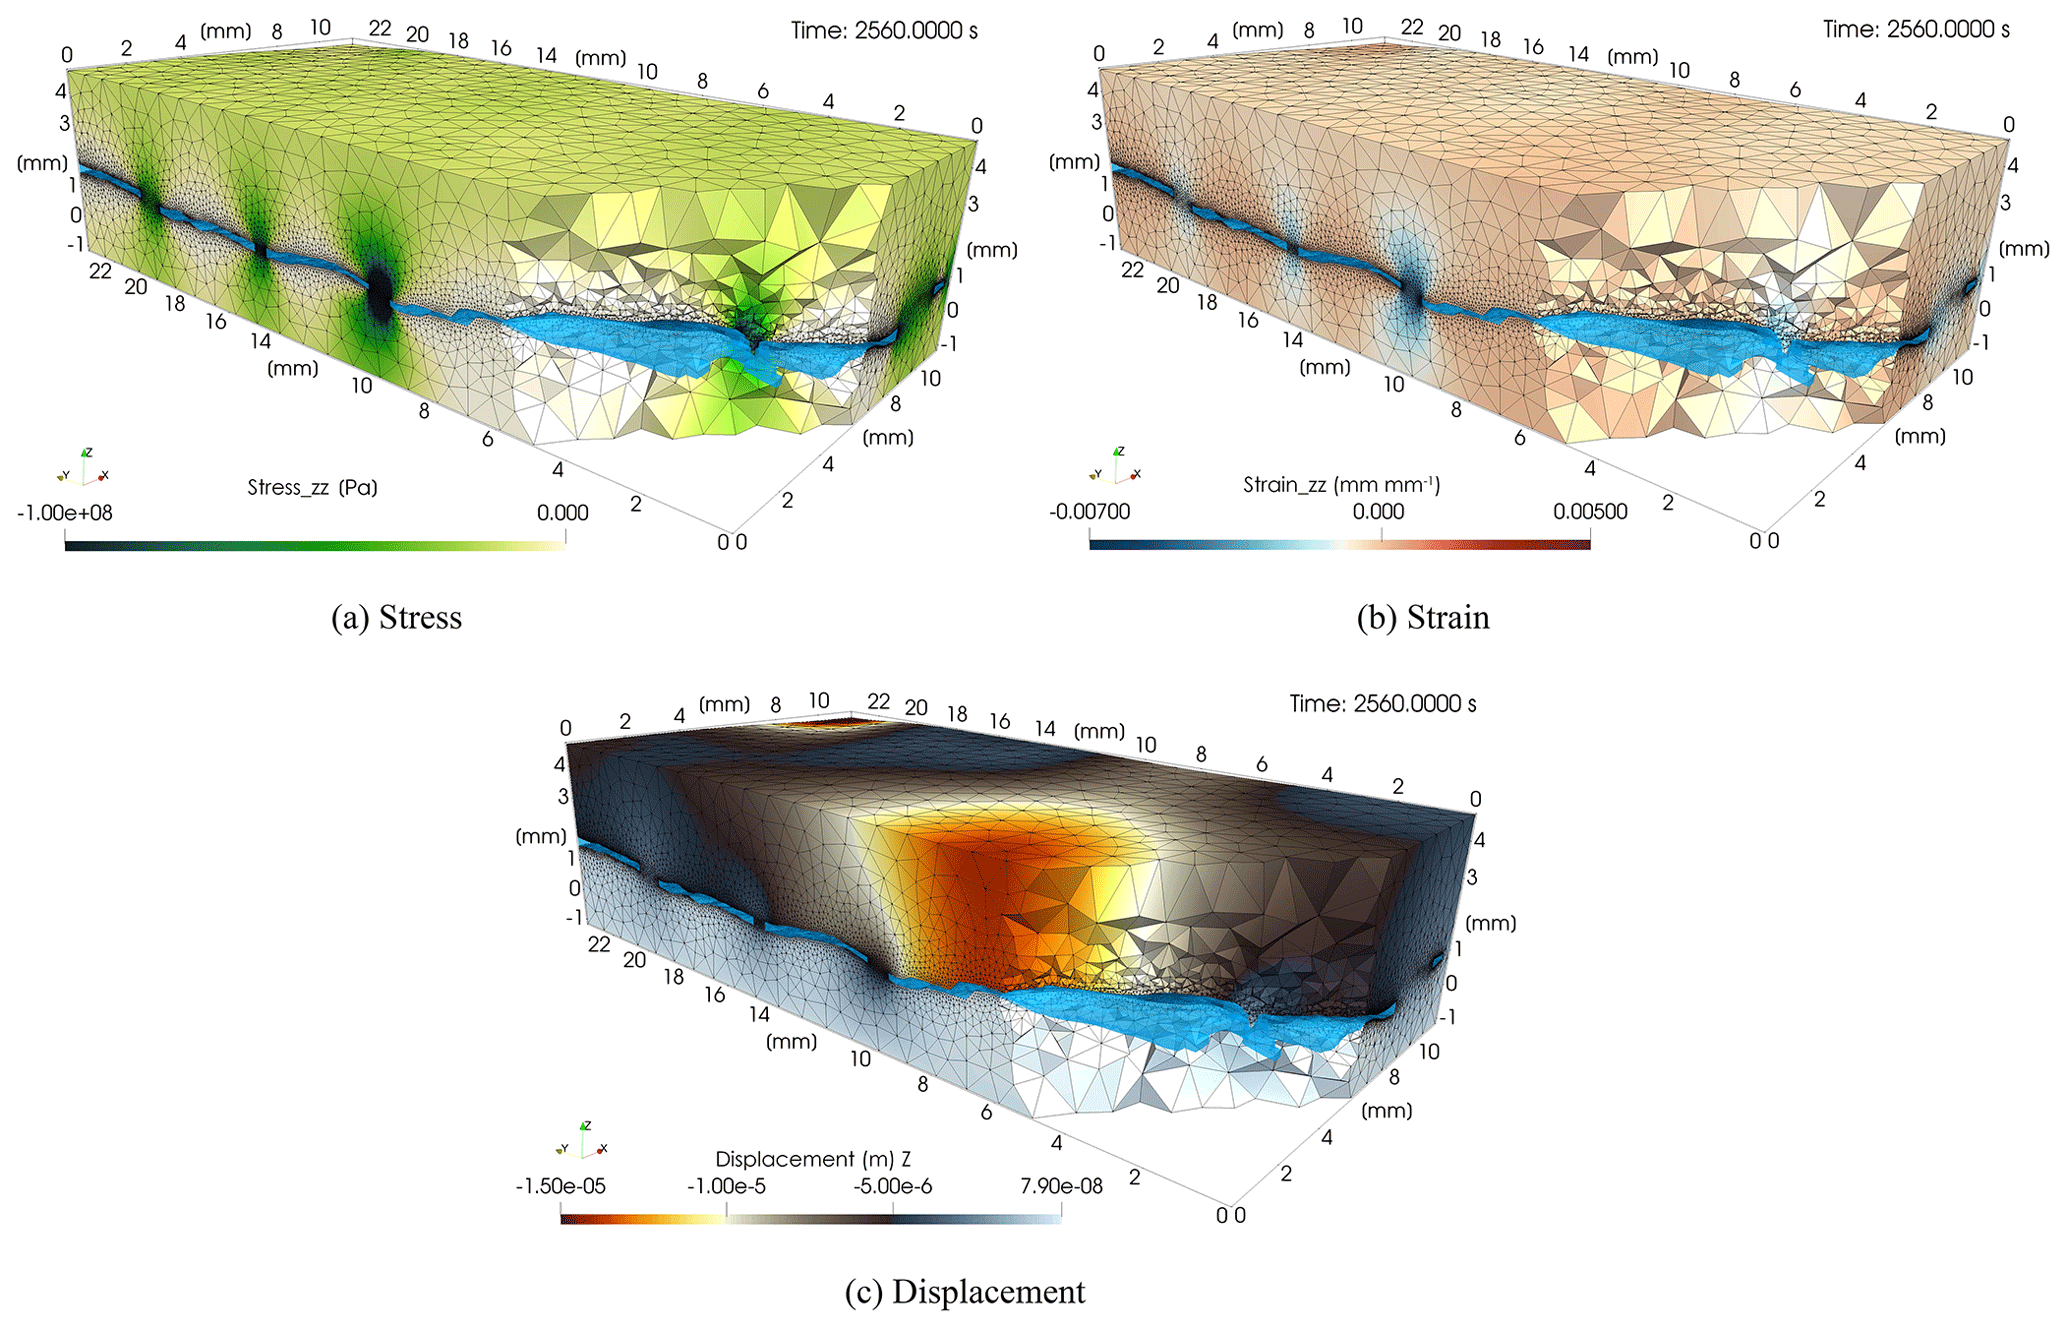
Figure 7Stress, strain, and displacement in the matrix-fracture system after after applying 17 MPa normal stress at the top surface.
This deformation led to a closure of the fracture and an increase in the average inlet fluid pressure from 4728 to 4778 Pa. With an inlet fracture area of 1.3 mm2, a fracture length of 23.5 mm, an inflow velocity of 0.157 m s−1 the initial fracture permeability of m2 ( m2 calculated by cubic law with an average aperture a=0.267 mm) reduced to m2 at 17 MPa normal stress at the top surface. This was correlated to a permeability decrease of approximately 1.0 % due to fracture closure.
Even if only elastic rheology is introduced in the model, the calculated stress-strain state was compared to failure envelopes obtained by laboratory experiments in order to detect possible limit of the elastic behavior. Such failure criteria are power-law functions of the mean stress acting on the plane of failure (Chang and Haimson, 2012):
where A and n are material constants. Failure occurs when the octahedral shear stress:
has reached a critical value in terms of the mean effective normal stress acting on the failure plane (Nadai and Hodge, 1963; Mogi, 1971, 1972):
Although true tri-axial strength data in various rocks are best modelled by power-law relationships between octahedral shear stress and mean effective normal stress, it has been suggested that they can be approximated by a linear relationship (Al-Ajmi and Zimmerman, 2005):
The material parameters a and b can be linked to known rock mechanical properties:
or
where c is the cohesion, ϕ is the angle of internal friction, C0 is uniaxial compressive strength, and . We used the linear approximation of the power-law failure criterion to evaluate potential fracture damage. Such a linear approximation indicates a failure in the vicinity of the asperities (Fig. 8) which will potentially lead to a permanent fracture damage. In particular, the asperities will potentially collapse leading to a reduction of aperture and an increase of fracture contact area, which will henceforth lead to a dramatic reduction of permeability.
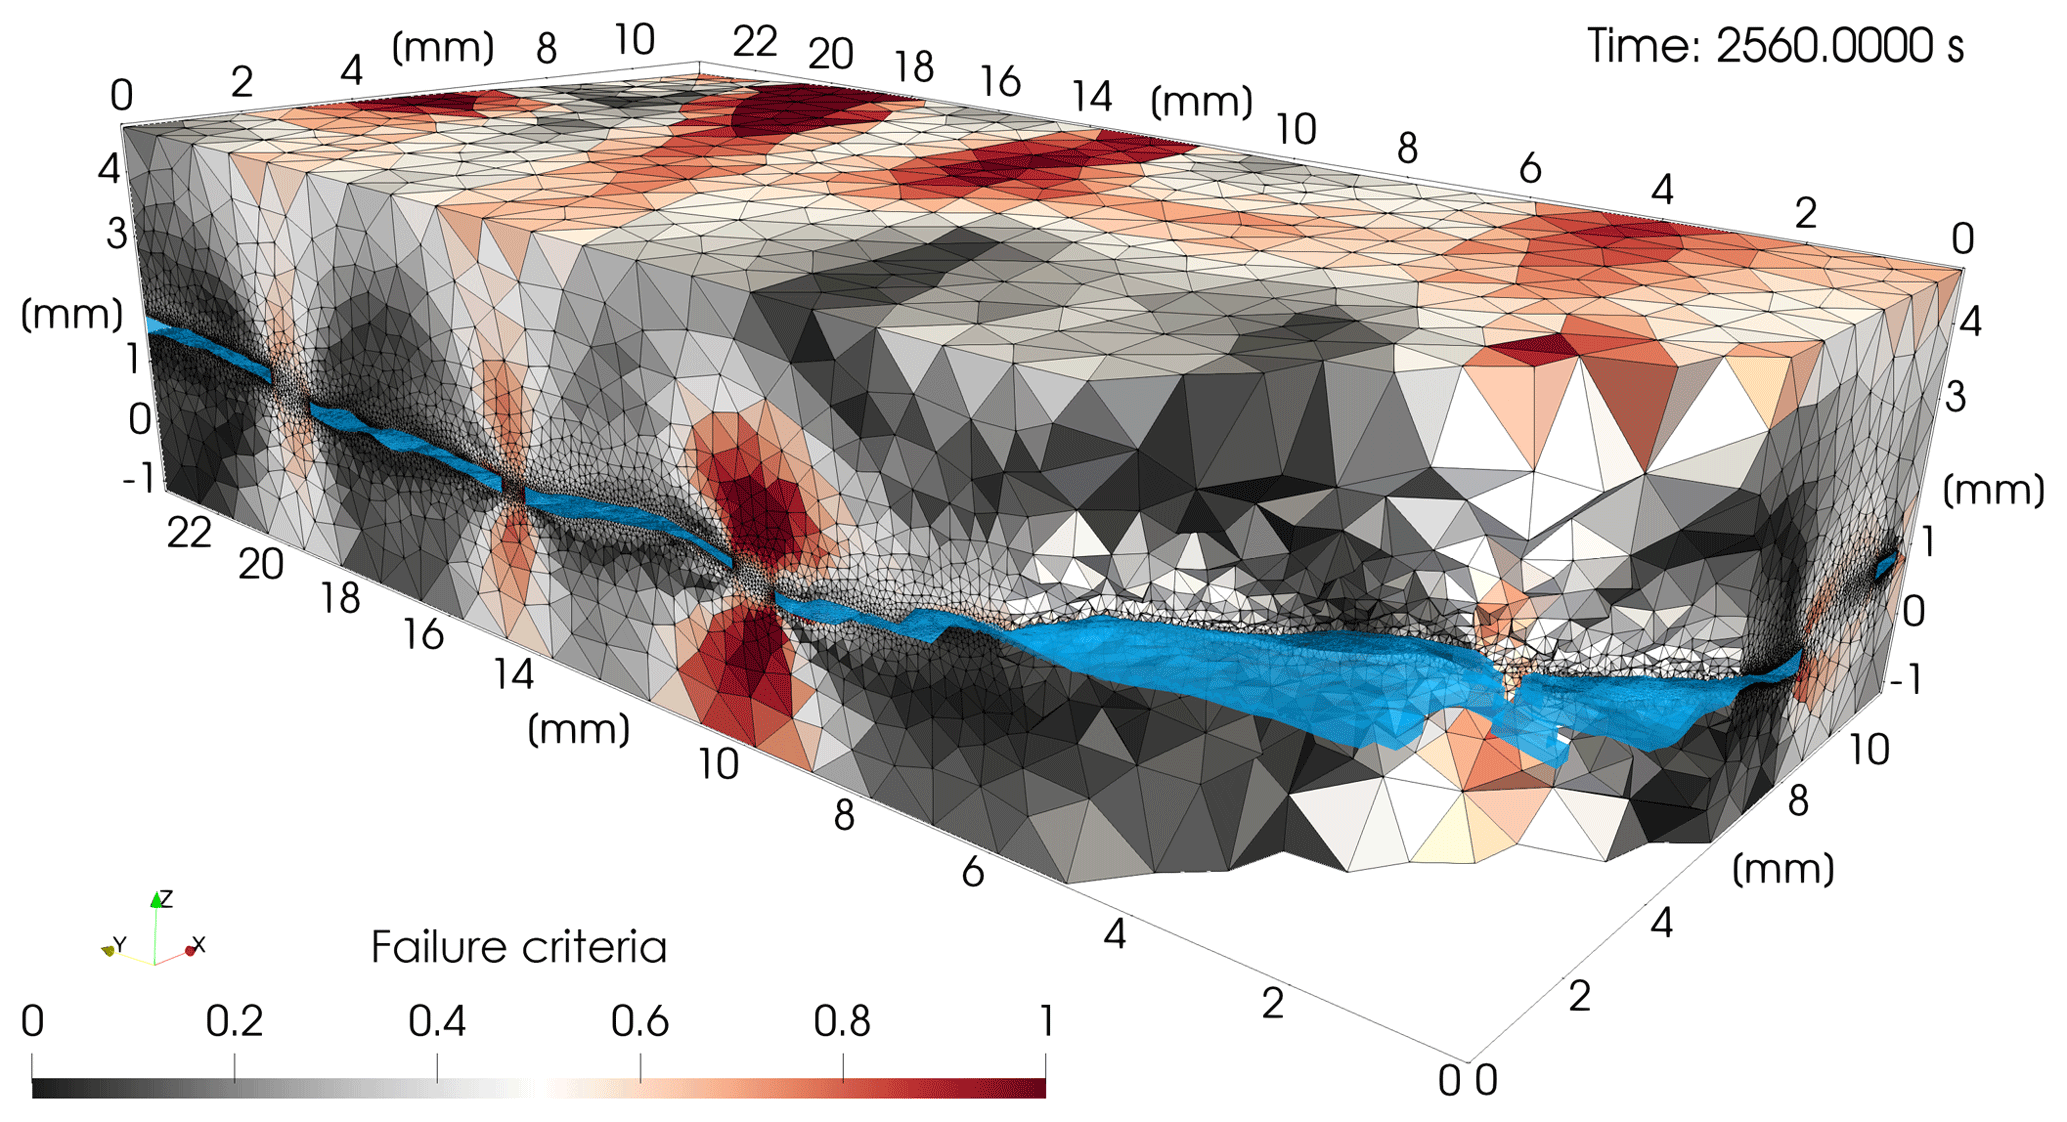
Figure 8Normalized failure criterion: based on true tri-axial testing in the matrix-fracture system after applying 17 MPa normal stress at the top surface.
4.1 Model Constraints and Simplification
In order to generate the FE-Mesh, the scan of one single fracture surface was used. Indeed, scanning only one fracture surface and duplicating it, has the advantage of providing the simplest model for generating a perfect tensile fracture. For such a perfect tensile fracture, the influence of surface roughness and surface orientation on the fracture aperture can be neglected. Fracture aperture was then introduced by imposing both shear offset along the fracture plane and normal offset perpendicular to the fracture plane. The generated fracture volume can be used to test the presented method but requires some improvement to represent real fracture opening. To obtain a more realistic fracture open volume, either both surfaces of the fracture should be scanned and recombined or two synthetic self-affine surfaces should be generated (Méheust and Schmittbuhl, 2001, 2003; Candela et al., 2009; Neuville et al., 2010, 2011, 2012).
In real fractures, mineralisation inside the fracture volume (Vidal et al., 2015; Griffiths et al., 2016) and the trapping of fluid volume can occur (Yang et al., 2016). Both the mechanical properties of the filling material as well as the induced pore pressure in the trapped fluid regions will alter the mechanical response of the overall system and should be considered in subsequent simulations. Therefore, the mesh generation, as well as the numerical simulation should be improved to fully represent the filling material and isolated regions of the fracture.
The current numerical simulation solves for the dynamic pressure due to the viscous term of the fluid. In contrast, the absolute pressure acting on the fracture surfaces is essential in fracture mechanics. For a better approximation of the hydro-mechanical processes in the matrix-fracture system, both, the dynamic, as well as the absolute pressure, must be considered. Such an implementation would allow for a simulation of fluid pressure and stress conditions as applied in the laboratory experiments which will make direct comparison more effective. Furthermore, imposed effective stresses during the laboratory experiments were between 30 and 60 MPa. In the numerical simulation only a normal stress of 17 MPa at the top surface was applied. This will be valid to simulate the general trend of deformation but provides some limitations to extrapolate the numerical results to the laboratory analogue.
4.2 Permeability Calculation
For calculating the fracture permeability, we assumed laminar flow conditions and applied Darcy's law. Although the flow rate is constant, the fluid velocity v along the fracture varies due to variations in fracture aperture and therefore cross sectional area Afrac. This leads to a permeability distribution along the fracture having low permeability values for narrow parts and high permeability values for wide parts of the fracture. Calculating such a permeability distribution is only possible if based on a previous knowledge of the local value of fluid velocity and corresponding pressure gradient. Therefore the modelling results should be considered only as a qualitative measure for the fracture permeability on the macroscopic scale.
These numerical obtained permeability values should be compared to the laboratory results. For the laboratory experiments no information about local fluid velocity and local pressure gradients are available and only the permeability on the macroscopic scale of the matrix-fracture system was determined. Therefore, we calculated the numerical obtained permeability of the overall system by imposing the same pressure boundaries for the rock matrix, as well as for the fracture. This would result in a constant pressure boundary at the inlet (matrix and fracture) and at the outlet. For the overall system the cross-sectional area Atotal will not change and the total permeability can be obtained:
Since the flow is related to the total cross-sectional area, the obtained total permeability cannot be used to separate the fracture permeability. However, if we can consider the flow to be dominated by the fracture permeability, then changes of the total permeability can be approximated by changes in the fracture permeability only. Furthermore, the numerical results can be compared to the laboratory results in terms of permeability.
The laboratory experiments indicate that the permeability alteration is due to elastic and inelastic deformation. Elastic deformation only causes 13 % to 19 % of the total deformation. This elastic deformation leads to a permeability recovery of 19 % to 30 % (see Sect. 2) and only slight alteration of the strain. The maximum strain, including the inelastic and elastic components, was measured to be mm mm−1. Based on a hydro-mechanical simulation of the fractured block, an attempt was made to model the fracture closing during mechanical load and assess the elastic limit by using the failure envelope obtained from laboratory experiments. The obtained stress-strain values in the vicinity of the fracture asperities provide a clear indication of possible inelastic deformation of the matrix-fracture system even at low effective pressures. However the elastic deformation obtained by the numerical simulation causes a compressive strain in z-direction in the order of mm mm−1 comparable to the experimental measurement. Since the numerical simulation only considers the poroelastic behaviour without plastic strain, simulated strains are expected to be little compared to the obtained experimental results that include elastic and inelastic deformation. Otherwise the simulated alteration of permeability is much smaller than the experimentally measured change of permeability: only 1 % in the numerical model compare to about 62 % in the experiment. We deduced that two aspects in the imposed model assumptions have to be improved for the simulation of the permeability evolution: first, the synthetic setting of the fracture opening has been simplified to a geometrical offset and a pure plastic deformation of the overlapping asperities; second, only the elastic deformation of the fracture asperities during closure is considered ignoring the plastic evolution of the contact area between the fracture surfaces. Both aspects will be considered in subsequent studies.
Due to the size of the simulation results (5 GB) the data are not publicly accessible. The simulation input files can be requested by eMail: guido.bloecher@gfz-potsdam.de.
The laboratory experiments were conducted by CK with scientific support of HM. The nuermical simulation was performed by GB and related/required code development were carried out by MC and AJ. Linkage between the laboratory experiments and numerical simulation were derived by JS and GB.
The authors declare that they have no conflict of interest.
This article is part of the special issue “European Geosciences Union General Assembly 2019, EGU Division Energy, Resources & Environment (ERE)”. It is a result of the EGU General Assembly 2019, Vienna, Austria, 7–12 April 2019.
The authors acknowledge the financial support by the Federal Ministry for Economic Affairs and Energy of Germany (BMWi) in the project RESALT (project no. 0324244C).
The article processing charges for this open-access publication were covered by a Research Centre of the Helmholtz Association.
This paper was edited by Christopher Juhlin and reviewed by two anonymous referees.
Al-Ajmi, A. M. and Zimmerman, R. W.: Relation between the Mogi and the Coulomb failure criteria, Int. J. Rock Mech. Min., 42, 431–439, https://doi.org/10.1016/j.ijrmms.2004.11.004, 2005. a
Baujard, C., Genter, A., Dalmais, E., Maurer, V., Hehn, R., Rosillette, R., Vidal, J., and Schmittbuhl, J.: Hydrothermal characterization of wells GRT-1 and GRT-2 in Rittershoffen, France: Implications on the understanding of natural flow systems in the Rhine Graben, Geothermics, 65, 255–268, 2017. a
Blöcher, G., Reinsch, T., Henninges, J., Milsch, H., Regenspurg, S., Kummerow, J., Francke, H., Kranz, S., Saadat, A., Zimmermann, G., and Huenges, E.: Hydraulic history and current state of the deep geothermal reservoir Groß Schönebeck, Geothermics, 63, 27–43, https://doi.org/10.1016/j.geothermics.2015.07.008, 2016. a
Cacace, M. and Jacquey, A. B.: Flexible parallel implicit modelling of coupled thermal–hydraulic–mechanical processes in fractured rocks, Solid Earth, 8, 921–941, https://doi.org/10.5194/se-8-921-2017, 2017. a, b
Cacace, M., Blöcher, G., Watanabe, N., Moeck, I., Börsing, N., Scheck-Wenderoth, M., Kolditz, O., and Huenges, E.: Modelling of fractured carbonate reservoirs: outline of a novel technique via a case study from the Molasse Basin, southern Bavaria, Germany, Environ. Earth Sci., 70, 3585–3602, https://doi.org/10.1007/s12665-013-2402-3, 2013. a
Candela, T., Renard, F., Bouchon, M., Brouste, A., Marsan, D., Schmittbuhl, J., and Voisin, C.: Characterization of Fault Roughness at Various Scales: Implications of Three-Dimensional High Resolution Topography Measurements, Pure Appl. Geophys., 166, 1817–1851, https://doi.org/10.1007/s00024-009-0521-2, 2009. a
Chang, C. and Haimson, B.: A Failure Criterion for Rocks Based on True Triaxial Testing, Rock Mech. Rock Eng., 45, 1007–1010, https://doi.org/10.1007/s00603-012-0280-8, 2012. a
Cornet, F. H.: Elements of crustal geomechanics, Cambridge University Press, Cambrige, UK, 49 pp., https://doi.org/10.1017/CBO9781139034050, 2015. a
Geuzaine, C. and Remacle, J.-F.: Gmsh: A 3-D finite element mesh generator with built-in pre- and post-processing facilities, Int. J. Numer. Meth. Eng., 79, 1309–1331, https://doi.org/10.1002/nme.2579, 2009. a
Griffiths, L., Heap, M., Wang, F., Daval, D., Gilg, H., Baud, P., Schmittbuhl, J., and Genter, A.: Geothermal implications for fracture-filling hydrothermal precipitation, Geothermics, 64, 235–245, 2016. a
Gudmundsson, A.: Rock fractures in geological processes, Cambridge University Press, Cambridge, UK, 505 pp., 2011. a
Guyon, E., Hulin, J.-P., Petit, L., and Mitescu, C. D.: Physical hydrodynamics, Oxford university press, Oxford, UK, 341 pp., 2001. a
Hofmann, H., Blöcher, G., Milsch, H., Babadagli, T., and Zimmermann, G.: Transmissivity of aligned and displaced tensile fractures in granitic rocks during cyclic loading, International Journal of Rock Mechanics and Mining Sciences, 87, 69–84, https://doi.org/10.1016/j.ijrmms.2016.05.011, 2016. a
Ingebritsen, S. E. and Sanford,W. E.: Groundwater in geologic processes, Cambridge University Press, United States of America, Cambridge University Press, New York, 365 pp., 1999. a
Jaeger, J. C., Cook, N. G., and Zimmerman, R.: Fundamentals of rock mechanics, 4th Edn., edited by: Jaeger, J. C., Cook, N. G. W., and Zimmerman, R., ISBN: 978-0-632-05759-7 April 2007 Wiley-Blackwell (USA), John Wiley & Sons, 488 pp., 2009. a
Kluge, C., Blöcher, G., Milsch, H., Hofmann, H., Nicolas, A., Li, Z., and Fortin, J.: Sustainability of fractured rock permeability under varying pressure – Proceedings, 6th Biot Conference on Poromechanics (Paris, France 2017), 1192–1199, https://doi.org/10.1061/9780784480779.148, 2017a. a
Kluge, C., Milsch, H., and Blöcher, G.: Permeability of displaced fractures, Energy Proced., 125, 88–97, https://doi.org/10.1016/j.egypro.2017.08.077, 2017b. a
Méheust, Y. and Schmittbuhl, J.: Geometrical heterogeneities and permeability anisotropy of rough fractures, J. Geophys. Res.-Sol. Ea., 106, 2089–2102, 2001. a, b
Méheust, Y. and Schmittbuhl, J.: Scale effects related to flow in rough fractures, Pure Appl.Geophys., 160, 1023–1050, 2003. a, b
Mogi, K.: Fracture and flow of rocks under high triaxial compression, J. Geophys. Res., 76, 1255–1269, https://doi.org/10.1029/jb076i005p01255, 1971. a
Mogi, K.: Effect of the triaxial stress system on fracture and flow of rocks, Phys. Earth Planet. In., 5, 318–324, https://doi.org/10.1016/0031-9201(72)90102-1, 1972. a
Nadai, A. and Hodge, P. G.: Theory of Flow and Fracture of Solids, vol. II, J. Appl. Mech., 30, 640 pp., https://doi.org/10.1115/1.3636654, 1963. a
Neuville, A., Toussaint, R., and Schmittbuhl, J.: Hydrothermal coupling in a self-affine rough fracture, Phys. Rev. E, 82, 036317, https://doi.org/10.1103/PhysRevE.82.036317, 2010. a, b
Neuville, A., Toussaint, R., and Schmittbuhl, J.: Hydraulic transmissivity and heat exchange efficiency of open fractures: a model based on lowpass filtered apertures, Geophys. J. Int., 186, 1064–1072, 2011. a, b
Neuville, A., Toussaint, R., and Schmittbuhl, J.: Fracture aperture reconstruction and determination of hydrological properties: a case study at Draix (French Alps), Hydrol. Process., 26, 2095–2105, 2012. a
Pei, L., Blöcher, G., Milsch, H., Zimmermann, G., Sass, I., and Huenges, E.: Thermo-mechanical Properties of Upper Jurassic (Malm) Carbonate Rock Under Drained Conditions, Rock Mech. Rock Eng., 51, 23–45, https://doi.org/10.1007/s00603-017-1313-0, 2017. a
Peterson, J. W., Lindsay, A. D., and Kong, F.: Overview of the incompressible Navier–Stokes simulation capabilities in the MOOSE framework, Adv. Eng. Softw., 119, 68–92, https://doi.org/10.1016/j.advengsoft.2018.02.004, 2018. a
Pyrak-Nolte, L. and Morris, J.: Single fractures under normal stress: The relation between fracture specific stiffness and fluid flow, Int. J. Rock Mech. Min., 37, 245–262, https://doi.org/10.1016/s1365-1609(99)00104-5, 2000. a
Vidal, J., Genter, A., and Schmittbuhl, J.: How do permeable fractures in the Triassic sediments of Northern Alsace characterize the top of hydrothermal convective cells? Evidence from Soultz geothermal boreholes (France), Geothermal Energy, 3, 2195-9706, https://doi.org/10.1186/s40517-015-0026-4, 2015. a
Wanniarachchi, W., Ranjith, P., Perera, M., Rathnaweera, T., Zhang, C., and Zhang, D.: An integrated approach to simulate fracture permeability and flow characteristics using regenerated rock fracture from 3-D scanning: A numerical study, J. Nat. Gas Sci. Eng., 53, 249–262, https://doi.org/10.1016/j.jngse.2018.02.033, 2018. a
Witherspoon, P. A., Wang, J. S. Y., Iwai, K., and Gale, J. E.: Validity of Cubic Law for fluid flow in a deformable rock fracture, Water Resour. Res., 16, 1016–1024, https://doi.org/10.1029/wr016i006p01016, 1980. a
Yang, Z., Neuweiler, I., Méheust, Y., Fagerlund, F., and Niemi, A.: Fluid trapping during capillary displacement in fractures, Adv. Water Resour., 95, 264–275, https://doi.org/10.1016/j.advwatres.2015.07.015, 2016. a