 | 22 Oct 2018
A Human Centric Approach on the Analysis of the Smart City Concept: the case study of the Limassol city in Cyprus
Maroula N. Alverti
Kyriakos Themistocleous
Phaedon C. Kyriakidis
Diofantos G. Hadjimitsis
The impact of medium-sized southern European cities challenges on the “smartness” of the city is a quite interesting case that is not quite analyzed yet. Our scientific objective is to find a simple understandable model linking human smart characteristics to a group of socio-demographic and urban environment indices, applied to the case of Limassol Urban Complex, the southernmost European city, with a total population of 208 980. The data set of the analysis contains 25 variables in 3 thematic domains using as spatial analysis level, the 126 postal code areas of the most urbanized part of the city. The study results obtained through multivariate statistical analysis and thematic cartography using GIS technology. The results reveal that the human smart characteristics consist of the use of high-speed internet and broad band telephony, recycling activities, employment in creative industry, high educational attainment and open-mindedness (i.e. participation in EU elections), are significantly correlated with demographic dynamics and built infrastructure characteristics. Creativity and open-mindedness tend to appear in most densely urban areas, mostly occupied by indigenous inhabitants. Recycling and technology oriented smart characteristics are mostly correlated with no-native residents, and high educational attainment. In the outskirts of the city of Limassol the developing dynamics are almost the same with a greater blend between native and non-native inhabitants.
- Article
(9526 KB) - Full-text XML
- BibTeX
- EndNote


Rapid urbanization generates new kind of challenges, such as air pollution, waste management, health concerns, deteriorating and aging infrastructure. Another set of issues are in nature rather than technical, physical or material and are associated with multiple and diverse stakeholders, high levels of interdependence, competing objectives and values, social and political complexity. In that sense, city problems become wicked and tangled. Ensuring livable conditions within the context of such rapid urban population growth worldwide requires a deeper understanding of the Smart City (SC) concept. The urgency around these challenges is triggering many cities around the world to find smarter ways to achieve sustainable management. These cities are increasingly described with the label “smart city” (Chourabi et al., 2012).
However, despite the rise in SC notion in the urban planners debate on the future of cities, the diffusion of SC initiatives in countries with different needs and contextual conditions (e.g. in either developed or developing nations) makes it difficult to identify shared definitions and common current trends at a global scale (Neirotti et al., 2014).
In light of the aforementioned discussion, the article argues that a foregrounding of human needs should be at the heart of thinking and planning for the future cities. The human dimension must be considered as a core basis and foundation on which urban future could be usefully envisaged.
The research question is whether and in what extent the human SC characteristics are correlated with socio-demographic and built environment attributes at the local context. In order to provide an empirical investigation of our research question, appropriate indicators for the main aspects of smart people, human and built environment determinants were identified for the Cyprus, Limassol District, the southernmost European urban agglomeration.
This paper provides statistical and spatial analysis and the results of the analysis as well as the main findings of this study. Finally, the authors propose areas for further research, and illustrates the strengths and limitations of the study.
2.1 People at the centre of the debate
The process of transforming a city into a SC is complex, multidimensional (Nam and Pardo, 2011) and multidisciplinary (Angelidou, 2015). The SC literature focuses on the use of Information and Communication Technologies (ICTs) and modern technologies as a key to the SC notion (Bakici et al., 2013; Canton, 2011; Gartner, 2011; Toppeta, 2010; Washburn et al., 2010; Jong et al., 2015). Another part of related literature highlights – in addition to new technologies – the balance between, people and technology (Ben Letaifa, 2015) as well as the role of human capital in developing smart cities and improving the quality of life for their citizens (Neirotti et al., 2014; Kourtit et al., 2012; Nam and Pardo, 2011). Giffinger et al. (2007) state that “a SC is a city well performing in a forward-looking way in the following six characteristics [smart economy, smart environment, smart mobility, smart people, smart living and smart governance], built on the “smart” combination of endowments and activities of self-decisive, independent, and aware citizens”. In this direction Caragliu et al. (2011) present that a city is smart if it makes “investments in human and social capital and traditional (transport) and modern (ICT) communication infrastructure fuel sustainable economic growth and a high quality of life, with a wise management of natural resources, through participatory governance”. Shapiro (2006) and Hollands (2008) come to joint conclusion that the smarter cities start from the human capital side, rather than blindly believing that ICT can automatically create a SC. An interesting research written by Castelnovo et al. (2015) reflect this point of view and reaffirm the central role of citizens in the decision-making process and their fundamental contribution to public value creation in the city context
It can be summarized that construction or transformation of any urban agglomeration into a smarter city has to start from the premise of being integrated to the wishes, interests and needs – both current and potential – of its residents and also of producing positive practical impact on their daily lives (Lara et al., 2016). New technologies cannot automatically resolve all, or even some of the problems of a modern city. The needs of a contemporary city are strongly determined by the human factor. Thus, the smart cities concept is not only technology driven but increasingly, human needs driven.
Within this framework, we searched through the related literature, the indicators that better express those smart people characteristics, through different SC assessment methods and rating systems, both of academia and international institutions.
The selected systems required to have actual indicators instead of general goals or benchmarks.
2.2 Applying Human Smart City Characteristics
The evolution of conceptual smart cities framework reflects the growing importance of governance and the shift to citizen-centric approaches (Castelnovo et al., 2015; Dameri, 2013; Fernández-Güell et al., 2016), and the key role assigned to stakeholders (Dameri, 2013; Fernández-Güell et al., 2016; Leydesdorff and Deakin, 2010; Lombardi et al., 2011).
The human centered approach to SC concept is a crucial component to city's transformation and its future development.
According the aforementioned discussion we tried to investigate the defined determinants that better accommodate these arguments. Factors like the capacity of human (Berry and Glaeser, 2005) and the role of higher education, skills, creativity and talent (Shapiro, 2006; Winters, 2011) have all emerged as the main drivers of smart urban development.
Main components for a successful SC strategy are the creative and cultural assets, which consequently give an orientation towards local identity and local roots (Lombardi et al., 2011).
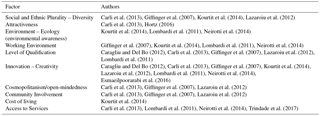
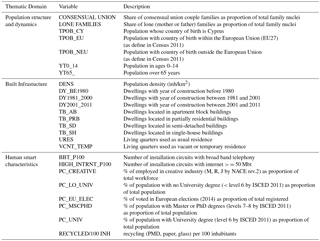
The topic of “smart people” as part of the SC concept is crucial and has already been reported by many researchers working on this concept. Table 1 lists the factors related to smart cities and people, as found in the literature.
The variables selected, following the above-mentioned methodology, are presented in Table 2.
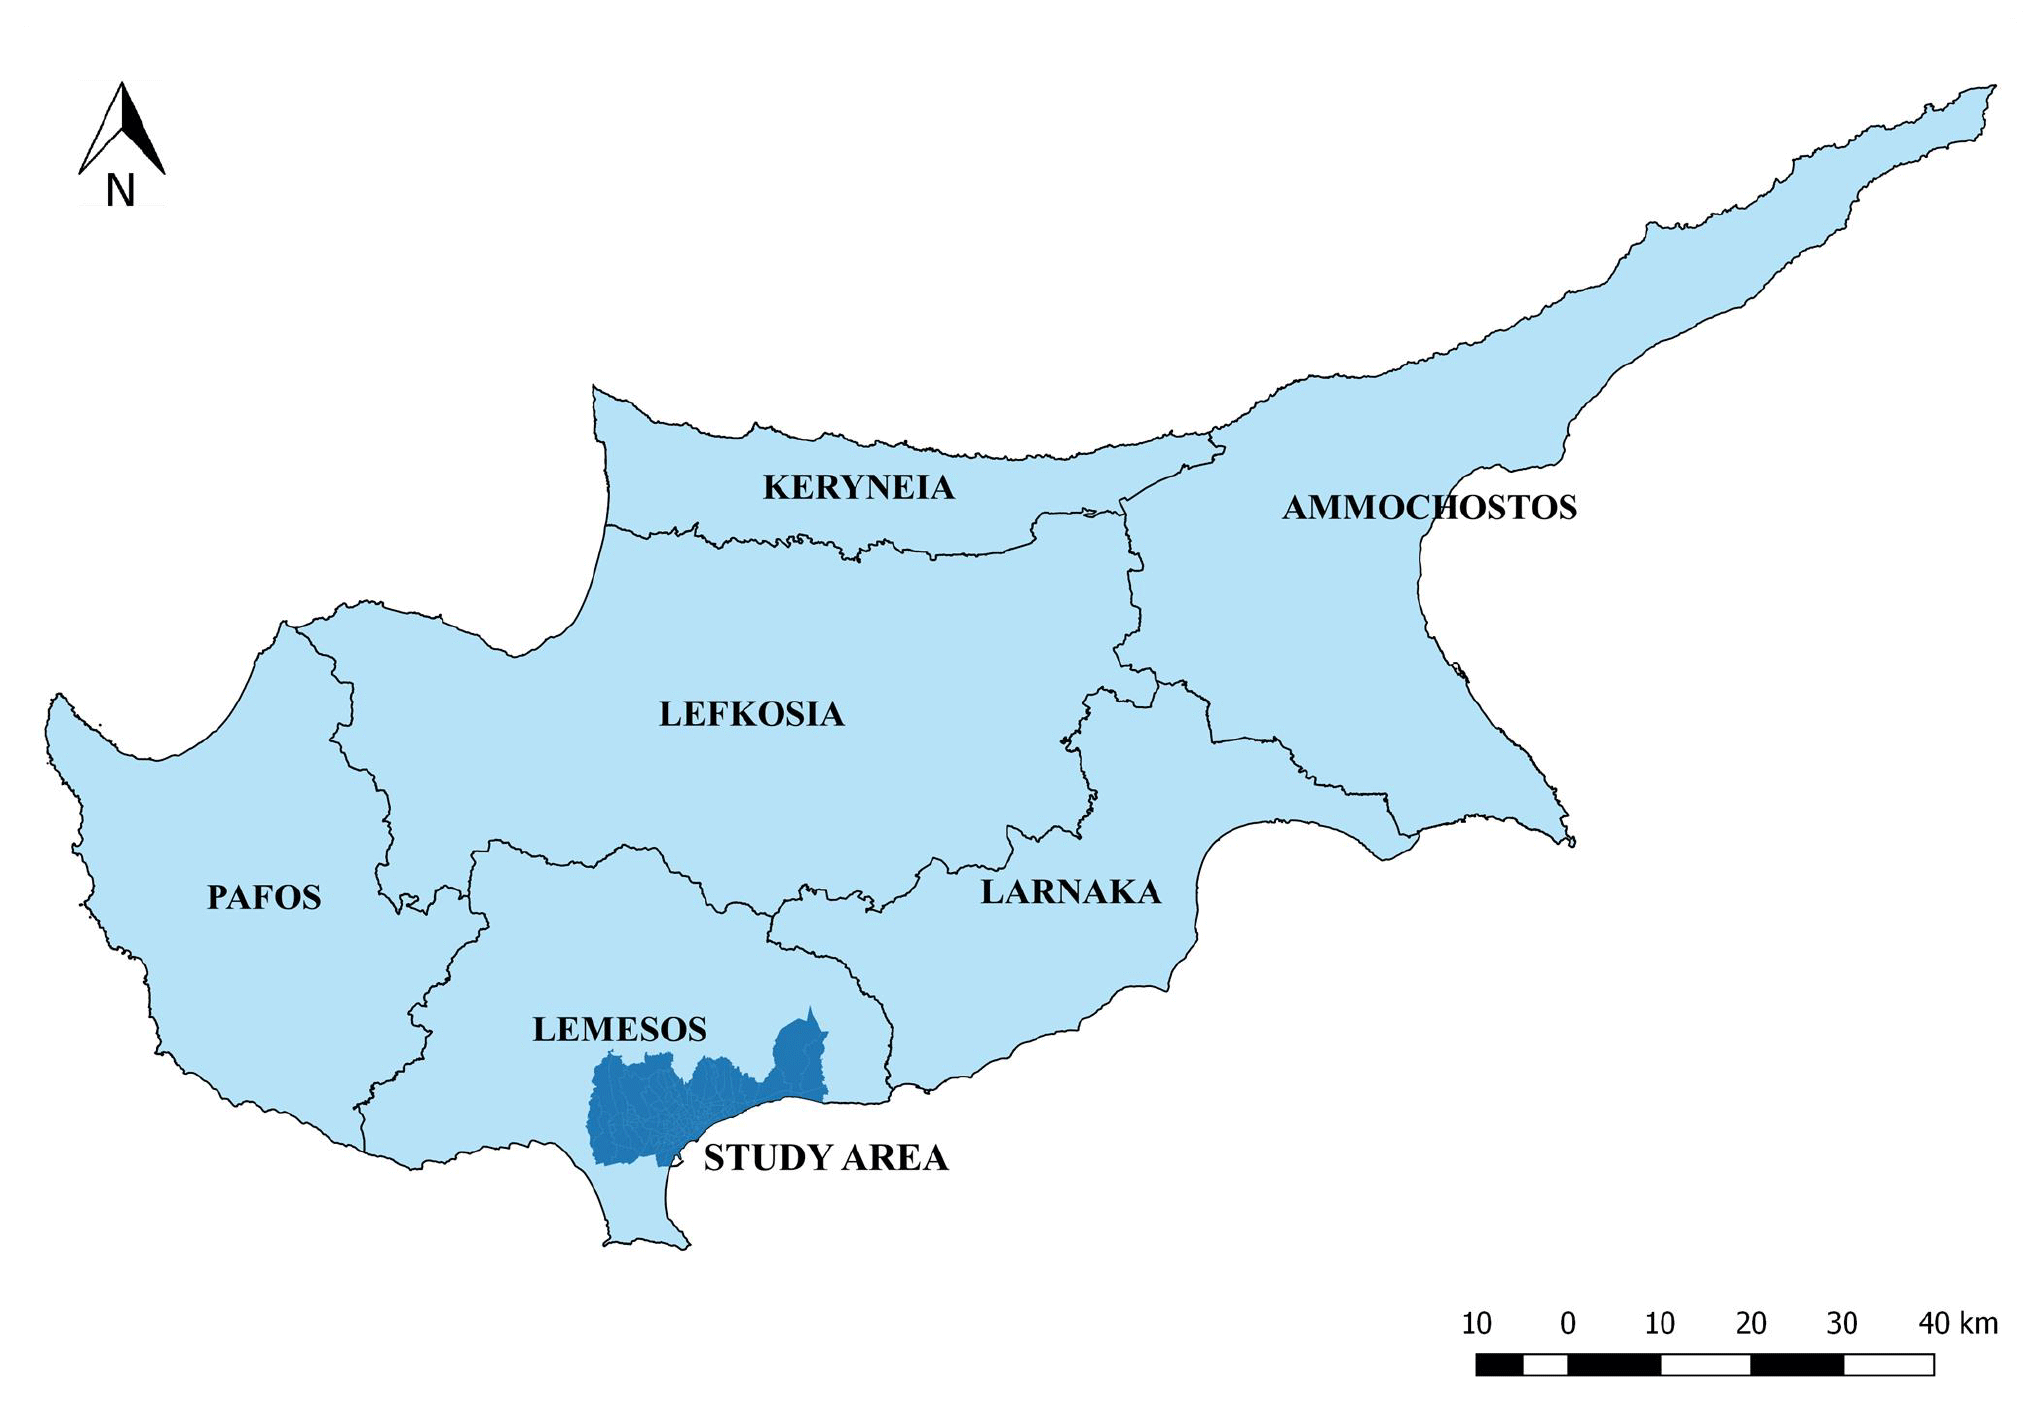
The study area covers the urbanized area of the Limassol District, the Limassol Urban Complex (LUC), including the Municipality of Limassol the largest agglomeration in Cyprus and the southernmost of the European Union (Fig. 1). It is a coastal area of 231.40 km2, accommodating 208 980 inhabitants (Cystat, 2011), consisted of the 89.58 % of the total district population.
Cyprus in total and Limassol particularly experienced an inward migration over the last decade, developing into a migration locus inhabited by people hailing from various cultural backgrounds, coming from 43 different countries all over the world (18 countries from EU and 25 countries from no-EU).
Limassol occupies the southernmost point of the island and is the largest port in the country, home of the 3rd largest merchant navy in Europe and a highly diverse city. Therefore, one could claim that Limassol qualifies as significant European city, that accommodates a variety of international financial services, which dominate the trade and economy of the extended southern Mediterranean and Middle Eastern regions (Nicolaou et al., 2016). Since 1974, Limassol is the main port entrance of the country and one of the famous tourist destinations in Cyprus.
4.1 Urbanization – Urban Sprawl
After the Turkish invasion in Cyprus, back in 1974, intense urbanization occurs on the island. Thus, forty years later, in 2014, more than half (51 %) of the Cypriots lived in a city, compared with the 41.6 % of the EU-28 population (Eurostat, 2016)
The rapid development of the urban areas, as stated in the National Report of the Republic of Cyprus presented to the Habitat Conference (Republic of Cyprus/DTPH, 1996), has caused deformation and change in the character of both urban and rural settlements. The central parts of the town suffer from their haphazard and crowded layout, which, in turn, gives rise to traffic congestion and general difficulties of circulation, servicing, and so forth. In addition, the most noticeable circumstance of the period 1980–2000 has been the rapid growth of the suburbs into what was previously greenfield.
In Fig. 2 can be noticed that Limassol District, given its special characteristics, has greater urban population pressures compared with the total of Cyprus.

In this context, urban sprawl has been the predominant form of urban development since 1960 (Constantinides, 2001).
In Fig. 5a we notice substantial differences in population density figures. Central urban areas, north and east from the city historic centre, density varies from 5200 to 10 436 inh/km2, however the north suburbs which comprises the city expansion holds density from 1500 to 5200 inh/km2. In the city's outskirts eastern and western density is relatively low, up to 550 inh/km2. Additionally, the residential buildings, constructed during the last decade, are located outside of the city center, representing the city development in the build environment. It is worth to mention that the newly developed residential areas are characterized by lower population density, compared with the central areas (Fig. 5b).
4.2 Demographic Trends
As CYSTAT (2016) report, the population growth in Cyprus from 2001 (703 529) to 2011 (840 407) is 21.9 % in comparison with only 14.5 % in the previous decade (1992–2001). Although, Eurostat estimates that the average EU population growth is due to increase of migration flows, in Cyprus this is mainly based on the natural change of its population, where crude birth and death rates are constant stable and performed better from the EU average. In 2016, Cyprus population comprised the 0.2 % of the total EU-28 population, displayed growth +7.6 per 1000 inhabitants, well above the European average (+3.0). This mainly originated by the second highest proportion of natural change of its population (+4.7) and well above the EU average of −15.9.
Although ageing is the main characteristic of the EU population, the age composition of Cyprus population portrays a somewhat younger age structure than the European average (Fig. 3). The slight decrease of birth rates in last decade and a steady increase in life expectancy have contributed to reducing the proportion of ages 0–14 to 16.06 % (2011) from 21.4 % in 2001. Comparing though with the average (15.7 % for 2011) of EU-28 countries, Cyprus stands well above, generally having younger age structure. It is also expected that the proportion of elderly ages (65+) showed a small increase being 13.3 % (17.6 % for EU-28) in 2011, compared to 24.53 % (26.8 % for EU-28) ten years before.
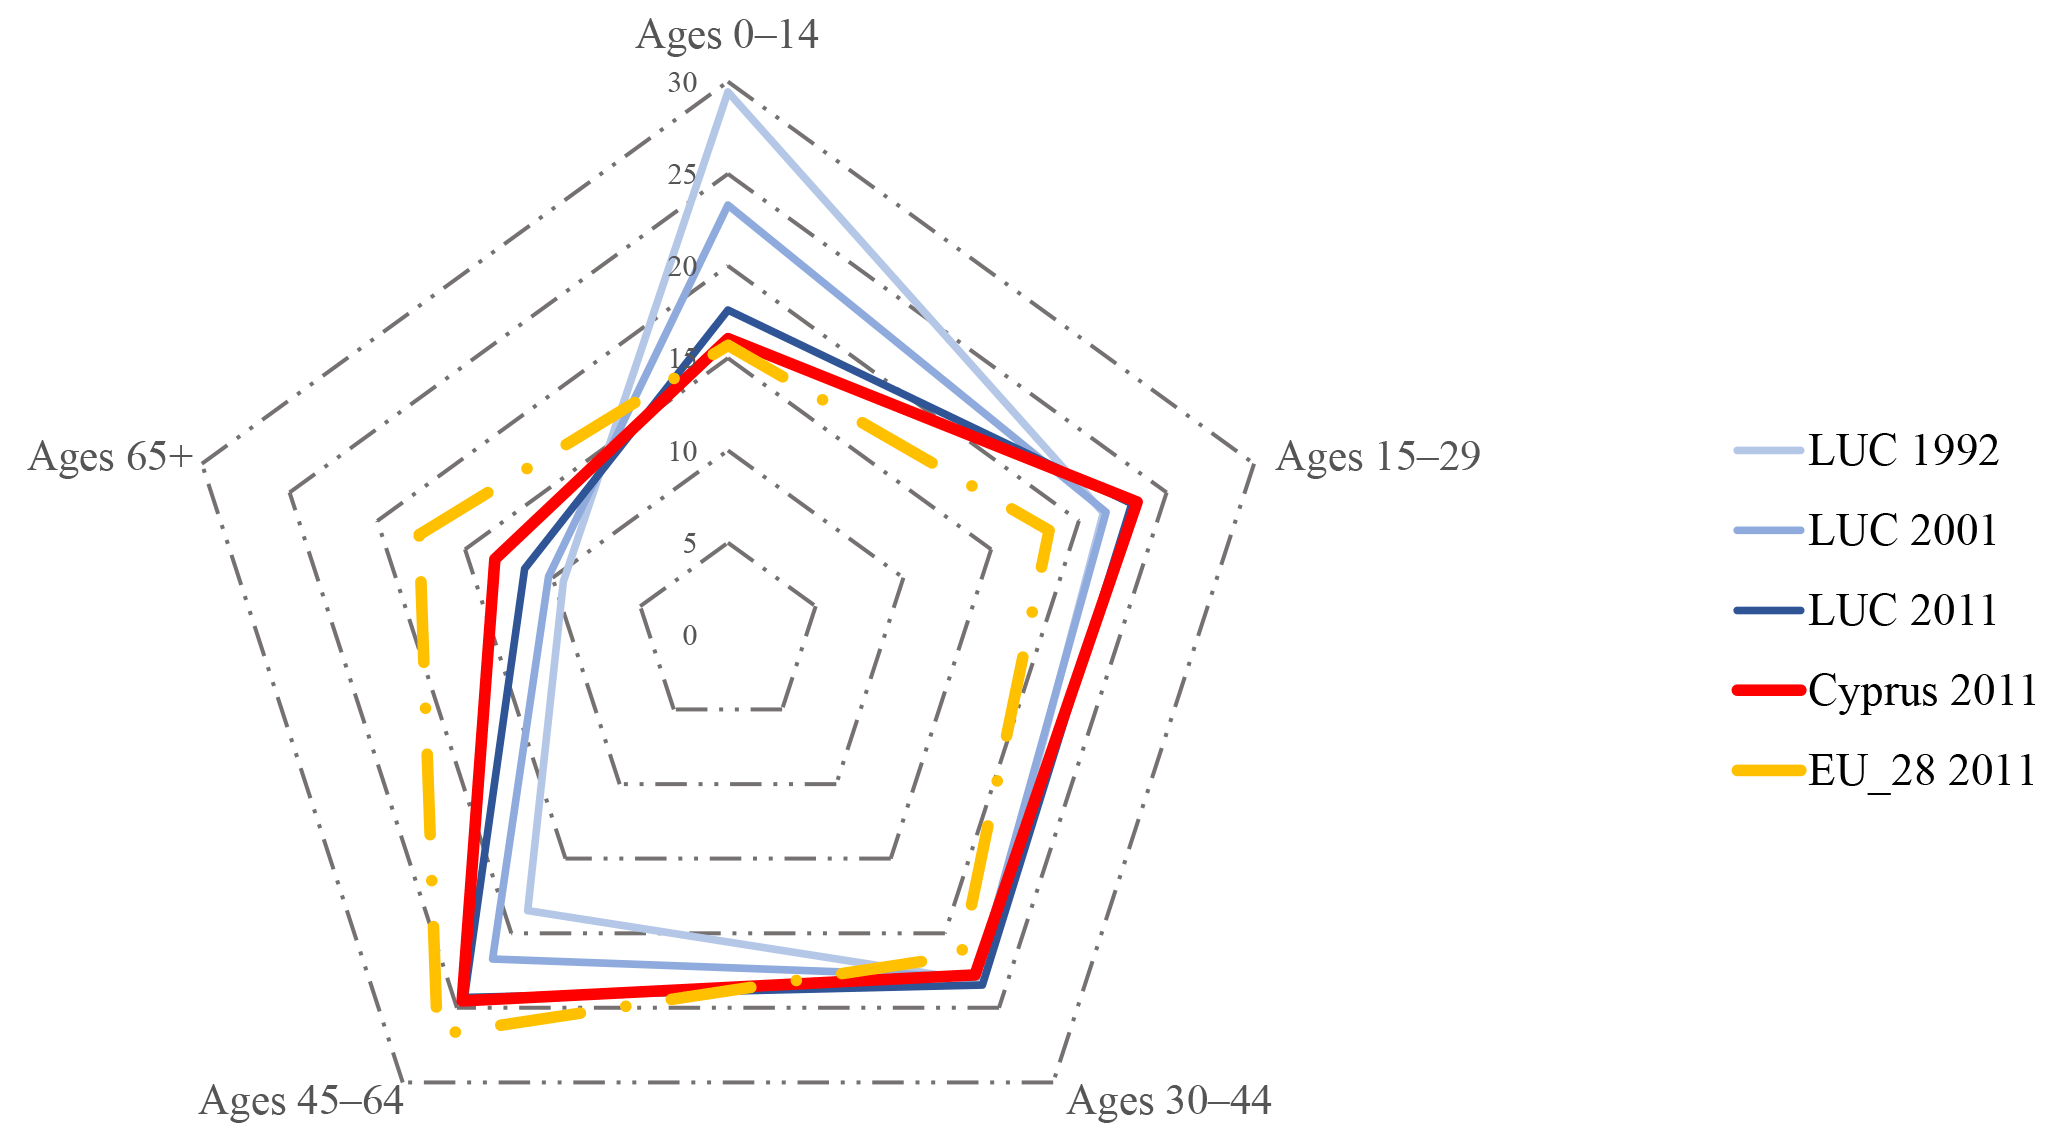

Apart from the continuing drop of fertility and the gradual ageing of the population, the age composition structure (Fig. 4) from 1976 to 2011 shows a fairly increase of the ages 30–44 and 45–64 that consist the active working period (from 17.9 and 17.6 % to 22.8 and 24.5 % respectively), reflecting the dynamic of the Cypriot population structure.
Concerning the study area, the population structure appears the same as the country average.

Figure 5Study area characteristics. (a) density; (b) new housing stock; (c) ages 0–14; (d) ages 65+; (e) ages 30–44; (f) ages 45–64; (g) no-native residents; (h) university education; (i) employed in creative industry. Source: CYSTAT, population census 2011, own contribution.
Disparities in the spatial distribution of younger and older residents are spatially mapped in Fig. 5c and d. It is worth to mention that the two maps are almost complementary. The younger residents tend to locate in the northern urban area with newly housing stock and lower residential densities, away from the city center. On the contrary, elderly residents tend to inhabit in more central urban areas, with older housing stock and high density. Respectively, the younger working ages (30–44) trend to locate in the northern, over the highway, and eastern city expansions and the middle-aged (45–64) working ages are located in the first perimeter of the city center (Fig. 5e and f). It is worth to notice that the university degree holders are mainly located in the northern outskirts of the city center as well as further east, along the coastal zone (Fig. 5h). Inhabitants employed in the creative industry (professional, scientific and technical activities, arts and entertainment, information and communication) are mainly located in the same northern outskirts of the city center and further west, in the newly developed areas of the city (Fig. 5i). By arranging Fig. 5d–f we can almost realize the urban development of the city during the last 40 years.
4.3 In-migration flows
Cyprus has experienced strong positive net migration flows mainly after its entrance to EU in 2004. A total of 46 553 foreign inhabitants, from 59 different countries, lived in the LUC in 2011. They represented about 19.77 % of the total population and almost 25.79 % of the economically active population. That was a significant increase, compared with 9.3 and 7.75 % respectively, ten years earlier.
The 58.17 % of the in-coming population originated from EU countries (Fig. 6), from which the 29.00 % are from newly entered EU countries (Romania 13.94 %, Bulgaria 8.74 % and Poland 2.46 %). The 29.17 % is coming from the rest EU countries with United Kingdom (12.83 %) and Greece (12.07 %) as the top countries of origin regarding further relationships and culture. Asia originated population represents the 25.78 % including immigrants from Philippines (5.44 %), Vietnam (5.42 %), Sri Lanka (3.72 %) and Syria (2.24 %), working as house assistants. Although the ethnic group from central and Eastern Europe is relatively low (14.70 %), is the most economically interesting for the Cypriot economy with people from Russia (8.93 %), Ukraine (2.08 %) and Georgia (1.12 %) Minor African groups represented 1.35 % including people from Egypt (0.92 %) and Nigeria (0.12 %).
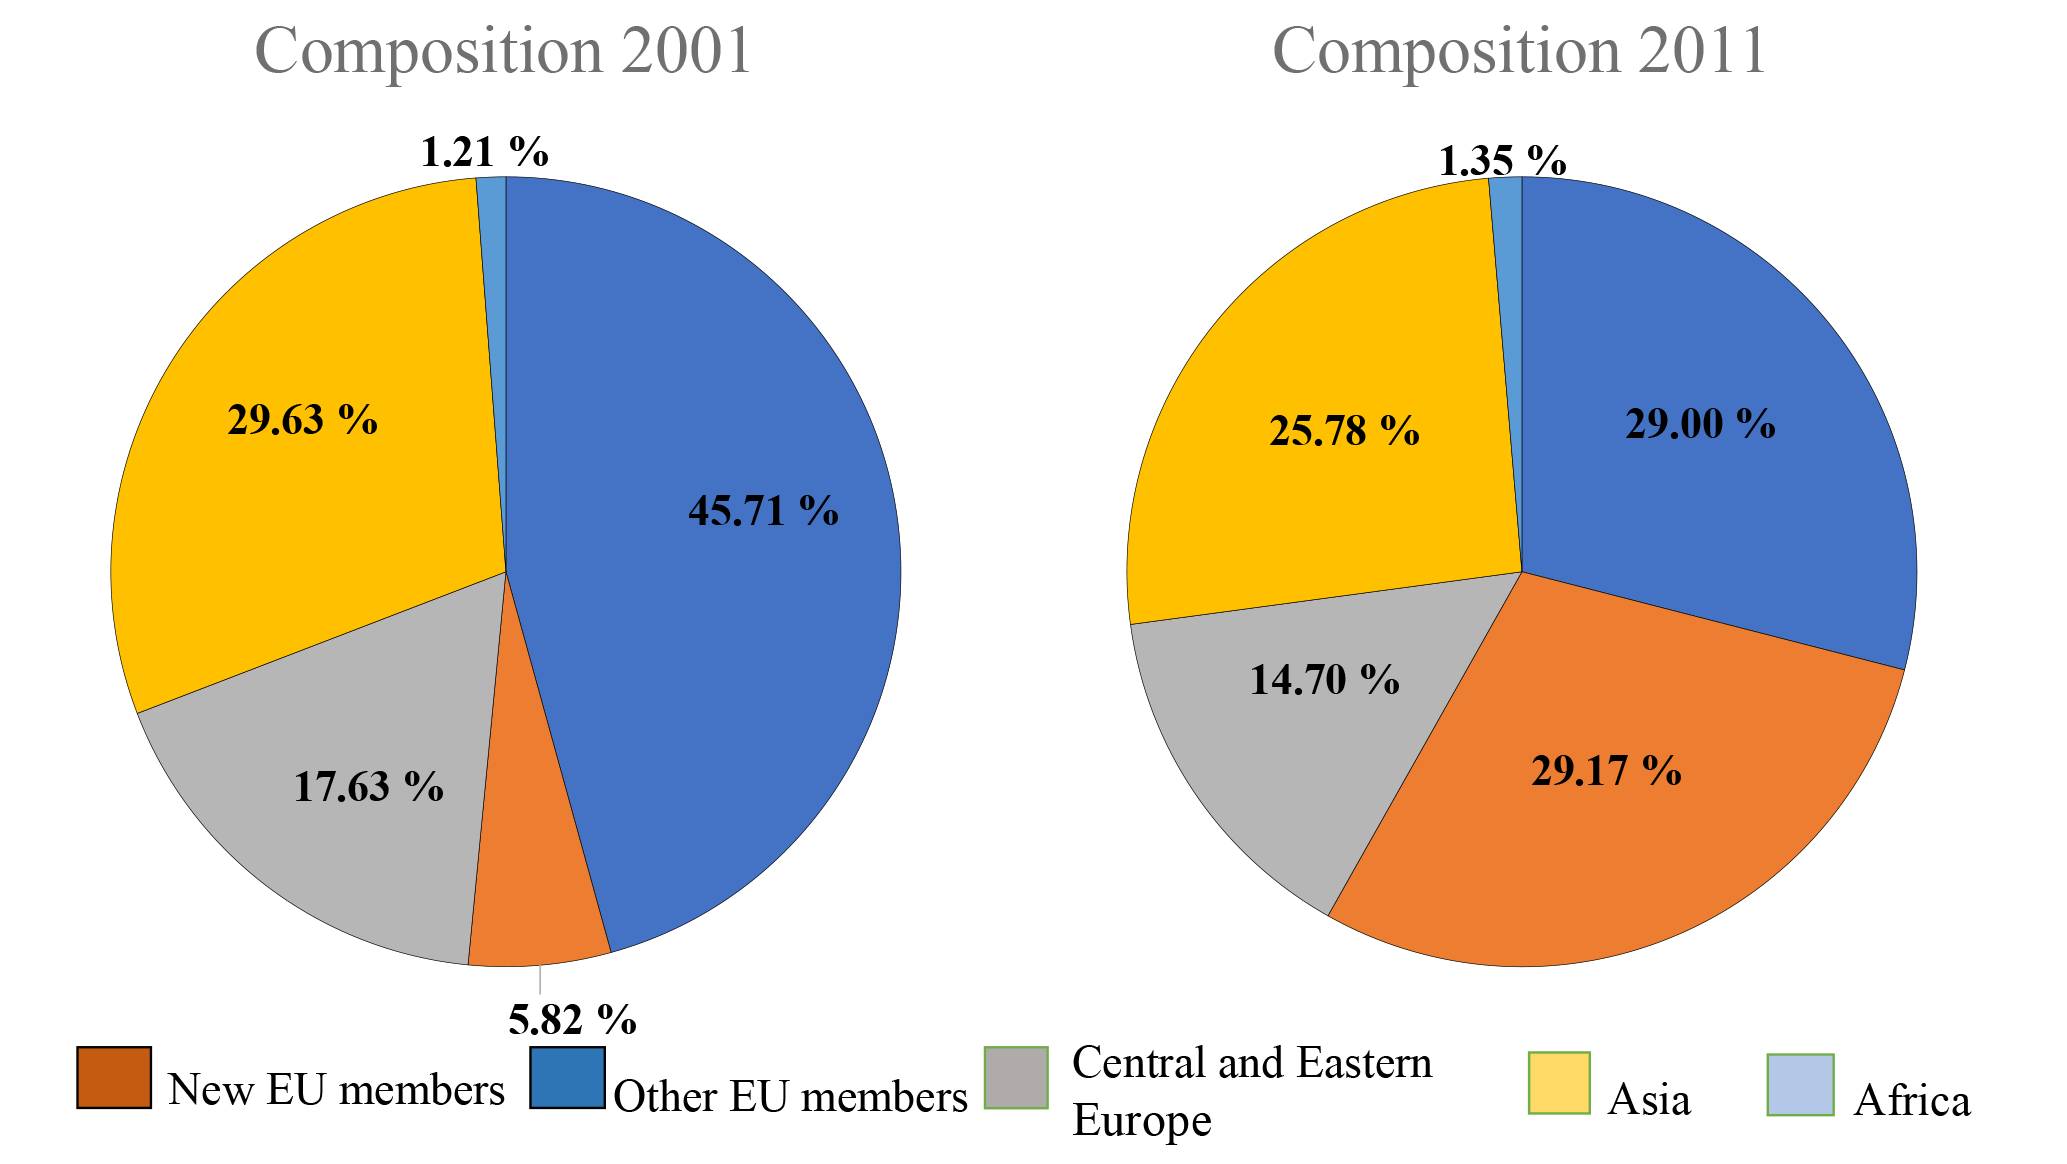
Figure 6Composition of the foreign population in study area by group of origin, 2001–2011. Source: 2011 Population Census, Cystat. Own contribution.
The main ages of immigrants are considerably the working, between 25–39 although there are some differences especially from United Kingdom and Russia who the main proportion belong to the economically inactive population over 65 ages (67.13 and 36.47 % respectively).
In the study area, the largest concentrations of no-native residents (Fig. 5g) appear less in northern new developments and in the most central areas. They are usually located in the eastern city expansions as well as in the coastal areas.
According to the above analysis, it appears that the study area can be divided in two sub-areas, which will be analyzed separately. The first sub-area (model 1) concerns the southern and central area, including the coastal zone, where the tourist zone is also located as well as the central areas around the historic city center. This sub-area has been developed stagelly with the radial spread of the city center and the spread to the east and coastal, where the largest hotel facilities were installed, after 1974. The second sub-area (model 2) includes the new residential developments, after 2000, to the north of the study area. The prevailing land use is residential και and due to the geomorphology of the area, there is an unobstructed view to the sea, making this area attractive enough to find a home.
In conclusion, low densities (urban sprawl), population ageing and in-migration challenges have a direct impact to urban environment in Cyprus. This paper aims to monitor dynamics of these challenges that took place in Limassol Urban Complex, south Cyprus, during the last decade, and evaluate its impact to transform cities in the human centered SC concept.
In order to analyze these challenges and define correlations with the human “smartness” of the city, a set of 25 variables were considered (7 variables concerning population structure and dynamics, 10 variables for built infrastructure and 8 for human smart characteristics) as presented in Table 2.
5.1 Data Source
Postal code areas were chosen as the elementary spatial unit in this study, as it is the minimum mapping unit of population census and allows reliable comparisons with indicators derived from official statistical data sources. A total of 126 postal codes were considered.
The data employed in this study include both statistical and spatial:
5.1.1 Statistical data in database tables
Data set from the most recent Population Census operated in 2011, obtained by the Cyprus Statistical Service (CYSTAT, 2011) including the following:
-
Demographic data: age structure, type of households, family nuclei, population by the country of birth.
-
Built infrastructure data: living quarters by occupancy status (usual and seasonal) by type of building (single house, apartment block) by year of construction, average dwelling size, population density.
-
Economic data: economically active population, employed and unemployed persons, employed in Creative Industry.
-
Educational attainment data: population enumerated with University education (first degree and Master or Doctorate degree).
Recent data (2016) from Cyta, the major telecommunication provider, for number of installation circuits, based in billing address:
-
Broad Band Telephony
-
Internet installations above 50 Mbt
Recent data (2016) from GreenDot, the only licensed recycling and management system in Cyprus, for household recycling program of PMD, paper and glass.
Data from the Ministry of Interiors, concerning voting rates for the most recent Municipal Elections (2016) and European Elections (2014).
5.1.2 Spatial data in .shp and .xsd formats
The geospatial data obtained from CYSTAT consists mainly of polygons in shape feature class with polygon geometry type in GCS_ WGS_1984 Geographic Coordinate System. They concern postal codes of the population census 2011.
All statistical data were included in the geospatial database with the postal code as the spatial reference level. Each one of the 136 postal code areas consist of a population ranging from 31 to 4405 residents, with Standard Deviation 1520.73.
5.2 Methodology
In the following sections, we empirically test the correlations between Limassol city challenges and indicators of smart cities human capital (residents and community). The scientific objective of this paper is to understand the behavior of the demographic structure and dynamics indices in relation to the built infrastructure challenges, and test whether these relations may group a statistically un-bias index for SC. The research question we wish to answer is whether and in what extent the SC human characteristics correlated with local urban challenges of Limassol city and in extent of medium-sized European city.
A total of 25 background indicators (Table 2) extracted from the available statistical data set classified into three (3) thematic domains (population structure and dynamics, 7 indicators; built infrastructure, 6; human smart characteristics, 5).
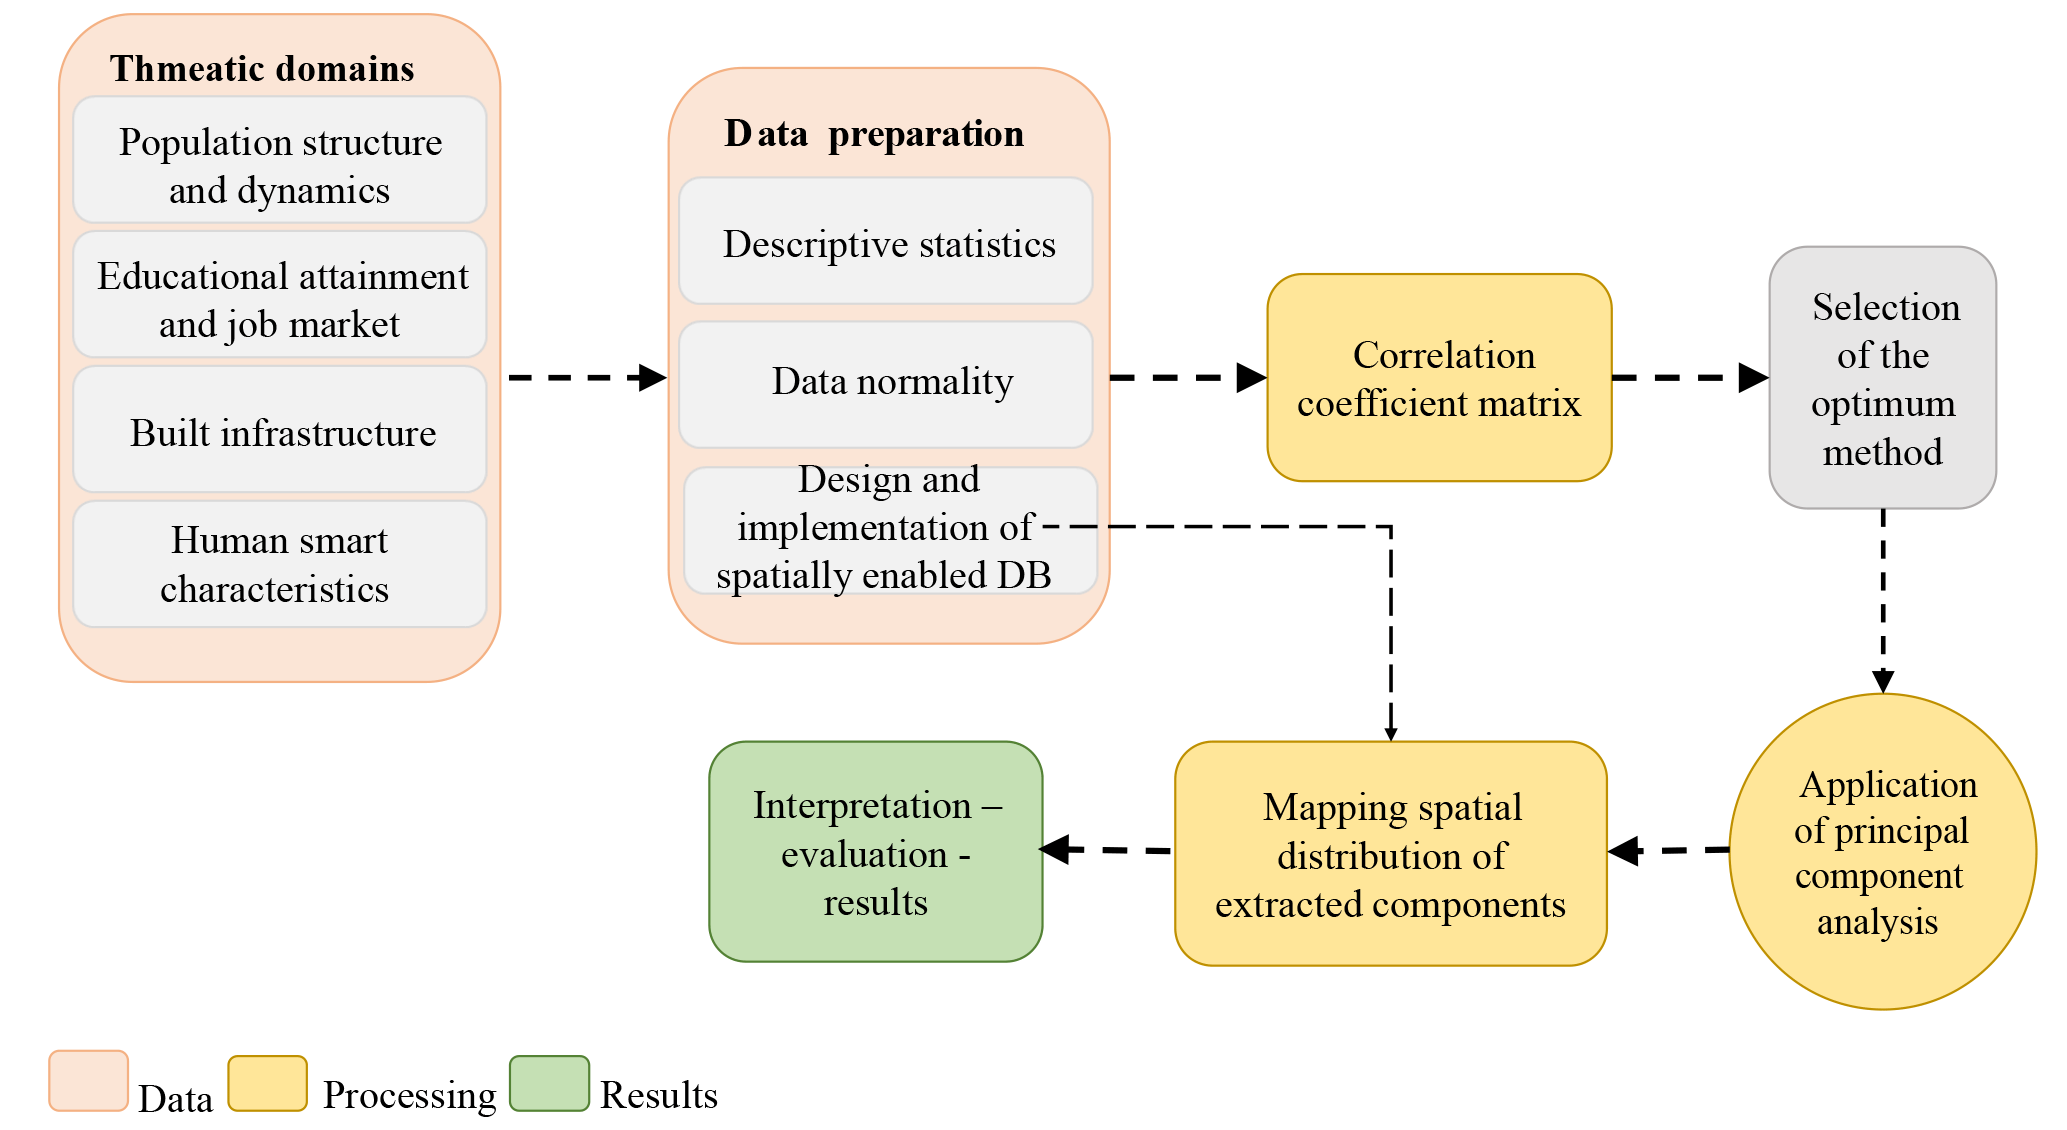
The methodology applied consists of seven (7) steps and described in Fig. 7.
Step 1 is with regard to data preparation. According to the descriptive statistics, the data are heterogeneous, due to the diversity of the different kinds of data. During the formation of the geo-database, statistical data like the recycling and voting figures entered the geo-database, after their conversion from the Municipality to the postal code (PC) level. Based on the descriptive statistics for each dataset, the final data structure was formulated.
Before proceeding to the statistical analysis, data were checked for their existing correlations presented in Pearson correlation coefficient matrix (step 2). Except correlation matrix, Kaiser-Meyer-Olkin Measure of Sampling Adequacy, Bartlett's Test of Sphericity, Measures of Sampling Adequacy (MSA) in Anti-Image Matrices and determinant measures were calculated, in order to ensure that the available data are appropriate for statistical analysis.
In step 3, the most appropriate statistical analysis is evaluated. To better understand and explain the urban development parameters, a wide range of data and variables is used in order to cover the full range of factors that cause the urban transformation of the study area. Consequently, it is necessary to properly process and analyze the variables to highlight the main components of urban transformation. The most appropriate methods for data optimization are the factor analysis methods. More specifically, Principal Component Analysis (PCA) was selected as a dimension-reduction tool that can be used to reduce a large set of variables to a small set that still contains most of the information in the large set. This choice is based on the fact that the theoretical background that determines, in advance the behavior of the selected variables, is not available (Tabachnik and Fidell, 1989). This is a specialized method of analyzing large amount of data, which is appropriate for the analysis of complicated issues, especially at the level of spatial and administrative units and when the pattern of behavior of the different variables is considered unpredictable. The aim of the study is therefore, based on the selected initial variables, to create new components that will reflect the demographic, social, economic and urban fabric of Limassol city.
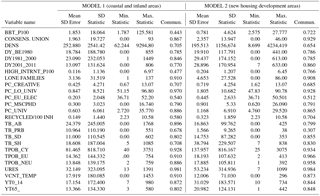
Table 3Descriptive statistics of the variables employed in the models.
Step 4 is regard with the application of the PCA. Following the control measures of correlation coefficients, the number of factors to be retained pointed to four (4), that accounts for about 78.5–80.3 % of the total variance. The communalities of the variables are close to 1.00 meaning that all the variables take part in the analysis. The Varimax rotation extraction method is used supposed that the extracted factors are uncorrelated. Thus, the analysis results are better explained. The factor loadings in the rotated component matrix explain the components in a significant way.
Mapping the spatial distribution of the extracted components of PCA, follow a spatially enabled analysis using Geographical Information System (step 5). This mapping is taking in account factors that express the demographic structure and dynamics of the residents of the study area, as well as factors that determine the urban infrastructure in correlation with the human smart characteristics of the study area.
Finally, in step 6, the overall results concerning statistical and spatial analysis are evaluated. The conclusions of the study demonstrate the differentiation of human smart characteristics depending on the social and spatial characteristics of the study area.
6.1 Data preparation
Given that data was gathered from a variety of different sources, a procedure was implemented to achieve data normality of the different variables (Kolmogorov–Smirnov Test), so that they can provide reliable results in statistical analysis. One of the main constraints was the different spatial reference level of the gathered data. For example, the data sets concerning recycling and voting rates were based on the municipal spatial unit and the rest of data sets were based on the postal code spatial unit. During data preparation, the recycling and voting variables were projected, as percentages, on the research standard postal code level, to achieve a minimum level of data normality. In addition, socio-demographic data was available in physical numbers, however this data is much more appealing when it is analyzed in percentages, for example instead of dealing with a number 300 people coming from countries outside EU in an area, you get a much more meaningful 20 %, if the total population is 1500 people.
Descriptive statistics (Table 3) maps the 25 variables in total and scatter plots were prepared with the aim to investigate the relationship between the above demographic, built infrastructure and human smart characteristics at the spatial scale of city postal codes.
6.2 Multivariate analysis
Before the application of principal component analysis (PCA), Pearson correlation coefficient matrix illustrated the strong correlations between each pair of the twenty-five (25) selected variables.
Where: r = Pearson r correlation coefficient
N = number of observations
∑xy = sum of the products of paired scores
∑x = sum of x scores
∑y = sum of y scores
∑x2 = sum of squared x scores
∑y2 = sum of squared y scores.
Principal Component Analysis (PCA) is a multivariate statistical technique used to reduce the number of variables in a data set into a smaller number of “dimensions”. In mathematical terms, from an initial set of n correlated variables, PCA creates uncorrelated indices or components, where each component is a linear weighted combination of the initial variables (Vyas and Kumarayake, 2006).
The above analysis of study area data shows the differentiation and categorization of the area into two main sub-categories, which they will process individually in PCA. The first sub-category (model 1) comprises mainly from central areas developed before 2001, as well as coastal areas with high concentration of non-permanent residence (mainly for tourism purpose). We notice high population densities and concentrations of non-native inhabitants (EU and no-EU), older age groups (65+) with lower educational attainment.
The second sub-category (model 2) includes mainly northern city expansions over the highway mainly developed after 2001. We notice low population densities as well as high concentration of native residents belonging to younger age groups, with high educational attainment.
A Principal Component Analysis (PCA) was run separately for each squad area (model 1 and model 2) on the data matrix composed by the 8 human smart characteristic indicators and 17 indicators (7 for population structure and dynamics and 10 for built infrastructure) based on the 126 registered postal codes in total (Table 2). The aim of this analysis is to explore spatial variability in the data matrix and identify interrelations associated with (a) social–spatial disparities and (b) smart human determinants. Relevant components were selected according to the eigenvalue extracted by the PCA based on a correlation matrix. The varimax rotation method list wise was applied. Due to low number of cases (N=93 for model 1 and N=33 for model 2) the determinant extracted from the correlation matrix is nearly 0. Components with absolute eigenvalue > 2 were extracted and analyzed as imposed by the scree plots (Fig. 8). The Kaiser–Meyer–Olkin (KMO) test, which determines whether the partial correlations between variables are moderate and expectable due to different data source. Bartlett's Test of Sphericity, which assesses whether the correlation matrix is an identity matrix, were taken as measures of sampling adequacy and used to evaluate the quality of PCA outputs. Significant to 0.00 indicated the factorability of data set. (Table 4). Component loadings were used to profile the local context in the two model (squad) areas. Component scores were mapped with the aim to identify human smart characteristic associated to sprawl and socio-spatial disparities.
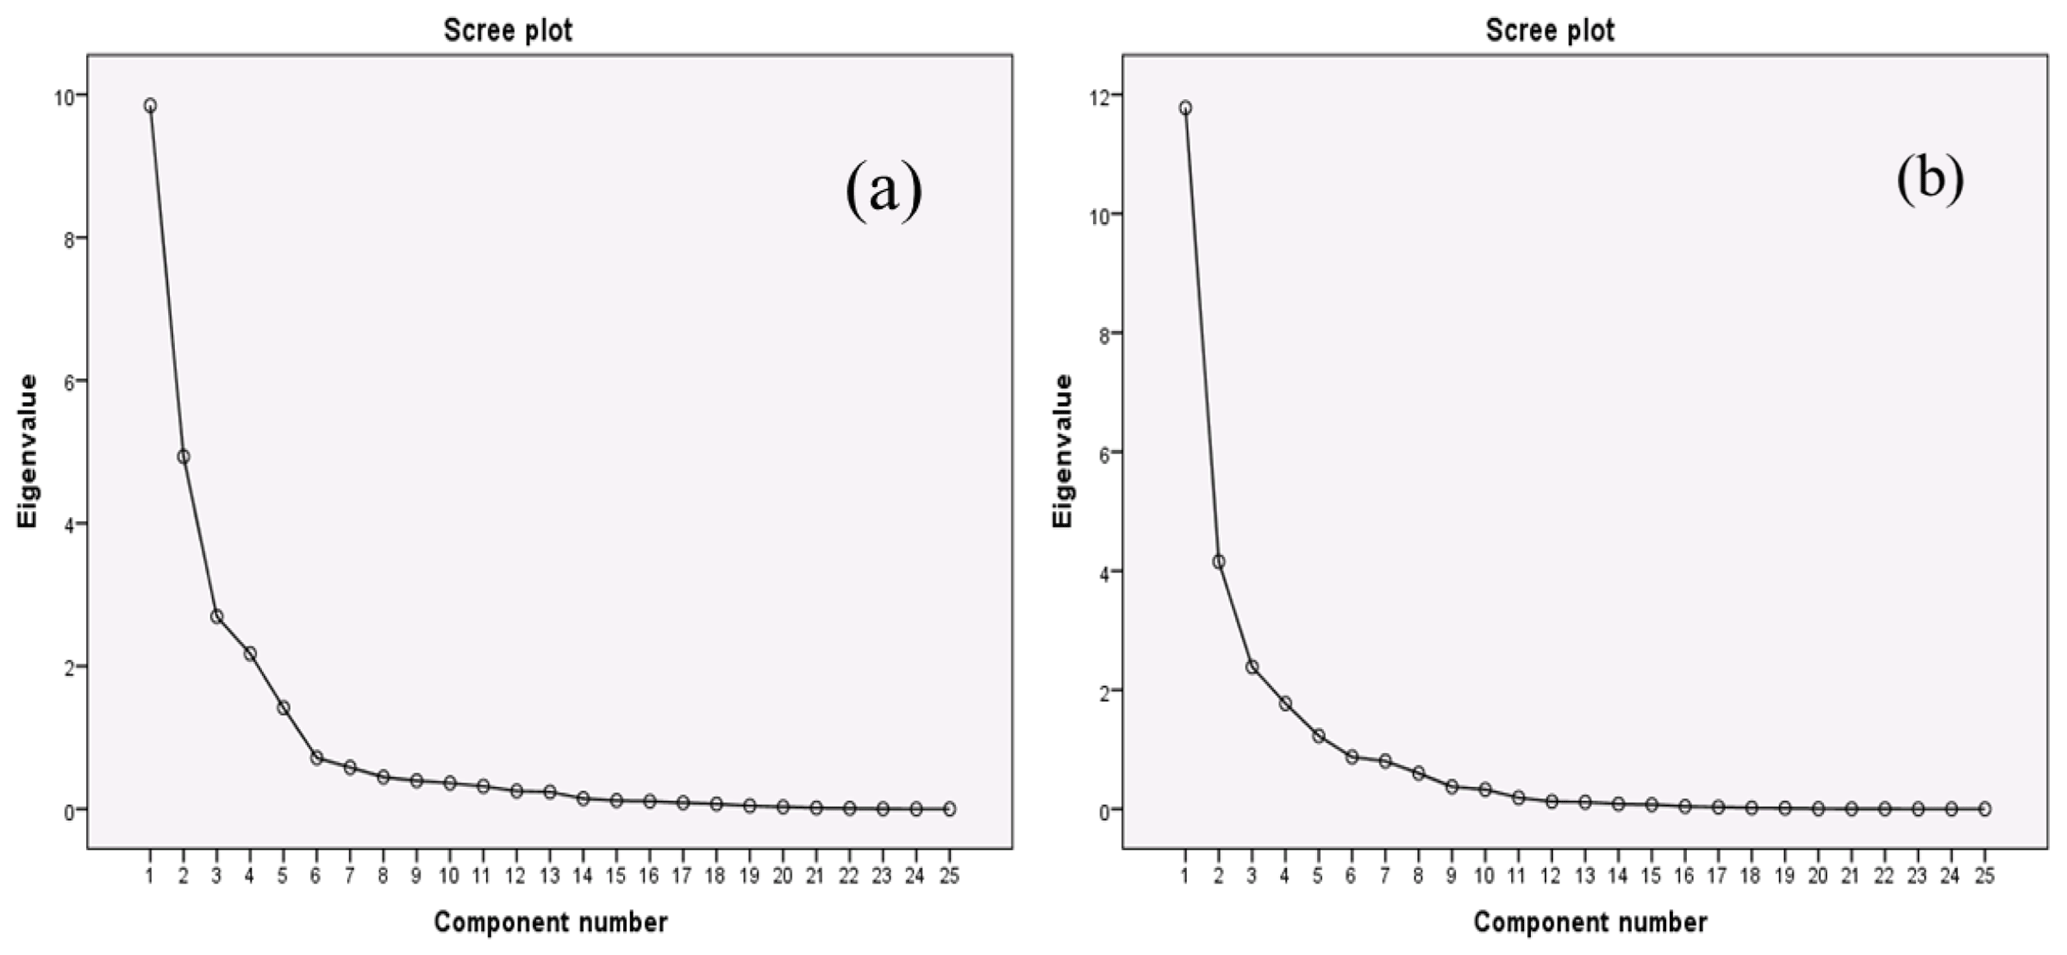
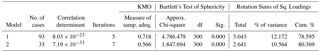
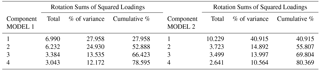
PCA extracted 4 axes explaining respectively 78.5 and 80.3 % of the total variance in Model 1 and Model 2 (Table 5).
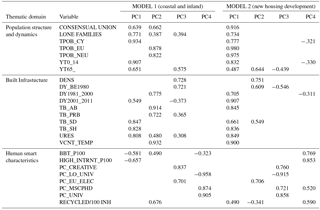
Loadings showed differences in the distribution of the selected components among the two models (Table 6).
Based on the above considerations, model 1 (coastal and inland area) consists of the following components, including their spatial representation:
Component 1 in coastal and inland areas (27.9 %) was strongly associated with native residents (0.934) and young (0.907) as well as over 65 ages (0.651). A strong association with lone families (0.771) and consensual union (0.639) is also noticed. They used to live in dwellings with permanent residence (0.808) in semi-detached (0.847) or single houses (0.828) mostly newly constructed (0.549). An expected negative association with smart human characteristics is displayed for both broadband telephony (−0.581) and high-speed internet (−0.657), even though there is full coverage of both services across the study area (Fig. 9a).
Component 2 (24.9 %) was positively associated with non-native residents (EU, non-EU) who live in temporary used residences (0.932) in apartment blocks (0.914) with commercial use (0.722) and in medium aged housing stock (0.755). A strong association with consensual union (0.662) is also noticed. In contrast, with Component 1, a positive association with human smart characteristics is displayed for both recycling (0.676) and Broad Band Telephony (BBT) (0.490) (Fig. 9b).
Component 3 (13.5 %) distinguished central urban areas with high density (0.728), old aged housing stock (0.721) and older population ages (0.575). However, strongly associated with human smart characteristics, like creativity (residents working in creative industry) (0.837) and open-mindedness (participation in EU elections) (0.701) (Fig. 9c).
Finally, Component 4 (12.17 %) scores identified a central-eastern oriented spatial distribution of urban areas with well-educated residents (University degree and Master or PhD qualification, 0.874 and 0.905 respectively) having a marginally negative correlation with the use of BBT (−0.323) (Fig. 9d).
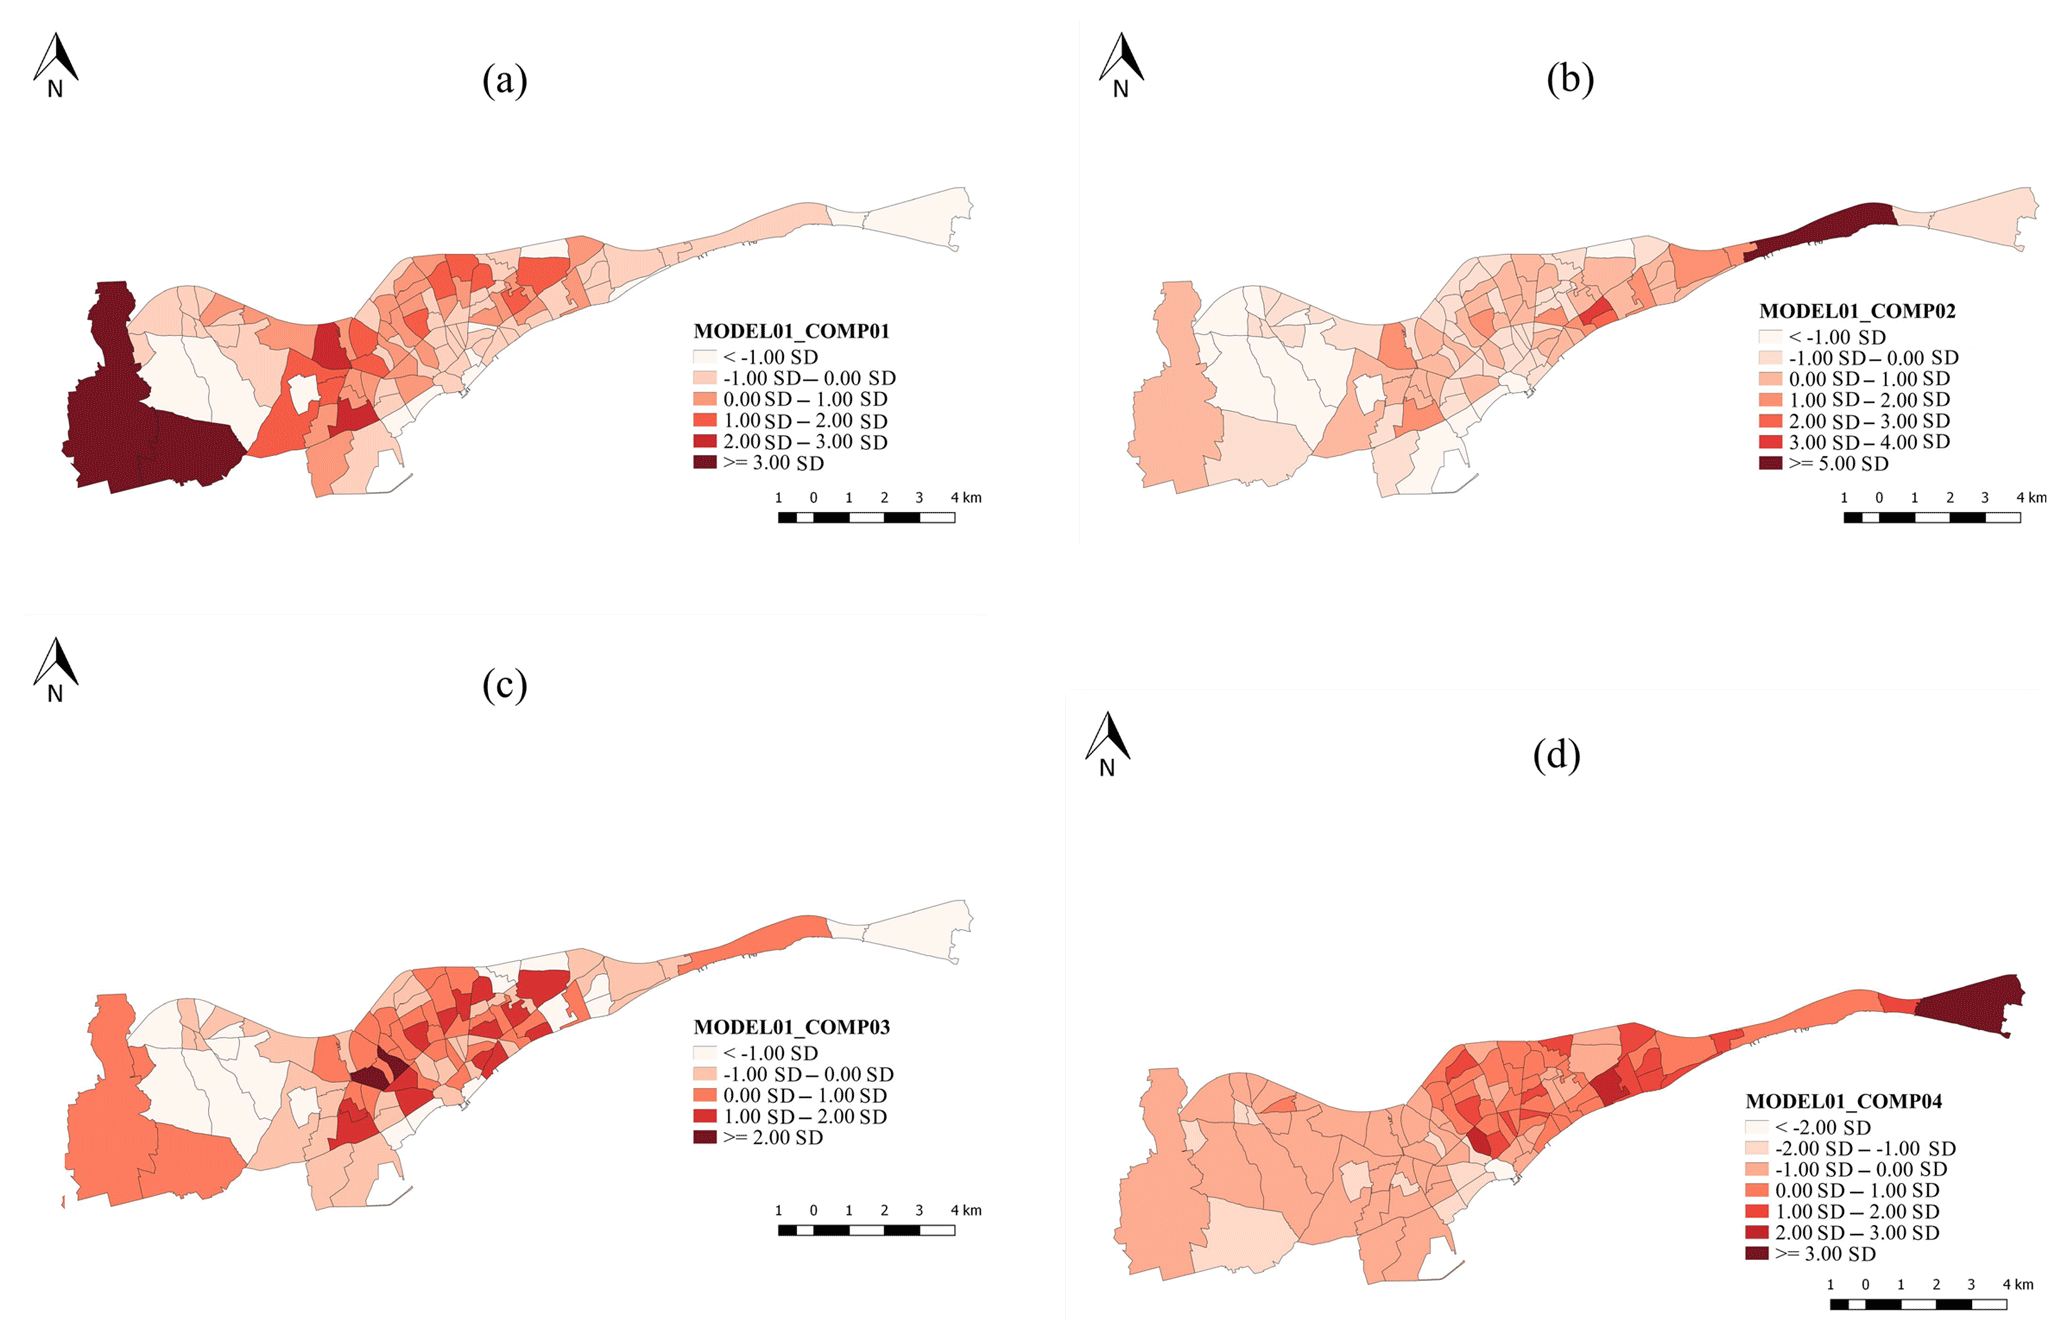
Figure 9Spatial distribution of Model 1 (coastal and inland area) Components. (a) Component 1; (b) Component 2; (c) Component 3; (d) Component 4.
In parallel, Model 2 (new housing development) consists of the following components, including their spatial representation:
Component 1 in newly developed urbanized areas (over the highway) (40.9 %) was associated with a mixture of native and non-native residents with young ages (0.832). A strong association with lone families (0.734) and consensual union (0.916) is also noticed. The age of housing stock is relatively low (0.907 for newly build and 0.705 for medium aged) and the building type is apartment blocks (0.845) and single house (0.836).
Component 2 (14.8 %) was positively associated with density (0.751), relatively high association with over-65 ages (0.644) and citizens' open-mindedness (participation in EU elections 0.706). The housing stock is rather old (0.609) and the building type is mostly semi-detached (0.549). This component demonstrates almost similar behavior with Component 3 in Model 1.
Component 3 (13.9 %) was associated with most educated citizens (University degree, Master and PhD, 0.721 and 0.858 respectively) that are employed in the creative industry (0.760).
Finally, component 4 (10.5 %) seems almost complementary to component 3, shows a central distribution, strongly associated with human smart characteristics (high internet, BBT and recycling, (0.853, 0.769 and 0.590, respectively). The association with natives (−0.321) and young ages (−0.330) is mostly negative.

Figure 10Spatial distribution of Model 2 (new housing development area) Components. (a) Component 1; (b) Component 2; (c) Component 3; (d) Component 4.
The analysis, based on a wide set of statistical indicators, has evidenced the interplay between social diversity, built environment attributes and the human smart characteristics at the local scale. The results of the proposed methodology sheds light on the heterogeneity of relationships between urban forms and socioeconomic functions identifying relevant smart drivers of metropolitan change.
The Limassol Urban Complex as case study offers diverging overviews of the form-function relationship linking social segregation and urban sprawl patterns, in partial contrast with a (supposedly) unique human “smart city” concept.
While human SC characteristics are relatively common in southern Europe, their spatial distribution represents well a distinct social geography in the LUC. Differences in the sprawl patterns observed in more densely urban and newly urbanized areas emerge in the joint analysis of the human smart characteristics, built environment attributes and the underlying socio-demographic context.
A prerequisite for the development of a SC strategy is the empowerment of its citizens in the fields that form the human smart characteristics. These are also the strategic directions for the policy makers (local authorities and Planning Department of Urban Planning) to the concept of a SC with an anthropocentric character, of the city that “listens” to the needs of its inhabitants and acts strategically to cover those needs.
Principal component analysis indicated that the spatial distribution of human smart characteristics is associated with divergent socioeconomic and territorial factors in the two sub-areas. This result outlines the role of disparities between high-density and low-density neighborhoods and areas that accommodates native and no native residents. The resulting patterns represent different urban models belying the supposed homogeneity of the SC concept.
According to the above point of view, the study area presents several variations in the approach of social, demographic and town planning factors that affect its sustainable development. The residents of the two sub areas of this study have a marked variation in the composition of social fabric and the development of the urban environment. The main challenges of the typical Cypriot city (urban sprawl, aging population and migration) are noticeably different in those two sub areas, with similar effects to the behavior of the human-centered factors of the SC.
7.1 Coastal and inland urban areas
These areas cover the city center as well as its immediate expansions, where mainly commercial uses of not only local importance are located, as well as office land uses. It also includes the coastal areas of the eastern suburbs, where the largest tourist facilities of the island are located, mainly after 1974. The main characteristic of these areas is the high population density, resulting in the deterioration of the urban environment and the lack of green spaces. The predominant building type of housing is apartment blocks and semi-detached houses. From the analysis of the 2011 census data, it appears that there is a clear spatial separation of the inhabitants into indigenous (born in Cyprus) and non-native inhabitants (born in EU or outside EU). This separation also determines, to a large extent, the correlations of demographic dynamics and built infrastructure variables with the human smart characteristics variables.
The marginally central and eastern areas with high concentration of both non-native and highly educated inhabitants, who tend to accommodate in apartment blocks, react positively and set the stage for SC strategy development (positive correlations to BBT and recycling). On the other hand, areas with concentration of indigenous inhabitants new ages (0–14) as well as elderly (over 65 s), show strongly negative correlations with technology oriented human smart characteristics (like the use of BBT and high internet). The establishment of “creative” people (those employed in the creative economy - professional, scientific and technical activities, arts and entertainment, information and communication), which according to international literature is an important prerequisite for the development of SC strategies, shows strong concentration at the city's central area where population density is high, and the housing stock is rather old. They also associated with high open-minded profile, recording high correlation with EU- elections participation.
7.2 Newly developed urban areas
These areas are located to the north of the study area and are neighboring to sub-urbanized and rural areas, with sloping ground terrain with unlimited view over the sea. They have been developed since 2000 and are mainly residential areas with only local importance commercial land uses and transportation is many based on the use of private car. The main characteristic of these areas is the relatively low population density and the urban sprawl.
The predominant building type of housing is apartment blocks and single houses. The combination of all those factors, highlight these areas as areas with high demand for housing, where family nuclei are settled with children or consensual union couples with usually high education. In addition, there are variations in human smart characteristics. Creative people are mainly located in high density areas with low concentration of elderly residents, many of them having high education and holding a university degree. It is expected that, these central-northern areas record the higher rates of adoption for smart characteristics. On the other hand, resident's open-mindedness (EU elections participation) is rather spread, observed in areas closer to the city center (central northern areas) as well as towards the eastern and the western edges of the study area where the concentration of elderly residents is also higher.
The research findings help to understand the process of smart city transformation by studying the key behavioural factors of which influence the pace and strength of technology and “smart” applications acceptance. The key factors identified can provide a deep understanding of citizens behaviour towards the adoption of smart city services, in other words define the “early adopters” and the “followers”.
Understanding the spatial distribution of human smart characteristics allows identifying specific patterns of dispersed urbanization and social diversification at the local scale. Municipalities represent a reliable elementary unit for such kind of analysis. However, further research is needed so that we can further explore the factors that differentiate but also determine the sitting of the anthropometric features of SCs in relation to the challenges facing the Mediterranean medium-sized cities, aiming to find new impetus for urban development and efficient use of internal resources (Borsekova et al., 2018).
There is a need for longitudinal studies to investigate this obtained association further and to determinate potential causality between different aspects in the urban environment agenda for European cities. This includes the challenges of European cities with aging population, economic crisis, unemployment, changes in the composition of the nuclei family (reduction in household size, single parent families) as well as migration. In addition to analytical research on these issues, research in planning is also needed to discuss and evaluate possible interventions and planning policies. The new technologies and their smart applications as the tools currently available for planners and policy makers in adopting a new urban strategy; and the need to reassess and render them “smarter” and thus more efficient and effective in the effort to plan, implement, manage and monitor sustainable urban growth.
This study as multidimensional approach covers a variety of resident's characteristics as well as of built infrastructure. The goal is to develop a multi-factorial spatial analysis system that will be a useful tool for the decision makers (Local Government Organizations and others) about how to “transform” the local community in the “human-centric smart city”.
The strength of this study includes the nature of data, relating to a homogeneous population with common historical, cultural and economic characteristics and is mainly based on population census data, which is universally recorded and not random.
There is a possibility that we have not included other important confounders (e.g. apartment prices, rents and land prices).
In the above-mentioned context, the next step of the research involves analyzing the above factors including real estate data (apartment prices and land prices) and their application in the urban areas of Nicosia and Larnaca. Thus, we will be able to work towards the creation of an adapted “model” of urban transformation of the Cypriot and, in general, southern European medium-sized cities to “human-centric smart cities” focusing on the real needs of their residents.
In Europe 2020 agenda lies, among others, the concept of Smart Cities and Communities (SCC) (EC, 2012) that is recently evolving because of the radical technological advances and their applications; and constitutes a new force for effectively managing urban functions in a highly information-intensive era. Promoting smartness seems nowadays to be an effective and favorable, to many cities, strategy for steering economic competitiveness, environmental sustainability, quality of life (Lövehagen and Bondesson, 2013; Stratigea et al., 2017); and mitigating the impacts of urbanization and demographic trends.
Data are available via Cyprus Statistical Office (http://www.cystat.gov.cy/mof/cystat/statistics.nsf/populationcondition_22main_en/populationcondition_22main_en?OpenForm&sub=2&sel=2, last access: 22 May 2018).
This paper represents a result of collegial teamwork. The authors designed the research jointly. The first two authors conducted the literature review and prepared the first draft of the manuscript. The last author finalised the manuscript. All authors read and approved the final manuscript.
The authors declare that they have no conflict of interest.
This article is part of the special issue “European Geosciences Union General Assembly 2018, EGU Division Energy, Resources & Environment (ERE)”. It is a result of the EGU General Assembly 2018, Vienna, Austria, 8–13 April 2018.
This research did not receive any specific grant from funding agencies in the
public, commercial, or not-for-profit sectors. Edited
by: Silas Michaelides
Reviewed by: two anonymous referees
Angelidou, M.: A conjuncture of four forces, Cities, 47, 95–106, https://doi.org/10.1016/j.cities.2015.05.004, 2015.
Bakici, T., Almirall, E., and Wareham, J.: A smart city initiative: The case of Barcelona, J. Knowl. Econ., 4, 135–148, https://doi.org/10.1007/s13132-012-0084-9, 2013.
Ben Letaifa, S.: How to strategize smart cities: Revealing the SMART model, J. Business Res., 68, 1414–1419, https://doi.org/10.1016/j.jbusres.2015.01.024, 2015.
Berry, C. R. and Glaeser, E. L.: The divergence of human capital levels across cities, Pap. Reg. Sci., 84, 407–444, https://doi.org/10.1111/j.1435-5957.2005.00047.x, 2005.
Borsekova, K., Korony, S., Vanova, A., and Vitalisova, K.: Functionality between the size and indicators of smart cities: A research challenge with policy implications, Cities, 78, 17–26, https://doi.org/10.1016/j.cities.2018.03.010, 2018.
Canton, J.: The extreme future of megacities, Significance, 2011, 53–56, https://doi.org/10.1111/j.1740-9713.2011.00485.x, 2011.
Caragliu, A. and Del Bo, C.: Smartness and European urban performance: assessing the local impacts of smart urban attributes, Inn. Eur. J. Soc. Sci. Res., 25, 97–113, https://doi.org/10.1080/13511610.2012.660323, 2012.
Caragliu, A., Del Bo, C., and Nijkamp, P.: Smart cities in Europe, J. Urban Technol., 18, 65–72, https://doi.org/10.1080/10630732.2011.601117, 2011.
Carli, R., Dotolia, M., Pellegrinob, R., and Ranieric, L.: Measuring and Managing the Smartness of Cities: A Framework for Classifying Performance Indicators, IEEE International Conference on Systems, Man, and Cybernetics, 13–16 October 2013, Manchaster UK, 1288–1293, 2013.
Castelnovo, W., Misuraca, G., and Savoldelli, A.: Smart cities governance: The need for a holistic approach to assessing urban participatory policy making, Soc. Sci. Comp. Rev., 34, 724–739, https://doi.org/10.1177/0894439315611103, 2015.
Chourabi, H., Nam, T., Walker, S., Gil-Garcia, J. R., Mellouli, S., Nahon, K., and Scholl, H. J.: Understanding smart cities: An integrative framework, 45th Hawaii International Conference on System Sciences, 4–7 January 2012, Maui, Hawaii, 2289–2297, https://doi.org/10.1109/HICSS.2012.615, 2012.
Constantinides, G.: Sub-regional study: Malta and Cyprus, paper prepared for the Mediterranean Meeting on Urban Management and Sustainable Development, Mediterranean Commission on Sustainable Development, available at: http://www.planbleu.org/pdf/villes_mlt-cyp.pdf (available at: 24 April 2018), 2001.
Cyprus Statistical Service – CYSTAT, Population censuses 2001, available at: http://www.cystat.gov.cy/mof/cystat/statistics.nsf/populationcondition_22main_en/populationcondition_22main_en?OpenForm&sub=2&sel=2 (last access: 22 May 2018), 2011.
Cyprus Statistical Service – CYSTAT, Demographic Report 2016, series II, report no. 53, Printing Office of the Republic of Cyprus, p. 27, 2017.
Dameri, R. P.: Searching for Smart City definition: A comprehensive proposal, Int. J. Comp. Technol., 11, 2544–2551, 2013.
Esmaeilpoorarabi, N., Yigitcanlar, T., and Guaralda, M.: Towards an urban quality framework: Determining critical measures for different geographical scales to attract and retain talent in cities, Int. J. Knowl. Dev., 7, 290–312, https://doi.org/10.1504/IJKBD.2016.078556, 2016.
Giffinger, R., Fertner, C., Kramar, Kalasek, R., Pichler-Milanović, N., and Meijers, E.: Ranking of European medium-sized cities, Vienna University of Technology: Centre of Regional Science, available at: http://www.smartcity-ranking.eu/download/city_ranking_final.pdf (last access: 22 May 2018), 2007.
Hollands, R. G.: Will the real Smart City please stand up? Intelligent, progressive or entrepreneurial? City, 12, 303–320, https://doi.org/10.1080/13604810802479126, 2008.
Hortz, T.: The Smart State test: a critical review of the Smart State Strategy 2005–2015's Knowledge-Based Urban Development, Int. J. Knowl. Dev., 7, 75–101, https://doi.org/10.1504/IJKBD.2016.075434, 2016.
Jong, M., Joss, S., Schraven, D., Zhan, C., and Weijnen, M.: Sustainable smart resilient low carbon eco-knowledge cities; making sense of a multitude of concepts promoting sustainable urbanization, J. Clean. Prod., 109, 25–38, https://doi.org/10.1016/j.jclepro.2015.02.004, 2015.
Kourtit, K., Nijkamp, P., and Arribas, D.: Smart cities in perspective – a comparative European study by means of self-organizing maps, Eur. J. Soc. Sci. Res., 25, 229–246, https://doi.org/10.1080/13511610.2012.660330, 2012.
Kourtit, K., Macharis, C., and Nijkamp, P.: A multi-actor multi-criteria analysis of the performance of global cities, Appl. Geogr., 49, 24–36, https://doi.org/10.1016/j.apgeog.2013.09.006, 2014.
Lara, A. P., Moreira Da Costa, E., Furlani, T. Z., and Yigitcanlar, T.: Smartness that matters: towards a comprehensive and human-centred characterization of smart cities, J. Open Innov., 2, 1–13, https://doi.org/10.1186/s40852-016-0034-z, 2016.
Lazaroiu, G. C. and Roscia, M.: Definition methodology for the smart cities model, Energy, 47, 326–332, https://doi.org/10.1016/j.energy.2012.09.028, 2012.
Leydesdorff, L. and Deakin, M.: The triple helix model and the meta-stabilization of urban technologies in smart cities, Phys. Soc., available at: http://arxiv.org/abs/1003.3344 (last access: 2 May 2018), 2010.
Lombardi, P., Giordano, S., Caragliu, A., Del Bo, C., Deakin, M., Nijkamp, P., and Farouh, H.: An advanced triple-helix network model for smart cities performance, Green Ecol. Technol. Urban Plan., 45, 59–73, https://doi.org/10.4018/978-1-61350-453-6.ch004, 2011.
Lövehagen, N. and Bondesson, A.: Evaluating sustainability of using ICT solutions in smart cities – methodology requirements, Paper presented at 1st International Conference on Information and Communication Technologies for Sustainability, August 2008, Zurich, 2013.
Nam, T. and Pardo, T. A.: Smart City as urban innovation: Focusing on management, policy, and context, available at: https://www.ctg.albany.edu/publications/journals/icegov_2011_smartcity/icegov_2011_smartcity.pdf (last access: 24 April 2018), 2011.
Neirotti, P., De Marco, A., Cagliano, A. C., Mangano, G., and Scorrano, F.: Current trends in Smart City initiatives: Some stylised facts, Cities, 38, 25–36, https://doi.org/10.1016/j.cities.2013.12.010, 2014.
Nicolaou, A., Parmaxi, A., Papadima-Sophocleous, S., and Boglou, D.: Language education in a multilingual city: The case of Limassol, London Rev. Educ., 14, 174–185, https://doi.org/10.18546/LRE.14.2.12, 2016.
Shapiro, J. M.: Smart cities: Quality of life, productivity, and the growth effects of human capital, Rev. Econ. Stat., 88, 324–335, https://doi.org/10.1162/rest.88.2.324, 2006.
Stratigea, A., Kyriakides. E., and Nicolaides, C. (Eds.): Smart Cities in the Mediterranean. Coping with Sustainability Objectives in Small and Medium-sized Cities and Island Communities, 3–29, https://doi.org/10.1007/978-3-319-54558-5, Springer, 2017.
Toppeta, D.: The Smart City Vision: How Innovation and ICT Can Build Smart, “Livable, Sustainable Cities, The Innovation Knowledge Foundation, available at: http://www.thinkinnovation.org/file/research/23/en/Top peta_Report_005_2010.pdf (last access: 2 May 2018), 2010.
Trindade, E. P., Hinnig, M. P. F., Moreira da Costa, E., Marques, J. S., Cid Bastos, R., and Yigitcanlar, T.: Sustainable development of smart cities: a systematic review of the literature, J. Open Innov.: Technol., Market Complex., 3, 1–14, https://doi.org/10.1186/s40852-017-0063-2, 2017.
Vyas, S. and Kumaranayake, L.: Constructing socio-economic status indices: how to use principal components analysis, Health Pol. Plan., 21, 459–468, https://doi.org/10.1093/heapol/czl029, 2006.
Washburn, D. and Sindhu, U.: Helping CIOs understand smart city initiatives, Forrester Research Inc. Internet site of Fast Co Exist, Cohen, B.: What Exactly is a Smart City?, available at: http://www.fastcoexist.com/1680538/what-exactly-is-a-smart-city (last access: 2 May 2018), 2010.
Winters, J. V.: Why are smart cities growing? Who moves and who stays, J. Reg. Sci., 51, 253–270, https://doi.org/10.1111/j.1467-9787.2010.00693.x, 2011.