 | 09 Aug 2018
Carbon in global waste and wastewater flows – its potential as energy source under alternative future waste management regimes
Adriana Gómez-Sanabria
Lena Höglund-Isaksson
Peter Rafaj
Wolfgang Schöpp
This study provides a quantification of the maximum energy that can be generated from global waste and wastewater sectors in the timeframe to 2050, as well as of the potential limitations introduced by different future waste and wastewater management regimes. Results show that considerable amounts of carbon are currently stored in waste materials without being recovered for recycling or made available for energy generation. Future levels of energy recovery when maintaining current states of waste and wastewater management systems are contrasted with those that can be attained under a circular system identified here as a system with successful implementation of food and plastic waste reduction policies, maximum recycling rates of all different types of waste streams, and once the recycling capacity is exhausted, incineration of remaining materials to produce energy. Moreover, biogas is assumed to be produced from anaerobic co-digestion of food and garden wastes, animal manure, and anaerobically treated wastewater. Finally, we explore the limits for energy generation from waste and wastewater sources should the efficiency of energy recovery be pushed further through development of existing technology. We find that global implementation of such an ideal system could increase the relative contribution of waste and wastewater sources to global energy demand from 2 % to 9 % by 2040, corresponding to a maximum energy potential of 64 EJ per year. This would however require widespread adoption of policies and infrastructure that stimulate and allow for large-scale waste prevention and separation, as well as highly advanced treatment processes. Giving priority to such efforts would enable circularity of the waste-energy system.
- Article
(3337 KB) - Full-text XML
-
Supplement
(677 KB) - BibTeX
- EndNote


The continuous increase of anthropogenic pressure on the environment has brought different disciplines together with the common objective of finding holistic solutions to reduce, mitigate and/or adapt to the negative impacts of human activities. The concept of a circular economy has emerged as a strategy to cope with uncontrollable and unsustainable consumption rates of today's society (Haas et al., 2015). In that context, sustainable waste and wastewater management systems play a significant role in contributing to reduce air and water pollution as well as to decarbonization of the energy system through reducing, reusing, recycling and recovering part of the energy embodied in waste materials and wastewater (Corsten et al., 2013). Various case studies quantifying energy and greenhouse gas emission reductions from waste have been carried out for specific regions, often focusing on a specific management technology, e.g. energy from anaerobic digestion in United Kingdom (Evangelisti et al., 2014), methane generation potential from landfills in India (Mor et al., 2006), determination of fossil carbon in Swedish waste (Jones et al., 2013), energy from waste in the Netherlands (Corsten et al., 2013) or GHG emissions from different waste management technologies in China (Liu et al., 2017). Regarding wastewater, different case studies have shown that anaerobic digestion with biogas utilization can offset the energy consumption in the wastewater treatment process (McCarty et al., 2011; Stillwell et al., 2010). Unique for this study is its wide scope; we estimate global carbon flows from waste and wastewater sources from both domestic and industrial sectors. Previously, the global energy potential from municipal waste has been estimated at 8–18 EJ in 2010 and 13–30 EJ in 2025 (Bogner et al., 2008).
Different waste and wastewater management pathways and policies would have different social, environmental and economic impacts. While in the developed world the focus of the management systems have moved towards resource efficiency, developing countries are still facing problems to cope with the large volumes of waste and wastewater generated (Manaf et al., 2009). This has been attributed to financial, technical and institutional problems at the local and national levels (Pokhrel and Viraraghavan, 2005). However, if an economy grows accompanied by enforcement of environmental policies focused on the circularity of the system, climate, health and other environmental impacts caused by poor waste and wastewater management systems could be tackled simultaneously (Ghisellini et al., 2016). Therefore, an examination of the current state and an exploration of future waste and wastewater management alternatives is needed in order to identify an adequate strategy to achieve the maximum benefits for a growing economy. Accordingly, the overarching goal of this study is to investigate the maximum potential contribution of the global waste and wastewater sectors to the decarbonization of the global energy system, as well as to quantify potential limitations on energy recovery from these sources introduced by possible future waste and wastewater policies. The analysis rests on detailed country-/region-specific estimations of the carbon content in current waste flows with simulations of future carbon flows for a range of different waste and wastewater management regimes.
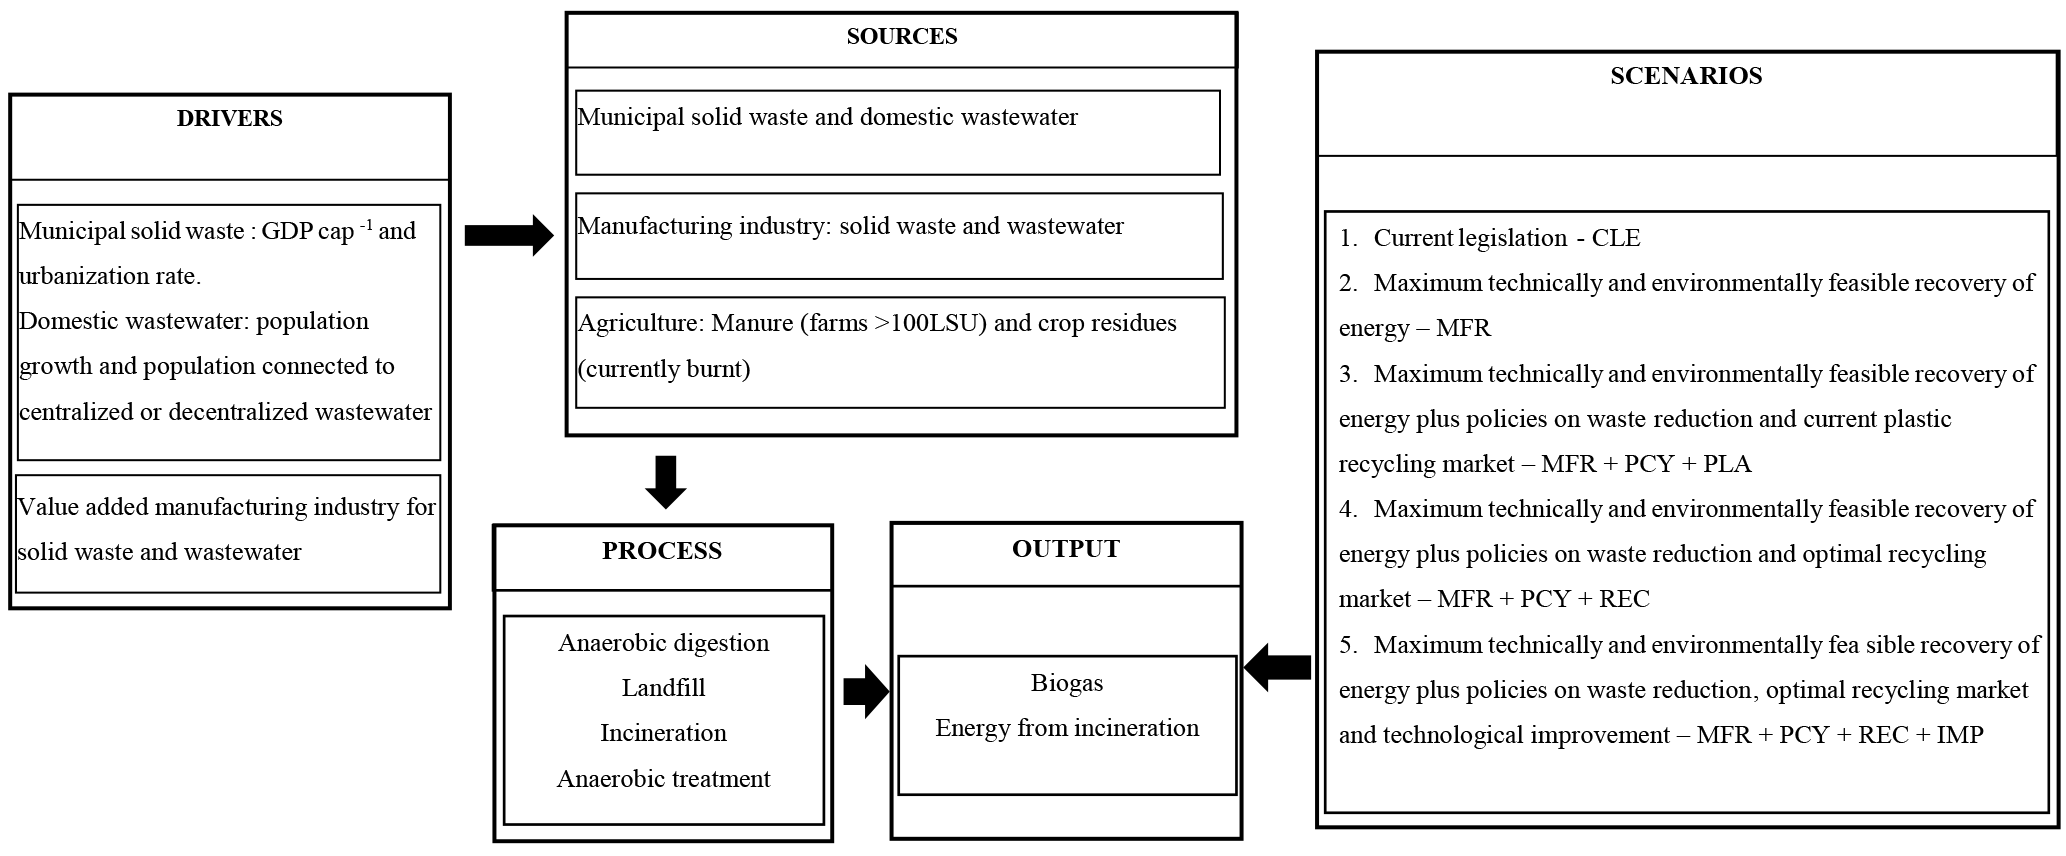
A research framework approach to estimate the current and future carbon content and the maximum energy potential from waste and wastewater at a global level up to 2050, is presented in Fig. 1.
The following section presents a summary of the approach to project industrial/municipal waste and wastewater generation (Sect. 2.1), followed by a short explanation of carbon content determination and maximum energy potential calculation (Sect. 2.2), and then an outline of the assumptions behind the development of the waste and wastewater management scenarios focused on the maximum technically and environmentally feasible recovery of energy (Sect. 2.3). Key assumptions for carbon content, biogas and energy-recovery calculations are presented in Table S1 and equations applied for the different calculations are presented in the Supplement Sect. S2. Furthermore, a section describing the limitations and uncertainty of the waste and wastewater management scenarios is presented in the Supplement Sect. S2.4.
2.1 Wastewater and solid waste projections up to 2050
2.1.1 Industrial wastewater
Industries with a high carbon load in the wastewater can potentially generate biogas when the wastewater is treated under anaerobic conditions (IPCC, 2006). The main industrial sectors considered here as generators of wastewater with a high carbon load are the food industry and the pulp and paper industry. In addition, we consider in a joint category named “other industrial sectors” wastewater with a significant carbon content, i.e. organic chemicals, textile, and leather industries. Activity data used to estimate biogas generation is the content of organics in the wastewater expressed in COD (Chemical Oxygen Demand) terms. Driver for future projections of industrial wastewater (COD content) is the growth in value added in the respective manufacturing industrial sector derived for the period to 2040 from the World Energy Outlook 2017 (International Energy Agency, 2017) and assuming the same annual growth rate between 2040 and 2050 as between 2035 and 2040. Elasticity parameters used for future projections are taken from Höglund-Isaksson (2012). Historical data on industrial production are retrieved from FAOSTAT (2016). Wastewater generation rates by type of industry are taken from different sources (refer to Table 17 in Höglund-Isaksson et al., 2015).
2.1.2 Industrial solid waste
Manufacturing industries considered in this study are food, pulp and paper, rubber, textile, wood and other manufacturing industry. Just like for industrial wastewater, the drivers for industrial solid waste generation projections are the expected growth rates in value added in the respective manufacturing industrial sectors, derived from the World Energy Outlook 2017 (International Energy Agency, 2017). Industrial waste generation elasticity parameters to value added are retrieved from Höglund-Isaksson (2012) and used to project industrial waste generation. Statistics on industrial waste generation quantities are taken from various sources (Supplement Table S2).
2.1.3 Domestic wastewater
Domestic wastewater is defined as wastewater from households (IPCC, 2006), however, may in some cases be mixed with small industry sources. Activity data to estimate biogas generation is the content of organics in wastewater expressed in BOD (Biological Oxygen Demand) terms. Biogas is quantified for domestic wastewater that is centrally collected and treated in a municipal sewage plant. Data on population projections are taken from the GAINS model which are based on data from IEA (International Energy Agency, 2017). Fractions of people connected to centralized/decentralized systems are retrieved from EUROSTAT (2016), OECD (2016) and World Bank Open Data (2016).
2.1.4 Municipal solid waste generation
A new methodology to project municipal solid waste generation and waste composition by income group was developed based on the assumption that average national waste generation rate and composition vary depending on the average national income level (Hoornweg and Bhada-Tata, 2012). Numerous studies (UNEP and ISWA, 2015; Hoornweg and Bhada-Tata, 2012; SWEEPNET, 2012; Wilson et al., 2012) indicate that composition of municipal solid waste depends on socio-economic characteristics, geographical location and environmental features. Paper and plastic wastes are the main fractions of MSW in high-income countries, while food waste dominates in low income countries (Hoornweg and Bhada-Tata, 2012). The drivers used here to project future municipal solid waste generation are GDP per capita and urbanization rate (for extended dataset description and elasticity estimation models, see Supplement Sect. S2). Furthermore, due to the fact that waste composition influences the carbon content and hence the energy recovery potential, projections of waste composition are needed. For future years, the composition of waste is recalculated based on an estimated elasticity of per capita food waste to GDP per capita (for elasticity estimation models see Supplement Sect. S2). After projecting the future generation of food waste per capita, other types of waste are projected to make up the rest of total per capita MSW generated with the relative contribution of non-food waste in 2015 kept constant in future years.
2.2 Carbon content determination and energy-recovery potential
2.2.1 Solid waste
Waste generation quantities and waste composition determine the availability of the carbon content to produce energy. Different waste categories contain different fractions of degradable organic carbon (DOC) and fossil carbon (FC) (IPCC, 2006, vol. 5, chap. 2). At the same time, waste composition determines (to a certain extent) the type of management. In order to quantify the carbon content in industrial and municipal solid waste and the respective flows, the following approach is used (calculations are always carried out globally at the level of 174 countries/regions and with annual results presented for every five years):
-
Quantification of DOC and FC in municipal and industrial solid waste using IPCC default values for DOC and FC (IPCC, 2006).
-
Identification by country/region of the application rate of current (and future) waste management technologies/systems (EUROSTAT, 2016; OECD, 2016, UNFCCC CRF Tables (2016) and documents referenced in Supplement Table S8). This study distinguishes various management options for each of the solid waste fractions. Description of each of the options can be found in the Supplement Sect. S2.2.1, Table S9. The assessment of the carbon flows is then carried out applying Eqs. (S1) and (S2).
-
Estimation of energy recovery from municipal and industrial solid waste: This study identifies anaerobic co-digestion, landfill with gas recovery and use, and waste incineration as the three main treatment technologies to convert waste into a source of energy.
Anaerobic co-digestion
In order to improve the efficiency of the biogas formation processes, different degradable sources are typically co-digested (Berglund and Börjesson, 2006; Singh et al., 2001). Therefore, in addition to food waste (municipal and industrial), manure from dairy cows, non-dairy cattle and pigs that are kept on farms with more than 100 Livestock Units (LSU) and using liquid manure management systems (Höglund-Isaksson, 2015), and agricultural crop residues that would otherwise be openly burned, are included as extra substrates to be co-digested with the waste. Information on manure generation and agricultural crop residues consistent with long-term agricultural projections from FAOSTAT (2012) are taken from the GAINS model. It is assumed that the feedstock for biogas generation contains 80 % manure and 20 % other organic substrate with a water content of 85 %. No trade or exchange of substrates between countries/regions is considered. In cases/countries where one of the substrates is not available or there is a surplus (no needed for co-digestion) in one of them, biogas from single substrate digestion is also considered, albeit adjusting for a lower biogas yield in cases when only manure is digested. Biogas generation is calculated using Eq. (S3) (based on Höglund-Isaksson, 2015) and Eq. (S4).
Landfill
Landfill gas generation is accounted for with a lag of 10 years for fast degrading organic waste and 20 years for slow degrading waste. Landfill gas generation is calculated using Eq. (S5) based on IPCC (2006, vol. 5, chaps. 2 and 3).
Incineration
Energy from incineration is calculated using the Low Heating Value (LHV) of each of the waste fractions. LHV represents the usable heat released from waste and varies according to waste type (Demirbas, 2004). Energy from incineration is calculated using Eq. (S6).
2.2.2 Wastewater
Wastewater generation quantities and composition determine the capacity to generate biogas when treated under anaerobic conditions. Biogas from wastewater treatment is calculated based on the COD content for industrial wastewater and BOD content for domestic wastewater. It is important to notice that in this study the focus of the wastewater treatment is the removal of organic content by using anaerobic treatment as a process to generate biogas. The subsequent wastewater treatment to remove different pollutants depends on the respective legislation at the country level. In order to quantify the organic content in industrial and municipal wastewater and its respective flows, the following approach is used (calculations are carried out by country/region and year):
-
Quantification of BOD in untreated domestic wastewater and COD in untreated industrial wastewater using the IPCC method (based on IPCC, 2006, vol. 5, chap. 6, Eqs. 6.4 and 6.6).
-
Identification by country/region of the application rate of current (and future) use of wastewater management technologies/systems (EUROSTAT, 2016; OECD, 2016 and documents referenced in Supplement Table S7). This study distinguishes various wastewater management options for each of the two wastewater types. A description of each option can be found on the supplement material Sect. S2.2.2, Table S10. The assessment of the organic material flows is then carried out applying Eqs. (S7) and (S8) based on Höglund-Isaksson et al. (2015).
-
Estimation of the energy potential from domestic and industrial anaerobic wastewater with gas recovery. Volumes of biogas from industrial and domestic wastewater treatment are calculated by applying Eq. (S9).
2.3 Waste and wastewater management scenarios
Presented estimates (see Sect. 3) assume a maximum technically feasible phase-in of waste management (in consistency with EU's waste management hierarchy – Directive 2008/98/EC) and wastewater treatment technologies that generate energy while reducing greenhouse gases, air pollution and water contamination on the basis of the circular economy strategy. Five different sets of waste and wastewater management strategies are developed. Implications of costs to implement various strategies are not considered in this analysis. Description of the measures adopted for the different scenarios are presented in the supplement Sect. S2.3.
-
CLE “current legislation”: The scenario assumes efficient implementation of the existing waste/wastewater legislation. In countries/regions where no waste legislation exists – CLE – represents the current waste management situation.
-
MFR “maximum technically feasible phase-in of waste and wastewater management”: A scenario that assumes the implementation of the “best available technology” to improve waste and wastewater management systems without regarding costs but considering constrains that could limit the applicability of certain technologies.
-
MFR + PCY + PLA “maximum technically feasible phase-in of waste and wastewater management” + “policy implementation + “plastic incineration”: The scenario adopts the MFR + policies for reducing the generation of food and plastic municipal solid waste + maintains current municipal plastic waste recycling rates and sends excess plastics to incineration for energy recovery.
-
MFR + PCY + REC “maximum technically feasible phase-in of waste and wastewater management” + “policy implementation” + “maximum recycling capacity”: This scenario adopts the MFR + PCY + reaches the maximum possible recycling capacity for all waste streams. For wastewater, the scenario includes a capacity to increase treatment of wastewater in urban areas.
-
MFR + PCY + REC + IMP “maximum technically feasible phase-in of waste/wastewater management” + “policy implementation” + “maximum recycling capacity” + “technology efficiency improvement”: This scenario adopts the MFR + PCY+ REC + technological development to increase biogas yield formation and to reduce losses during the treatment process for both solid waste and wastewater. Improvements include e.g. adding accelerants (biological or chemical) to improve the metabolic conditions for microorganism growth and therefore biogas formation (Mao et al., 2015), recovery of the dissolved methane in wastewater, and improvement of the biogas recovery rates. For incineration, improvements include an increase of the Low Heating Value, increase in the efficiency of input/air flows and reduction of energy losses during the process.
In this section, a summary of the key results at a global and regional level in terms of carbon content and energy recovery from solid waste and wastewater are presented. Regions are aggregated into five groups using the Global Energy Assessment classification (GEA and IIASA, 2012). These groups are: UNFCCC Annex I countries (OECD), Easter Europe and Former Soviet Union (REF), Asia (excluding OECD), Middle East and Africa (MAF) and Latin America and the Caribbean (LAC).
3.1 Total global carbon availability
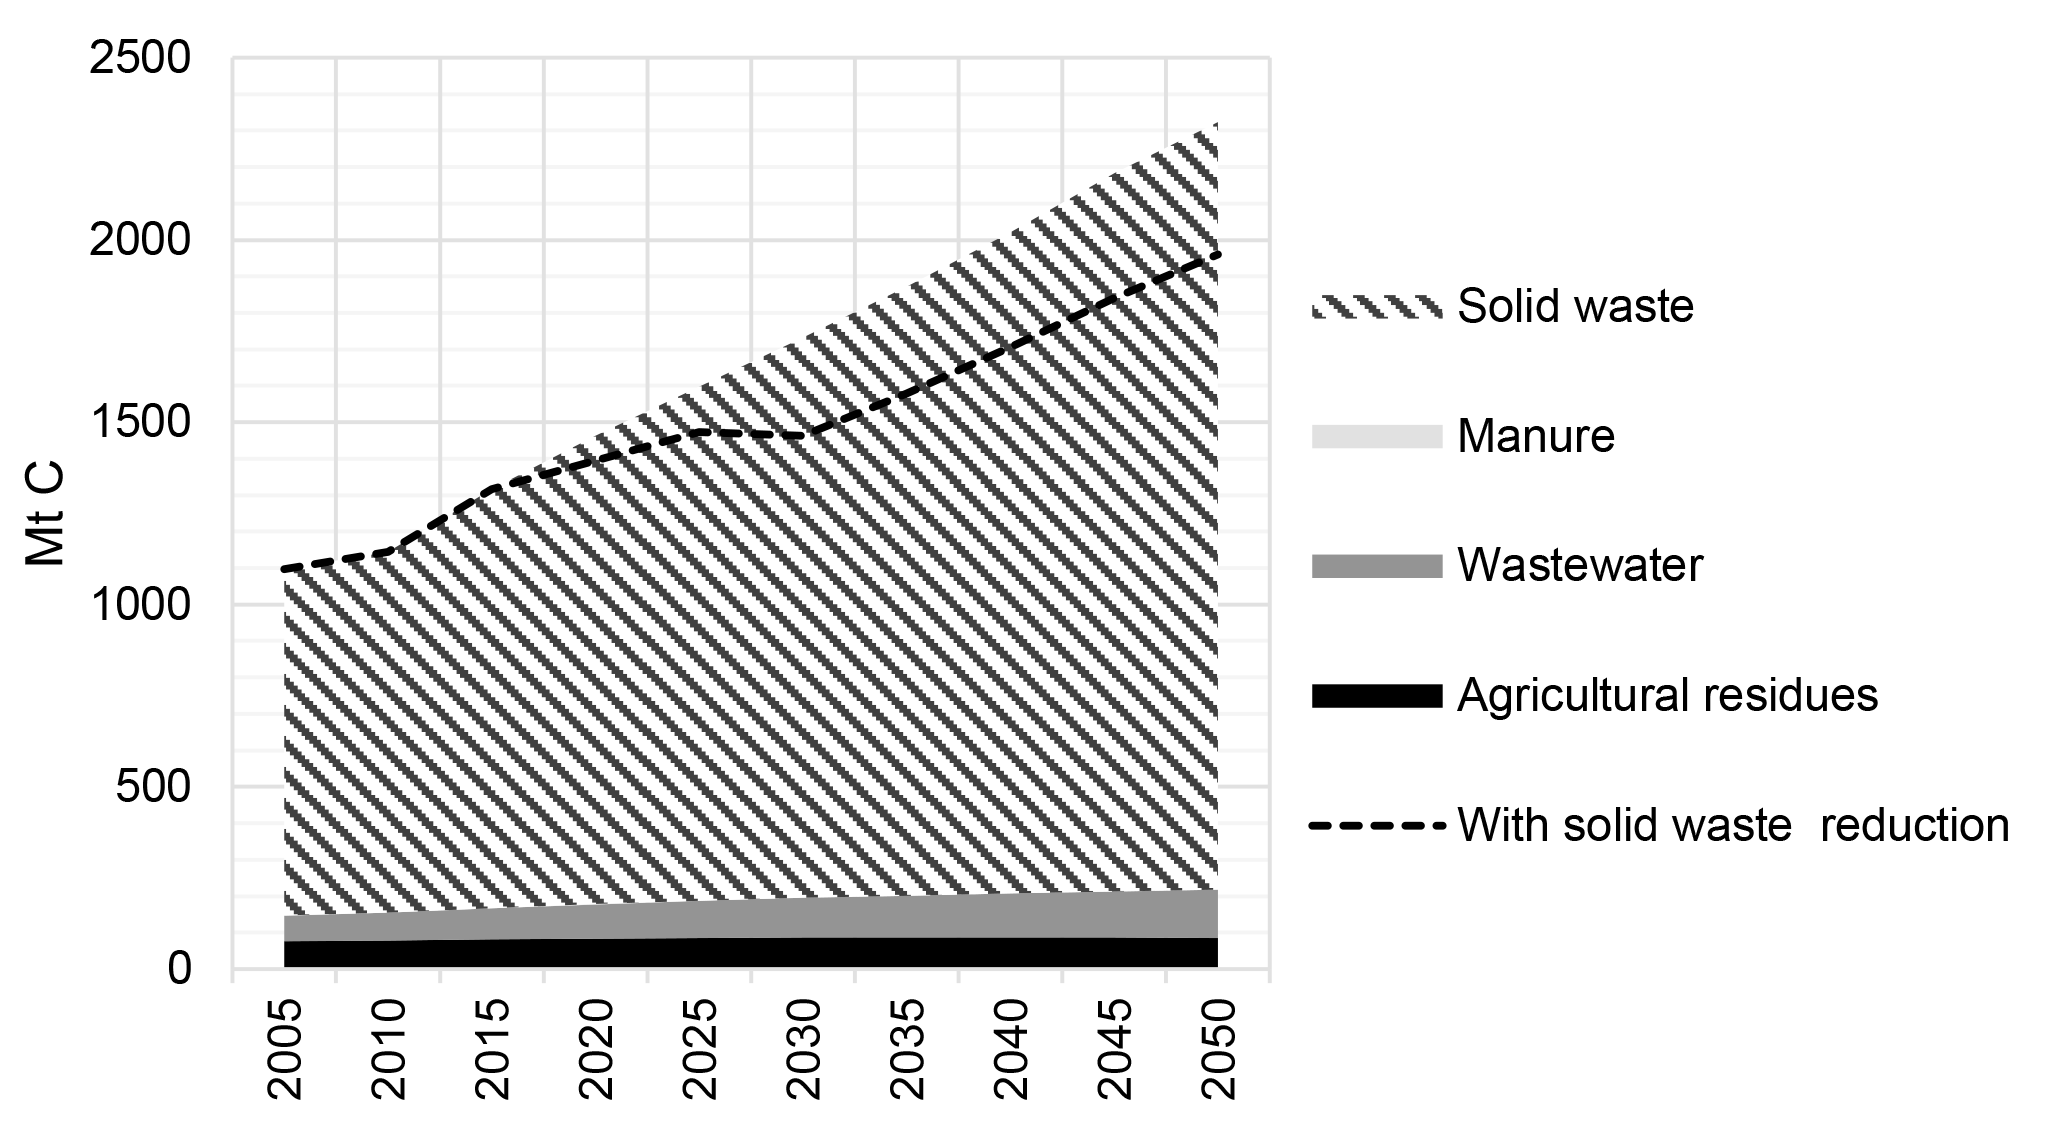
The availability of carbon in waste and wastewater allows for the quantification of the maximum potential of waste and wastewater as an energy source. Figure 2 shows the projected total carbon available from waste and wastewater sectors at a global level. Currently, the total global carbon in waste and wastewater is around 1400 Mt and is expected to be 2100 Mt in 2050. Municipal and industrial solid waste accounts for 87 % of the total carbon content while wastewater, agricultural residues (currently burned) and manure account for the rest 13 %. Manure accounts for < 1 % of the total carbon available. With future food and plastic waste reduction policies (strategies having an impact on the carbon content in waste), the availability of carbon is expected to be around 1900 Mt in 2050 which is 13 % less carbon compared to the current scenario in 2050.
3.2 Carbon flows in solid waste
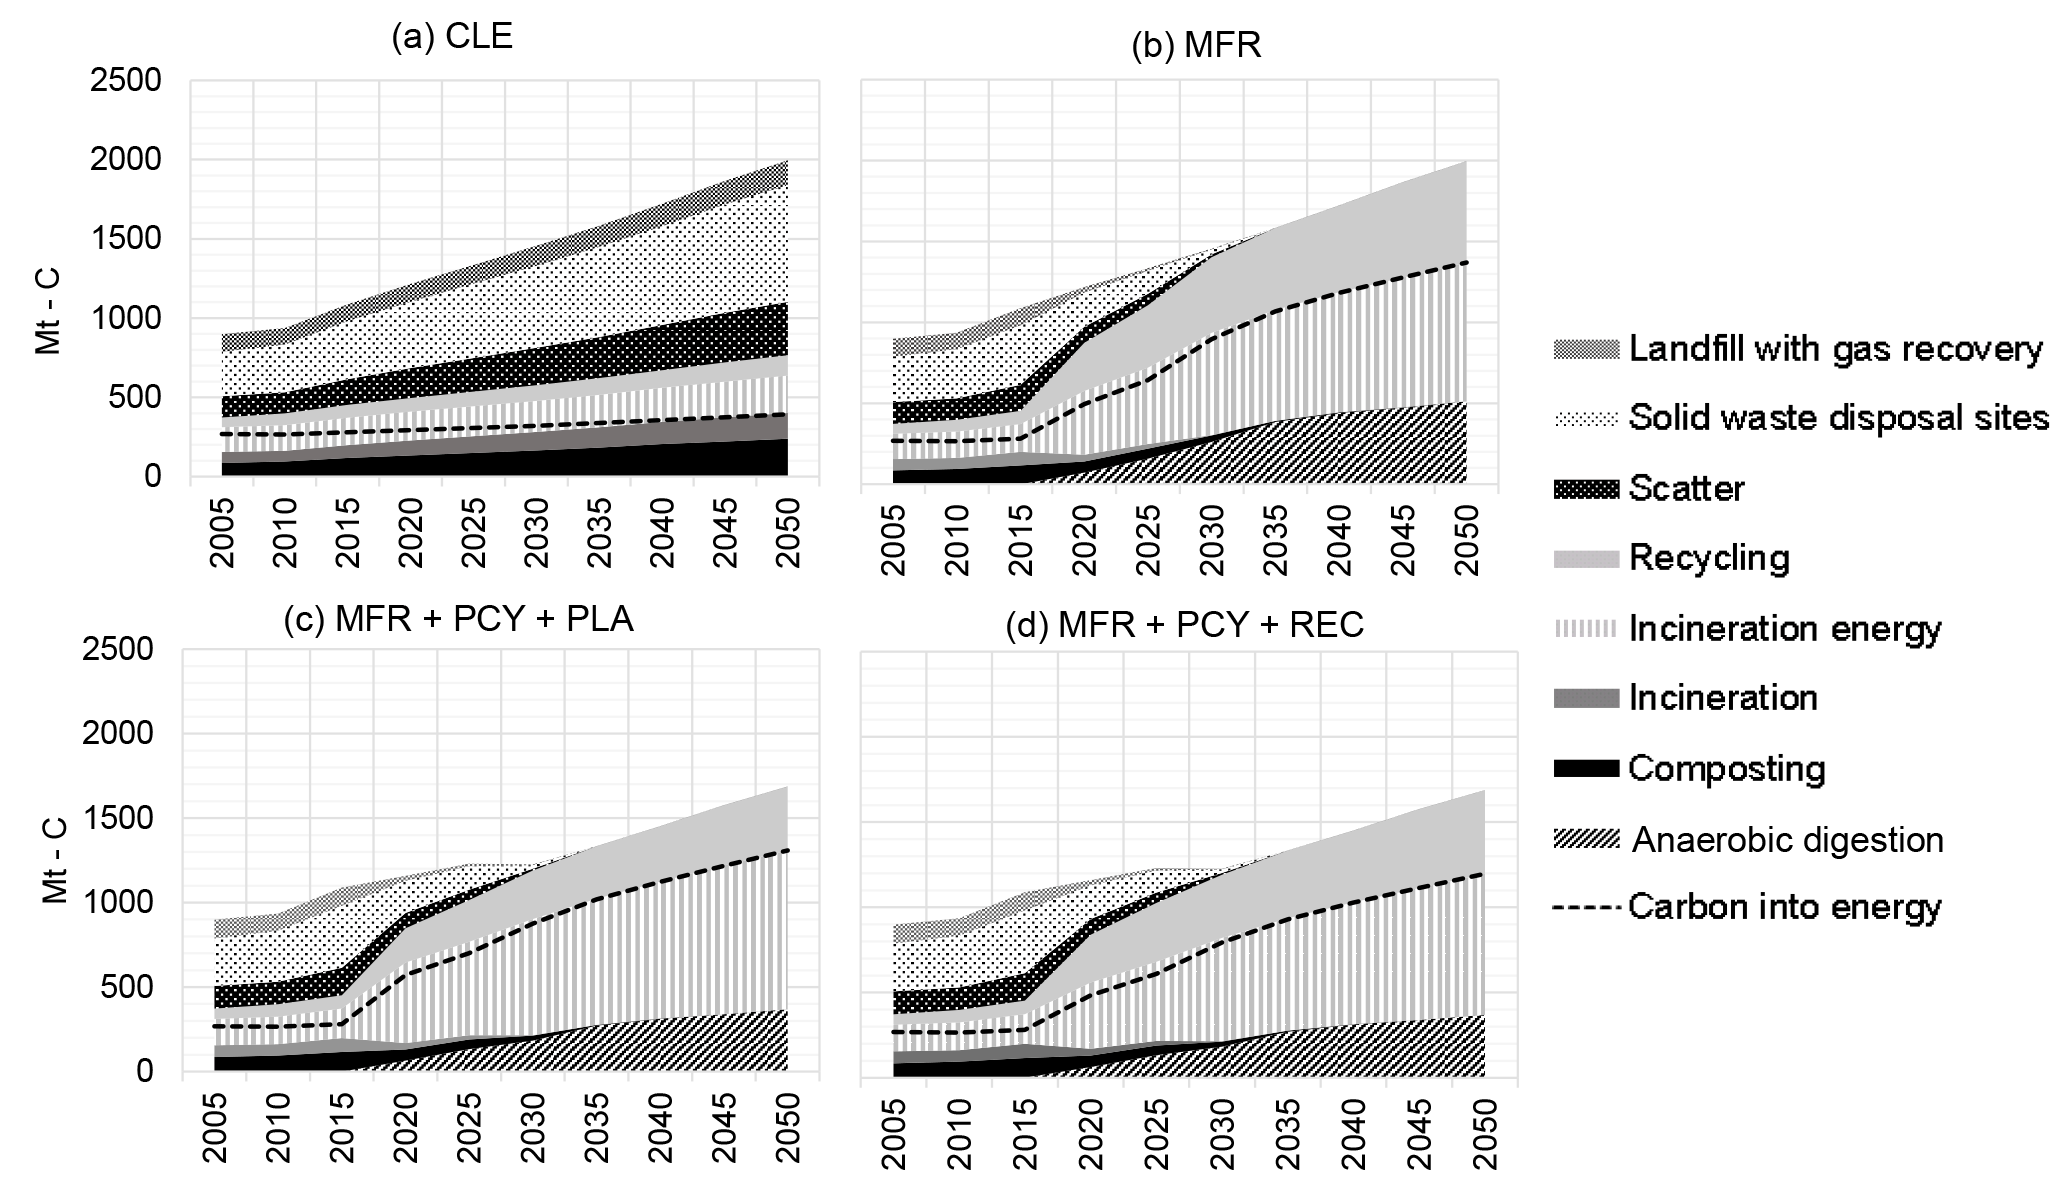
Currently at a global level, we find that 59 % of carbon in waste is lost (dumped, scattered and openly burned without energy recovery), 18 % is recycled/composted and 23 % is converted to energy. 35 % of the carbon content in waste comes from industrial waste and 65 % from municipal solid waste. In the CLE scenario, an estimated 400 Mt-C is expected to be used annually as an energy source by 2050 (Fig. 3a). The largest losses of carbon are expected in the ASIA (46 %) and MAF (22 %) regions, where there is currently little or no waste management legislation in place. In low-income countries, collection rates are extremely low and waste disposal is often done in the form of uncontrolled dumpsites and open burning (UNEP and ISWA, 2015). The OECD region accounts for 90 % of the carbon globally converted into energy. OECD countries generate the highest amounts of waste per capita, however, most of the waste is properly managed with just 10 % of the carbon content lost. LAC and REF regions account for the last 21 % of the carbon currently lost at a global level. With a maximum technically feasible phase-in of waste management (MFR) implementation (Fig. 3b), we estimate that 66 % of the carbon in waste could be used to generate energy by 2050, through the use of anaerobic co-digestion or incineration. The global carbon converted annually into energy would then be around 1370 Mt by 2050. Carbon going to landfills with gas recovery until 2030 would serve as a source of energy for some years thereafter. In this scenario (MFR), the share of carbon content used as energy by 2050 would be better distributed between regions having ASIA and OECD countries with around 60 % of the global share (∼30 % each). With the implementation of food and plastic waste reduction reaching 50 % in 2030 on top of maximum technical implementation (MFR + PCY + PLA), the availability of total carbon in waste at a global level is expected to be reduced by 18 % in 2050 (Fig. 3c). Nonetheless, the flow of carbon going into the energy sector is reduced by plastic recycling (keeping the current rates of municipal plastic waste recycling) resulting in a global carbon converted into energy of around 1300 Mt by 2050 which is 5 % less than the carbon available in MFR. Although at a global level not significant effect on the carbon into energy flow is observed with the MFR + PCY + PLA scenario, at a country level the situation varies depending on the current level of plastic recycling. If a country has low recycling rates, even with the plastic reduction measure, more plastic would go into incineration. On the contrary, if a country has high plastic recycling rates, the reduction in plastic waste generation would affect the carbon flow to incineration. With an optimum recycling market on top of maximum technical implementation and plastic and food waste reduction policies (MFR + PCY + REC), we estimate that the total carbon converted into energy would be around 1200 Mt, which is 14 % and 9 % less compared to the MFR and MFR + PCY + PLA, respectively (Fig. 3d). Carbon content flows for the three different scenarios by region are presented in the Supplement in Fig. S2.
3.3 COD and BOD flows in wastewater
Currently at a global level, we find that 57 % of domestic wastewater and 38 % of industrial wastewater is either untreated or discharged after primary treatment. Most of the wastewater is treated under aerobic conditions (42 % domestic and 56 % industrial). The application of anaerobic treatment is rather low for both wastewater types. With the current management the amount of BOD – COD going to energy generation by 2050 is expected to be 1 and 10 Mt, respectively (Fig. 4a). As in the case of solid waste, most of the untreated wastewater is currently discharged in ASIA (50 %) and MAF (21 %) regions (see Supplement Fig. S3). This situation is expected since sanitation and waste management are directly linked (Marshall and Farahbakhsh, 2013). With the improvement of wastewater management focused on energy generation 39 % of BOD (refers to urban wastewater) and 91 % of COD could be going to anaerobic treatment with energy recovery by 2050, which corresponds to 48 Mt-BOD and 205 Mt-COD (Fig. 4b). Extending the treatment capacity (collection rates in urban areas) on top of the technical improvement by 2050, would increase up to 85 % of BOD and 91 % of COD going to anaerobic treatment, which corresponds to 78 Mt BOD and 205 Mt COD (Fig. 4c).
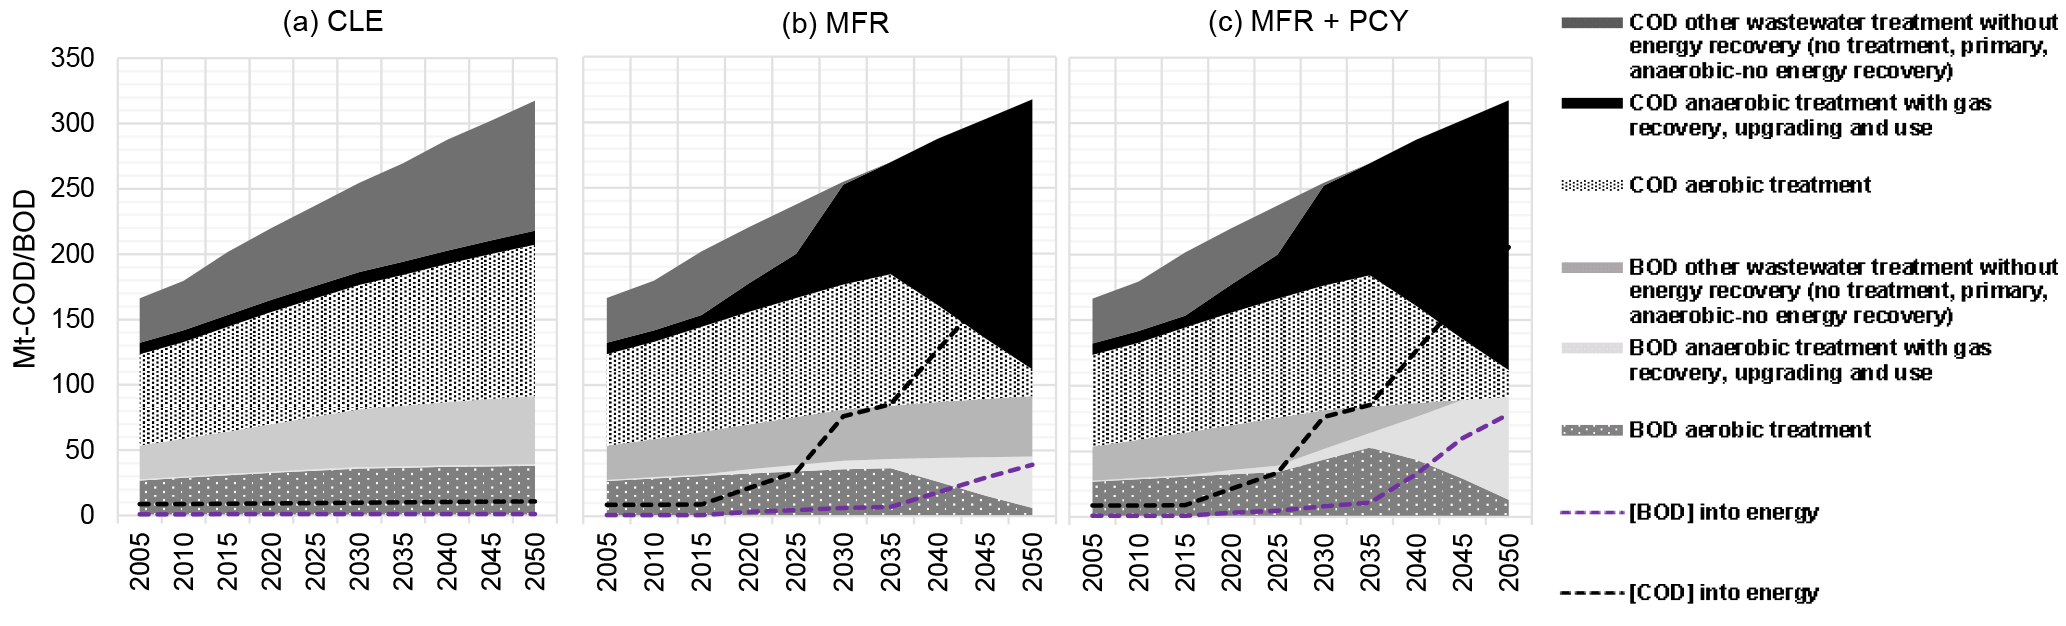
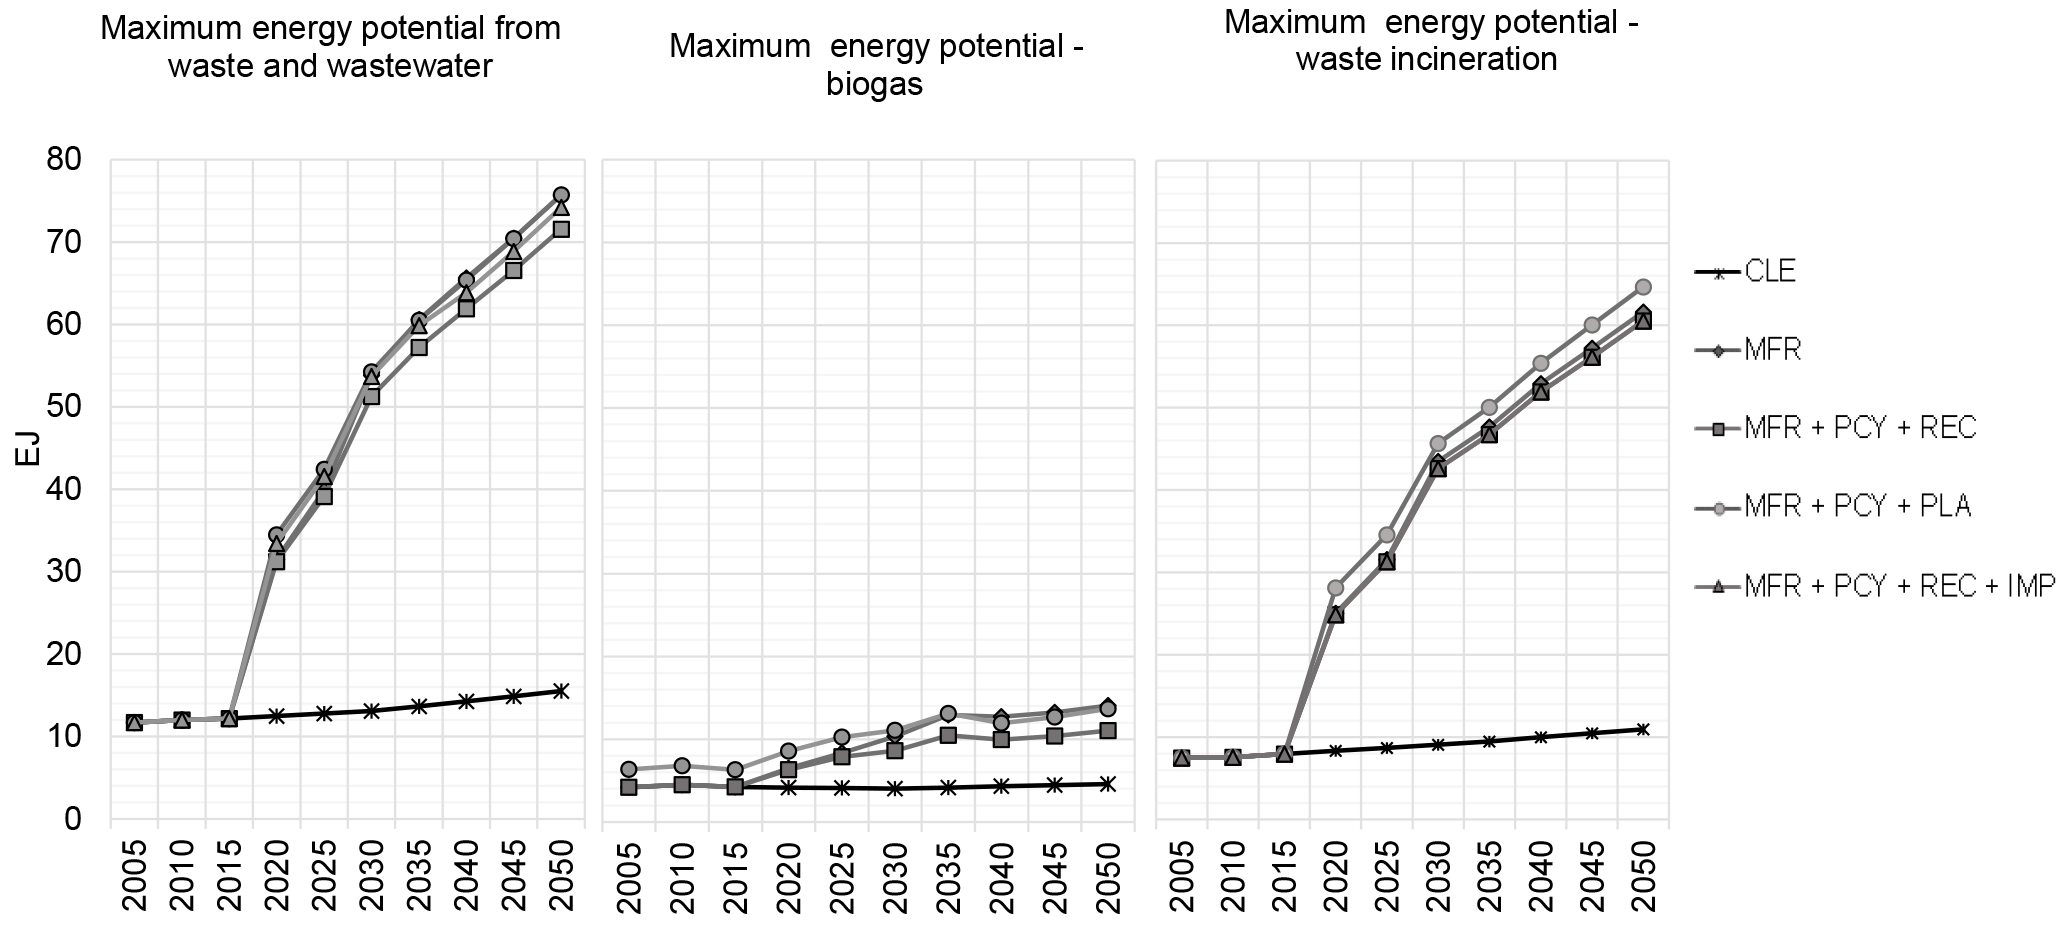
Figure 5Maximum global energy recovery potential from waste and wastewater treatment by scenario.
3.4 Maximum energy potential from waste and wastewater
The analysis of the estimation of maximum energy potential from waste and wastewater (before conversion to electricity or heat) shows (Fig. 5) that current energy recovered from waste and wastewater management is around 13 EJ at a global level, which corresponds to 2 % of the total primary energy demand in 2010. 63 % of the total energy recovery originates from waste incineration and 37 % from biogas generation. OECD countries have a share of 81 % of total energy recovered from waste and wastewater at the global level (79 % incineration and 21 % biogas). In general, OECD countries have been improving waste and wastewater treatment systems as a key element of achieving sustainable resource management, of which energy recovery is an essential part.
With the “maximum technically feasible phase-in of waste and wastewater management” (MFR) energy generation would be ∼ 5 times higher compared to the CLE scenario reaching 66 EJ by 2040, which would correspond to 9 % of the total primary energy demand (∼ 740 EJ) projected by IEA (International Energy Agency, 2017) in 2040. 81 % of the energy would be recovered from waste incineration and 19 % from biogas. These shares are the result of exhausting the corresponding recycling capacity before sending material to incineration, reducing the waste going to landfills and upgrading/improving wastewater treatment systems with energy recovery. Most of the biogas is generated from solid waste (99 %) while the contribution from wastewater is particularly low (1 %). Wastewater must undergo pre-treatment before entering the anaerobic treatment, which removes organics by 35 %–40 %, reducing the capacity of biogas generation (Cakir and Stenstrom, 2005). Furthermore, a certain fraction (depending on temperature, pressure, salinity) of the methane formed remains in the water as dissolved methane, which diminishes even further the potential for biogas generation (Liu et al., 2014) – a situation which explains the lower share of energy recovered from wastewater.
Moreover, if on top of the technical improvement, policies aimed at reducing food and plastic waste are implemented and plastic recycling rates are maintained at current levels and the remaining plastic material is sent to incineration (MFR + PCY + PLA), energy generation will reach the same level as the MFR strategy alone (66 EJ). Biogas would be reduced by 23 %, falling from 13 to 10 EJ in 2040. Energy available from incineration will increase from 53 to 55 EJ in the same year. Sending the excess of plastic waste into energy recovery compensates for the reduction of plastic generation and increases energy from incineration by ∼ 5 %. Although the concept of waste recovery includes energy recovery, this latter process results in less decarbonization and environmental benefits than material recovery since virgin material is still demanded (Hopewell et al., 2009). However, with the current situation of excess supply in the plastic recycling market (e.g., China's ban on importing recycling plastic after being the leading world's importing country, Velis, 2014) and assuming the success of the plastic waste reduction policy, the “best” way to recover/reuse plastic waste is to convert it to energy through incineration.
However, it is preferable to exhaust the maximum recycling rates before sending material to incineration. Therefore, assuming an ideal market for recyclables on top of food and plastic reduction policies (MFR + PCY + REC), the potential of energy generation is reduced by 6 % in 2040 compared to the MFR and to the MFR + PCY + PLA, resulting in 62 EJ of the energy gains. Hence, the prevention of food and plastic waste generation would not drastically affect the maximum energy recovery potential, but instead have positive impacts towards other sustainability factors. 84 % of the total energy recovered would be from waste incineration and 16 % from biogas.
Finally, the optimal waste and wastewater management scenario for improving the so-called circular economy would be to follow the scenario MFR + PCY + REC + IMP, where the implementation of food and plastic waste reduction policies succeed, the maximum recycling rates of the different waste streams (including plastic) are reached and where waste and wastewater treatment technology improvements increase energy generation and energy recovery efficiency. Once the recycling capacity is exhausted, remaining materials are allowed to enter incineration plants. Organic waste is digested and wastewater is anaerobically treated to produce biogas. The maximum energy potential from waste and wastewater sectors would then be 64 EJ by 2040 which is 9 % of the total primary energy demanded in 2040 as projected by IEA (New Policies scenario 2017). By comparing the CLE to the MFR + PCY + REC + IMP we observe that there exists and estimated additional potential for recovering energy equivalent to 50 EJ per year. In other terms, it means that only 20 % of the maximum capacity to generate energy from solid waste and wastewater would be exploited if current technology and infrastructure are maintained in the future. The success of policies simulated in the improved technology scenario requires waste prevention, reuse, recycling and energy generation, resulting in multiple climate, environmental and social co-benefits.
It is recognised that for health and environmental reasons, there is a large potential to improve waste and wastewater management systems at a global level, with immediate action needed in developing countries. We present an estimation of the carbon content in waste and wastewater accompanied by a quantification of the maximum energy that can be generated from global waste and wastewater sectors in the timeframe to 2050 at a global level. Furthermore, we confront different waste and wastewater management scenarios assuming diverse policy measures and treatment pathways and identify an “ideal” system as provider of maximum benefits in terms of energy in support of the decarbonization of the energy system. We find that a scenario that targets at waste reduction, recycling, energy generation and technological improvement would be the policy option that would generate the maximum energy in support of a low-carbon energy system. The management of waste and wastewater focusing on the implementation of this policy option would generate a maximum of 64 EJ of energy in 2040 and 74 EJ in 2050. 82 % of energy would be recovered from waste incineration and the remaining 18 % from anaerobic processes generating biogas. Furthermore, the share of the energy generated from waste and wastewater in the total primary energy demand could increase from 2 % to 9 % at the global scale. Further detailed economic (including recycling markets) and social analyses, taking into account regional and local characteristics would be important to identify potential economic barriers associated with the implementation of the analysed scenarios.
Underlying data can be found in the Supplement.
The supplement related to this article is available online at: https://doi.org/10.5194/adgeo-45-105-2018-supplement.
AGS and LHI conceived the idea of the study. AGS developed and performed the calculations, analyzed the results and wrote the manuscript. LHI supervised the findings, supported the development of conclusions and edited the manuscript. PR and WS performed the integration of the global socio-economic drivers needed to carry out the different calculations. All authors discussed the results and contributed to the manuscript.
The authors declare that they have no conflict of interest.
This article is part of the special issue “European Geosciences Union General Assembly 2018, EGU Division Energy, Resources & Environment (ERE)”. It is a result of the EGU General Assembly 2018, Vienna, Austria, 8–13 April 2018.
Adriana Gómez-Sanabria would like to acknowledge the improvements
suggested by Vanessa Parravicini from the Vienna University of Technology
during the Poster session at the EGU on 11 April 2018.
Edited by: Viktor Bruckman
Reviewed by: two anonymous referees
Berglund, M. and Börjesson, P.: Assessment of energy performance in the life-cycle of biogas production, Biomass Bioenerg., 30, 254–266, https://doi.org/10.1016/j.biombioe.2005.11.011, 2006.
Bogner, J., Pipatti, R., Hashimoto, S., Diaz, C., Mareckova, K., Diaz, L., Kjeldsen, P., Monni, S., Faaij, A., Gao, Q., Zhang, T., Abdelrafie Ahmed, M., Sutamihardja, R. T. M., and Gregory, R.: Mitigation of Global Greenhouse Gas Emissions from Waste: Conclusions and Strategies from the Intergovernmental Panel on Climate Change (IPCC) Fourth Assessment Report, Working Group III (Mitigation), 2008.
Cakir, F. Y. and Stenstrom, M. K.: Greenhouse gas production: A comparison between aerobic and anaerobic wastewater treatment technology, Water Research, 39, 4197–4203, https://doi.org/10.1016/j.watres.2005.07.042, 2005.
Corsten, M., Worrell, E., Rouw, M., and van Duin, A.: The potential contribution of sustainable waste management to energy use and greenhouse gas emission reduction in the Netherlands, Resour. Conserv. Recy., 77, 13–21, https://doi.org/10.1016/j.resconrec.2013.04.002, 2013.
Demirbas, A.: Combustion characteristics of different biomass fuels, Prog. Energ. Combust., 30, 219–230, https://doi.org/10.1016/j.pecs.2003.10.004, 2004.
Directive 2008/98/EC OF THE EUROPEAN PARLIAMENT AND OF THE COUNCIL on waste (Waste Framework Directive), Data on waste generation and waste management, http://ec.europa.eu/environment/waste/framework/, last access: November 2017.
EUROSTAT database: European Commission, Brussels, http://epp.eurostat.ec.europa.eu/ (last access: September 2017), 2016.
Evangelisti, S., Lettieri, P., Borello, D., and Clift, R.: Life cycle assessment of energy from waste via anaerobic digestion: A UK case study, Waste Management, 34, 226–237, https://doi.org/10.1016/j.wasman.2013.09.013, 2014.
FAOSTAT: Food and Agriculture Organization, Data retrieved, http://www.fao.org/faostat/en/#data/GB (last access: June 2015), 2012.
FAOSTAT: Food and Agriculture Organization, Rome, http://faostat.fao.org (last access: November 2017), 2016.
GEA and IIASA: Global Energy Assessment: Toward a Sustainable Future, Cambridge University Press, Cambridge, UK and New York, USA, 2012.
Ghisellini, P., Cialani, C., and Ulgiati, S.: A review on circular economy: the expected transition to a balanced interplay of environmental and economic systems, J. Clean. Prod., 114, 11–32, https://doi.org/10.1016/j.jclepro.2015.09.007, 2016.
Haas, W., Krausmann, F., Wiedenhofer, D., and Heinz, M.: How Circular is the Global Economy?: An Assessment of Material Flows, Waste Production, and Recycling in the European Union and the World in 2005, J. Ind. Ecol., 19, 765–777, https://doi.org/10.1111/jiec.12244, 2015.
Höglund-Isaksson, L.: Global anthropogenic methane emissions 2005–2030: technical mitigation potentials and costs, Atmos. Chem. Phys., 12, 9079–9096, https://doi.org/10.5194/acp-12-9079-2012, 2012.
Höglund-Isaksson, L.: GAINS model review of potentials and cost for reducing methane emissions from EU agriculture, IIASA, Laxenburg, Austria, 2015.
Höglund-Isaksson, L., Winiwarter, W., Purohit, P., and Gómez-Sanabria: Non-CO2 greenhouse gas emissions, mitigation potentials and costs in the EU-28 from 2005 to 2050, 2015.
Hoornweg, D. and Bhada-Tata, P.: What a waste. A global review of solid waste management, Urban development series knowledge papers, The World Bank, 2012.
Hopewell, J., Dvorak, R., and Kosior, E.: Plastics recycling: challenges and opportunities, Philos. T. R. Soc. B, 364, 2115–2126, https://doi.org/10.1098/rstb.2008.0311, 2009.
International Energy Agency: World Energy Outlook 2017, https://www.iea.org/weo2017/ (last access: April 2018), 2017.
IPCC: IPCC Guidelines for National Greenhouse Gas Inventories 2006, Volume 5, Chapter 2 and 6, https://www.ipcc-nggip.iges.or.jp/public/2006gl/vol5.html (5 March 2018), 2006.
Jones, F. C., Blomqvist, E. W., Bisaillon, M., Lindberg, D. K., and Hupa, M.: Determination of fossil carbon content in Swedish waste fuel by four different methods, Waste Manag. Res., 31, 1052–1061, https://doi.org/10.1177/0734242X13490985, 2013.
Liu, Y., Sun, W., and Liu, J.: Greenhouse gas emissions from different municipal solid waste management scenarios in China: Based on carbon and energy flow analysis, Waste Manage., 68, 653–661, https://doi.org/10.1016/j.wasman.2017.06.020, 2017.
Liu, Z., Yin, H., Dang, Z., and Liu, Y.: Dissolved Methane: A Hurdle for Anaerobic Treatment of Municipal Wastewater, Environ. Sci. Technol., 48, 889–890, https://doi.org/10.1021/es405553j, 2014.
Manaf, L. A., Samah, M. A. A., and Zukki, N. I. M.: Municipal solid waste management in Malaysia: Practices and challenges, Waste Manage., 29, 2902–2906, https://doi.org/10.1016/j.wasman.2008.07.015, 2009.
Mao, C., Feng, Y., Wang, X., and Ren, G.: Review on research achievements of biogas from anaerobic digestion, Renew. Sust. Energ. Rev., 45, 540–555, https://doi.org/10.1016/j.rser.2015.02.032, 2015.
Marshall, R. E. and Farahbakhsh, K.: Systems approaches to integrated solid waste management in developing countries, Waste Manage., 33, 988–1003, https://doi.org/10.1016/j.wasman.2012.12.023, 2013.
McCarty, P. L., Bae, J., and Kim, J.: Domestic Wastewater Treatment as a Net Energy Producer–Can This be Achieved?, Environ. Sci. Technol., 45, 7100–7106, https://doi.org/10.1021/es2014264, 2011.
Mor, S., Ravindra, K., De Visscher, A., Dahiya, R. P., and Chandra, A.: Municipal solid waste characterization and its assessment for potential methane generation: A case study, Sci. Total Environ., 371, 1–10, https://doi.org/10.1016/j.scitotenv.2006.04.014, 2006.
OECD: Statistical Database. Organisation for Economic Co-operation and Development (OECD), Paris, available at: http://stats.oecd.org/, retrieved 2016.
Pokhrel, D. and Viraraghavan, T.: Municipal solid waste management in Nepal: practices and challenges, Waste Manage., 25, 555–562, https://doi.org/10.1016/j.wasman.2005.01.020, 2005.
Singh, S., Kumar, S., Jain, M. C., and Kumar, D.: Increased biogas production using microbial stimulants, Bioresource Technol., 78, 313–316, https://doi.org/10.1016/S0960-8524(00)00143-7, 2001.
Stillwell, A. S., Hoppock, D. C., and Webber, M. E.: Energy Recovery from Wastewater Treatment Plants in the United States: A Case Study of the Energy-Water Nexus, Sustainability, 2, 945–962, 2010.
SWEEPNET: Regional profile on the solid waste management situation in Middle East and North Africa, 2012.
UNEP and ISWA: Global Waste Management Outlook, United Nations Environement Programme, 2015.
UNFCCC: National Inventory Submissions 2016, available at: https://unfccc.int/process/transparency-and-reporting/reporting-and-review-under-the-convention/greenhouse-gas-inventories/submissions-of-annual-greenhouse-gas-inventories-for-2017/submissions-of-annual-ghg-inventories-2016 (retrieved 2017), 2016.
Velis, C. A.: Global recycling markets – plastic waste: A story for one player – China. Report prepared by FUELogy and formatted by D-waste on behalf of International Solid Waste Association – Globalisation and Waste Management Task Force, ISWA, 2014.
Wilson, D. C., Rodic, L., Scheinberg, A., Velis, C. A., and Alabaster, G.: Comparative analysis of solid waste management in 20 cities, Waste Manag. Res., 30, 237–254, https://doi.org/10.1177/0734242X12437569, 2012.
World Bank Open Data: available at: https://data.worldbank.org/, retrieved 2016.