 | 28 Nov 2025
Characterization of the hydraulic properties of a planned High Temperature Aquifer Thermal Energy Storage (HT-ATES) system during well development
Cornelius O. Schwarze
Liang Pei
Lioba Virchow
Elena Petrova
Ben Norden
Simona Regenspurg
Katrin Kieling
Guido Blöcher
Stefan Kranz
The utilization of subsurface reservoirs for geothermal or aquifer thermal energy storage applications requires the drilling of boreholes, which are part of the site infrastructure. For a successful utilization and implementation of this subsurface infrastructure, it is important to know the hydraulic characteristics of the technically connected reservoir system as reliable and early as possible. Comprehensive hydraulic tests required for this are usually carried out after well completion and first filter developing in order to minimize possible influence of the drilling mud and any alteration of the near wellbore area caused by the drilling operation. This normally requires a temporal decoupling of the first well development and the main hydraulic test which is carried out afterwards. In order to optimize this procedure, a combination of well development and hydraulic testing was performed at the High Temperature Aquifer Thermal Energy Storage (HT-ATES) site in Berlin Adlershof. It is shown that hydraulic parameters, such as transmissibility, permeability, productivity index (PI), and skin factor can also be determined already during the well development. For this purpose, a five- and a two-stage step-rate test were carried out, each with subsequent shut-in phases. The combination of analytical and numerical modelling was employed to analyze the aquifer performance. For the analysis, the concept of radially varying permeability around the borehole was developed to account for the area of influence due to drilling mud infiltration and to determine its transient course. The application of a combination of a classic Pressure Transient Analysis (PTA) together with numerical models enabled reliable characterization of the aquifer. The methodical approach developed herein delivers a permeability of 1.5 to 2.0 D and a PI of 1.1 to 1.2 L s−1 bar−1 for the Hettangian (Jurassic) HT-ATES target aquifer, which is screened between 369 and 387 m True Vertical Depth (TVD). The method enabled to determine the drilling mud influence area of approximately 0.32 m which corresponds to a skin factor of 0.7 to 1.8.
- Article
(4317 KB) - Full-text XML
- BibTeX
- EndNote


Transitioning to sustainable energy systems is a key strategy for mitigating climate change and ensuring a reliable energy supply (Fleuchaus et al., 2018). A significant challenge in this context is developing a sustainable and efficient heat supply for urban environments. A HT-ATES system represents an innovative solution by storing surplus heat during periods of low demand, such as summer, and making it available during high-demand seasons, such as winter (Fleuchaus et al., 2018; Dinçer and Rosen, 2010; Bauer et al., 2010). Utilizing the geological subsurface, HT-ATES offers a large-scale energy storage solution, with capacities reaching the gigawatt-hour range. This makes HT-ATES particularly well-suited for urban areas where substantial energy is needed for heating and cooling (Fleuchaus et al., 2018; Bauer et al., 2010). The efficient injection and extraction of thermal energy by heat-loaded formation water within the aquifers is essential, making an accurate exploration of their hydraulic properties fundamental for successful HT-ATES operation.
Key aquifer properties that influence storage efficiency include transmissibility, permeability, groundwater flow velocity and direction (Blöcher et al., 2024). Additionally, the most important well-specific characteristics for HT-ATES well performance are the productivity index and the skin effect (Blöcher et al., 2024). The productivity index PI quantifies how much fluid a borehole can produce per unit of pressure drop. The skin factor describes the condition of the well and its hydraulic connection to the reservoir. The skin effect represents the additional pressure loss near the wellbore caused by changes in formation properties from drilling or completion. A positive skin indicates damage or poor connectivity, increasing flow resistance, while a negative skin reflects enhanced flow and improved well performance. Before obtaining these parameters, typically, well development takes place prior to conducting the single-well tests to ensure the removal of fine particles and drilling residues from the wellbore and surrounding formation, thereby improving the hydraulic connection between the well and the aquifer. This step minimizes wellbore skin effects and enhances the reliability of test results by providing more accurate measurements of aquifer properties (Maliva, 2016). Single-well aquifer tests are commonly conducted afterwards to estimate hydraulic properties at the initial stages of site investigation and when larger scale pumping test or tracer tomography at a doublet system (Blöcher et al., 2024, 2016) are not feasible due to the high cost or access constraints. Step-rate tests with shut-in phases are particularly effective for determining transmissibility, permeability, skin effect, and productivity index by examining drawdown and buildup (Ramey, 1982; Birsoy and Summers, 1980; Clark, 1977; Rorabaugh, 1953; Jacob, 1947) and to detect formation and wellbore damage (Eseimokumoh et al, 2021). These tests are often analyzed using the analytical or grapho-analytical methods like Cooper-Jacob method (Cooper and Jacob, 1946), a simplified technique for evaluating permeability in aquifers (Blöcher et al., 2024; Kahuda and Pech, 2020; Holub et al., 2019; Halford et al., 2005).
To optimize rig time (testing time), we are assessing the feasibility of conducting a hydraulic test during well development. This enable us to evaluate the hydraulic progress and quantify the extent to which the area surrounding the borehole has been impacted by the drilling operation. The ensuing results are presented herewith. Subsequently, we use a numeric model to estimate the extent to which the surrounding formation was affected by the drilling process. Moreover, the technologies presented here can be adapted for broader reservoir characterization beyond HT-ATES applications.
Berlin is situated within the North German Basin, one of the most prominent sedimentary structures in the Southern Permian Basin which extends from the United Kingdom to Poland. This extensive basin extends from England in the west to Poland's eastern border. It originated during the Permian period and contains a sedimentary sequence with 7 km in thickness in the central part of the basin (Hoth et al., 1993).
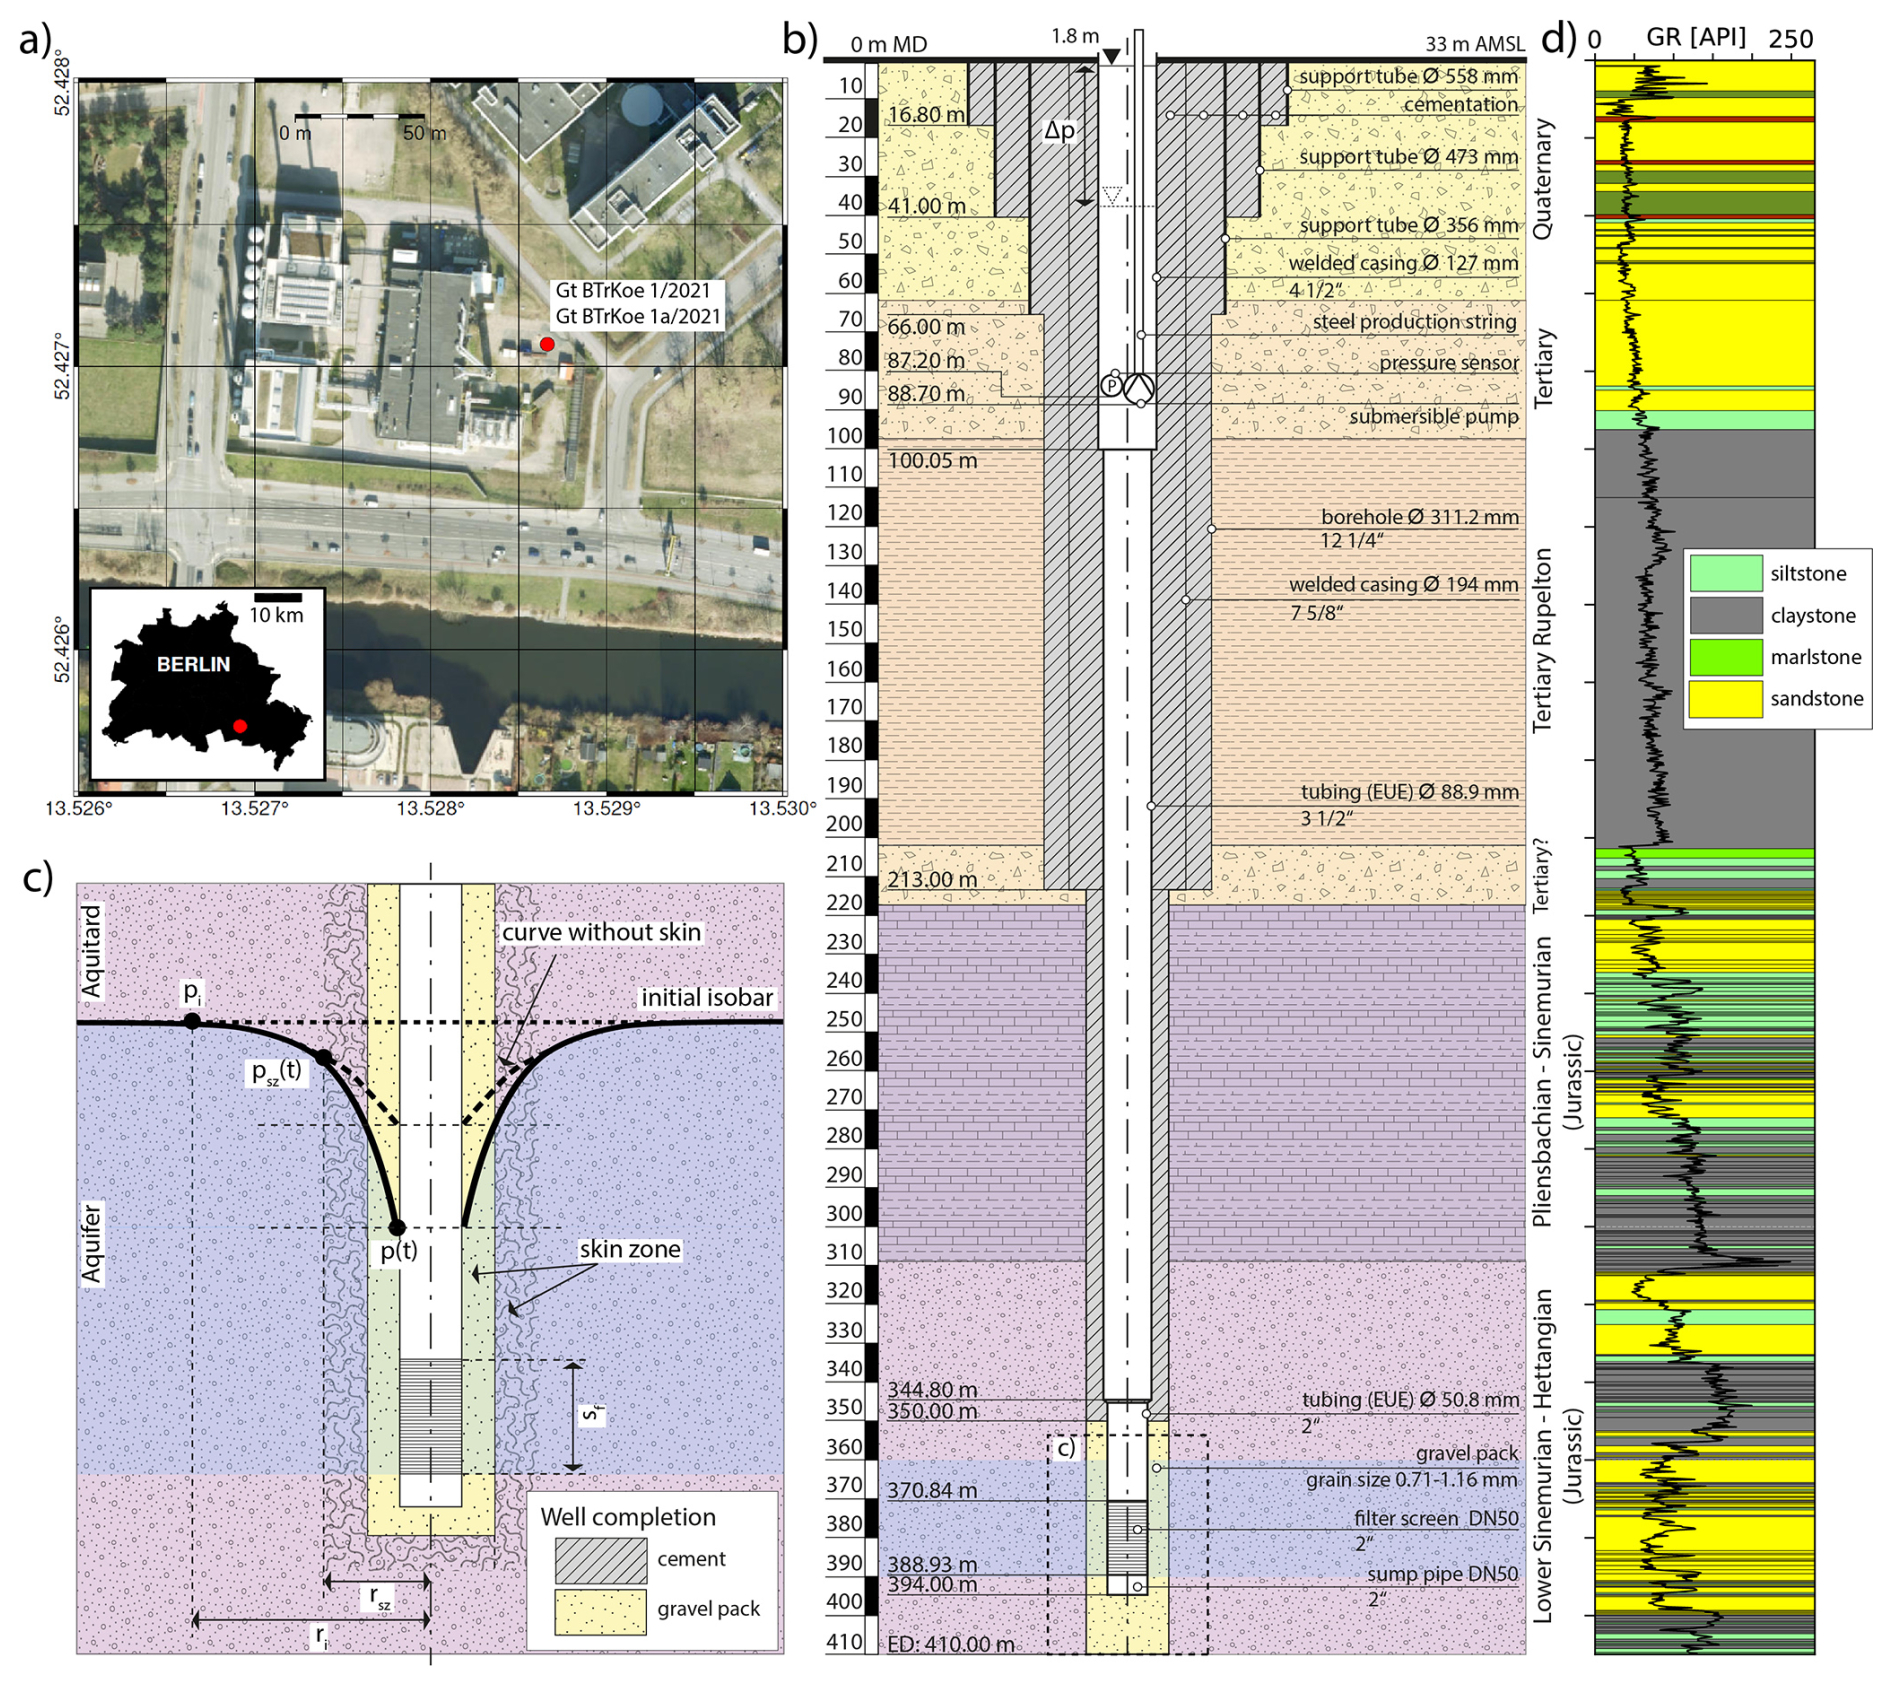
Figure 1(a) Map of the borehole site including the wellbore Gt BTrKoe 1/2021 and the side track Gt BTrKoe 1a/2021 (red dot) in south-east of Berlin, Adlershof (© Google Maps 2025). The inlay shows the city boundary of Berlin. (b) Borehole completion of the side track Gt BTrKoe 1a/2021 and lithology (Norden et al., 2023). (c) Zoom of the near well area with ri – investigation radius; rsz – radius of the skin zone; Sf – length of filter screen; p(t) – measured time-dependent pressure head at the wellbore; psz(t) – time-dependent pressure head at the radial extension rsz; pi – hydrostatic pressure head. (d) Gamma Ray (GR) values and lithology (Norden et al., 2023).
In Adlershof, southeast Berlin (Fig. 1a), the research well Gt BTrKoe 1/2021 was drilled to 456 m Measured Depth (MD) in 2021. Due to a cementing failure, a side track, the Gt BTrKoe 1a/2021, was completed from 213 m MD to a depth of 410 m MD in 2024. Along the entire length of the borehole, four principal sedimentary units were encountered (Fig. 1b): (1) Quaternary sediments down to 62 m MD, (2) Tertiary sediments extending to 202 m MD, with Rupelian Clay reaching from 98 to 202 m MD. The Rupelian Clay above acts as a regional aquitard, effectively isolating the shallow freshwater aquifers from the deeper, more saline groundwater. (3) Pliensbachian-Sinemurian sediments down to 310 m MD (Norden et al., 2023). (4) The Hettangian Formation was selected as the reservoir for an HT-ATES system due to its thickness and promising initial permeability and porosity estimates obtained from drill core and well logs characterization and well log interpretation (Norden et al., 2023). The aquifer has a thickness of 30 m, with a filter screen installed between 370.84 and 388.93 m MD (369 to 387 m TVD) with a length of ca. 18 m. A gravel pack extends significantly deeper, from 350 to 410 m MD, with a radius of 85 mm. The remaining section above the gravel pack was cemented.
On 29 August 2024, following drilling and borehole completion, approximately 6 m3 of water were extracted by pumping. Subsequently, on 2 September 2024, an airlift test was conducted, followed by a production phase that produced a water-drilling mud mixture. Neutron-neutron well logging (Norden et al., 2023) indicates a mean total porosity of the interval between 369 to 387 m TVD of approximately 0.3.
During 3 and 4 September 2024, two step-rate tests with subsequent shut-in were performed, which are examined in greater detail in this study. The test setup, is described in detail in Sect. 3.2.
To evaluate the productivity index PI and the borehole's skin effect s, as well as their variations under different flow rates , two step-rate tests followed by a shut-in phase were conducted during 3 and 4 September 2024. The pressure buildups observed during the shut-in periods on 3 September (17:36:10 to 20:30:00 LT, local time) and 4 September (17:03:00 to 23:00:00 LT) were analyzed to determine the transmissibility T and permeability using the length of filter screen Sf.
3.1 Analytical evaluation of step-rate tests and subsequent shut-ins
For buildup tests conducted with a single constant-rate step, the Horner semi-log analysis (Horner, 1951) is commonly applied. This method was used in the study as the final step was sufficiently long. With the Horner method, the residual drawdown Δp is plotted against the logarithm of the Horner time tH. The transmissibility and permeability are estimated using the semi-log (Cooper and Jacob, 1946) method, applied to the second straight-line segment of the drawdown curve. The transmissibility and henceforth the permeability are determined from shut-in using the equation:
where t is the time since production started, t′ is the time since shut-in. The parameter μ represents the dynamic viscosity of water at 23 °C, which is 1 × 10⁻³ Pa s.
The step-rate tests were analyzed using the Bierschenk (1963) method, as described by Langguth and Voigt (2004), to determine the PI and the skin effect s. The PI is defined as the flow rate per unit pressure drop and serves as an indicator of the production potential of the well:
Furthermore, the validation of the PI and the corresponding transmissibility value was carried out using the approach described in Lee (1982):
with R the radius of the reservoir and r the borehole radius (R≫r; R=1000 m).
To separate linear and non-linear components of the total drawdown caused by borehole effects, the following equation was used (Bierschenk, 1963):
where represents the linear part and accounts for the non-linear part of the drawdown. These constants allowed the separation of aquifer effects from borehole-specific effects, such as the skin effect s.
The skin effect s consolidates all borehole effects and was calculated using the following equation:
where Δps represents the pressure drawdown caused by the skin effect s, corresponding to the non-linear term . The parameter (Guo et al., 2008) denotes the water formation volume factor with volume of reservoir Vres and volume of the surrounding rock Vsur.
In Eq. (6), a relationship between the discharge from the apparent composite aquifer and the recharge into the wellbore during the shut-in phase is provided. There c and t denote the hydraulic conductivity of the skin zone and the time span of a studied shut-in stage. We evaluated the unknown pressure head psz(t) at the radial extension of the skin zone using the far field hydrostatic pressure head pi on top of the aquifer (Fig. 1c). Such evaluation followed the assumption that the pressure at the radial extension rsz was recovered sufficiently fast at the onset of shut-in due to the differential permeability of the aquifer material to the skin zone. The time dependent pressure head at the wellbore p(t) was evaluated following Eq. (7). Therein pm(t), Ds, Da, ρw and g denote sequentially the pressure as measured using the electronic sensor during shut-in, the depth of deployment of this sensor, the depth of the aquifer top, the density of water and the gravitational acceleration:
and
where Sa represents the area corresponding to the change in water level within the borehole, excluding the area occupied by the production string (Fig. 1b). We conducted and compared two analytical and one numerical method to quantify the thickness and transmissibility of the damage zone and aquifer. The transmissibility, permeability, productivity index, and skin effect were determined from step-rate and shut-in tests using a Python script to solve the analytic formulars and to carry out linear fitting, hereafter referred to as the analytical analysis. The results were compared with those obtained from the commercial software Kappa Saphir®; hereafter referred to as the standard Pressure Transient Analysis (PTA). Numerical simulations were conducted using COMSOL® and are hereafter referred to as the numerical analysis.
3.2 Test setup
On both test days, a submersible pump was positioned at a depth of 88.70 m MD (Fig. 1b). The pressure was continuously monitored with a frequency of 1 Hz using an electrical pressure transducer placed at a depth of 87.20 m MD. On 3 September, a step-rate test was conducted with four constant-rate production steps. The flow rates increased from 7.24 to 13.99 m3 h−1 (Fig. 2). The total production period lasted 224.6 min, with a cumulative water production of 43 m3, leading to a total pressure drop of 3.39 bar. On 4 September, two production rates of 10.00 and 13.77 m3 h−1 were applied during the test (Fig. 3). The total duration of the production phase was 573.6 min, with a water production of 100.4 m3, leading to a total pressure drop of 3.46 bar.
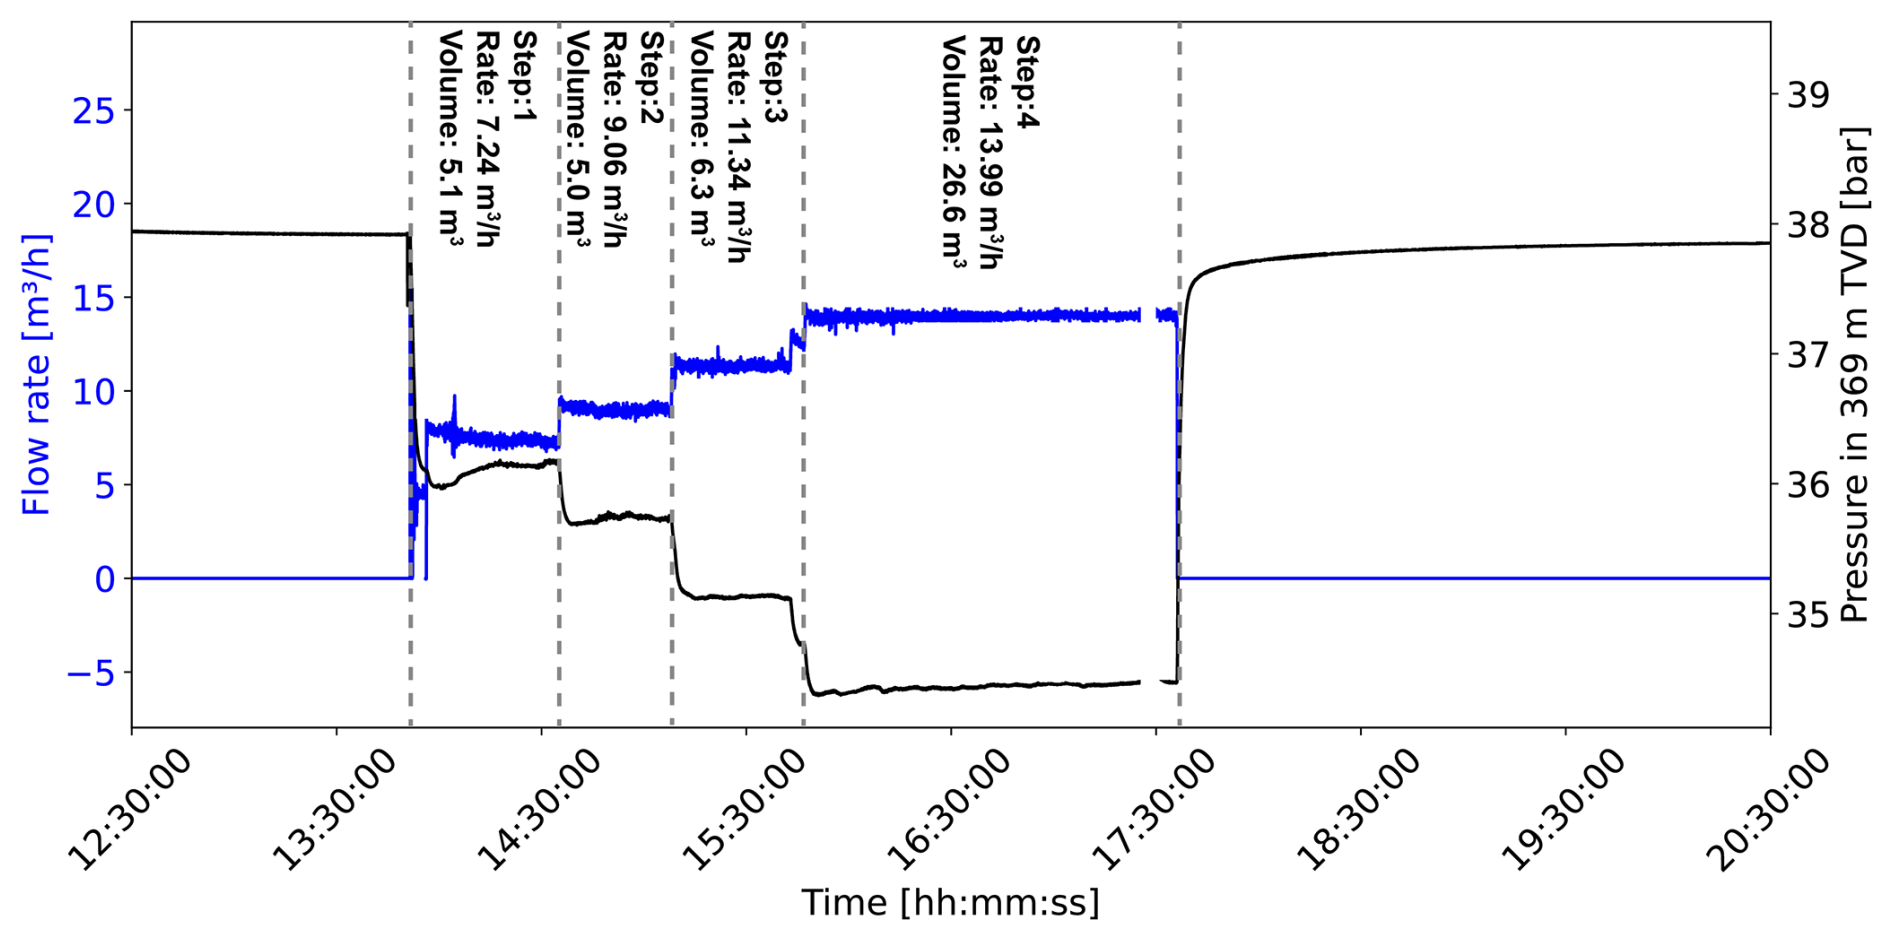
Figure 2Step-rate test on 3 September with flow rate (blue) and pressure (black) at the top of the reservoir in 369 m TVD.
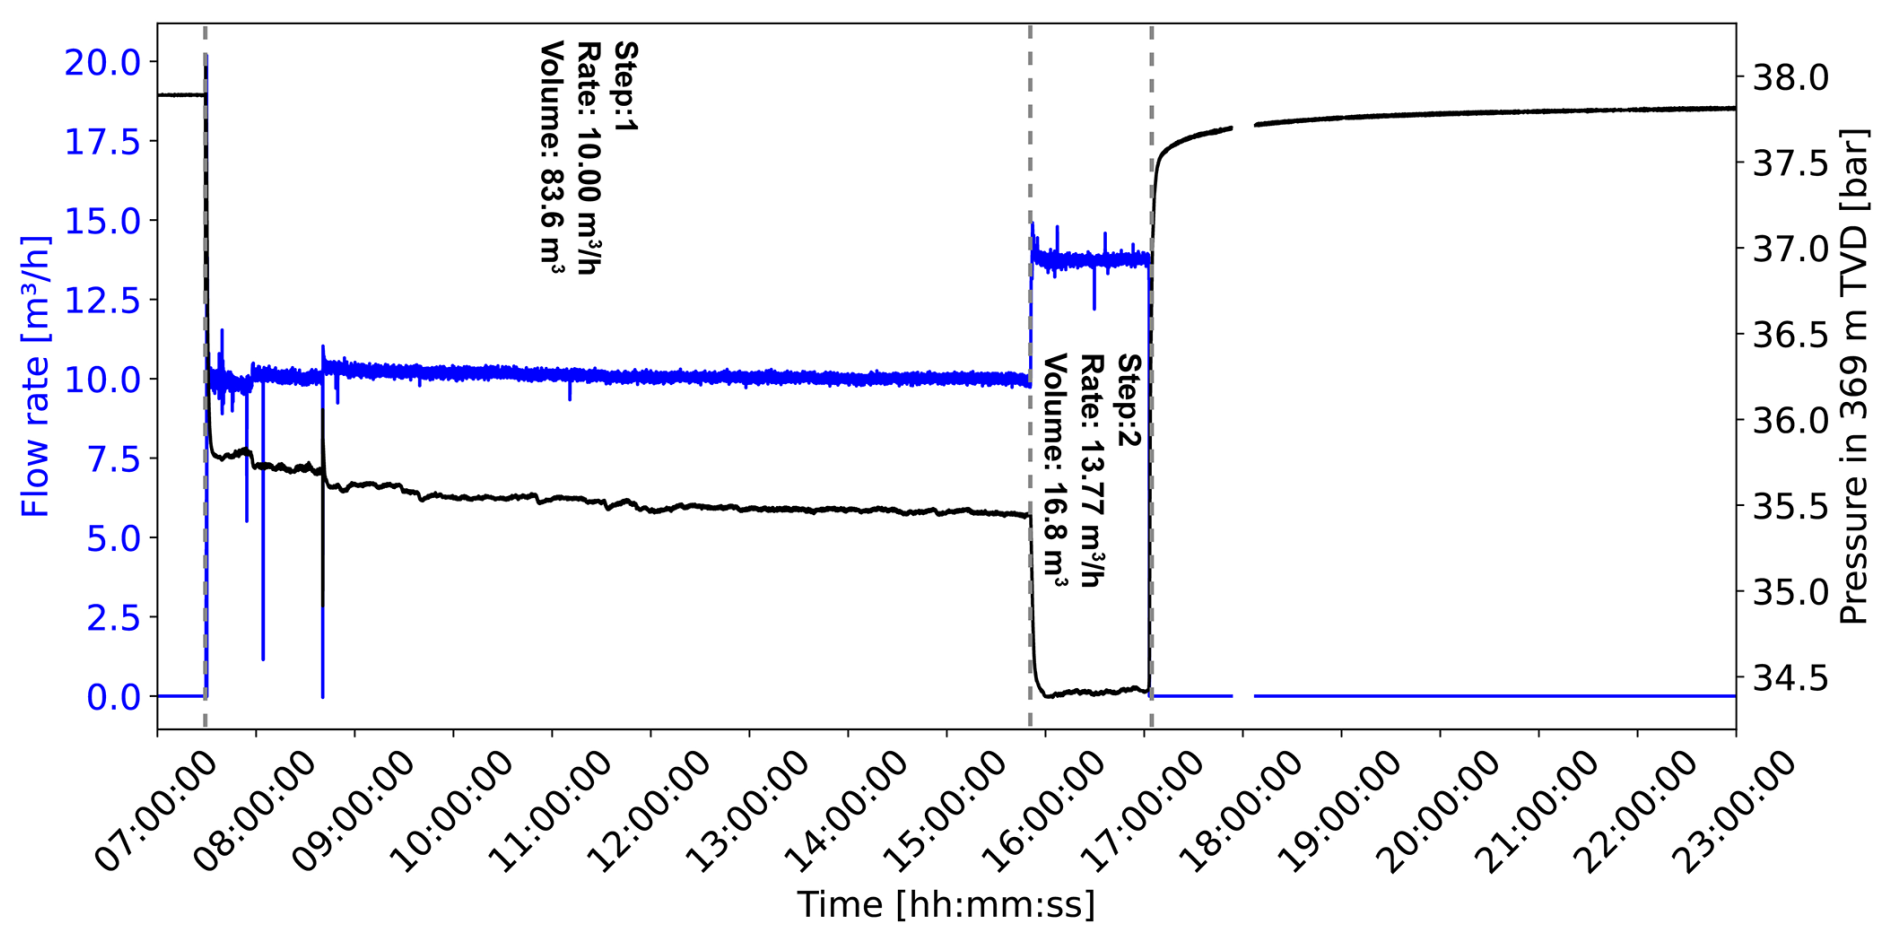
Figure 3Step-rate test on 4 September with flow rate and pressure at the top of the reservoir in 369 m TVD.
We present the results of the two test days, 3 and 4 September. The results of the hydraulic measurements are divided into shut-in and step-rate tests. The semi-log plot of Horner time for the shut-in periods are divided into two distinct time intervals: an early and a late interval (Figs. 4a and 5a). With the results of the analytical analysis and PTA, we calculate the approximations of the numerical analysis.
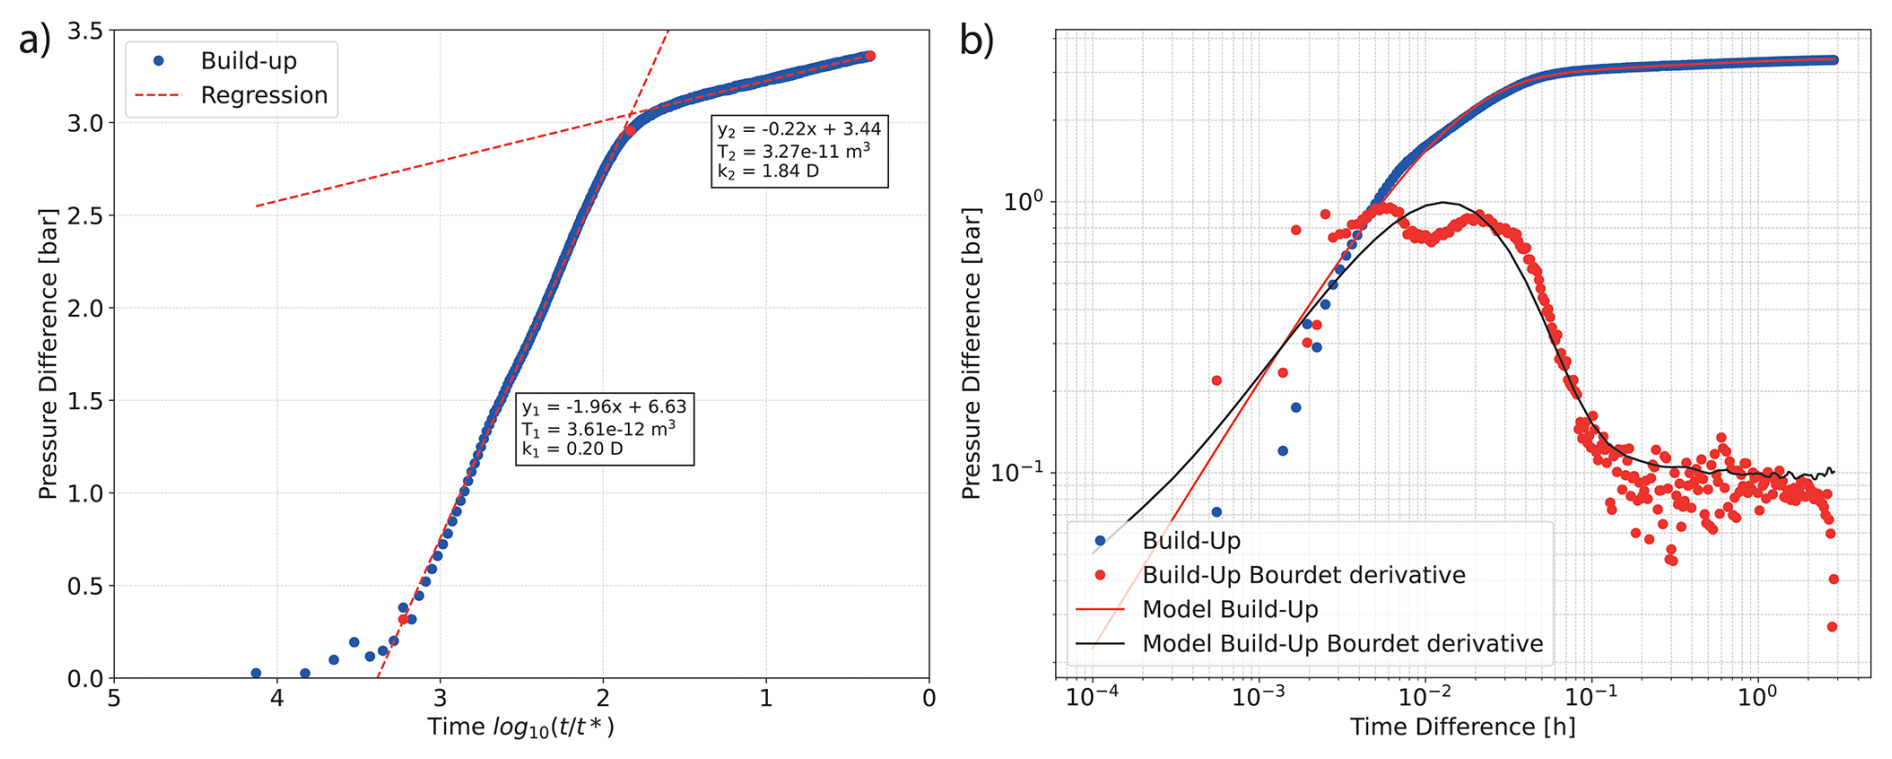
Figure 4(a) Semi-log analysis of pressure difference during the build-up of 3 September. Red lines show the linear regressions of the early (y1) and late (y2) time intervals and in the boxes, the derived values for transmissibility (T) and permeability (k). (b) Double-log plot of the pressure decline curve, including the derivative function, used for pressure matching corresponds to 3 September. Blue dots represent the pressure difference during build-up, while red dots indicate the derivative of the pressure over time. The red and black lines represent the analytical models generated using PTA.
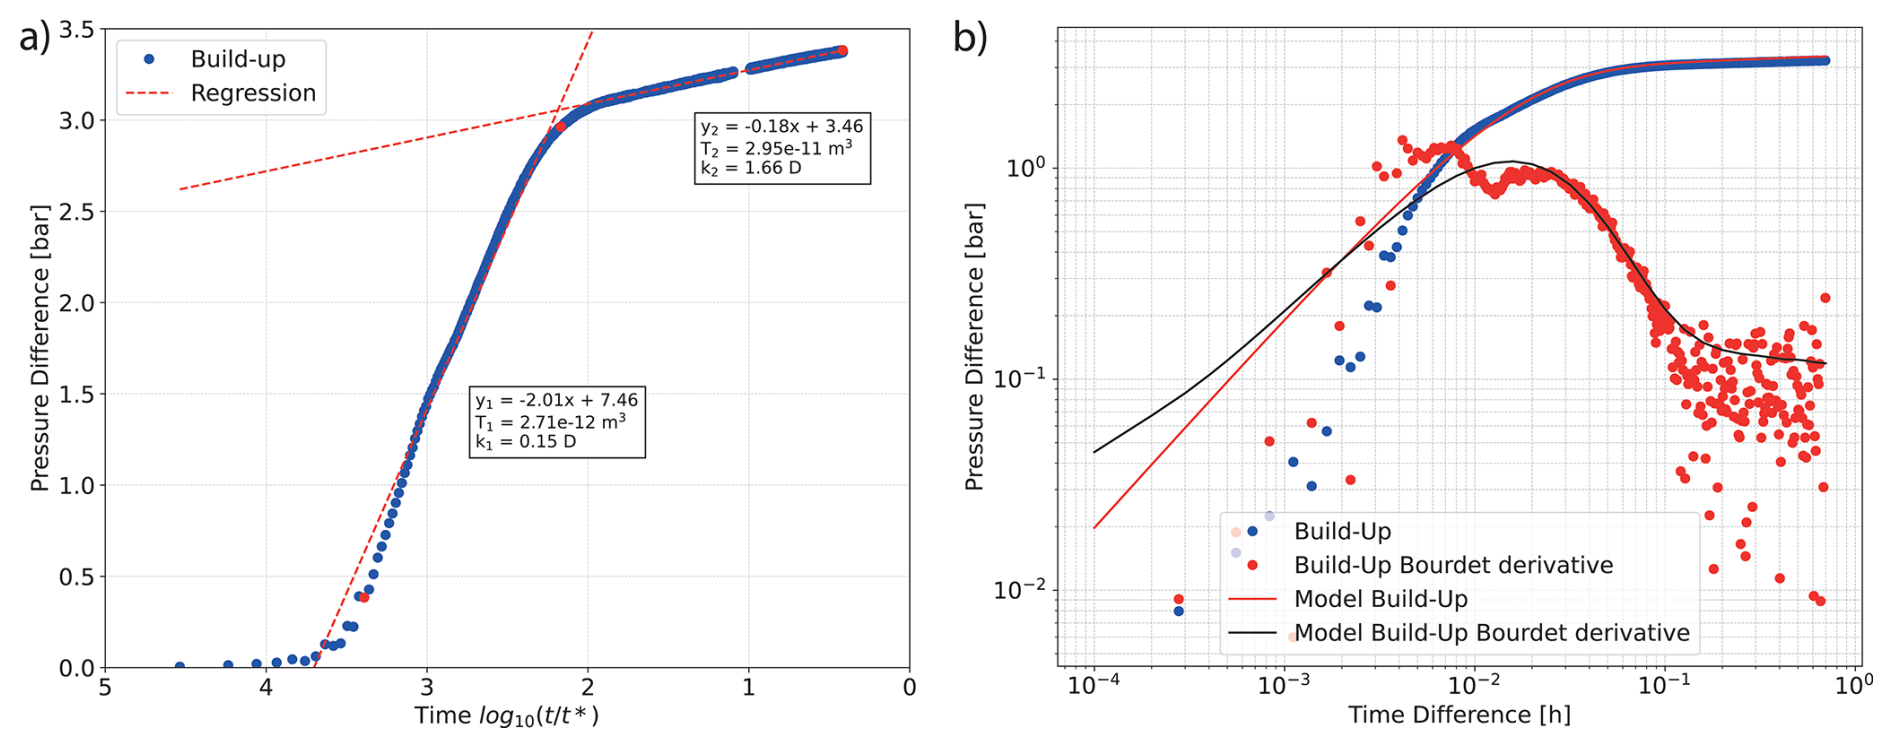
Figure 5(a) Semi-log analysis of pressure difference during the build-up of 4 September. Red lines show the linear regressions of the early (y1) and late (y2) time intervals and in the boxes, the derived values for transmissibility (T) and permeability (k). (b) Double-log plot of the pressure decline curve, including the derivative function, used for pressure matching corresponds to 3 September. Blue dots represent the pressure difference during build-up, while red dots indicate the derivative of the pressure over time. The red and black lines represent the analytical models generated using PTA.
4.1 Transmissibility from pressure built-up during shut-in
On 3 September, the early time interval y1, spans from 8 to 200 s, while the late time interval y2 extends from 200 s after shut-in until the end of the measurement period. For the early time interval after shut-in, analytical analysis yielded a T1 of 3.63 × 10⁻¹² m3 and a permeability k1 of 0.20 D and a transmissibility T2 of 3.28 × 10⁻¹¹ m3 and a permeability k2 of 1.85 D for the late time interval (Fig. 4a).
The analysis of the Horner time plot of the two-time intervals using PTA produced nearly identical permeability results with a skin factor of 4.0, reflecting additional resistance to flow near the wellbore caused. The derivative plot of the PTA reveals infinite radial flow during the late time intervals, beginning at 200 s for 3 September. In contrast, the early time intervals (< 200 s) reflect the effects of wellbore storage and skin effect (Fig. 4b). A distinct bump is observed in the early part of the derivative plot. The permeability and skin factor derived from the analytical models generated using PTA exhibit deviations. According to the analytical model, the permeability for 3 September is calculated to be 1.73 D, with a skin factor of 7.7. The radius of investigation during shut-in, as calculated using PTA, is on 3 September, ca. 20 m at the beginning of the early time interval and ca. 100 m at the start of the late time interval.
On 4 September, the early interval y1, from 14 to 235 s after shut-in, resulted in a transmissibility T1 of 2.72 × 10⁻¹² m3 and a permeability k1 of 0.154 D, calculated using analytical analysis and the late interval y2, from 235 s after shut-in to the end of the measurement period, yielded a transmissibility T2 of 2.97 × 10⁻¹¹ m3 and a permeability k2 of 1.67 D (Fig. 5a).
Similarly, PTA of the Horner time plot of the two-time intervals produced nearly identical permeability values with a skin factor of 1.5. The derivative plot reveals infinite radial flow during the late time intervals, beginning at 235 s for 4 September. And the early time intervals (< 235 s) reflect the effects of wellbore storage and skin effect (Fig. 5b). A distinct bump is observed in the early part of the derivative plot. The radius of investigation during shut-in, as calculated using PTA, is on 4 September, ca. 24 m at the beginning of the early time interval and ca. 100 m at the start of the late time interval. According to the analytical model, permeability for 4 September is calculated to be 1.46 D, with a skin factor of 6.3.
4.2 Productivity index and skin factor derived from drawdown during step-rate tests
On 3 September, PI decreased from 1.20 to 1.15 L s−1 bar−1 as the flow rate increased from 7.24 to 13.99 m3 h−1 (Table 1). Furthermore, a linear resistance coefficient of and a non-linear resistance coefficient of were determined. The non-linear drawdown component accounts for 4.8 % to 9.2 %. The skin factor increased from 0.76 at the first step to 1.53 at the final step. PTA calculate a skin factor for the drawdown of the step rate test of 4.9.
Table 1Summary of the average flow rate (), the corresponding pressure drawdown (Δp), and PI of the step rate tests. Additionally, the linear drawdown component (), the non-linear drawdown component () and the skin factor (s) are presented.
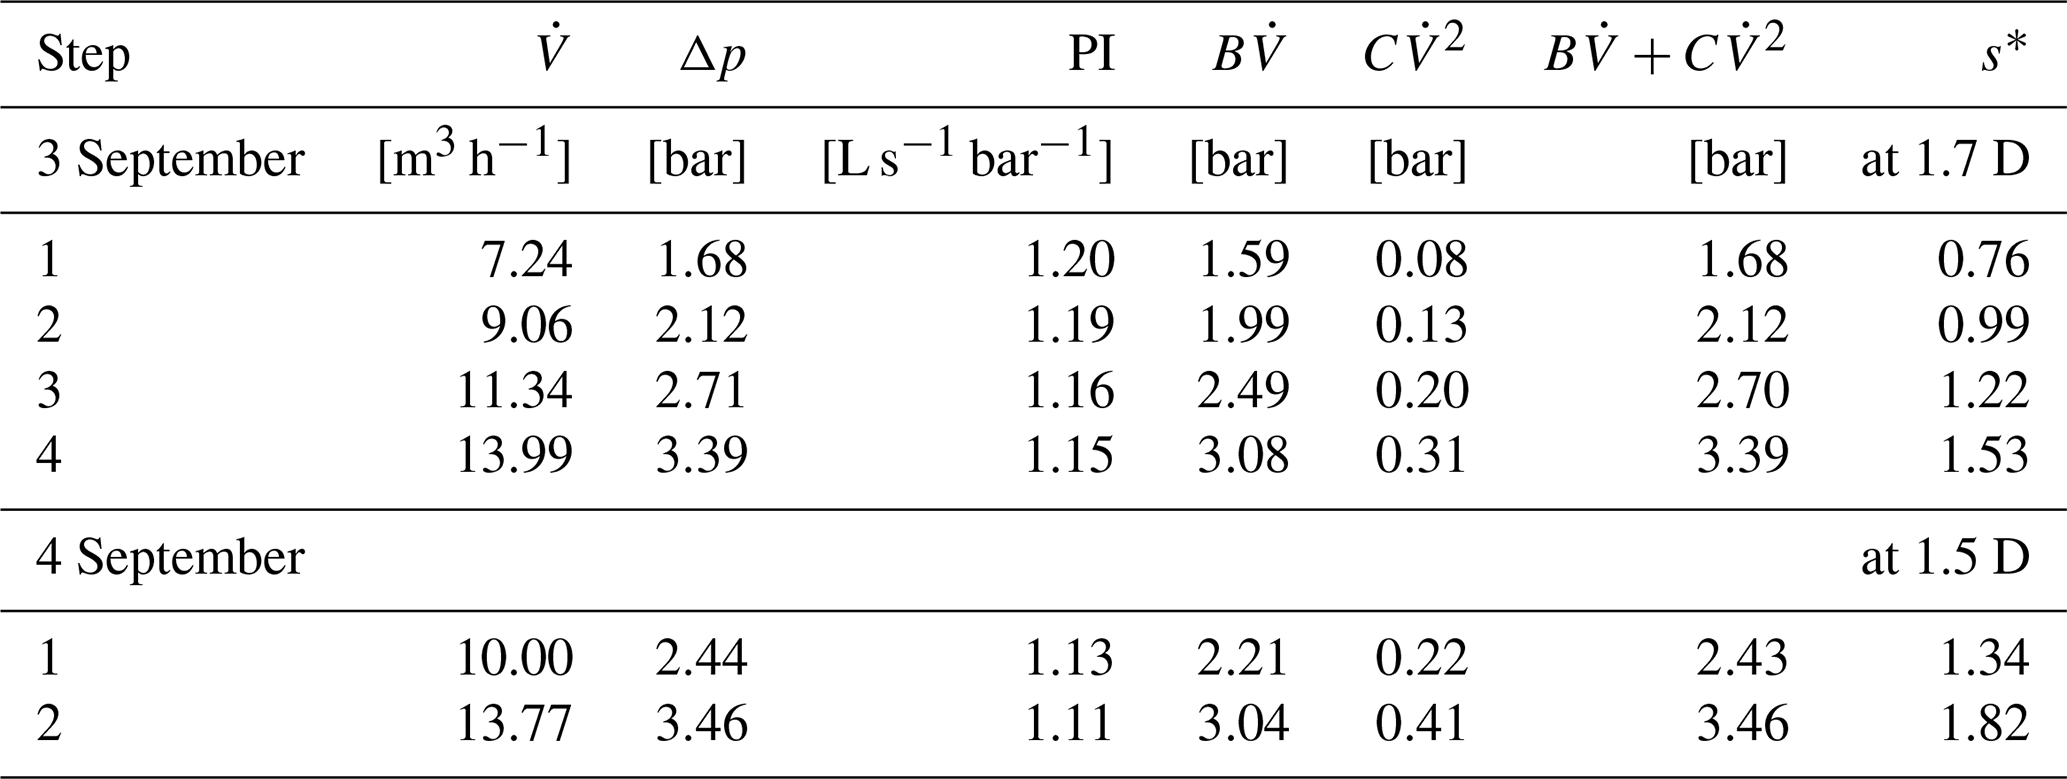
∗ The skin factor derived from PTA ranges from 4.0 to 7.7 on 3 September and from 1.5 to 6.3 on 4 September.
On 4 September, PI decreased from 1.13 to 1.11 L s−1 bar−1 as the flow rate increased from 10.00 to 13.77 m3 h−1. Furthermore, a linear resistance coefficient of and a non-linear resistance coefficient of were determined. The non-linear drawdown component accounts for 9.1 % to 11.9 %. The skin factor increased from 1.34 at the first step to 1.82 at the second step. PTA calculate a skin factor for the drawdown of the step rate test of 5.5.
4.3 Numerical analysis of skin zone radius
The dual-permeability of the planned aquifer thermal storage (Figs. 4a and 5a) as well as the calculated Bourdet derivative (Figs. 4b and 5b) implied the existence of a skin zone. Such skin zone was less permeable than the aquifer material. The skin zone and the aquifer material, together, could be regarded as a composite aquifer (Fig. 1c). With an effort to validate the estimated radial extension of the skin zone, we simulated the drawdown during the first production test stage on 4 September, at a defined production rate of 10 m3 h−1. The simulated drawdown aligned well with the measurements when the modeled radial extension of the skin zone was set to 0.32 m (Fig. 6), with a permeability of 0.15 D for the skin zone and 1.66 D for the aquifer (Fig. 5).
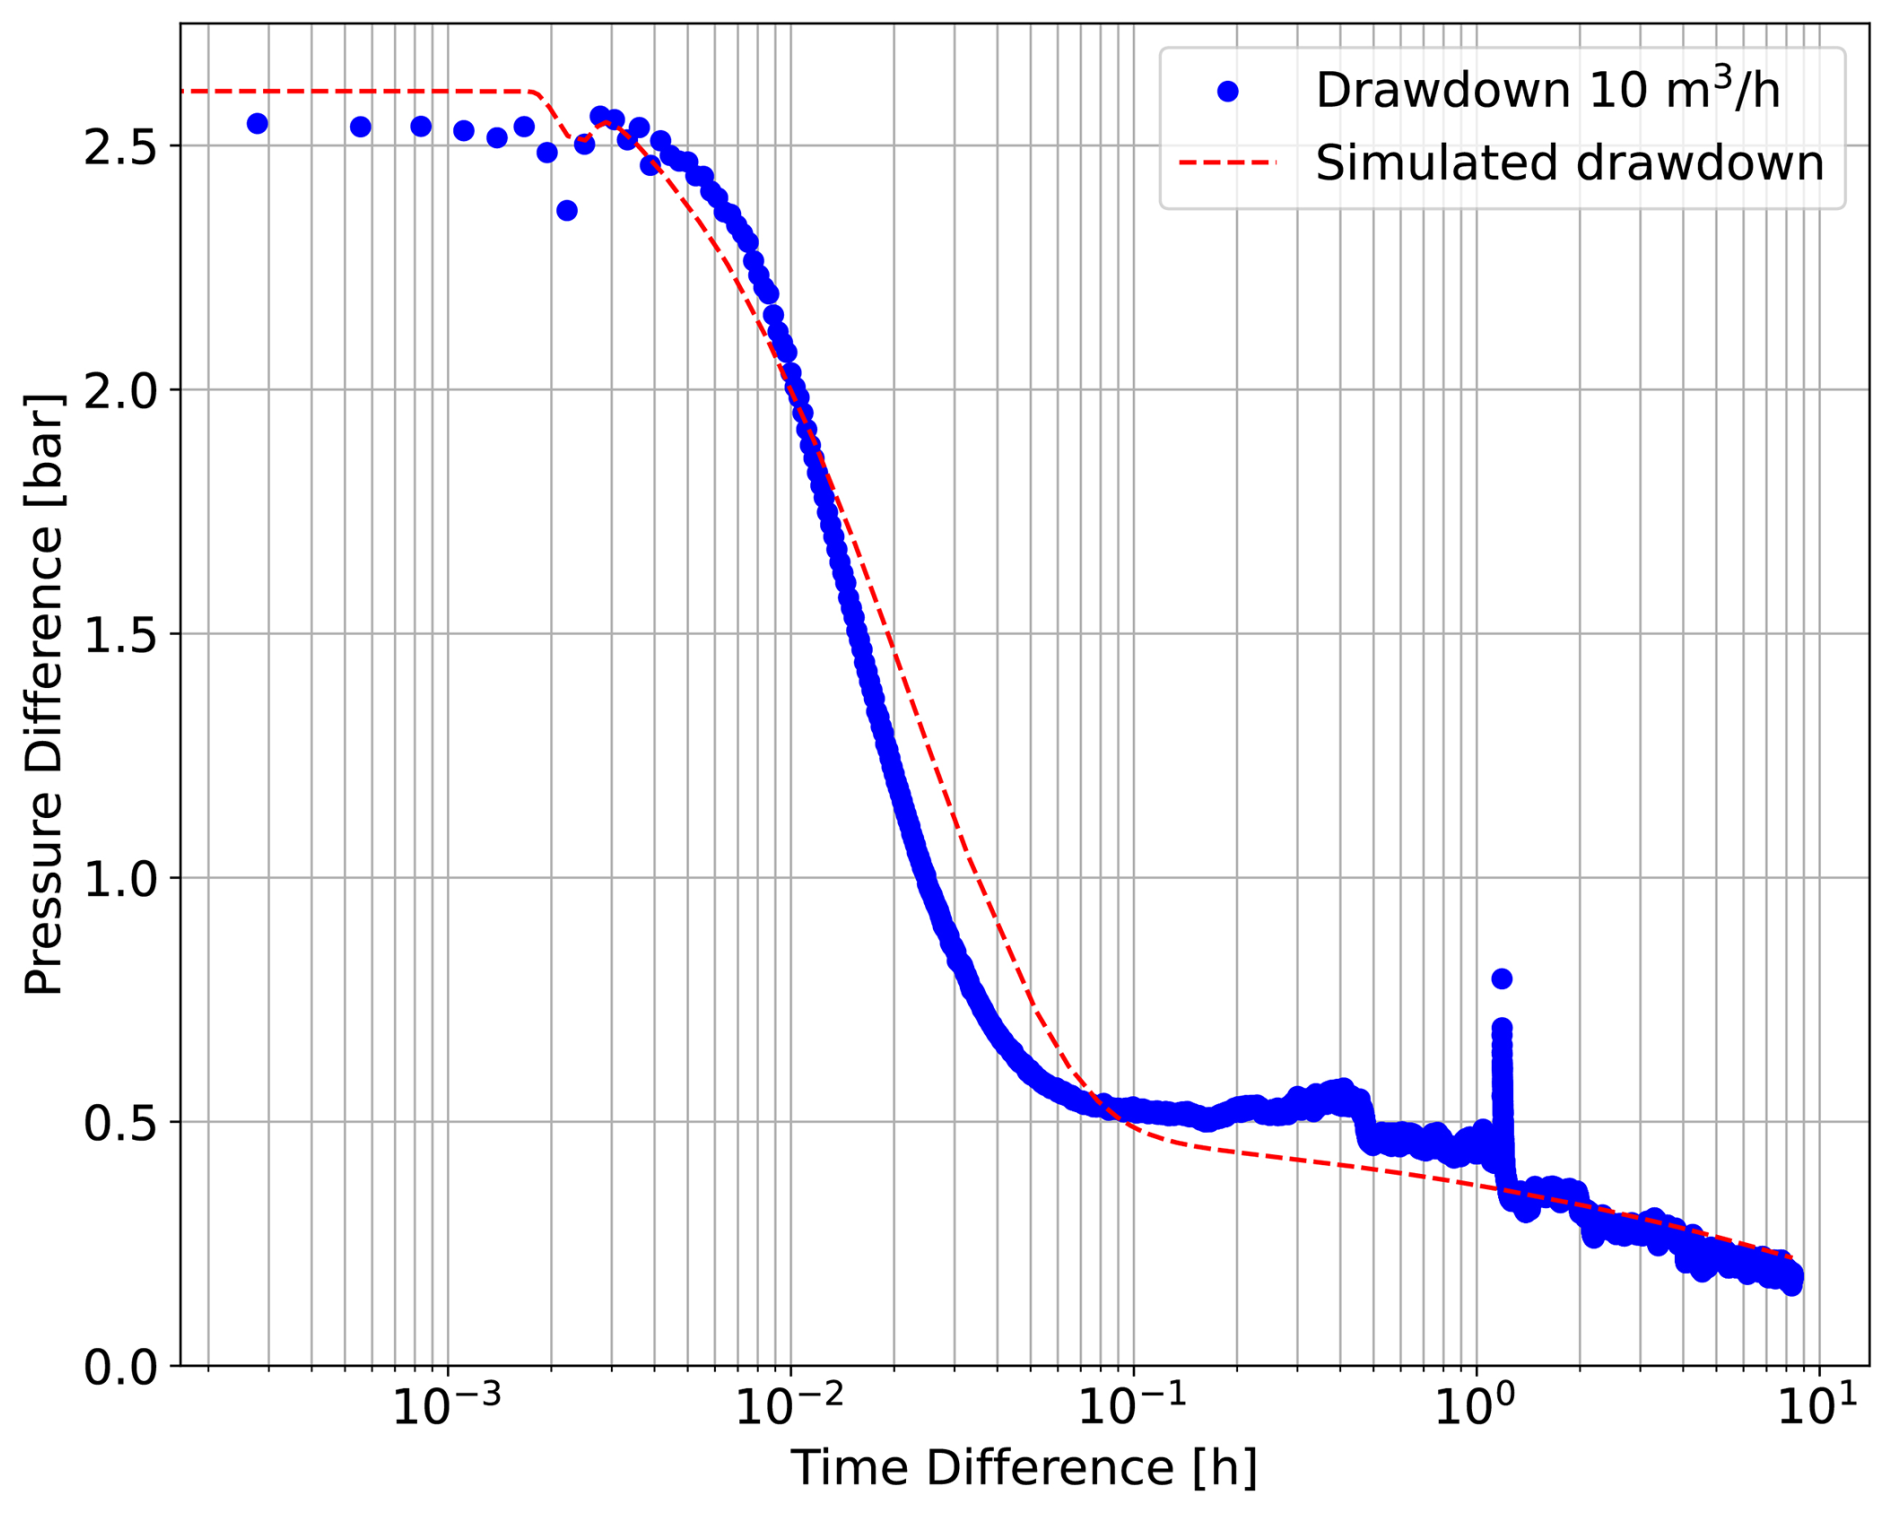
Figure 6Drawdown as measured in the first production test stage on 4 September with a flow rate of 10 m3 h−1 in comparison to the simulates with a radial extension of 0.32 m of the skin zone.
5.1 Radial distributed permeability
Two distinct time intervals with different permeabilities can be identified on both days in build-up pressure values. Kærgaard (1982) also observed two distinct time intervals during the step-rate test and the build up test: The first interval occurs immediately after the start or stop of the pump, during which the influence of well storage is significant. In this phase, the flow pattern within the well and its immediate surroundings in the aquifer is established. The drawdown in the well during this period is governed by the pumping yield, well storage, flow conditions within the well, screen design, gravel pack, skin zone, and the reservoir properties at a certain distance from the well. The second interval begins once the influence of well storage becomes negligible. During this phase, the drawdown in the well is primarily controlled by the reservoir characteristics. This observation of two distinct time intervals with different permeabilities may also indicate reservoir and wellbore damage (Eseimokumoh et al., 2021). The permeability values for the Hettangian (ca. 1.6–1.8 D) reservoir in this study are significantly higher than those reported in previous studies, which range from 0.4 to 1 D (Hoth, 1997). However, the permeabilities are consistent with air permeabilities measured on core samples (0.5–1.8 D) and with geophysical borehole log interpretations (0.8–2.0 D) reported by Norden et al. (2023).
Both PTA and analytical analysis indicate a radially heterogeneous permeability distribution, which is most likely attributable to a drilling-induced skin zone (Guo et al., 2017; Kærgaard, 1982). Notably, the estimated radius of influence varies considerably between methods, ranging from 0.32 m (numerical simulation) to 20 m (PTA).
-
The lack of mud losses observed during drilling of the Hettangian Formation is indicative of short-radius filter cake, and thus supports the assumption of a limited invasion zone.
-
Lateral resistivity logs acquired during open-hole logging of the sidetrack reveal the presence of a filter cake with a radial extent of approximately 0.3 to 0.5 m.
-
The radius of investigation after Van Poolen (1964) and Muskat (1934) for an extracted volume of 100 m3 (4 September), based on a reservoir thickness of 18 m, a permeability of 1.5 D, and a porosity of 0.3, is approximately 100 m. This result is consistent with the findings of the PTA.
-
An order-of-magnitude estimate suggests that the extracted water volume of 100 m3, assuming a porosity of 0.3, corresponds to an influenced pore volume of 333.33 m3. With a reservoir thickness of 18 m, this results in an affected area of 27.78 m2. Assuming radial flow, the corresponding radius is approximately 2.43 m.
Therefore, we assume that PTA tends to yield uncertain results in practice, while numerical analysis can provide a more accurate representation of the radius of influence. Furthermore, it is remarkable that both the skin and the skin zone remained unchanged over the two-day interval under comparable flow conditions.
However, PTA struggles to accurately interpret changes in permeability in the near-wellbore region. These changes are not well represented in the PTA models and are instead attributed to the skin value. Consequently, the skin values derived using PTA are significantly higher than the analytical calculated values.
5.2 Undershooting of drawdown at step begin
During the drawdown phases of the step rate test, an initial increase in drawdown values of 0.2 m is observed. These rates then rise again after approximately 20 min before stabilizing. This effect is more pronounced at lower pumping rates. Nevertheless, the flow rate briefly increases at the beginning of each step and also the dynamic productivity index. Thus, the ratio is not balanced. One explanation for these observations could be the inertia of the water column. But there could be an additional effect that contributes to or amplifies this phenomenon. As described by Guo et al. (2017), pressure drop could indicate increased resistance in the near-wellbore region. In cases of perforation-dominated friction, caused by the filter screen, the largest changes in friction losses occur at high flow rates, whereas in near-wellbore friction dominance, the most significant changes in friction losses are observed at low flow rates. In our study, this effect is more pronounced at lower pumping rates, suggesting increased near-wellbore friction.
Furthermore, the reduced diameter of 50.8 mm may amplify this effect. Although the Reynolds number (Reynolds, 1883) at a flow rate of 14 m3 h−1 in a 50.8 mm pipe is approximately 97 000 (> 6000) indicating highly turbulent flow and associated pressure losses. In contradiction to this is that the undershooting of drawdown was observed at low production rates.
5.3 Potential productivity index of aquifer
Furthermore, at higher flow rates, non-linear pressure losses became more pronounced, leading to an increase in the skin effect from 0.76 to 1.82. However, these skin values were calculated using parameters at the end of each step. Permeability and productivity index slightly decreased from 3 to 4 September, possibly due to fine mobilization temporarily clogging pore spaces or altering near-wellbore permeability. Considering the processes described above, which lead to a reduction in productivity due to near-wellbore skin, it is possible to estimate the aquifer potential while neglecting non-linear pressure losses. This results in a potential productivity index of 1.26 L s−1 bar−1 for all steps with this specific well design, which has a diameter of only 50.8 mm. Productivity could be further enhanced by avoiding high flow rates and the associated non-linear losses, for example, by using a larger well radius, as planned for the ATES doublet system.
In this study, we applied a combination of analytical solutions and numerical simulations to evaluate two step-rate tests conducted during well development. The combined analytical and numerical analysis of hydraulic testing during screen development at the Berlin Adlershof site proved to be an effective approach for the preliminary estimation of aquifer properties. The analytical evaluation of the hydraulic tests yielded an aquifer transmissivity of 2.72 × 10⁻¹¹ m3 and a skin zone transmissivity of 2.97 × 10⁻¹² m3. The skin factor was estimated to range from 0.79 to 1.8, indicating nonlinear pressure losses in the near-wellbore region, likely caused by residual drilling mud and elevated flow velocities due to the specific well design. Subsequent numerical simulations suggest that the low-permeability skin zone may extend to approximately 0.3 m from the wellbore, a parameter that should be taken into account in future experiments. While the presented results are preliminary, the findings demonstrate that step-rate test analysis during well development can support the design of subsequent tests and inform optimization strategies for well cleaning and rehabilitation.
Data will be made available on request.
COS: Conceptualization, Methodology, Software, Formal analysis, Investigation, Resources, Data Curation, Writing, Visualization. LP: Conceptualization, Methodology, Software, Formal analysis, Investigation, Resources, Data Curation, Writing, Visualization. LV: Writing – Review & Editing, Resources. EP: Writing – Review & Editing. BN: Writing – Review & Editing. SR: Writing – Review & Editing. KK: Review & Editing, Funding. GB: Validation, Writing – Review & Editing, Visualization, Supervision. SK: Validation, Writing – Review & Editing, Visualization, Supervision.
The contact author has declared that none of the authors has any competing interests.
Publisher's note: Copernicus Publications remains neutral with regard to jurisdictional claims made in the text, published maps, institutional affiliations, or any other geographical representation in this paper. While Copernicus Publications makes every effort to include appropriate place names, the final responsibility lies with the authors. Views expressed in the text are those of the authors and do not necessarily reflect the views of the publisher.
This article is part of the special issue “European Geosciences Union General Assembly 2025, EGU Division Energy, Resources & Environment (ERE)”. It is a result of the EGU General Assembly 2025, Vienna, Austria & Online, 27 April–2 May 2025.
The authors would like to thank Johannes Miocic and an anonymous reviewer for their valuable comments and suggestions, which helped to improve the quality of this paper.
This research was funded by the European Commission with the PUSH-IT project (grant no. 1011096566). Additional funding was provided through the project “Reallabor GeoSpeicher Berlin” (FKZ: 03EWR022C) by the German Federal Ministry for Economic Affairs and Climate Action based on a resolution of the German Bundestag.
The article processing charges for this open-access publication were covered by the GFZ Helmholtz Centre for Geosciences.
This paper was edited by Johannes Miocic and reviewed by Johannes Miocic and one anonymous referee.
Bauer, D., Marx, R., Nußbicker-Lux, J., Ochs, F., Heidemann, W., and Müller-Steinhagen, H.: German central solar heating plants with seasonal heat storage, Solar Energy, 84, 612–623, https://doi.org/10.1016/j.solener.2009.05.013, 2010.
Bierschenk, W. H.: Determining Well Efficiency by Multiple Step-drawdown Tests, International Association of Scientific Hydrology, 64, 493–507, 1963.
Birsoy, Y. K. and Summers, W. K.: Determination of Aquifer Parameters from Step Tests and Intermittent Pumping Data, Groundwater, 18, 137–146, https://doi.org/10.1111/j.1745-6584.1980.tb03382.x, 1980.
Blöcher, G., Reinsch, T., Henninges, J., Milsch, H., Regenspurg, S., Kummerow, J., Francke, H., Kranz, S., Saadat, A., Zimmermann, G., and Huenges, E.: Hydraulic history and current state of the deep geothermal reservoir Groß Schönebeck. Geothermics, 63, 27–43, https://doi.org/10.1016/j.geothermics.2015.07.008, 2016.
Blöcher, G., Regenspurg, S., Kranz, S., Lipus, M., Pei, L., Norden, B., Reinsch, T., Henninges, J., Siemon, R., Orenczuk, D., Zeilfelder, S., Scheytt, T., and Saadat, A.: Best practices for characterization of High Temperature-Aquifer Thermal Energy Storage (HT-ATES) potential using well tests in Berlin (Germany) as an example, Geothermics, 116, 102830, https://doi.org/10.1016/j.geothermics.2023.102830, 2024.
Clark, L.: The analysis and planning of step drawdown tests, Quarterly Journal of Engineering Geology, 10, 125–143, https://doi.org/10.1144/GSL.QJEG.1977.010.02.03, 1977.
Cooper, H. H. and Jacob, C. E. J.: A generalized graphical method for evaluating formation constants and summarizing well-field history, Eos, Transactions American Geophysical Union, 27, 526–534, https://doi.org/10.1029/TR027i004p00526, 1946.
Dinçer, İ. and Rosen, M. A.: Thermal Energy Storage: Systems and Applications, 3rd edn., Wiley, Hoboken (NJ), ISBN 978-1-119-71315-9, 2010.
Eseimokumoh, I., Ereyananyo, O. W., and Eniye, O.: Reservoir and Wellbore Damage Estimation Using Pressure Transient Analysis (PTA), International Journal of Innovative Science and Research Technology, 6, 563–575, ISSN 2456-2165, 2021.
Fleuchaus, P., Godschalk, B., Stober, I., and Blum, P.: Worldwide application of aquifer thermal energy storage – A review, Renewable and Sustainable Energy Reviews, 94, 861–876, https://doi.org/10.1016/j.rser.2018.06.057, 2018.
Guo, B., Sun, K., and Ghalambor, A: Well Productivity Handbook, Gulf Publishing Company, ISBN 1933762322, 2008.
Guo, B., Liu, X., and Tan, X.: Petroleum Production Engineering Book, 2nd edn., s.l., Elsevier, https://doi.org/10.1016/B978-0-12-809374-0.00023-4, 2017.
Halford, K. J., Weight, W. D., and Schreiber, R. P.: Interpretation of Transmissivity Estimates from Single-Well Pumping Aquifer Tests, Groundwater, 44, 467–471, https://doi.org/10.1111/j.1745-6584.2005.00151.x, 2005.
Holub, J., Pech, P., Kuraz, M., Máca, P., and Kahuda, D.: Evaluation of a pumping test with skin effect and wellbore storage on a confined aquifer in the Bela Crkva, Serbia, International Journal of Water, 13, 1, https://doi.org/10.1504/IJW.2019.097309, 2019.
Horner, D. R.: Pressure Build-Up in Wells, Proceedings of the 3rd World Petroleum Congress, The Hague, the Netherlands, 25–43, 1951.
Hoth, K., Rusbült, J., Zagora, K., Beer, H., and Hartmann, O.: Die tiefen Bohrungen im Zentralabschnitt der Mitteleuropäischen Senke: Dokumentation für den Zeitabschnitt 1962–1990; mit zwei Tabellen, Schriftenreihe für Geowissenschaften, Verlag der Gesellschaft für Geowissenschaften, Verlag der Gesellschaft für Geowissenschaften, 145, ISSN 0947-4269, 1993.
Hoth, P.: Geowissenschaftliche Bewertungsgrundlagen zur Nutzung hydrogeothermaler Ressourcen in Norddeutschland, Scientific Technical Report/Geoforschungszentrum Potsdam, https://doi.org/10.23689/fidgeo-482, 1997.
Jacob, C. E.: Drawdown Test to Determine Effective Radius of Artesian Well, Transactions of the American Society of Civil Engineers, 112, 1047–1064, https://doi.org/10.1061/TACEAT.0006033, 1947.
Kærgaard, H.: The Step-Drawdown Test and Non-Darcian Flow: A Critical Review of Theory, Methods and Practice, Hydrology Research, 13, 247–256, https://doi.org/10.2166/nh.1982.0020, 1982
Kahuda, D. and Pech, P.: A New Method for the Evaluation of Well Rehabilitation from the Early Portion of a Pumping Test, Water, 12, 744, https://doi.org/10.3390/w12030744, 2020.
Langguth, H.-R. and Voigt, R.: Hydrogeologische Methoden, Springer Berlin Heidelberg, https://doi.org/10.1007/978-3-642-18655-4, 2004.
Lee, J.: Well testing, Soc. of Petroleum Engineers, Richardson, Tex., ISBN 0895203170, 1982.
Maliva, R. G.: Aquifer Pumping Tests, in: Aquifer Characterization Techniques, Springer International Publishing, Cham, 171–211, https://doi.org/10.1007/978-3-319-32137-0, 2016.
Muskat, M.: The Flow of Compressible Fluids Through Porous Media and Some Problems in Heat Conduction, Physics, 5, 71–94, https://doi.org/10.1063/1.1745233, 1934.
Norden, B., Virchow, L., Fuchs, S., Mitzscherling, J., Alibrandi, A., Gravendyck, J., Zimmer, M., and Saadat, A.: Section Geomorphology, Sediment Lab (2023): The explorational drilling Gt BTrKoe 1/2021 in Berlin Adlershof, Germany – Field Data and Measurements, V.1. GFZ Data Services, https://doi.org/10.5880/GFZ.4.8.2023.006, 2023.
Ramey, H. J.: Well-Loss Function and the Skin Effect: A Review, Recent Trends in Hydrogeology, 265–272, https://doi.org/10.1130/SPE189-P265, 1982.
Reynolds, O.: An experimental investigation of the circumstances which determine whether the motion of water shall be direct or sinuous, and of the law of resistance in parallel channels, Philosophical Transactions of the Royal Society of London, 174, 935–982, https://doi.org/10.1098/rstl.1883.0029, 1883.
Rorabaugh, M. J.: Graphical and Theoretical Analysis of Step Drawdown Test of Artesian Well, Proceedings of the American Society of Civil Engineers, 79, 1–23, 1953.
Van Poolen, H. K.: Radius-of-drainage and stabilization-time equations, The Oil and Gas Journal, 62, 138–146, 1964.