 | 21 Nov 2025
In-soil hydrogen concentration monitoring using MONHyTOR: application for natural hydrogen exploration
Niko Adjie
Clarisse Bordes
Daniel Brito
Djamel Nasri
Éric Normandin
Soil gas measurements are extensively utilized for seepage detection in natural hydrogen exploration; hydrogen concentration in the soil exhibits significant temporal and spatial variability. We developed an in-soil hydrogen concentration monitoring instrument, named MONHyTOR, capable of up to 1 s sampling rate with up to months of autonomy. Laboratory tests using a closed chamber demonstrate the accuracy of the instrument for diffuse gas flow and a monitoring campaign conducted in the southwest of France yielded several interesting recordings. Each field dataset begins with a hydrogen concentration peak linked to the drilling of the borehole during installation, where parameters from fitting an exponential decay to its decrease indicate the effects of soil type on hydrogen diffusivity and retention in the soil. While the origin of the measured hydrogen is not identified in this paper, our long-term monitoring data suggest that soil gas movements vary with air pressure and temperature values, as well as water circulation in the soil. This paper shows that sampling rate in the order of seconds is appropriate for the commonly observed wavelengths of hydrogen concentration variation in the soil and data processing, and the absence of pump allows for a study on proxies for soil gas diffusivity.
- Article
(4564 KB) - Full-text XML
- BibTeX
- EndNote


Molecular hydrogen or H2, herein referred to as hydrogen, has become increasingly important with key applications including the desulfurization of fossil fuels and ammonia production (Häussinger et al., 2011). Following technological developments such as fuel cell, hydrogen is now considered as an eco-friendly candidate for the primary energy mix, as its combustion only yields water. At present, the vast majority of hydrogen is produced by industrial processes such as natural gas steam reforming and petroleum partial oxidation (Baade et al., 2001) which generate considerable greenhouse gas. Fortunately, there is substantial scientific evidence that shows that hydrogen can occur naturally in the subsurface, referred to as natural or white hydrogen. The discovery and subsequent studies of intense hydrogen outgassing via a well in Bourakébougou, Mali (Maiga et al., 2023, 2024; Prinzhofer et al., 2018) and in a chromite mine in Bulqizë, Albania (Truche et al., 2024) have demonstrated that geological processes can produce hydrogen in significant quantities, and the presence of a reservoir formation and a competent cap rock can result in its accumulation.
In the absence of such intense outgassing, soil gas measurements and/or analysis at shallow depths are widely utilized for preliminary de-risking in natural hydrogen exploration. Given that hydrogen concentration in the air is 0.5 ppm, elevated levels in the soil may indicate a fluid seep from deep sources and/or deep accumulations (Larin et al., 2015; Lefeuvre et al., 2022; Xiang et al., 2020; Zgonnik et al., 2019). The spot-measurement technique using portable gas analyzer such as the BIOGAS 5000 can highlight the spatial distribution of hydrogen concentration, which exhibits metric-scale sparsity (Frery et al., 2021; Loiseau et al., 2024; Zgonnik et al., 2015). Furthermore, repeated spot-measurements in the same location indicate its variability in time (Davies et al., 2025). Observing such temporal variation may offer insights to the recharge rate of the soil in hydrogen and requires long-term monitoring. In Moretti et al. (2021) and Prinzhofer et al. (2019), results from monitoring using PARHyS by ENGIE show both diurnal and sporadic concentration peaks within a subcircular topographical depression in Brazil, colloquially known as “fairy circles”.
Considering the highly variable temporal and spatial distribution of hydrogen seeps, one of the challenges faced during the exploratory phase is the scarcity of monitoring instruments with adequate sampling rate and autonomy that are fairly cost-effective to be used in an array. To meet this need, we developed a hydrogen concentration monitoring instrument named MONHyTOR (patent pending as of the submission of this paper). Since early 2024, a fleet of MONHyTORs has been deployed in France as part of a monitoring campaign yielding several interesting recordings. This paper aims to discuss the instrument, the test results in a controlled environment, and the first field datasets.
For the development of MONHyTOR, our measurement philosophy is based on the assumption that hydrogen generated in the subsurface subsequently migrates towards the surface via preferential pathways (Lefeuvre et al., 2021; Saspiturry et al., 2024; Zwaan et al., 2025). Past the saturated groundwater zone, hydrogen traverses the vadose zone and thus transitorily alters hydrogen concentration in the soil before reaching the atmosphere. MONHyTOR is designed to monitor hydrogen concentration at 1 m depth, where soil temperature is relatively stable, i.e., not or minimally affected by daily air temperature variation (Lv et al., 2018).
The current version of MONHyTOR is a 1028.8 mm long and 30 mm in diameter probe-shaped non-pumping instrument equipped with an electrochemical sensor at 950 mm lengthwise. The sensor provides in-soil hydrogen concentration measurements in the 0 to 1000 ppm range with 0.1 ppm display resolution and ±5 % full-scale error, as well as soil temperature with 0.1 °C display resolution and ±0.2 °C relative error. Data is digitalized directly on the sensor which presents cross sensitivity only with carbon monoxide. The single gas entry point is via the lower extremity, where waterproofing is ensured by a hydrophobic membrane and a heat-shrinkable sleeve that protect the sensor from transient water accumulation as shown in Fig. 1a. Relative humidity inside the instrument is constantly recorded and regulated ensuring proper functioning of the electronics.
The probe is connected to an interchangeable acquisition box containing rechargeable lithium-ion batteries and a datalogger where data is stored in a microSD card, enabling up to months of use in full autonomy. Connecting the acquisition box to a computer by a USB-C cable via a terminal emulator allows for real-time data display and parameter setting, where sampling rate is adjustable to up to 1 s between samples. Installing the MONHyTOR in the field requires drilling a borehole of slightly greater dimensions than the probe. The top of the probe and the acquisition box can be fully buried and rendered completely invisible for more discrete use, and an additional plastic box can be, and often is, added for protection as seen in Fig. 1b and c.
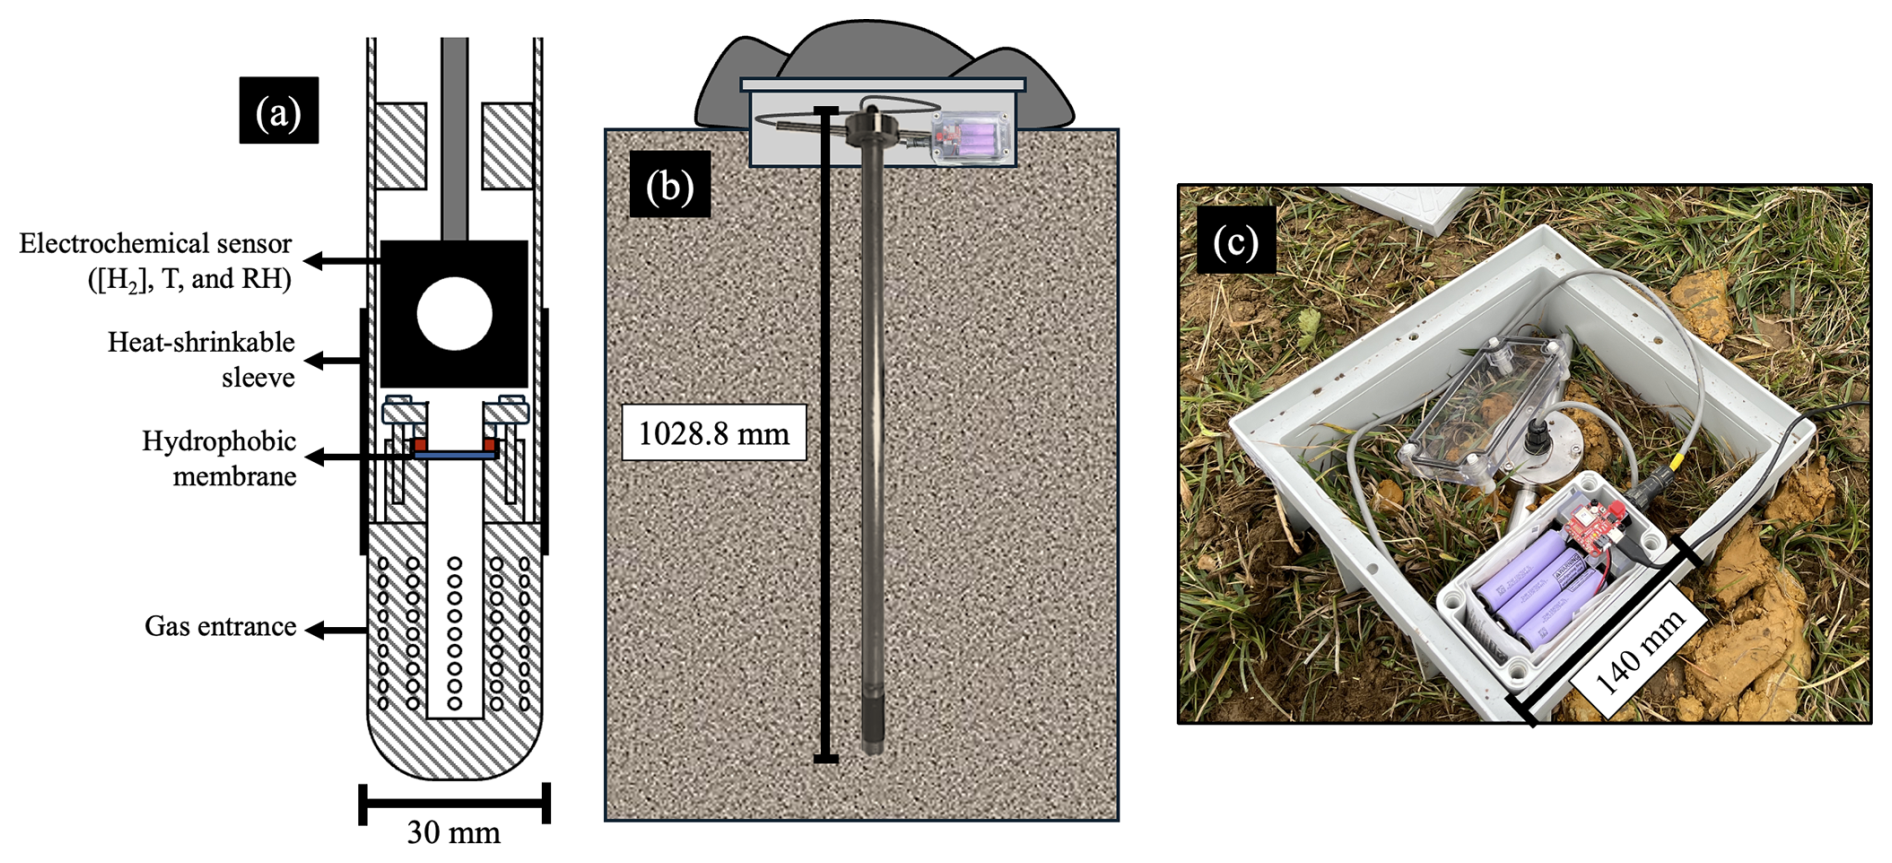
Figure 1(a) Section-view diagram of the lower extremity of MONHyTOR where [H2] is hydrogen concentration, T is temperature, and RH is relative humidity. (b) Diagram of MONHyTOR during autonomous field use. (c) Image of MONHyTOR installed in the field with protective plastic box. To drill the borehole, a combination of a Bosch GBH 18V-45C rotary hammer and a 1300 mm long and 36 mm or 40 mm diameter stainless-steel drill bit is used, with the former set to hammering drill mode operating at up to 300 rotations and 2740 strikes min−1 with 12.5 J of strike force.
Quantifying the accuracy of the instrument requires a laboratory apparatus that delivers precise gas injections in a controlled environment. The setup shown in Fig. 2a comprises a sample cylinder with gas chromatography-measured content of 4.17 % H2 and 95.83 % N2, i.e., 4.17×10⁴ ppm and 9.583×10⁵ ppm respectively (1), a high-pressure gas regulator (2), a low-pressure gas regulator (3), a sampling coil with 1900 mm length and 2 mm inner radius (4), a quarter-turn valve (5), a MONHyTOR (6), a cylindrical closed chamber (7), and a reference sensor identical to that used in MONHyTOR (8). The objective is to evaluate the effects of the design on gas flow by comparing measurements by the MONHyTOR to the reference sensor located inside the chamber but outside the probe, both operating at 1 s sampling rate. The protocol consists of flushing the sampling coil, saturating it with the H2-N2 gas mixture at 1 mbar relative, then opening the valve to let gas flow from the coil to the chamber. Note that upon opening the valve, the 1 mbar overpressure in the sampling coil dissipates instantly into the significantly larger total apparatus volume. The resulting tiny and very short-lived pressure gradient only causes negligible airflow. Hence, presuming a purely diffusive gas flow, the isothermal, isobaric, and unidirectional transfer of any molecule can be calculated using the unidirectional Fick's first law in Eq. (1)
where J is the molar surface flux (mol s−1 m−2), D is the diffusion coefficient of a gas through another gas (m2 s−1), C is the gas concentration (mol m−3), and z is the distance in direction of diffusion (m) (Palmes et al., 1976).
To adapt this general equation to our system, we consider a two-box geometry with Vcoil=24 mL and Vchamber=3800 mL corresponding to the volumes of the sampling coil and the chamber-probe assembly respectively. The two are connected by a circular surface of cross-sectional A with 2 mm radius corresponding to the valve opening which acts as a choke point. Diffusivity of hydrogen in the excess of air at 20 °C is m2 s−1 (Cathles and Prinzhofer, 2020). Given the metric scale of the setup, the gradient is approximated as the difference of molar concentration ΔC (mol m−3) over 1 m distance L and is time dependent. The number of moles that goes through the choke point per second Q (mol s−1) can thus be approximated following Eq. (2) obtained by multiplying both expressions in Eq. (1) by A and assuming concentration uniformity in Vcoil and Vchamber which eliminates dependence on z.
Assuming all studied gases behave like ideal gas, C in Vcoil and Vchamber and thus ΔC at each time step are known through the amount of substance n (mol) and are calculated using the general gas equation (PV=nRT). This operation is performed in a loop and independently for N2, O2, and H2 where Q affects n and thus ΔC, which will in turn modify Q for the next iteration until equilibrium is reached. Furthermore, the electrochemical sensors measure hydrogen concentration in ppm, denoted as xH2, which is a relative concentration rather than molar concentration C used in Eq. (2). Its value is determined by calculating the ratio between hydrogen molecules and the sum of all other molecules present in the system as shown in Eq. (3).
To validate our theoretical calculation of hydrogen concentration through flux using Fick's law of diffusion, hydrogen concentration is also calculated differently using Boyle-Mariotte law in Eq. (4) where P and V denote the partial pressure of hydrogen and the volumes respectively. This equation, while does not modelize the dynamics, provides a more intuitive approach to calculate the concentration of a confined gas.
The results of the theoretical calculations, and measurements by MONHyTOR and the reference sensor are presented in Fig. 2b. Firstly, hydrogen concentration curves calculated by Fick's and Boyle-Mariotte law converge towards a maximum value of approximately 260 ppm, indicating the proper functioning of the diffusion model. Secondly, both measured hydrogen concentration curves exhibit good agreement with the theoretical calculations by Fick's law, confirming a purely diffusive gas flow within the apparatus. Finally, the measured hydrogen concentration by MONHyTOR and the reference sensor show minimal differences, within the 5 % error margin of the sensors, indicating that the design of the instrument causes little to no impact on diffuse gas flow.
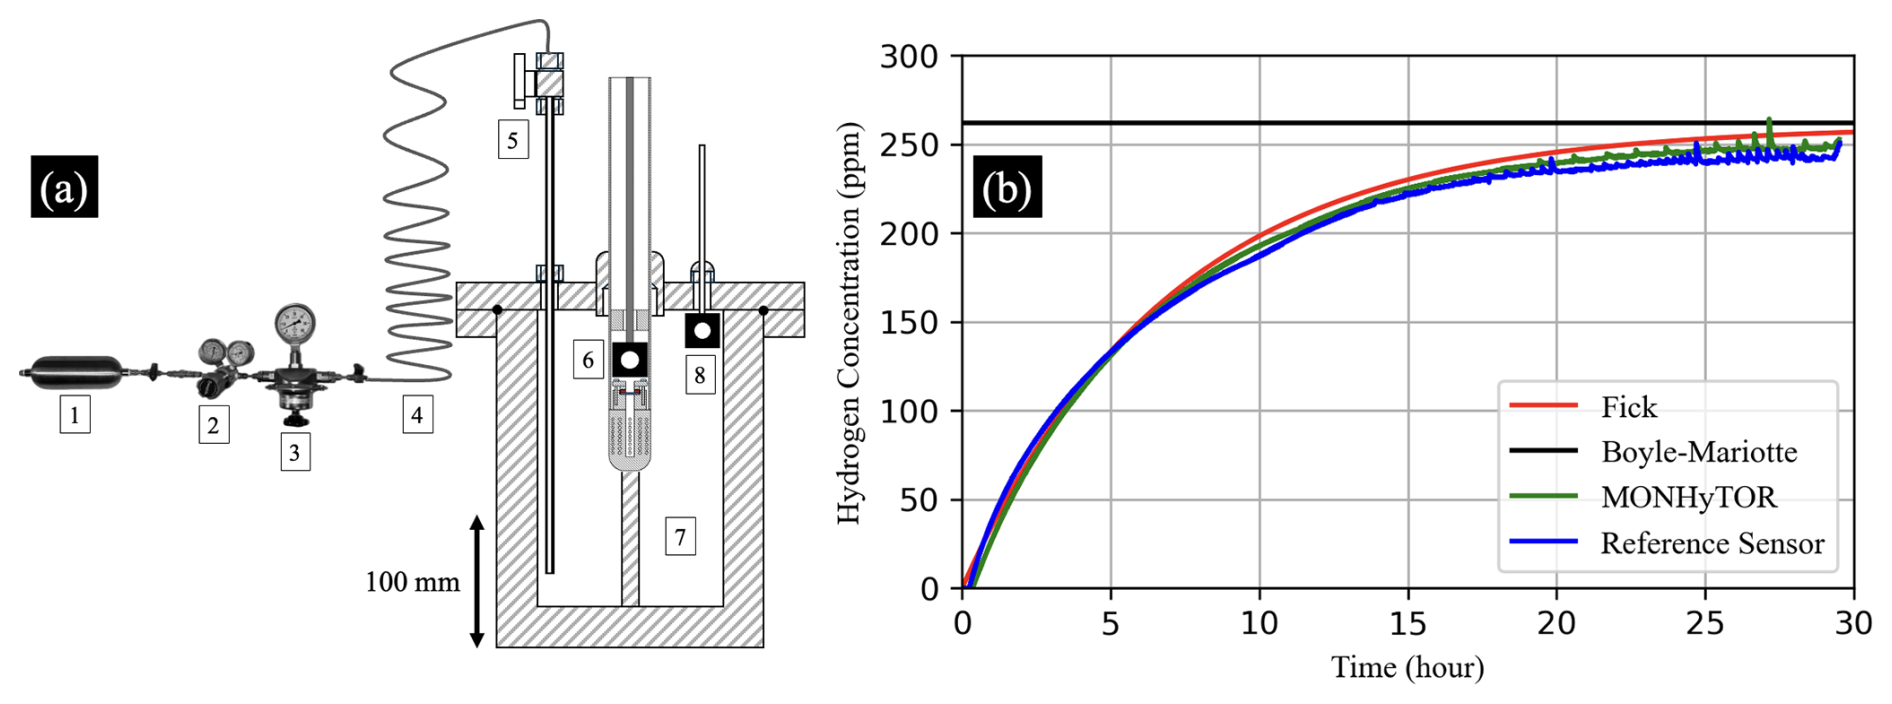
Figure 2(a) Diagram of the laboratory setup, only elements number 5 through 8 are to scale. (b) Measured (with 1 s sampling rate) and calculated hydrogen concentration as a function of time. Start time corresponds to the valve opening.
Among the known natural hydrogen generation mechanisms, four main geological abiotic sources are considered consisting of (1) water radiolysis by the decay of radioactive elements (Lin et al., 2005), (2) mechanoradical by rock comminution (Hirose et al., 2011), (3) magmatic degassing (Gaillard et al., 2011), and (4) hydrothermal alteration of ultramafic rocks (Malvoisin et al., 2012). The upper mantle of the earth is composed of peridotite: an ultramafic, iron-rich, and silica-poor rock containing mainly olivine and pyroxene (Anderson and Bass, 1984).The hydration of such iron-bearing minerals is known as serpentinization and is marked by the general reaction in Eq. (5) (Ramdohr, 1967; Thayer, 1966 in Coveney et al., 1987) where hydrogen is a byproduct of ferrous iron Fe2+ oxidation into ferric iron Fe3+. Serpentinization reaction rate is temperature dependent with a peak reaction rate at 300 °C (Malvoisin et al., 2012).
The presence of hydrogen-rich fluids has been reported in ophiolitic contexts such as in the Philippines (Abrajano et al., 1988), Turkey (Etiope et al., 2011), Oman (Neal and Stanger, 1983), and Albania (Truche et al., 2024) as well as inverted rift contexts with notable examples such as Kansas (Coveney et al., 1987) and European Alps (Giuntoli et al., 2024). Moreover, in Lefeuvre et al. (2022), the foothill geological context is said to provide favorable conditions for natural hydrogen generation by serpentinization. Said study focuses on the North Pyrenean Zone whose geological history contains two major events: (1) mid-to-late-Cretaceous hyper-extensive phase with mantle exhumation and (2) end-Cretaceous tectonic inversion which is at the origin of the formation of the Pyrenees. As a result, the area houses a wedged mantle with the top approximately 10 km deep providing potential connections to the surface via deep thrusts, namely the North Pyrenean Frontal Thrust and the North Pyrenean Fault (Chevrot et al., 2018; Lehujeur et al., 2021; Wang et al., 2016). Given the geothermal gradient of the region of 27 °C km−1 (Bonté et al., 2010), the top of the wedged mantle is a suitable place for hydrogen generation with the deep faults acting as water infiltration and eventually hydrogen migration pathways (Lefeuvre et al., 2022; Saspiturry et al., 2024). Figure 3 shows a Bouguer anomaly map in which higher values indicate the presence of a denser material – in this case the mantle – relative to its surrounding, and where locations of MONHyTOR for data presented in this paper are superimposed.
The first site is located in the commune of Sauveterre-de-Béarn, within the Mauléon Basin and more specifically the SauveTerre exploration permit area belonging to TBH2 Aquitaine. MONHyTORs were installed in proximity to the surface expression of the North Pyrenean Frontal Thrust, where soil gas measurements by Lefeuvre et al. (2022) indicate elevated levels of CH4, CO2, H2, and 222Rn, suggesting deep gas leakage along the fluid-draining fault. The second site is in the commune of Buzy, East of the Mauléon Basin and also in proximity to the North Pyrenean Frontal Thrust. This area features what is interpreted as a surface expression of a salt weld that may provide quasi-vertical connection for seepage from the sub-salt, which can potentially be a reservoir for hydrogen (Tari, 2025). Unpublished spot gas measurements data from the area show elevated levels of hydrogen in the soil.
For the third site, the idea was to test MONHyTOR in sandy soil. In France, many wells drilled for the oil and gas exploration have shown elevated amounts of hydrogen content, in particular six of which are located in the Parentis Basin (Lefeuvre et al., 2024), which may indicate a hydrogen-fertile zone. The Parentis Basin presents an aborted rift structure with a mantle top at around 20 km depth according to Tugend et al. (2014), and as suggested by the Bouguer anomaly data in Fig. 3. At such depth, temperature of the mantle top is likely too high for serpentinization, thus the potential hydrogen generation source is yet to be determined. Our experimental approach consists of installing MONHyTOR near sealed wells which may act as preferential seep pathways for hydrogen originated from deep geological processes (Bachu, 2017).
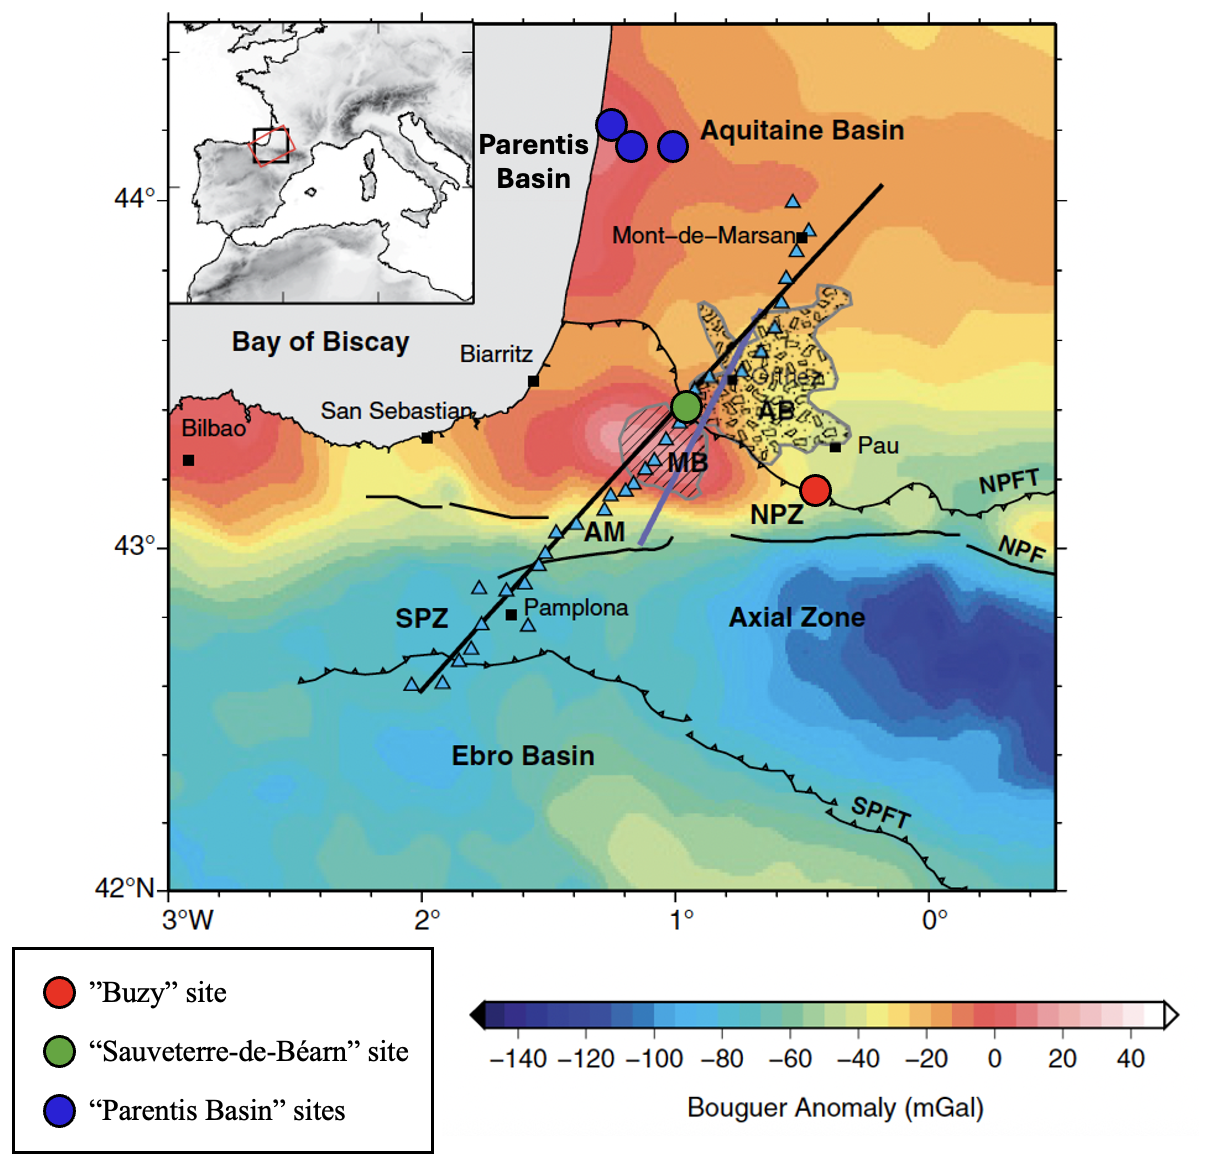
Figure 3Bouguer anomaly map (Wang et al., 2016, modified) superimposed by locations of MONHyTORs for data presented in this paper. AB is the Arzacq Basin, AM is the Aldudes Massif, MB is the Mauléon Basin, NPF is the North Pyrenean Fault, NPFT is the North Pyrenean Frontal Thrust, NPZ is the North Pyrenean Zone, SPFT is the South Pyrenean Frontal Thrust, and SPZ is the South Pyrenean Zone.
In each field dataset, a hydrogen concentration peak is consistently observed immediately after inserting the probe into the recently drilled borehole as can be seen in Fig. 4a to c representing the three study sites. Since the timing of these peaks coincides with the installation, the arrival of hydrogen is suspected to be linked to the installation method of the probe. Assuming that hydrogen is present in the soil, drilling a borehole using a rotary hammer and a drill bit disturbs the equilibrium of the soil which displaces its hydrogen content. The resulting borehole acts as an accumulation sink for its surrounding area resulting in the rapid concentration increase. Hydrogen then diffuses away from the borehole into the surrounding soil pores with lower concentrations and partly to the atmosphere, causing the decrease in the measured concentration that roughly follows an exponential decay.
By looking at both axes of Fig. 4a to c, it is clear that the maximum concentration and the duration of the decay are separated by orders of magnitude between the three sites, which we suspect are effective proxies for site-specific soil gas diffusion rate. A study on diffusivity proxies can be considered as the MONHyTOR is a non-pumping instrument, and its design has little to no effect on diffuse gas flow as demonstrated by the laboratory test. We are thus confident that any change in soil gas diffusivity is a direct consequence of the soil, and not the instrument. Quantitative analysis is carried out by fitting an exponential decay to a portion of the decrease of each curve following Eq. (6)
where xH2 is the hydrogen concentration (ppm), xH20 is the characteristic initial hydrogen concentration (ppm), −α is the hydrogen concentration decay rate (s−1), and t is the time (s). Fitting is carried out by inversion using the least squares method on the proxy parameters: xH20 and α, and the results are presented in Fig. 4d where the ellipsoids represent the range of xH20 and α values that yield inversion error inferior or equal to two-and-a-half times the minimum error for each point. Given the observed linear trend in log-log plot that appears to be dependent on the site, we propose an interpretation pertaining to the soil type found at each site according to our visual observation of cuttings removed by the drill bit.
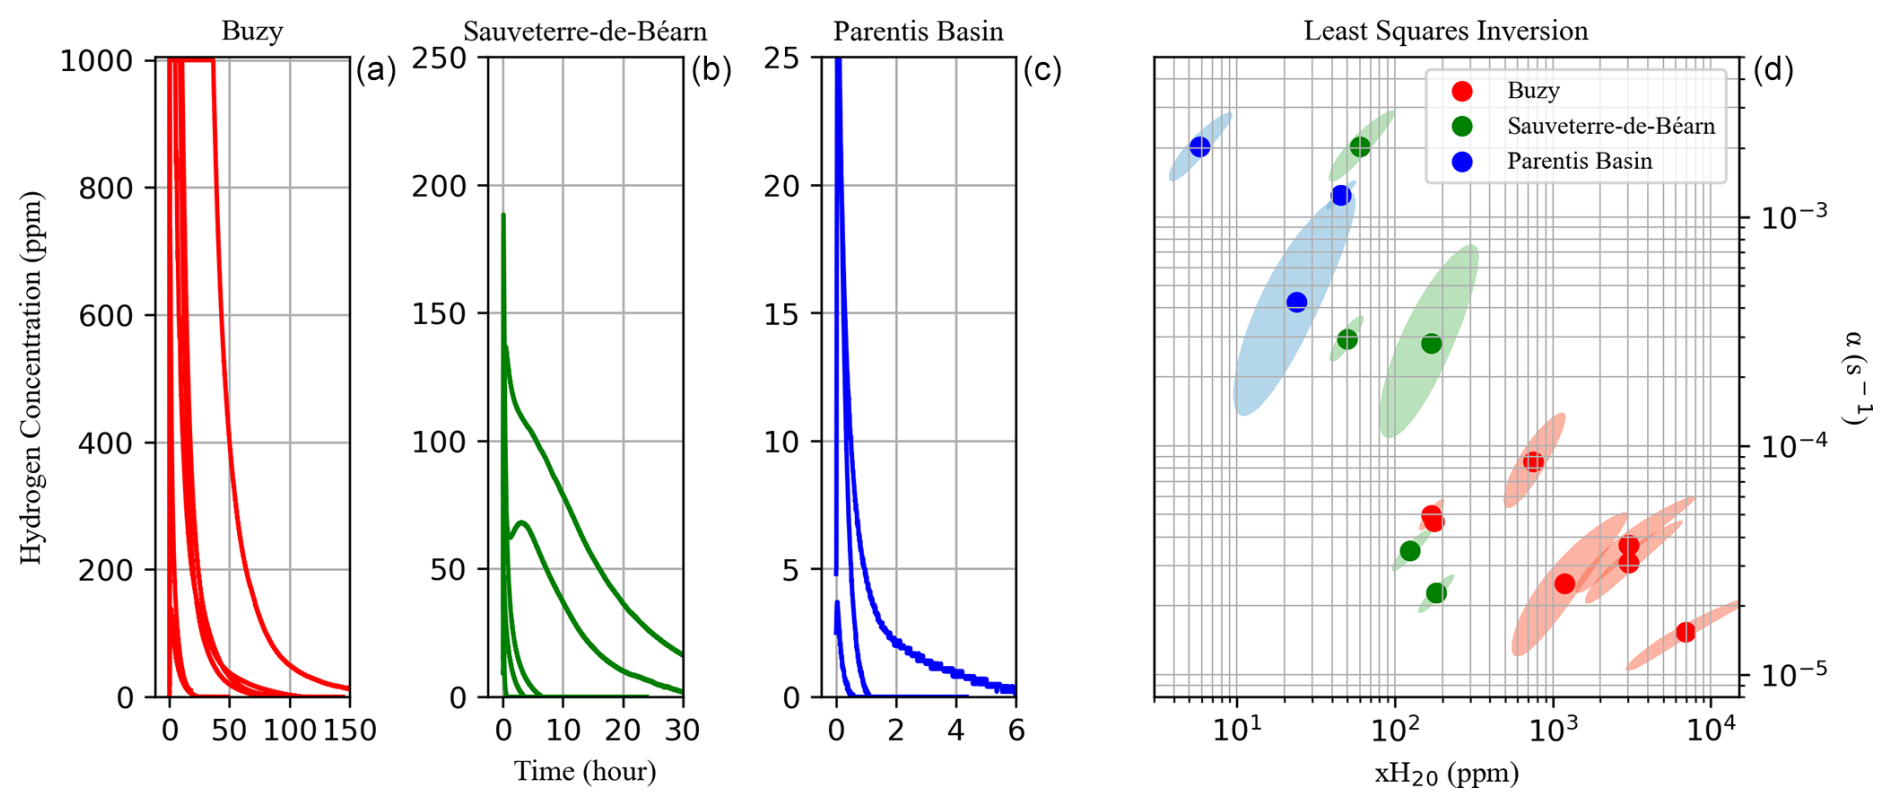
Figure 4(a) Compilations of post-installation hydrogen concentration peaks from the “Buzy” site featuring very clay-rich soil (b) from the “Sauveterre-de-Béarn” site featuring less clay-rich soil, and (c) from the “Parentis Basin” sites featuring sandy soil. Note the axis scale change for both hydrogen concentration and time. (d) Log-log plot for results from the inversion of α and xH20 using the least squares method with the ellipsoids representing the range of α and xH20 values that yield inversion error inferior or equal to two-and-a-half times the minimum error for each point.
Firstly, the “Buzy” site is a grazing land with very clay-rich and slightly rocky soil. The post-installation peaks have the highest average xH20 and the lowest average α, with some xH20 values exceeding the upper range limit of our instrument of 1000 ppm, which may provide a rough estimate of the measured peak had the sensor have longer range. Secondly, the “Sauveterre-de-Béarn” site has the intermediate soil type: clay-rich but less than that of the “Buzy” site, with average xH20 and α value between those of the other two sites. Thirdly, the “Parentis Basin” sites are in a coastal area where the soil is quartz sand with, in several locations, a thin hardened layer at around 60 cm depth known as alios (Gourdon-Platel, 1977). This site yields post-installation peaks with the lowest average xH20 and highest average α.
Gas diffusivity in the soil Ds is often represented as relative to gas diffusivity in air D0 under the symbol. Ds is generally inferior to D0 due to the decrease in cross-sectional within the pores available for gas movement as well as the increase in the diffusion distance due to tortuosity (Sallam et al., 1984). increases with air-filled porosity (as opposed to water-filled) (Fujikawa and Miyazaki, 2005) but decreases with clay content and bulk density (Fu et al., 2024; Müller et al., 2019). Thus, more clay-rich soils with higher xH20 and lower α exhibit larger retention effect on soil gas through the described diffusivity decrease. Inversely, is higher in well-draining soils with lower xH20 and higher α such as sand, resulting in lower soil gas retention.
While the apparent link between soil type and diffusivity proxies xH20 and α seems to substantiate the soil gas retention argument, the possibility of artificial hydrogen generation by drill-bit metamorphism and the cracking of organic matter as described in Halas et al. (2021) cannot be ruled out. Moreover, Davies et al. (2025) further highlights the link between drilling-induced artifacts with soil properties, most notably soil strength, defined as resistance to penetration. Our field observations indicate that soils with greater drilling difficulty due to their mineralogical properties and/or rocks encountered by the drill bit tend to yield higher post-installation hydrogen peaks.
With reference to the introduction of this paper, the presence of temporal variations of hydrogen concentration in the soil may indicate fluid seep from the deep subsurface. In the previous section, however, the observed concentration peaks are a result of soil disturbance during probe installation. In this section, we will discuss variations that occur beyond the post-installation peak, i.e., in an undisturbed condition, where gas flow to and from the probe is supposedly controlled by natural events. For interpretation purposes, the datasets are presented superimposed with weather data comprising air pressure, air temperature, and precipitation. It should be noted that weather data for the “Buzy” site were measured by nearby weather stations downloaded from http://www.meteociel.fr (last access: 13 September 2024), and an on-site weather station was available for the “Sauveterre-de-Béarn” site, courtesy of TBH2 Aquitaine.
6.1 “Buzy” site
The first dataset originates from one of the eight probes installed in the “Buzy” site operating at 10 s sampling rate and is presented in Fig. 5. As typical for recordings by MONHyTOR, the signal begins with a post-installation hydrogen concentration peak that diminishes following Eq. (6) where xH20 and α of 176 ppm and s−1 respectively are obtained by inversion using the least squares method described in Sect. 5. It should be noted that the amplitude is significantly lower than typical for the site due to aerating and flushing the borehole prior to probe insertion as part of a trial in the field protocol.
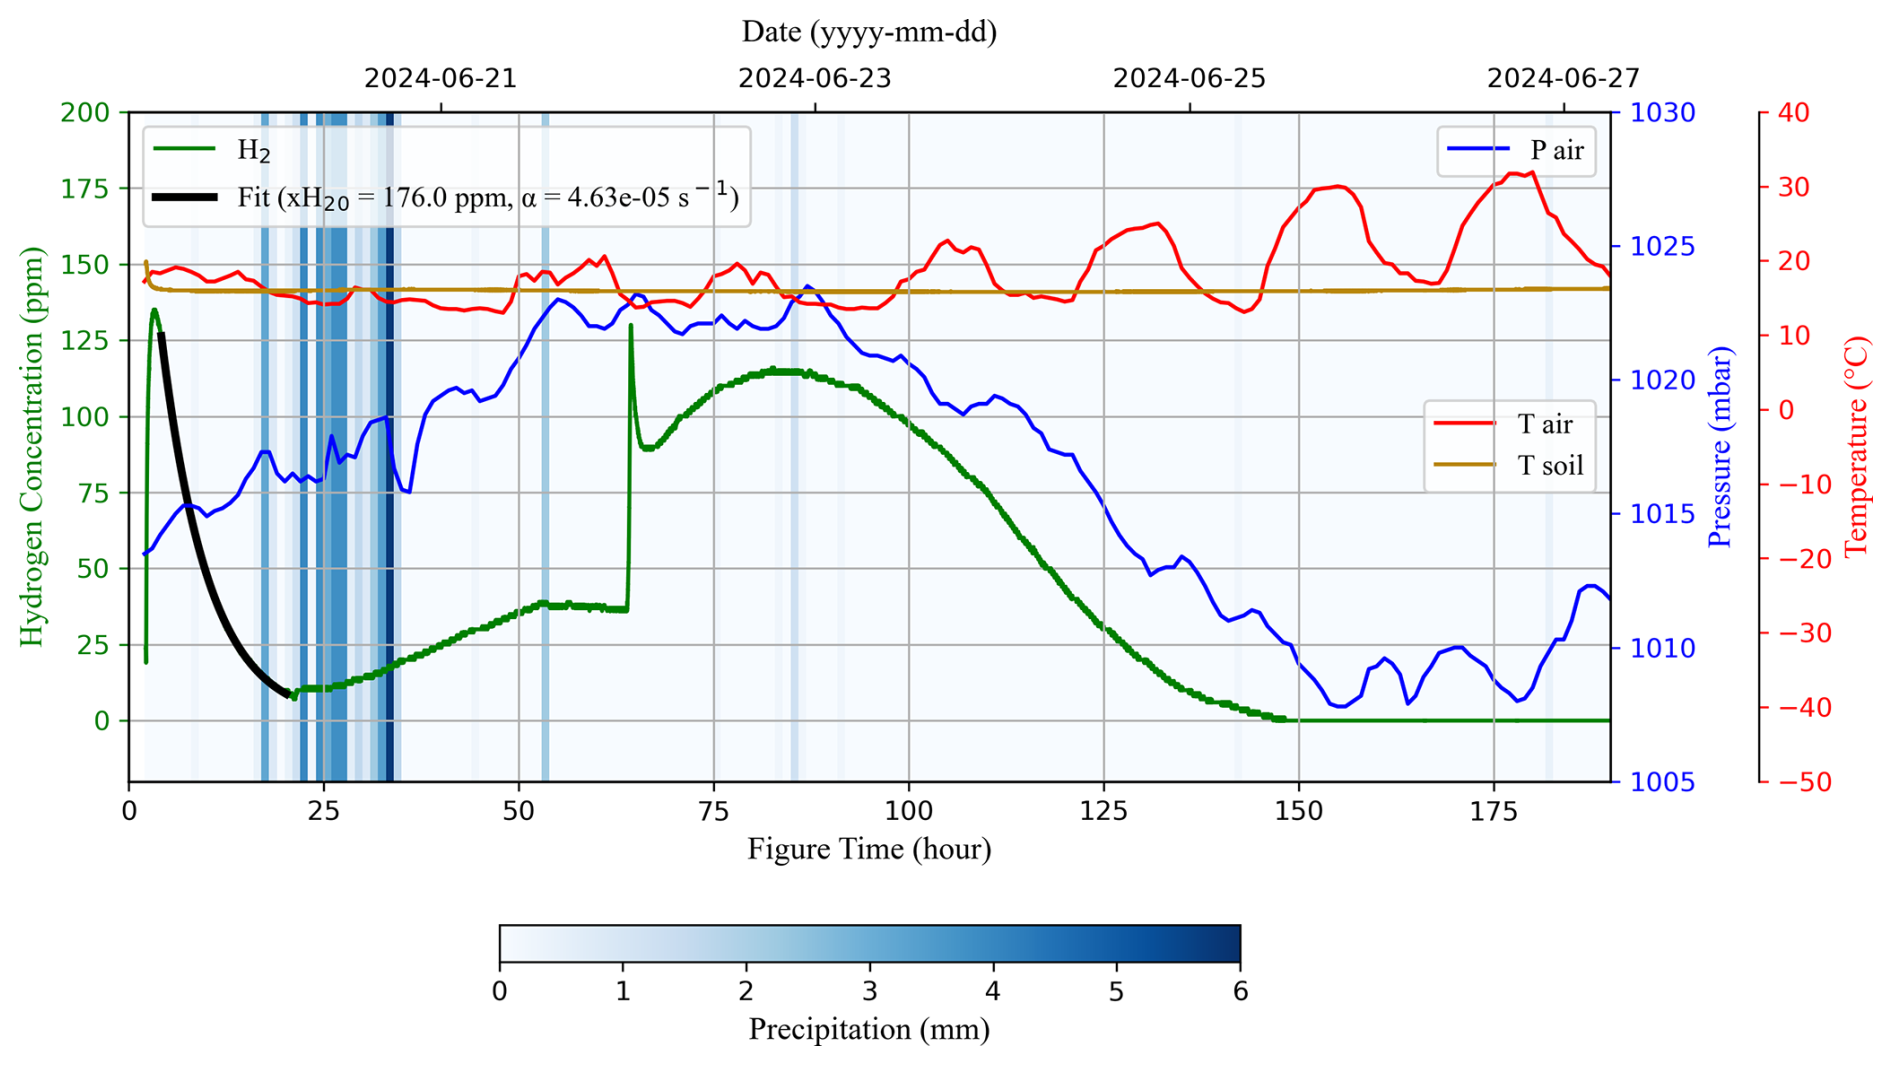
Figure 5Monitored hydrogen concentration and soil temperature data by MONHyTOR with 10 s sampling rate from the “Buzy” site featuring a 5 d long 115 ppm hydrogen concentration peak. Weather data from nearby stations (http://www.meteociel.fr, last access: 13 September 2024) of precipitation, air pressure, and air temperature are superimposed. An exponential decay as shown in Eq. (6) is fitted to a portion of the post-installation peak yielding xH20=176 ppm and s−1.
As hydrogen molecules of the post-installation peak diffuses away from the probe, a heavy rainfall took place and rainwater infiltrates into the soil at an estimated rate of 10 mm h−1 for loamy clay textured soil (Ibrahim-Bathis and Ahmed, 2016) observed on site. Water molecules reduce soil gas diffusivity (Fujikawa and Miyazaki, 2005) starting from the topsoil which favors gas accumulation below. This leads to the return of the post-installation peak hydrogen molecules towards the probe as suggested by the trend reversal, i.e., the start of the gradual concentration increase, at approximately 24 h figure time. Locally near and around the probe – probably accelerated by the presence of the borehole – water accumulates and obstructs the gas entrance of MONHyTOR marked by the hydrogen concentration plateau at around 53 h figure time. Once sufficiently drained, the local water accumulation effect disappears, and gas entry continues as indicated by the hydrogen concentration curve resuming its upward trend. In the field scale, an order-of-magnitude calculation of water infiltration time suggests that water would reach the 1 m depth mark around 100 h after the rainfall, which very roughly coincides with the time of the maximum hydrogen concentration of the 5 d long peak. Subsequently, the first meter of soil gradually drains allowing for gas diffusivity to increase once more favoring gas migration toward the atmosphere, indicated by the concentration decrease.
Additionally, the role of air pressure on hydrogen concentration in the soil might also be considered, as our data show that both share a general trend with a time delay. Soil gas concentration dependency on air pressure is also observed in long-term monitoring data from Brazil in Cathles and Prinzhofer (2020) and a mathematical model in Massmann and Farrier (1992), where it is associated to pressure-driven airflow and atmospheric air penetration into the soil respectively.
6.2 “Sauveterre-de-Béarn” site
Figure 6 presents the second dataset which originates from one of six probes deployed in the “Sauveterre-de-Béarn” site operating at a sampling rate of 5 s. At the very beginning of the monitoring, a post-installation peak occurred (not shown here) and around one month later, concentration variation that appears to have diurnal cyclicity appeared. Such oscillation took place during a very hot week in southwest of France with air temperature reaching over 40 °C. However, temperature at 1 m depth, i.e., where the electrochemical sensor is located, remains relatively stable and unaffected by the diurnal variation. Superimposing the hydrogen concentration and air temperature curves clearly shows a correlation between the two as both of their upper envelope – representing a longer wavelength trend – seem to share similar tendency. Furthermore, the existence of three hydrogen concentration peaks on 12 August appears to coincide with that of air temperature. This type of oscillations has been observed in and around “fairy circles” in Brazil (Moretti et al., 2021; Prinzhofer et al., 2019), in the Eastern Alps of Austria using MONHyTOR (Tari, 2025), and in Central California along the San Andreas and Calaveras Faults (Sato et al., 1984, 1986).
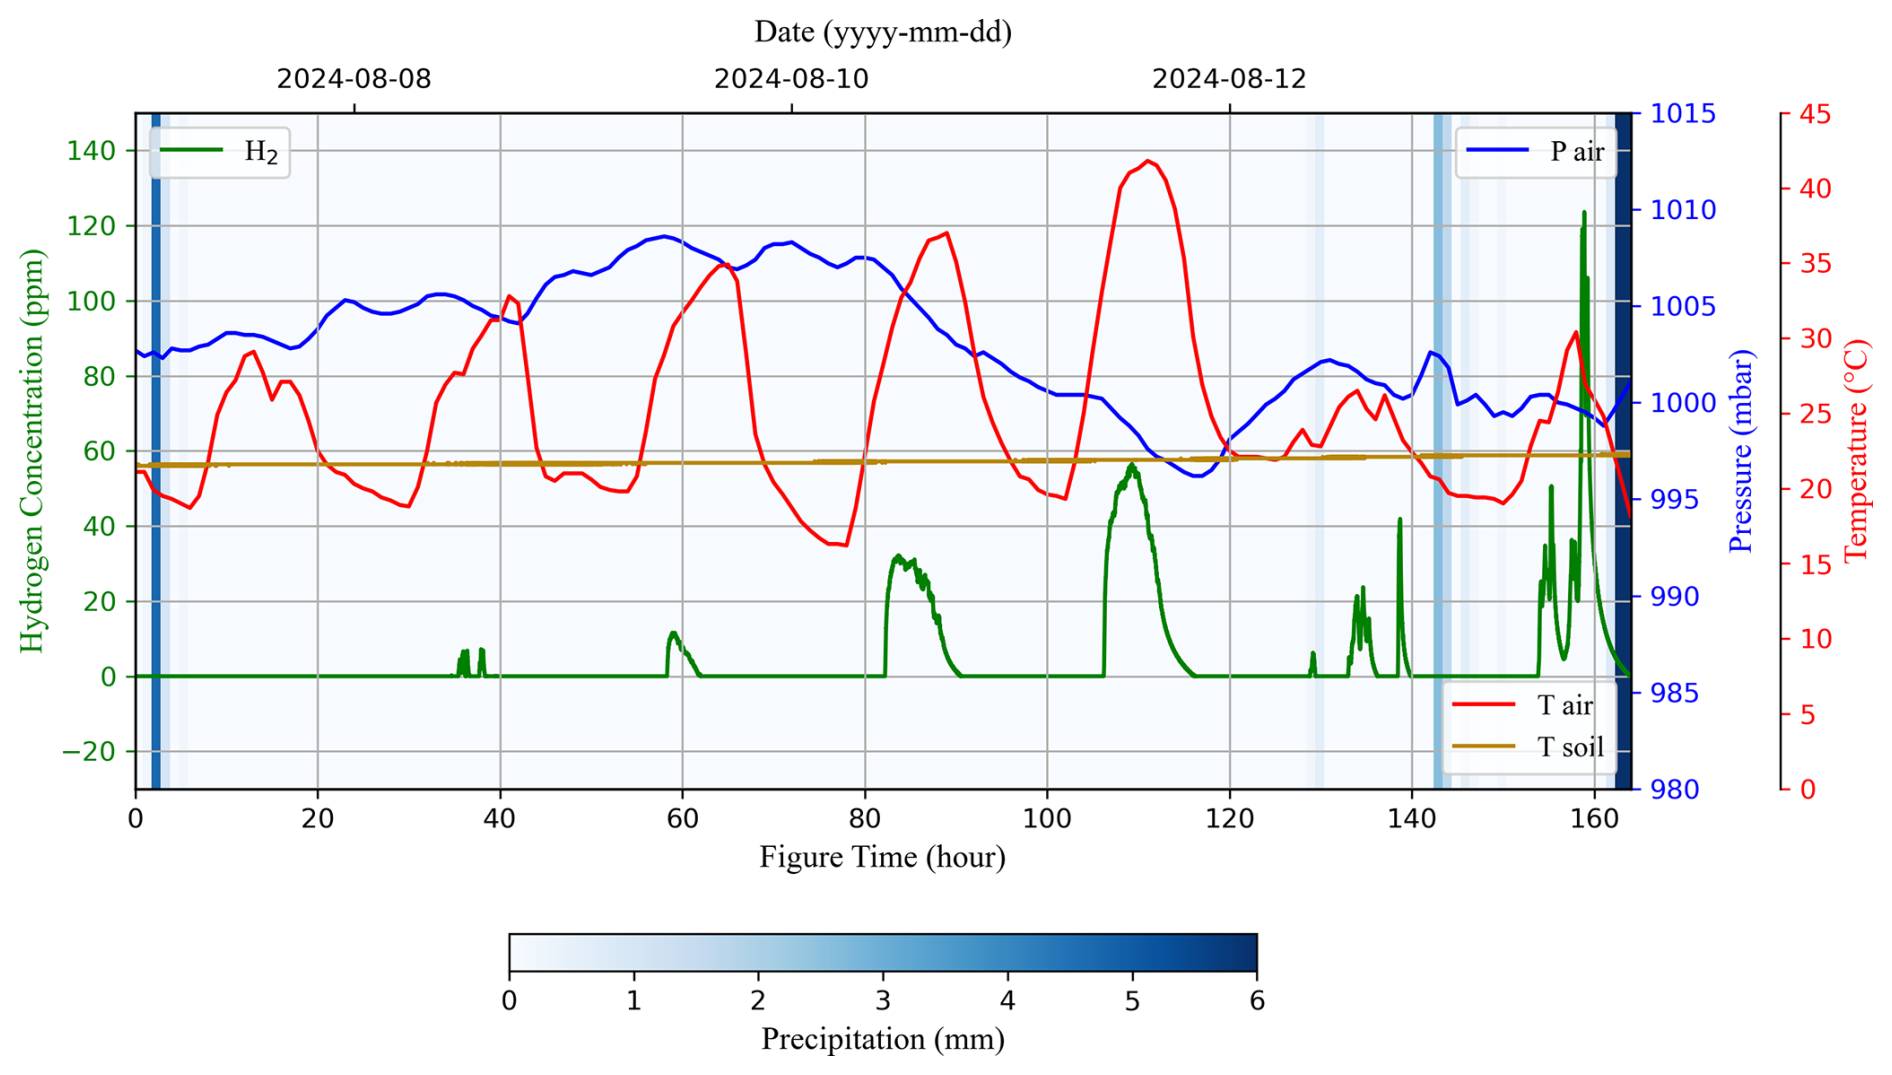
Figure 6Monitored hydrogen concentration and soil temperature data by MONHyTOR with 5 s sampling rate from the “Sauveterre-de-Béarn” site featuring diurnal hydrogen concentration peaks that appeared around one month after deployment. Weather data from an on-site station, courtesy of TBH2 Aquitaine, of precipitation, air pressure, and air temperature are superimposed. Air temperature presents diurnal variations but soil temperature at 1 m depth is relatively stable.
As mentioned previously, the “Sauveterre-de-Béarn” site has been extensively studied by Lefeuvre et al. (2022) who found evidence of fluid migration along the North Pyrenean Frontal Thrust. Assuming that the soil is recharged with deep-origin gases via the fault, their migration in the first meters of soil is dependent on soil properties. While the data suggest that diurnal temperature variation does not penetrate to 1 m depth, soil properties and fluid equilibrium above it may vary daily with air temperature (Lv et al., 2018) and are thus likely to modify gas circulation at 1 m depth. Beyond the assumption that hydrogen is generated by deep geological processes, the possibility of other sources such as superficial biogenic production cannot be excluded as highlighted in Etiope et al. (2024) and the references herein. In this case, the analysis and interpretations regarding the apparent link with air temperature would differ significantly and should also account for the eventual bacterial consumption in the first meters of soil, as done in a model by Myagkiy et al. (2020).
This paper showcases the capabilities of MONHyTOR in monitoring hydrogen concentration in the soil. A sampling rate in the order of seconds seems appropriate for the commonly observed hydrogen concentration variation wavelengths in the field as it allows for (1) detecting and tracking from minute to day-long variations associated to weather events, and (2) quantitative analysis by least squares inversion of post-installation peaks with various decay durations. Devoid of a pump, the instrument causes no artificial pressure-gradient induced airflow; a study on diffusivity proxies on the post-installation peaks can thus be considered.
Our results suggest that the characteristic initial concentration xH20 and decay rate α of a post-installation hydrogen concentration peak appear to be linked to soil gas retention, which is affected by soil gas diffusivity and thus differ according to soil type. Moreover, long-term monitoring data indicate that what may be perceived as gas flux through changes in concentration at 1 m depth may not represent the actual recharge rate of the soil, as it could perhaps indicate an outgoing flux in the soil-atmosphere exchange system driven primarily by soil properties and atmospheric parameters. Hence, for natural hydrogen exploration, it is recommended to take into consideration the weather and the inherent properties of the soil when measuring hydrogen concentration at shallow depths to assess potential deep flux contribution. Assuming equal deep flux in two pedologically distinct sites, one might measure different hydrogen concentration levels in one site compared to the other according to the gas retention capacity of the first meter of soil, combined with the effects of atmospheric parameters at the moment of measurement. In addition, ascertaining the origin of the measured hydrogen – whether geological, biological, or artificially induced – appears difficult based solely on hydrogen concentration measurements. A comprehensive understanding of hydrogen concentration variation in the soil would require in-depth geochemistry and biological studies to address first order questions including bacterial generation and consumption of hydrogen, as well as the physico-chemical processes involved when drilling the soil.
Laboratory test data presented in Sect. 3, post-installation hydrogen concentration peak data presented in Sect. 5, and long-term field monitoring their corresponding atmospheric data presented in Sect. 6 are available in text file format at Zenodo (https://doi.org/10.5281/zenodo.15688216, Adjie et al., 2025).
The development of MONHyTOR was carried out by NA, CB, DB, DN, and EN. The process of designing the laboratory setup was led by CB and DN, with inputs from NA and DB. MONHyTOR installation in the field was done by NA and CB. Laboratory tests, development of code for laboratory data analysis, and data visualization were carried out by NA. Formal analysis was done by NA, CB, and DB. The original draft was prepared by NA, and review and editing were done by CB, DB, DN, and EN.
The contact author has declared that none of the authors has any competing interests.
Publisher’s note: Copernicus Publications remains neutral with regard to jurisdictional claims made in the text, published maps, institutional affiliations, or any other geographical representation in this paper. While Copernicus Publications makes every effort to include appropriate place names, the final responsibility lies with the authors. Views expressed in the text are those of the authors and do not necessarily reflect the views of the publisher.
This article is part of the special issue “European Geosciences Union General Assembly 2025, EGU Division Energy, Resources & Environment (ERE)”. It is a result of the EGU General Assembly 2025, Vienna, Austria & Online, 27 April–2 May 2025.
We express our gratitude towards our colleagues at the LFCR, in particular Charles Aubourg, Anne Battani, Nicolas Lefeuvre, Keanu Loiseau, and Isabelle Moretti for the constructive discussions and their valuable help in choosing the study site. We thank TBH2 Aquitaine, especially Laure Dissez, for the access to their exploration permit zone for our long-term monitoring. We are grateful to Alain Prinzhofer and Gabor Tari for their valuable input in the development of MONHyTOR. We would also like to thank Michael Kühn as the topic editor for the review process of this paper, as well the two anonymous reviewers for their valuable comments.
This work was carried out within the framework of the PHyM (Passive Hydrogen Monitoring) PhD program funded by the PEPR “Sous-sol, bien commun”, PC12 AquiBEAT (AQUItaine Basin gEology Analogue for the energy Transition) project of the French Agence Nationale de la Recherche (ANR). The authors would like to thank the Carnot ISIFoR Institute for its support and funding.
This paper was edited by Michael Kühn and reviewed by two anonymous referees.
Abrajano, T. A., Sturchio, N. C., Bohlke, J. K., Lyon, G. L., Poreda, R. J., and Stevens, C. M.: Methane-hydrogen gas seeps, Zambales Ophiolite, Philippines: deep or shallow origin?, Chemical Geology, 71, 211–222, https://doi.org/10.1016/0009-2541(88)90116-7, 1988.
Adjie, N., Bordes, C., Brito, D., Nasri, D., and Normandin, É.: In-soil hydrogen concentration monitoring using MONHyTOR: application for natural hydrogen exploration, In-soil hydrogen concentration measurements using MONHyTOR (EGU 2025), Vienna, Austria, Zenodo [data set], https://doi.org/10.5281/zenodo.15688217, 2025.
Anderson, D. L. and Bass, J. D.: Mineralogy and Composition of the Upper Mantle, Geophysical Research Letters, 11, 637640, https://doi.org/10.1029/GL011i007p00637, 1984.
Baade, W. F., Raman, V. S., and Parekh, U. N.: Hydrogen, Kirk-Othmer Encyclopedia of Chemical Technology, 13, 759–808, https://doi.org/10.1002/0471238961.0825041803262116.a01.pub2, 2001.
Bachu, S.: Analysis of gas leakage occurrence along wells in Alberta, Canada, from a GHG perspective – Gas migration outside well casing, International Journal of Greenhouse Gas Control, 61, 146–154, https://doi.org/10.1016/j.ijggc.2017.04.003, 2017.
Bonté, D., Guillou-Frottier, L., Garibaldi, C., Bourgine, B., Opez, S., Bouchot, V., and Lucazeau, F.: Subsurface temperature maps in French sedimentary basins: new data compilation and interpolation, Bulletin de la Société géologique de France, 181, 377–390, https://doi.org/10.2113/gssgfbull.181.4.377, 2010.
Cathles, L. and Prinzhofer, A.: What pulsating H2 emissions suggest about the H2 resource in the Sao Francisco Basin of Brazil, Geosciences, 10, 1–18, https://doi.org/10.3390/GEOSCIENCES10040149, 2020.
Chevrot, S., Sylvander, M., Diaz, J., Martin, R., Mouthereau, F., Manatschal, G., Masini, E., Calassou, S., Grimaud, F., Pauchet, H., and Ruiz, M.: The non-cylindrical crustal architecture of the Pyrenees, Scientific Reports, 8, https://doi.org/10.1038/s41598-018-27889-x, 2018.
Coveney, R. M., Goebel, E. D., Zeller, E. J., Dreschhoff, G. A. M., and Angino, E. E.: Serpentinization and the Origin of Hydrogen Gas in Kansas, The American Association of Petroleum Geologists Bulletin, 71, 39–48, https://doi.org/10.1306/94886D3F-1704-11D7-8645000102C1865D, 1987.
Davies, K., Josse, R., Frery, E., Esteban, L., Keshavarz, A., and Iglauer, S.: Distinguishing drilling-induced artifacts from naturally occurring hydrogen in soil gas surveys: Insights from sub-circular depressions, International Journal of Hydrogen Energy, 109, 1230–1240, https://doi.org/10.1016/j.ijhydene.2025.02.094, 2025.
Etiope, G., Schoell, M., and Hosgörmez, H.: Abiotic methane flux from the Chimaera seep and Tekirova ophiolites (Turkey): Understanding gas exhalation from low temperature serpentinization and implications for Mars, Earth and Planetary Science Letters, 310, 96–104, https://doi.org/10.1016/j.epsl.2011.08.001, 2011.
Etiope, G., Ciotoli, G., Benà, E., Mazzoli, C., Röckmann, T., Sivan, M., Squartini, A., Laemmel, T., Szidat, S., Haghipour, N., and Sassi, R.: Surprising concentrations of hydrogen and non-geological methane and carbon dioxide in the soil, Science of the Total Environment, 948, https://doi.org/10.1016/j.scitotenv.2024.174890, 2024.
Frery, E., Langhi, L., Maison, M., and Moretti, I.: Natural hydrogen seeps identified in the North Perth Basin, Western Australia, International Journal of Hydrogen Energy, 46, 31158–31173, https://doi.org/10.1016/j.ijhydene.2021.07.023, 2021.
Fu, Z., Yan, Z., and Li, S. L.: Effects of soil pore structure on gas diffusivity under different land uses: Characterization and modelling, Soil and Tillage Research, 237, https://doi.org/10.1016/j.still.2023.105988, 2024.
Fujikawa, T. and Miyazaki, T.: Effects of bulk density and soil type on the gas diffusion coefficient in repacked and undisturbed soils, Soil Science, 170, 892–901, https://doi.org/10.1097/01.ss.0000196771.53574.79, 2005.
Gaillard, F., Scaillet, B., and Arndt, N. T.: Atmospheric oxygenation caused by a change in volcanic degassing pressure, Nature, 478, 229–232, https://doi.org/10.1038/nature10460, 2011.
Giuntoli, F., Menegon, L., Siron, G., Cognigni, F., Leroux, H., Compagnoni, R., Rossi, M., and Brovarone, A. V.: Methane-hydrogen-rich fluid migration may trigger seismic failure in subduction zones at forearc depths, Nature Communications, 15, https://doi.org/10.1038/s41467-023-44641-w, 2024.
Gourdon-Platel, N.: Les alios et les garluches dans le Sable des Landes, Travaux du Laboratoire de Géographie Physique Appliquée, PERSEE Program, https://doi.org/10.3406/tlgpa.1977.871, 1977.
Halas, P., Dupuy, A., Franceschi, M., Bordmann, V., Fleury, J. M., and Duclerc, D.: Hydrogen gas in circular depressions in South Gironde, France: Flux, stock, or artefact?, Applied Geochemistry, 127, https://doi.org/10.1016/j.apgeochem.2021.104928, 2021.
Häussinger, P., Lohmüller, R., and Watson, A. M.: Hydrogen, 6. Uses, in: Ullmann's Encyclopedia of Industrial Chemistry, Wiley-VCH Verlag GmbH & Co. KGaA, https://doi.org/10.1002/14356007.o13_o07, 2011.
Hirose, T., Kawagucci, S., and Suzuki, K.: Mechanoradical H2 generation during simulated faulting: Implications for an earthquake-driven subsurface biosphere, Geophys. Res. Lett., 38, https://doi.org/10.1029/2011GL048850, 2011.
Ibrahim-Bathis, K. and Ahmed, S. A.: Geospatial technology for delineating groundwater potential zones in Doddahalla watershed of Chitradurga district, India, Egyptian Journal of Remote Sensing and Space Science, 19, 223–234, https://doi.org/10.1016/j.ejrs.2016.06.002, 2016.
Larin, N., Zgonnik, V., Rodina, S., Deville, E., Prinzhofer, A., and Larin, V. N.: Natural Molecular Hydrogen Seepage Associated with Surficial, Rounded Depressions on the European Craton in Russia, Natural Resources Research, 24, 369–383, https://doi.org/10.1007/s11053-014-9257-5, 2015.
Lefeuvre, N., Truche, L., Donzé, F. V., Ducoux, M., Barré, G., Fakoury, R. A., Calassou, S., and Gaucher, E. C.: Native H2 Exploration in the Western Pyrenean Foothills, Geochemistry, Geophysics, Geosystems, 22, https://doi.org/10.1029/2021GC009917, 2021.
Lefeuvre, N., Truche, L., Donzé, F. V., Gal, F., Tremosa, J., Fakoury, R. A., Calassou, S., and Gaucher, E. C.: Natural hydrogen migration along thrust faults in foothill basins: The North Pyrenean Frontal Thrust case study, Applied Geochemistry, 145, https://doi.org/10.1016/j.apgeochem.2022.105396, 2022.
Lefeuvre, N., Thomas, E., Truche, L., Donzé, F. V., Cros, T., Dupuy, J., Pinzon-Rincon, L., and Rigollet, C.: Characterizing Natural Hydrogen Occurrences in the Paris Basin From Historical Drilling Records, Geochemistry, Geophysics, Geosystems, 25, https://doi.org/10.1029/2024GC011501, 2024.
Lehujeur, M., Chevrot, S., Villaseñor, A., Masini, E., Saspiturry, N., Lescoutre, R., Sylvander, M., and The Maupasacq Working Group: Three-dimensional shear velocity structure of the Mauléon and Arzacq Basins (Western Pyrenees), BSGF – Earth Sci. Bull., 192, 47, https://doi.org/10.1051/bsgf/2021039, 2021.
Lin, L., Hall, J., Lippmann-Pipke, J., Ward, J. A., Sherwood Lollar, B., DeFlaun, M., Rothmel, R., Moser, D., Gihring, T. M., Mislowack, B., and Onstott, T. C.: Radiolytic H2 in continental crust: Nuclear power for deep subsurface microbial communities, Geochem. Geophy. Geosys., 6, 2004GC000907, https://doi.org/10.1029/2004GC000907, 2005.
Loiseau, K., Aubourg, C., Petit, V., Bordes, S., Lefeuvre, N., Thomas, E., Hoareau, G., and Moretti, I.: Hydrogen generation and heterogeneity of the serpentinization process at all scales: Turon de Técouère lherzolite case study, Pyrenees (France), Geoenergy, 2, https://doi.org/10.1144/geoenergy2023-024, 2024.
Lv, S., Zeng, Y., Wen, J., Zhao, H., and Su, Z.: Estimation of penetration depth from soil effective temperature in microwave radiometry, Remote Sensing, 10, https://doi.org/10.3390/rs10040519, 2018.
Maiga, O., Deville, E., Laval, J., Prinzhofer, A., and Diallo, A. B.: Characterization of the spontaneously recharging natural hydrogen reservoirs of Bourakebougou in Mali, Scientific Reports, 13, https://doi.org/10.1038/s41598-023-38977-y, 2023.
Maiga, O., Deville, E., Laval, J., Prinzhofer, A., and Diallo, A. B.: Trapping processes of large volumes of natural hydrogen in the subsurface: The emblematic case of the Bourakebougou H2 field in Mali, International Journal of Hydrogen Energy, 50, 640–647, https://doi.org/10.1016/j.ijhydene.2023.10.131, 2024.
Malvoisin, B., Brunet, F., Carlut, J., Rouméjon, S., and Cannat, M.: Serpentinization of oceanic peridotites: 2. Kinetics and processes of San Carlos olivine hydrothermal alteration, J. Geophys. Res., 117, 2011JB008842, https://doi.org/10.1029/2011JB008842, 2012.
Massmann, J. and Farrier, F.: Effects of Atmospheric Pressures on Gas Transport in the Vadose Zone, Water Resource Research, 28, 777–791, https://doi.org/10.1029/91WR02766, 1992.
Moretti, I., Prinzhofer, A., Françolin, J., Pacheco, C., Rosanne, M., Rupin, F., and Mertens, J.: Long-term monitoring of natural hydrogen superficial emissions in a brazilian cratonic environment. Sporadic large pulses versus daily periodic emissions, International Journal of Hydrogen Energy, 46, 3615–3628, https://doi.org/10.1016/j.ijhydene.2020.11.026, 2021.
Müller, K., Ferro, N. D., Katuwal, S., Tregurtha, C., Zanini, F., Carmignato, S., Jonge, L. W. D., Moldrup, P., and Morari, F.: Effect of long-term irrigation and tillage practices on X-ray CT and gas transport derived pore-network characteristics, Soil Research, 57, 657–669, https://doi.org/10.1071/SR18210, 2019.
Myagkiy, A., Brunet, F., Popov, C., Krüger, R., Guimarães, H., Sousa, R. S., Charlet, L., and Moretti, I.: H2 dynamics in the soil of a H2-emitting zone (São Francisco Basin, Brazil): Microbial uptake quantification and reactive transport modelling, Applied Geochemistry, 112, https://doi.org/10.1016/j.apgeochem.2019.104474, 2020.
Neal, C. and Stanger, G.: Hydrogen generation from mantle source rocks in Oman, Earth and Planetary Seience Letters, 66, 315–320, https://doi.org/10.1016/0012-821X(83)90144-9, 1983.
Palmes, E. D., Gunnison, A. F., Dimattio, J., and Tomczyk, C.: Personal sampler for nitrogen dioxide, American Industrial Hygiene Association Journal, 37, 570–577, https://doi.org/10.1080/0002889768507522, 1976.
Prinzhofer, A., Cissé, C. S. T., and Diallo, A. B.: Discovery of a large accumulation of natural hydrogen in Bourakebougou (Mali), International Journal of Hydrogen Energy, 43, 19315–19326, https://doi.org/10.1016/j.ijhydene.2018.08.193, 2018.
Prinzhofer, A., Moretti, I., Françolin, J., Pacheco, C., D'Agostino, A., Werly, J., and Rupin, F.: Natural hydrogen continuous emission from sedimentary basins: The example of a Brazilian H2-emitting structure, International Journal of Hydrogen Energy, 44, 5676–5685, https://doi.org/10.1016/j.ijhydene.2019.01.119, 2019.
Ramdohr, P.: A widespread mineral association connected with serpentinization, Neues Jahrbuch fur Mineralogie Abhandlungen, 107, 241–265, 1967.
Sallam, A., Jury, W. A., and Letey, J.: Measurement of Gas Diffusion Coefficient under Relatively Low Air-filled Porosity, Soil Science Society America Journal, 48, 3–6, https://doi.org/10.2136/sssaj1984.03615995004800010001x, 1984.
Saspiturry, N., Allanic, C., and Peyrefitte, A.: Serpentinization and Magmatic Distribution in a Hyperextended Rift Suture: Implication for Natural Hydrogen Exploration (Mauléon Basin, Pyrenees), Tectonics, 43, https://doi.org/10.1029/2024TC008385, 2024.
Sato, M., Sutton, A. J., and Mcgee, K. A.: Anomalous Hydrogen Emissions from the San Andreas Fault Observed at the Cienega Winery, Central California, Pure and Applied Geophysics, 122, 376–391, https://doi.org/10.1007/BF00874606, 1984.
Sato, M., Sutton, A. J., McGee, K. A., and Russell-Robinson, S.: Monitoring of hydrogen along the San Andreas and Calaveras faults in central California in 1980–1984, Journal of Geophysical Research: Solid Earth, 91, 12315–12326, https://doi.org/10.1029/jb091ib12p12315, 1986.
Tari, G. C.: Natural hydrogen exploration: some similarities and differences with oil and gas exploration, in: Natural Hydrogen Systems, De Gruyter, https://doi.org/10.1515/9783111437040-003, 2025.
Thayer, T. P.: Serpentinization considered as a constant-volume metasomatic process, American Mineralogist, 51, 685–710, 1966.
Truche, L., Donzé, F.-V., Goskolli, E., Muceku, B., Loisy, C., Monnin, C., Dutoit, H., and Cerepi, A.: A deep reservoir for hydrogen drives intense degassing in the Bulqizë ophiolite, Science, 383, 618–621, https://doi.org/10.1126/science.adk9099, 2024.
Tugend, J., Manatschal, G., Kusznir, N. J., Masini, E., Mohn, G., and Thinon, I.: Formation and deformation of hyperextended rift systems: Insights from rift domain mapping in the Bay of Biscay-Pyrenees, Tectonics, 33, 1239–1276, https://doi.org/10.1002/2014TC003529, 2014.
Wang, Y., Chevrot, S., Monteiller, V., Komatitsch, D., Mouthereau, F., Manatschal, G., Sylvander, M., Diaz, J., Ruiz, M., Grimaud, F., Benahmed, S., Pauchet, H., and Martin, R.: The deep roots of the western Pyrenees revealed by full waveform inversion of teleseismic P waves, Geology, 44, 475–478, https://doi.org/10.1130/G37812.1, 2016.
Xiang, Y., Sun, X., Liu, D., Yan, L., Wang, B., and Gao, X.: Spatial Distribution of Rn, CO2, Hg, and H2 Concentrations in Soil Gas Across a Thrust Fault in Xinjiang, China, Frontiers in Earth Science, 8, https://doi.org/10.3389/feart.2020.554924, 2020.
Zgonnik, V., Beaumont, V., Deville, E., Larin, N., Pillot, D., and Farrell, K. M.: Evidence for natural molecular hydrogen seepage associated with Carolina bays (surficial, ovoid depressions on the Atlantic Coastal Plain, Province of the USA), Progress in Earth and Planetary Science, 2, https://doi.org/10.1186/s40645-015-0062-5, 2015.
Zgonnik, V., Beaumont, V., Larin, N., Pillot, D., and Deville, E.: Diffused flow of molecular hydrogen through the Western Hajar mountains, Northern Oman, Arabian Journal of Geosciences, 12, https://doi.org/10.1007/s12517-019-4242-2, 2019.
Zwaan, F., Brune, S., Glerum, A. C., Vasey, D. A., Naliboff, J. B., Manatschal, G., and Gaucher, E. C.: Rift-inversion orogens are potential hot spots for natural H2 generation, Sci. Adv, 11, https://doi.org/10.1126/sciadv.adr3418, 2025.
- Abstract
- Introduction
- The MONHyTOR
- Laboratory test
- Test sites in the southwest of France
- Field data: post-installation hydrogen concentration peak for site-specific diffusivity study
- Field data: long-term monitoring
- Conclusions and Outlook
- Data availability
- Author contributions
- Competing interests
- Disclaimer
- Special issue statement
- Acknowledgements
- Financial support
- Review statement
- References