 | 30 Oct 2025
Effect of spatial variability on uranium diffusion in the three facies of the Opalinus Clay at Mont Terri
Marco Fabbri
Theresa Hennig
In this contribution the potential impact of spatial variability of pore water diffusion coefficient on uranium diffusion in the Opalinus Clay formation at the Swiss Mont Terri underground research facility is estimated by means of 2D reactive transport simulations. Three lithological facies are considered: sandy, carbonate-rich, and shaly, each with different porosity ranges and chemical sorption capacities due to variations in mineralogy and reactive surfaces. Unconditional geostatistical simulations of porosity with varying correlation lengths (5–20 m) were used to derive spatially variable pore water diffusion coefficients Dp, included in the reactive transport simulations. Two boundary conditions were tested: (1) a linear and (2) a point source, both simulated over one million years. Homogeneous pore water initial conditions or with spatial gradients were considered as well. Results of simulations indicate that the influence of spatial variability is proportional to the correlation lengths of the underlying geostatistical simulations and increases with longer average migration distances. The effect of spatial variability is measured by the geometrical spread of the isolines representing a fixed concentration of dissolved U resulting from spatially variable coupled simulations with respect to the reference homogeneous simulation. This spread reaches 8.5 % and 12.9 % in the shaly facies for the linear and point source respectively. This can be read as a potential uncertainty affecting assessments based on 1D models. These findings highlight the fact that spatial variability cannot be neglected as source of uncertainty on long-term radionuclide transport in potential repository sites.
- Article
(2756 KB) - Full-text XML
- BibTeX
- EndNote


The Opalinus Clay (OPA) is the chosen host rock for the disposal of radioactive waste in Switzerland, and is a potential candidate formation also in Germany. Prior work (Hennig et al., 2020; Hennig and Kühn, 2021b, c, 2022), based on 1D Reactive Transport Models (RTM) for the OPA at the Mont Terri underground rock laboratory (Pearson et al., 2003; Bossart et al., 2017), demonstrated that uranium sorption is facies-dependent due to variations in mineralogy and in pore water chemistry, which is influenced by interactions with surrounding aquifers. Availability of dissolved total inorganic carbon appears to be the dominant driver for uranium sorption processes in the OPA (Hennig et al., 2020). Furthermore, considering gradients in pore water geochemistry profiles representative of in-situ conditions at Mont Terri led to increased uranium migration distances compared to initially homogeneous scenarios (Hennig and Kühn, 2023).
In this study, the 1D RTM models cited above are extended to 2D, hence enabling us to consider different boundary and initial conditions for predictive models and, crucially, the spatial variability within each facies of the Opalinus Clay. Spatial variability here refers only to the pore water diffusion coefficient of the rock, which is simulated by means of unconditional geostatistical simulations of porosity, with a single underlying variogram model but varying correlation lengths, constrained by the measured range of porosity for each facies of the OPA. Several realisations of spatially variable pore water diffusion coefficients are then incorporated into RTMs, with several combinations of boundary and initial conditions. Distinct chemical mechanistic models accounting for cation exchange and surface complexation as well as the pore water geochemistry and mineralogical data are hereby considered, reflecting the three main lithological facies of OPA at Mont Terri. Together with the homogeneous reference cases, this simulation ensemble allows us to estimate a realistic impact of spatial variability of pore water diffusion coefficient or rather estimate the potential error incurred by neglecting it in the predictive models, hereby including also 1D models. All simulations presented here are computed using the open source scientific code POET (De Lucia et al., 2021), which employs PHREEQC (Parkhurst and Appelo, 2013) as geochemical engine.
This article is organized as follows: Sect. 2 summarises the available data about the OPA, upon which the geochemical models are based. In Sect. 3.2 we describe the geostatistical simulation workflow; in the following Sect. 3.1 we introduce the numerical reactive transport simulations using the POET code and in the following Sect. 3.3 the choices of domain discretisation and initial and boundary conditions. In Sect. 4 the results of the analysis are presented and discussed. The main idea underlying this work is schematically represented in Fig. 1.
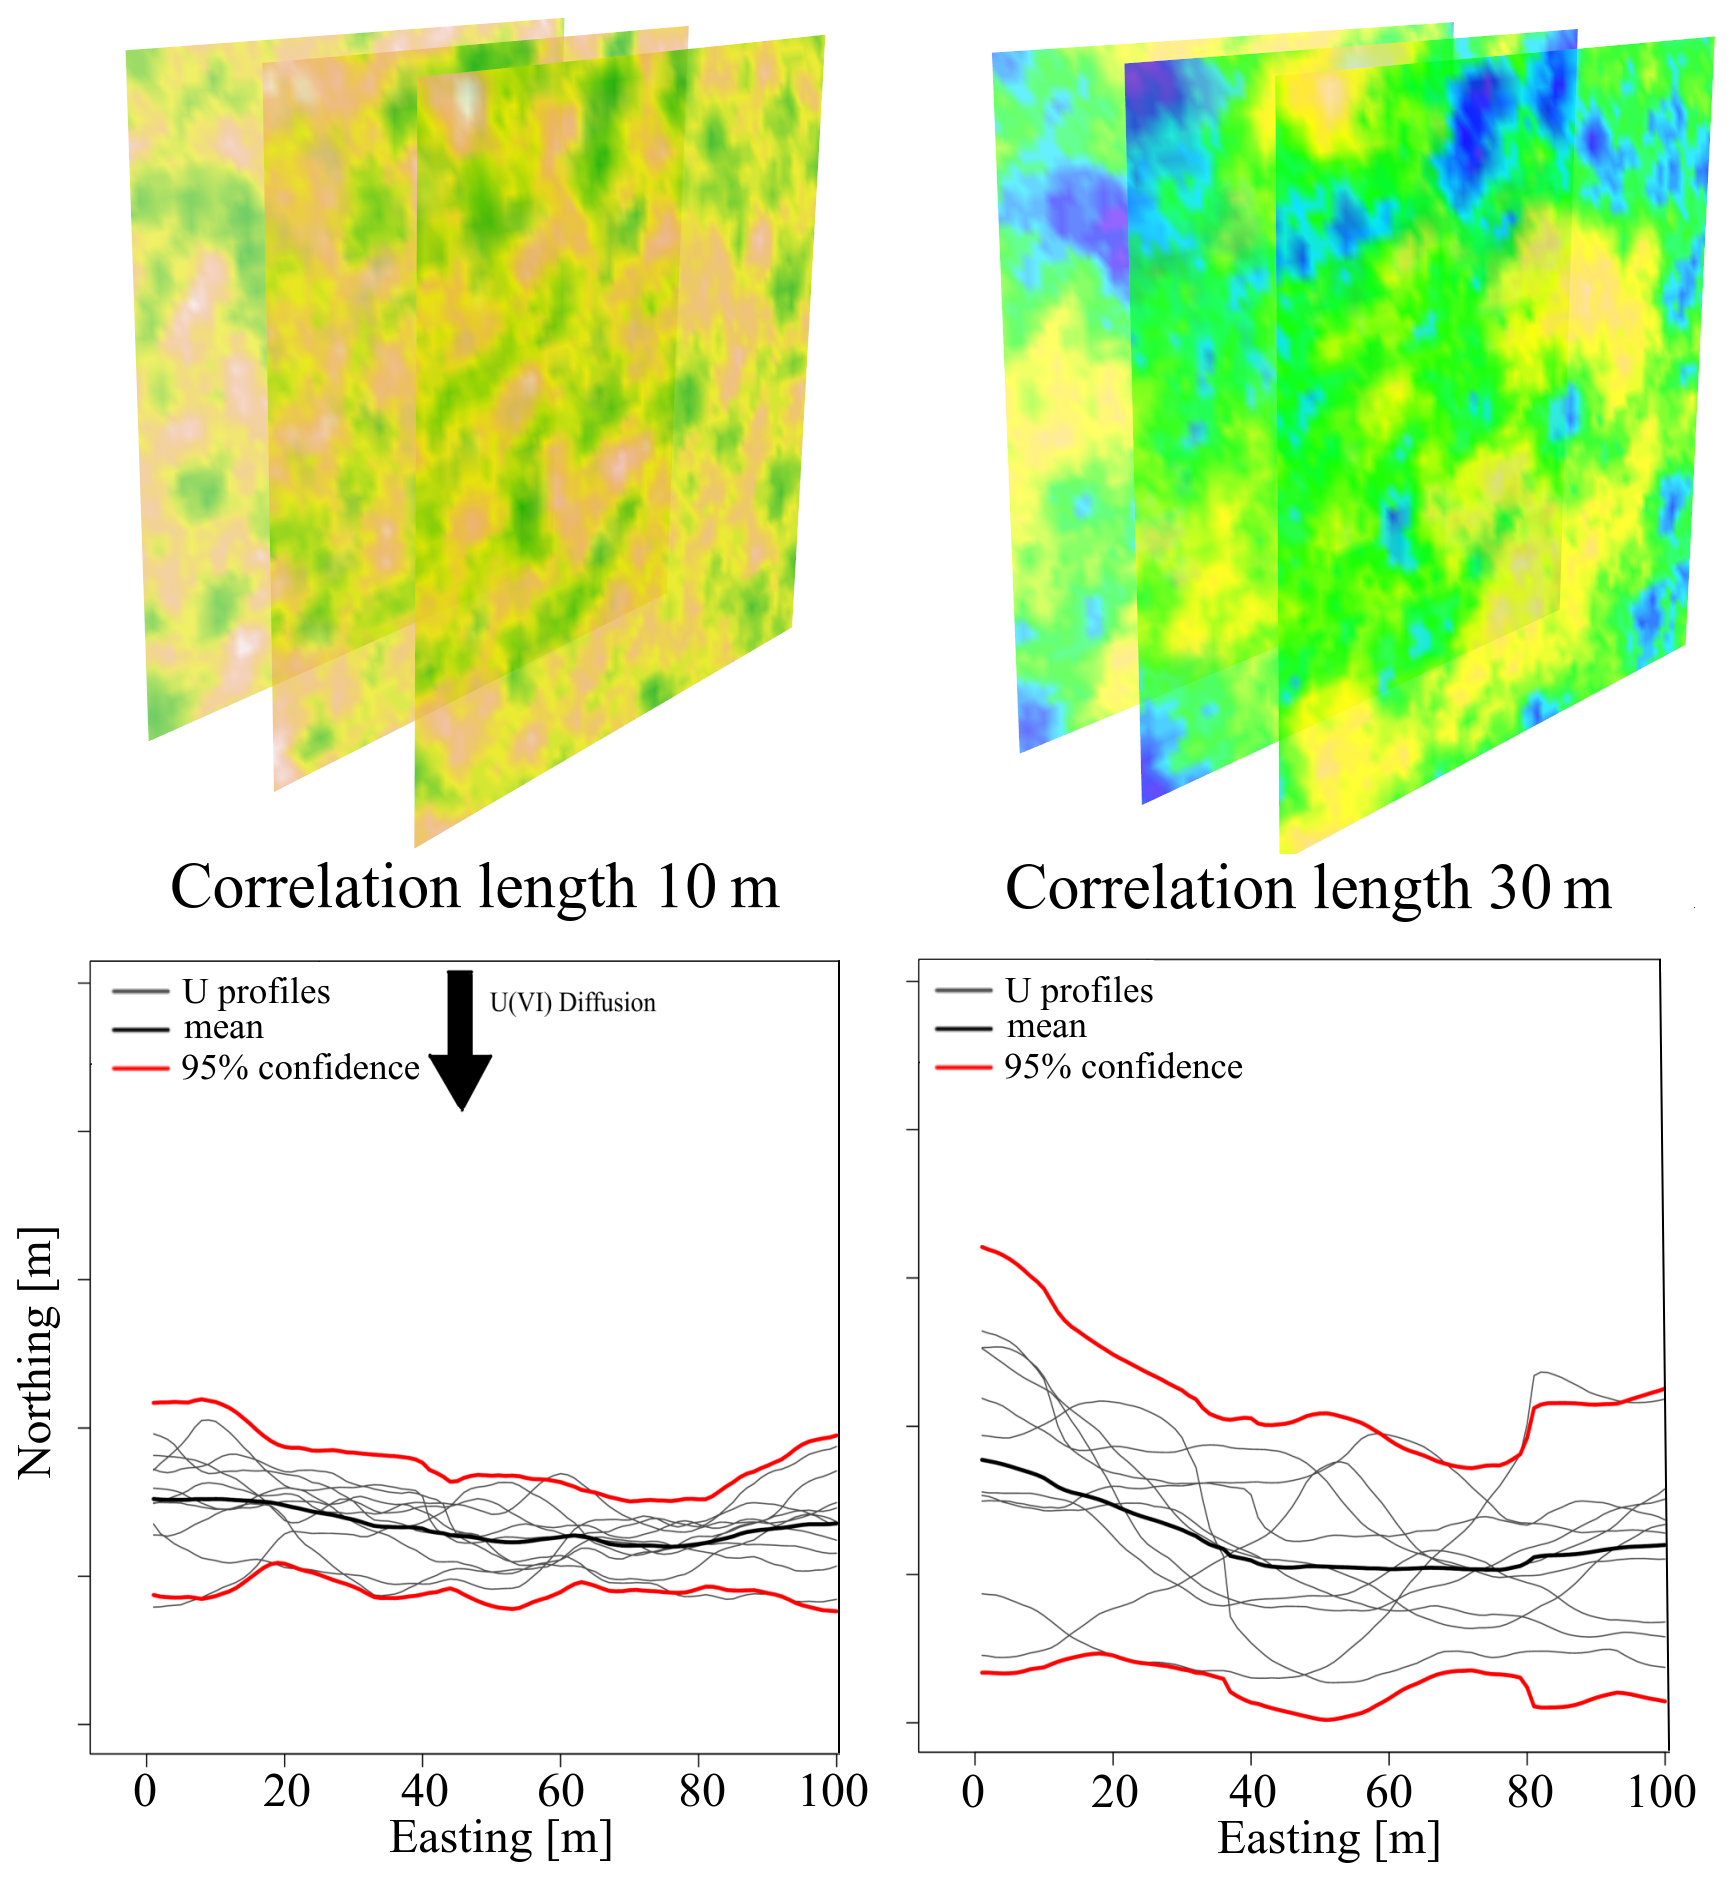
Figure 1Schematical representation of the workflow. Several realisations of spatially variable porosity are drawn by unconditional geostatistical simulation and incorporated into RTM as heterogeneous pore water diffusion coefficients. The spread of the isolines at 10−8 molal in the corresponding RTM simulations after 1 million years quantifies the uncertainty due to spatial variability and can be correlated to the parameters used for the spatial model, i.e., correlation length. The chosen concentration of 10−8 molal is arbitrarily chosen to be well above the observed background concentration in OPA.
In 1995, the Swiss government pointed out the OPA as a suitable potential host rock for the disposal of high-level radioactive waste (HLW) because of its very low permeability, self-sealing properties (swelling), retardation ability with respect to radionuclides and thickness. Since then it has been thoroughly investigated at the Mont Terri underground rock laboratory and the Swiss deep drilling program at the siting regions in northern Switzerland (Pearson et al., 2003; Bossart et al., 2017; Mazurek et al., 2023).
The OPA deposited in a shallow marine environment around 174 Ma ago in the lower Aalenian stage, a subperiod of the Jurassic (Hostettler et al., 2017). It spans across the northern part of Switzerland and southern Germany, with thickness ranging from 60 to 160 m (Hostettler et al., 2017). At Mont Terri, the OPA is overlain by the Passwang Formation of sandy limestones, shales and oolitic ironstones, and underlain by the Staffelegg Formation consisting of limestones and marls with shaly intercalations. Diffusive exchange over millions of years with the current hydrogeological boundaries, the limestones of the Passwang Formation and the Beggingen Member (Gryphae limestone) in the lower Staffelegg, caused gradients in the pore water geochemistry profiles across the OPA (Pearson et al., 2003; Mazurek et al., 2011).
The OPA is characterised by clay minerals and marls, with the presence of sandy and calcareous layers and lenses, resulting in a dark gray argillaceous to light gray silty-sand claystone with a thickness of around 160 m at Mont Terri. Heterogeneity in terms of major mineral content leads to the classification of 3 different lithofacies: (1) shaly, (2) sandy and (3) carbonate-rich sandy facies (Pearson et al., 2003; Hostettler et al., 2017; Kneuker and Furche, 2021).
Detailed mineralogical analyses (Pearson et al., 2003; Bossart et al., 2017; Hostettler et al., 2017) reveal the following approximate compositions in dry weight percent: the shaly facies is dominated by clay minerals (68 %), primarily illite, kaolinite, and alternating illite-smectite layers, with calcite and quartz each contributing around 16 %. The carbonate-rich facies exhibits lower clay content (24 %) but increased calcite (44 %) and quartz (31 %). The sandy facies displays a quartz content similar to the carbonate-rich but contains a higher proportion of clay minerals (59 %) and less calcite (in average 13 %). Table 1 summarises the ranges of porosity for each main facies of the OPA as found in literature (Bossart et al., 2017; Hostettler et al., 2017).
To the best of our knowledge, no parametric model of spatial variability at the scale addressed in this study has been estimated up to now for the three facies of the OPA. This is always a challenging task: the amount of data needed for a reliable estimation is often not available. The general consensus in the literature is that the shaly facies is the most homogeneous, while evidences of larger variability in the upper carbonate-rich layer and of the sandy facies have been hinted by recent geophysical imaging studies (Lüth et al., 2024). This study presents tomographic inversion images of seismic velocities in the upper carbonate-rich layer at Mont Terri. Visually similar spatial structures can be approximated by geostatistical simulations of a spherical variogram with correlation lengths between 8 and 12 m (cf. Sect. 3.2 for the meaning of these terms).
More data related to the expected spatial variability of a low-permeability clay formation are available for the Boom Clay (Belgium). Huysmans and Dassargues (2006) fitted available porosity samples in the direction perpendicular to the bedding with the sum of a spherical variogram with correlation length of 5.8 m and a comparatively large nugget effect (cf. Sect. 3.2 for the definition of this term), suggesting low spatial correlation of accessible porosity. No data about lateral variability are given in that work.
For the purpose of this paper, since no reliable data for a tentative estimation of a realistic variogram model for porosity are available, we chose a simple spherical variogram with different correlation lengths. More details about this choice are given in Sect. 3.2.
3.1 Reactive transport simulator: POET
POET (De Lucia et al., 2021) is an open source, massively parallel reactive transport simulator developed as a cooperation of computer scientists with geoscientists and focused on acceleration techniques such as cache and reuse of results from distributed hash tables (DHT) and use of surrogate models borrowed from machine learning. POET employs PHREEQC (Parkhurst and Appelo, 2013) as a chemical engine, coupled through the IPhreeqc module version 3.8.6 (Charlton and Parkhurst, 2011). POET implements different explicit and implicit numerical schemes for linear Fickian diffusion at macroscopic (Darcy) scale on 2D uniform grids. Transport and chemistry are solved by operator splitting and specifically in a Sequential Non-Iterative Approach (SNIA). All simulations in this work are isothermal and neglect feedbacks between chemistry and thermophysical properties of the fluid (viscosity, density) and of the porous medium.
The governing equation solved by POET for the linear diffusion of a molal concentration C reads:
In this equation, porosity φ does not appear explicitly. This means that it is assumed to be constant in time and implicitly represented via spatially variable diffusion coefficients Dp(x). Furthermore, Dp(x) must represent the so called pore water diffusion coefficient and not the classical effective diffusion coefficient De, since this equation effectively considers grid cells containing only water. De is determined for volumes of grains and pores together (Parkhurst and Appelo, 2013, p. 242), and is related to Dp by:
Note that in Eq. (1) it is no longer possible to bring Dp(x) outside of the divergence term. This is the same equation solved by 1D purely diffusive transport in PHREEQC considering constant Dp, and hence can be seen as a direct extension to 2D and to spatially variable transport of the same approach. Furthermore, this allows a direct comparison with previous results of 1D models of Hennig and Kühn (2021c).
POET solves Eq. (1) with a cell-centered finite difference approach on uniform rectangular 2D grids using an Alternating Direction Implicit (ADI) scheme, which allows for large time steps and hence, potentially, fewer coupling iterations. In RTM simulations, however, and particularly in a SNIA coupling, the time step must be bounded in order to mitigate time discretisation errors arising through the feedbacks of chemical reactions. The ADI scheme as implemented in POET actually allows anisotropic diffusion coefficients , I being the identity matrix, but here we consider only isotropic Dp, i.e., scalar values. Next subsection highlights the specific modelling choices for the setup of RTM simulations of this work.
3.2 Geostatistical Simulations of Porosity and Pore Water Diffusion Coefficients
Geostatistics (Chilès and Delfiner, 2012) is the branch of statistics dealing with spatial processes, i.e., with variables defined over a spatial domain and referred to a specific volume, called support. The fundamental notion of geostatistics is the spatial autocorrelation function, called semivariogram (or, for brevity, just variogram), which expresses the correlation of a spatial random field Z at two distinct points in the domain as a function of their distance. The semivariogram γ(h) is defined as the mathematical expectation (E) of the squared increments of Z as function of the distance vector h:
h is a vector since in the general case the variogram may vary along different directions, or in other words it can be anisotropic. In any case, the hypothesis of ergodicity and stationarity of the moments up to second order is sufficient to ensure the existence of a variogram function, which is a non-negative and usually monotonic function with simple analytical expression. Throughout this study, a unique variogram model is used, the spherical model, which is a truncated polynomial function of order three:
a is the correlation length or range, representing the maximum distance at which two points in the domain show a significant correlation. For distances larger than a the variogram is constant and equals to the sill of Z, which is its variance . If the variogram function does not cross the origin, meaning it is not zero for zero distances, the value of the variogram at h=0, equal to , is called nugget effect and refers to an irreducible uncertainty independent on the coordinates, normally due to the intrinsic variability at a scale lower than the support chosen for the regionalized variable, which is the grid element in our approach. In absence of sufficient data for the OPA, no nugget effect was considered in this work or in other terms n0=0, even if it was already noted that a similar low-permeability formation such as the Boom Clay presents evidences of relatively large nugget Huysmans and Dassargues (2006). This choice implies that the variance of each geostatistical simulation in our workflow is imputed exclusively to the spherical component of the variogram, whereas a n0>0 would add white noise to the geostatistical simulations, with a smoothing effect on the overall influence of spatial variability. A quantitative estimation of the possible influence of nugget effect is left for future work.
Different non-conditional realisations of spatially variable porosity are drawn as reduced Gaussian fields by means of geostatistical simulations honoring an imposed variogram model. Here we adopt the workflow of De Lucia et al. (2011), employing a spectral simulation algorithm based on Discrete Fourier Transform (DFT) on uniform grids (Pardo-Igúzquiza and Dowd, 2003). This technique has the advantage of enabling the simulation of a family of Gaussian fields with different correlation lengths – or variogram models altogether – from a single set of random numbers. This effectively filters out the impact of randomness mitigating the additional variability obtained from several realisations and isolating the effect of different correlation lengths, hence allowing a direct estimation of the sensitivity of model results to the single parameter a (De Lucia et al., 2011).
Each realisation of porosity field is afterwards linearly scaled to obtain a distribution fitting the porosity ranges in each facies, implying that the porosity fields considered in this work are also Gaussian:
The fitting parameters A and B were empirically determined to fit the observed porosity ranges. A summary of the parameters for the linear transformations and of the reference effective diffusion coefficients is given in Table 1.
Table 1Porosity (φ) ranges for the facies of the OPA at Mont Terri (Pearson et al., 2003); parameters for the linear transformation of the geostatistical simulations of reduced Gaussian fields (Eq. 5) and reference effective diffusion coefficients De for each facies, derived from Joseph et al. (2013).
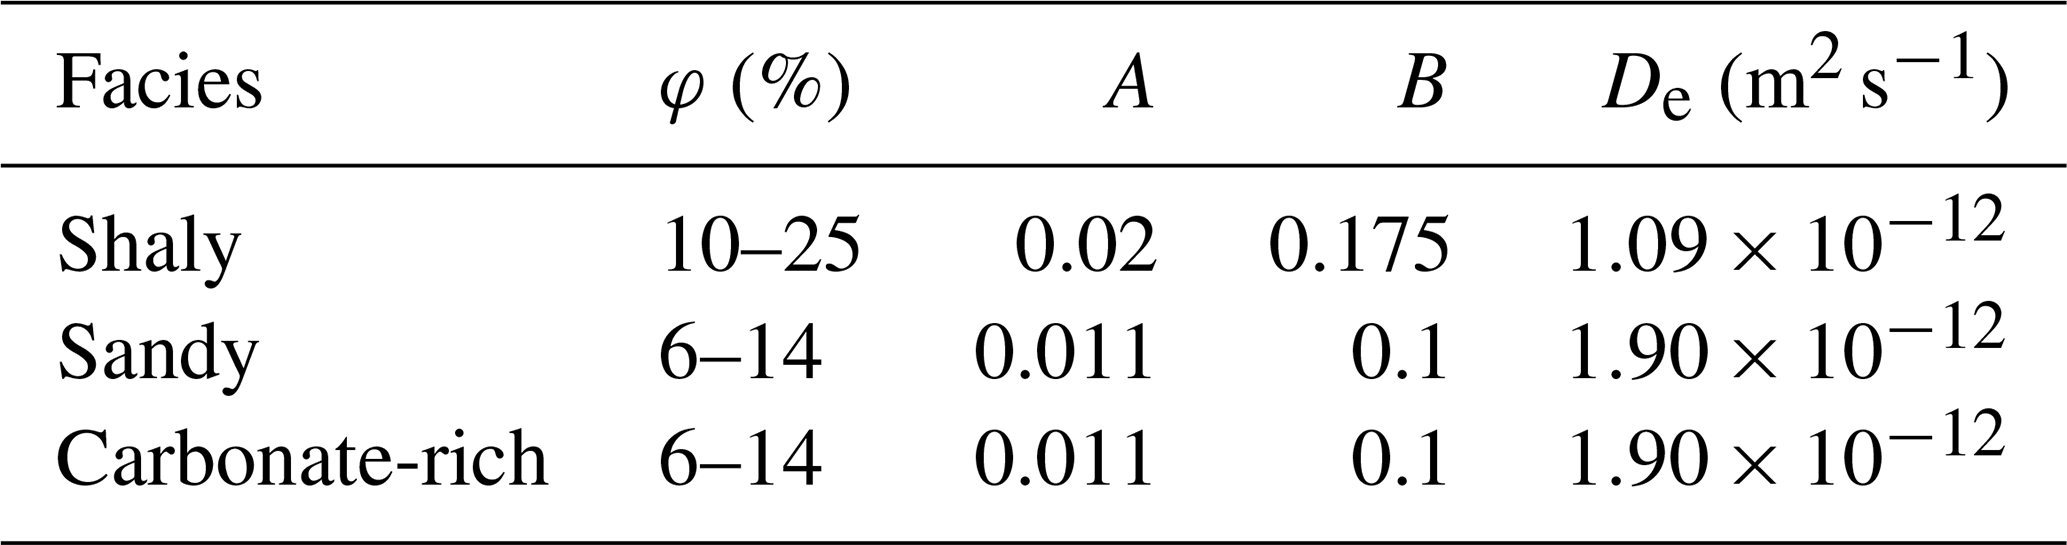
The effective diffusion coefficient De for U(VI) in the sandy facies of the OPA from Mont Terri was determined by Joseph et al. (2013) to be m2 s−1 for a reference accessible porosity of 0.16. Spatially variable isotropic Dp were incorporated in the reactive transport simulations exploiting Eq. (2):
where Yφ is the geostatistical simulation of porosity scaled with Eq. (5). Hence it is here assumed that the pore water diffusion coefficients follow a reciprocal Gaussian distribution.
3.3 Simulation Grid, Boundary and Initial Conditions
All simulations in this work were performed on a 50×50 m2 uniform square grid discretised in 100×100 elements. 10 realisations of random numbers were drawn. Using the spectral DFT simulation algorithm, each set of random number were employed to generate 10 distinct realisations of Gaussian fields for isotropic spherical variograms with range 5, 10 and 20 m respectively. These fields, scaled by Eq. (5), were included in the POET simulations as Dp following Eq. (6).
Two different kinds of boundary conditions were considered (purple lines in Fig. 2):
-
Linear source: at the beginning of the simulations, a Dirichlet (constant concentration) boundary condition was set on one side of the domain. The concentrations at this boundary are equal to the initial state of the domain but with uranium concentration set to 10−6 molal. This setup originates a pseudo-horizontal diffusion front directly comparable with 1D simulations;
-
Point source: same setup as in 1. but the Dirichlet condition with U concentration of 10−6 molal is only set at the four central cells of the top boundary. In this case the diffusion front is roughly concentric.
The vertical boundaries of the domain are closed and the domain side opposite to the source is kept at constant concentration.
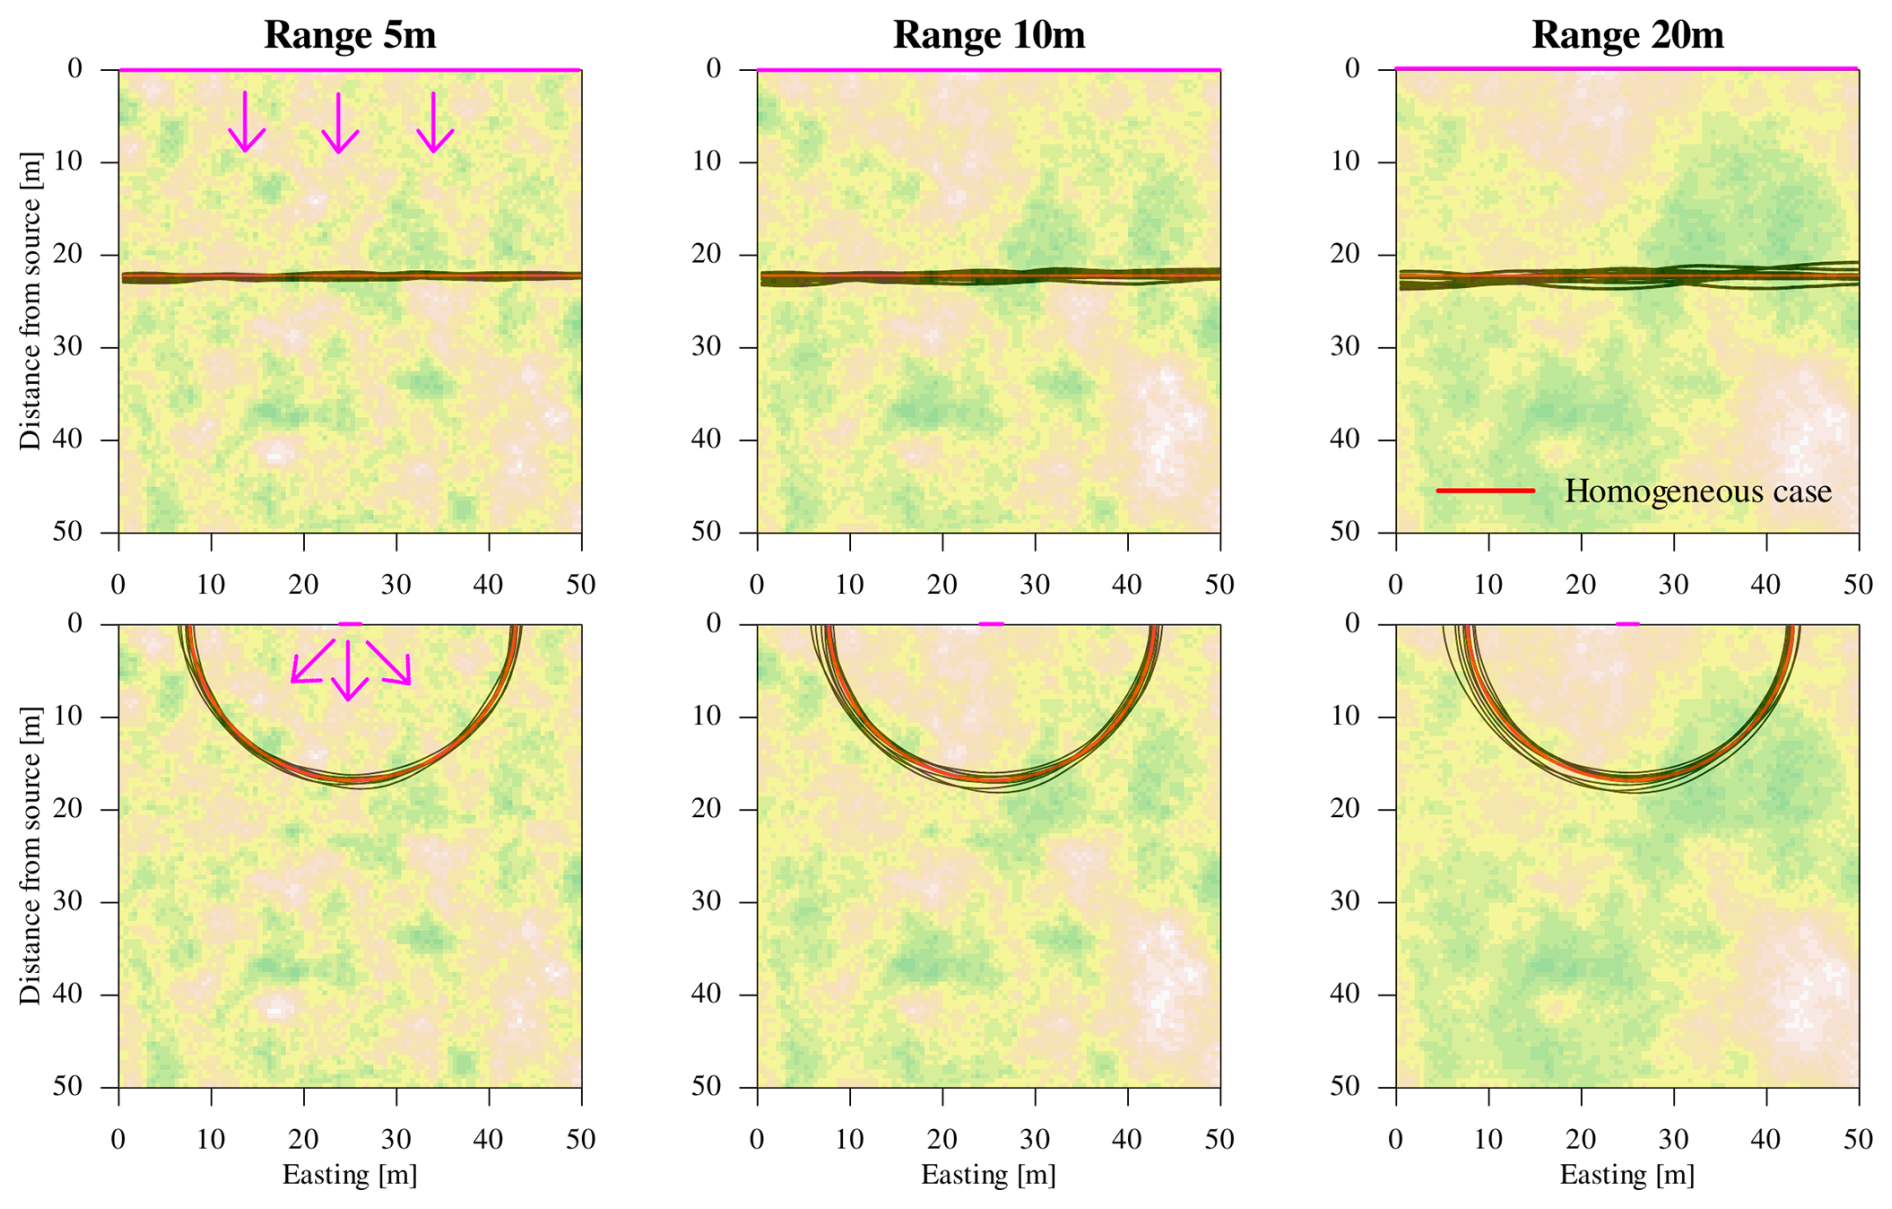
Figure 2Sandy facies, homogeneous initial conditions. The simulation domain of 50×50 m2 is discretised in 100×100 cells. The purple lines indicate the boundary conditions: (Top row) simulations with linear source; (Bottom row) point source. All lines refer to 10−8 molal isoline of total total dissolved uranium after one million years, in red the homogeneous case for reference, in black the results with spatial variability. The underlayed images are example of geostatistical realisations of porosity from the same random numbers but with different correlation lengths: it is well recognizable how the locations of the low and high spots in those simulations (white and darker green colors) are the same and that spatial structures of increasing characteristic extension emerge when increasing the range of the geostatistical simulations.
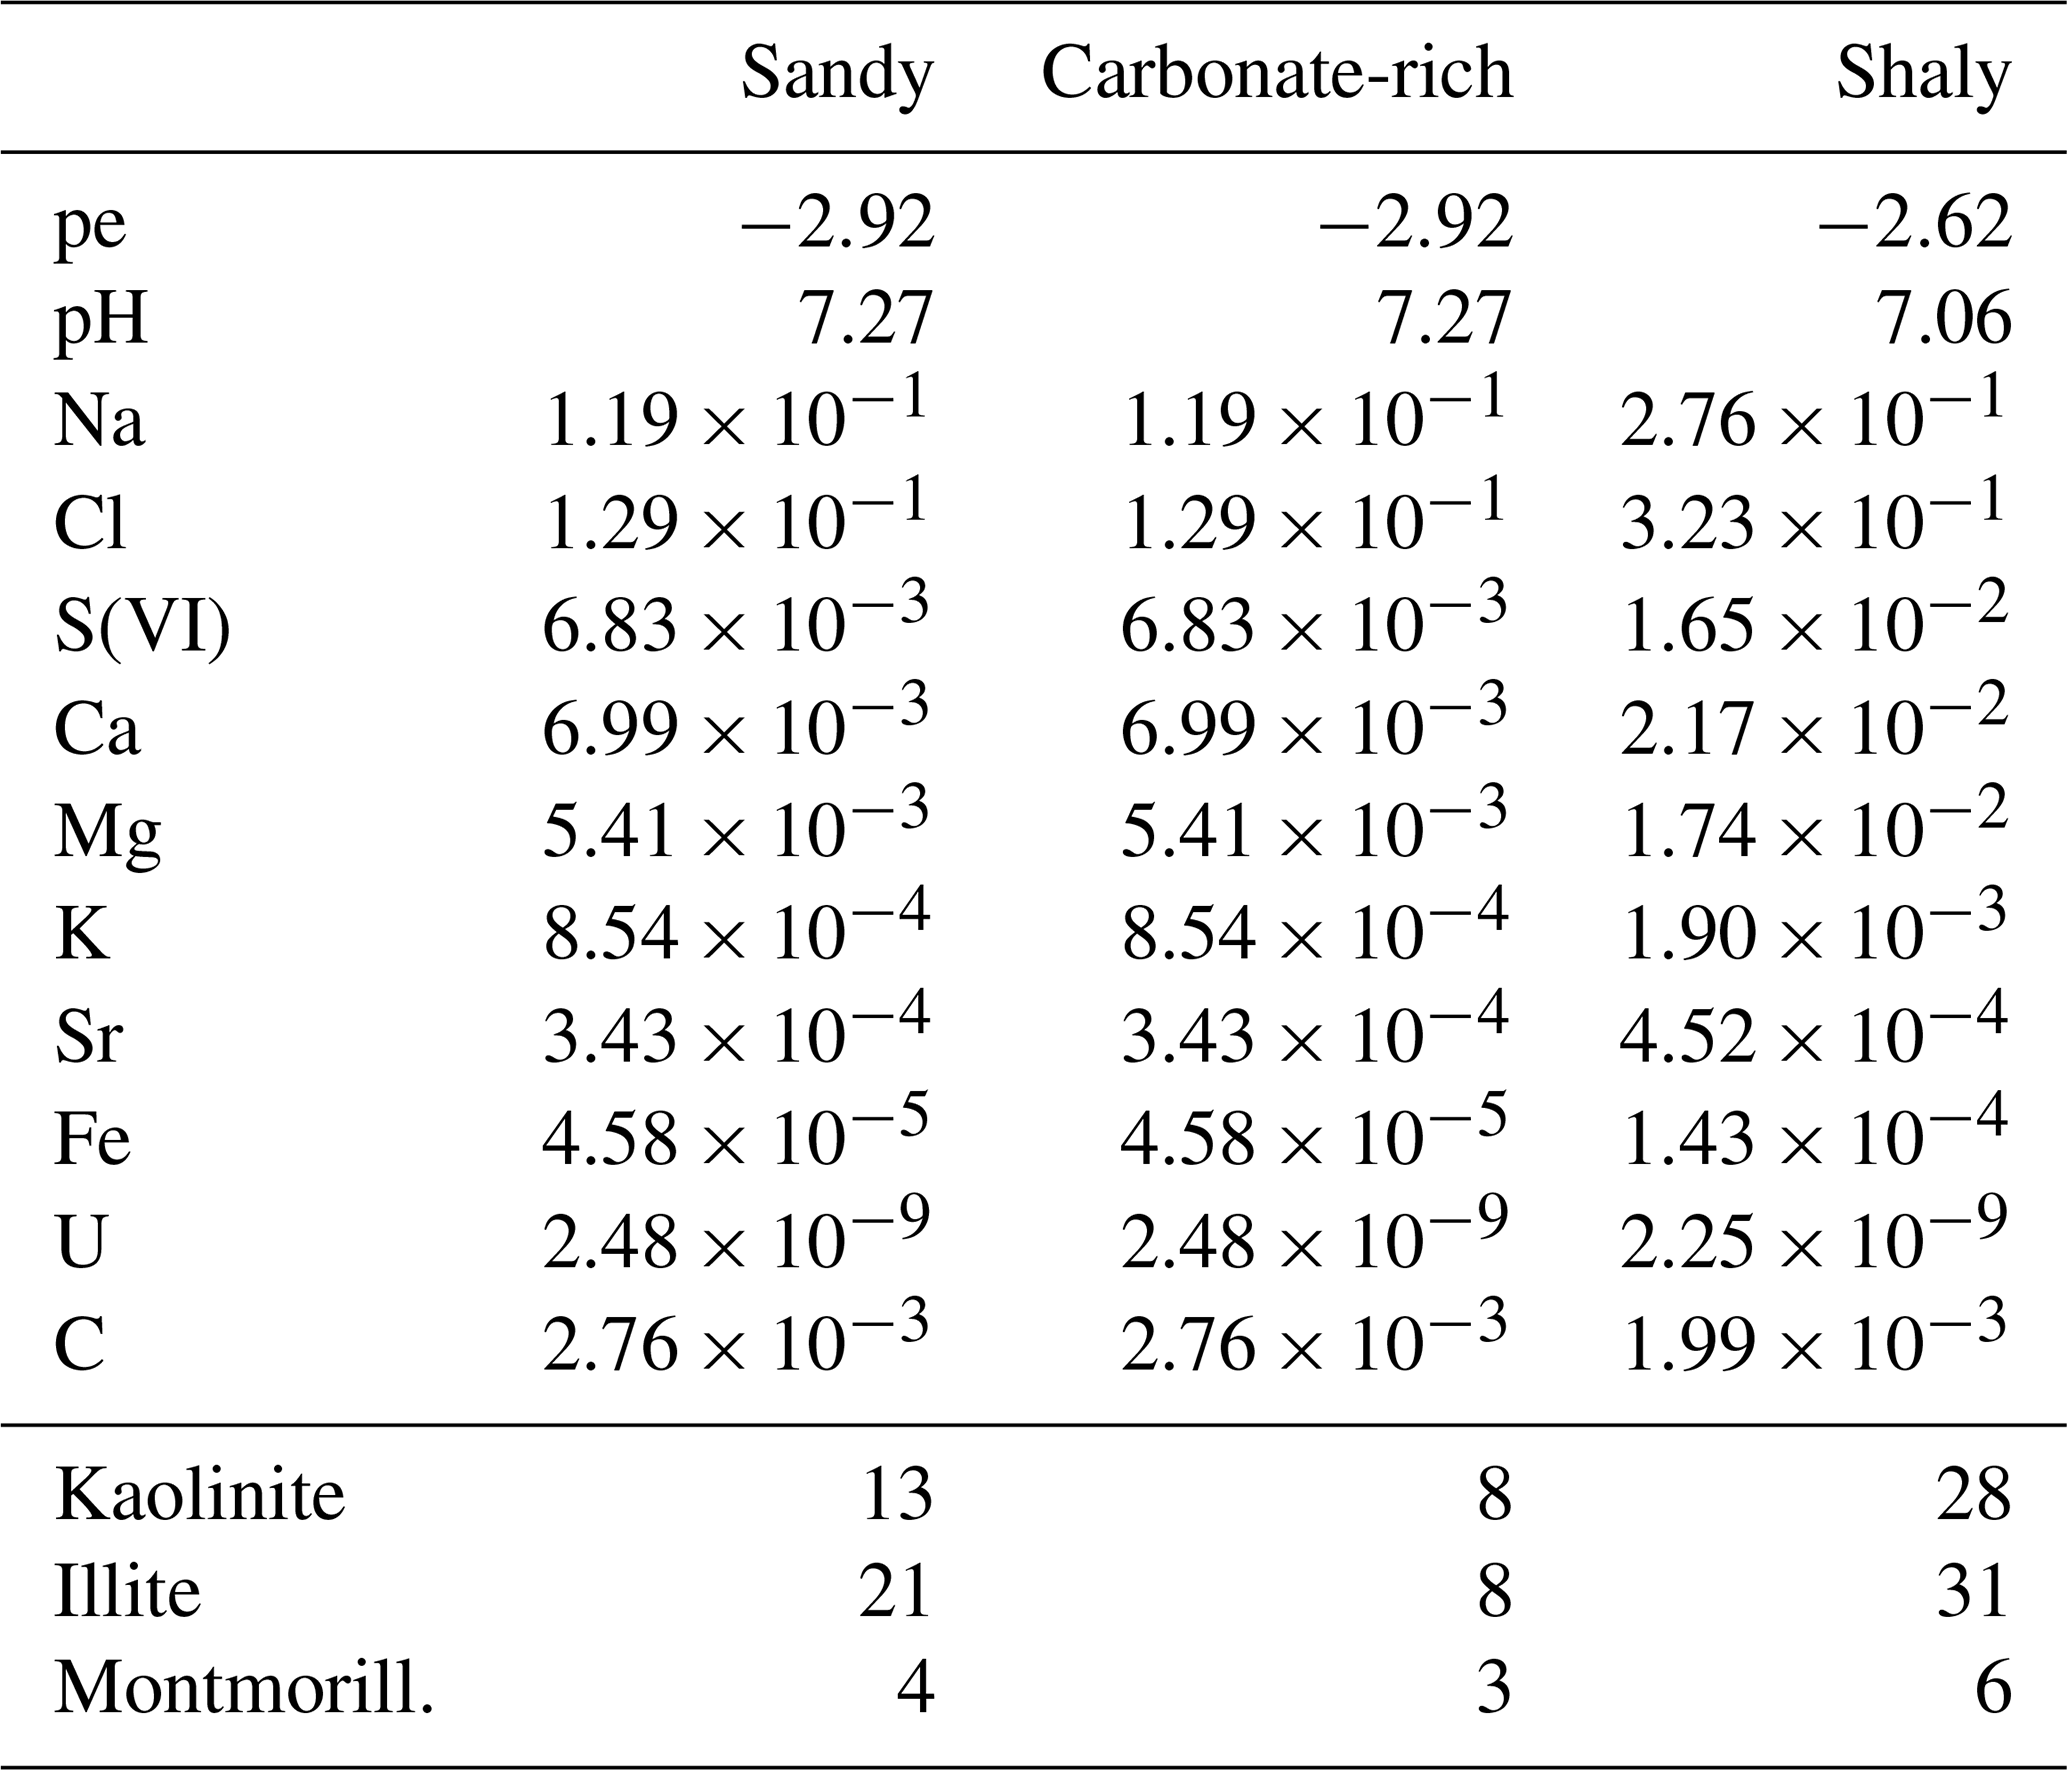
Table 2Initial composition of pore waters in the three facies as considered in RTM. All concentrations are given in molality and the clay minerals' fractions as dry weight percent (Pearson et al., 2003; Hennig and Kühn, 2021a). The reference initial concentrations for the carbonate-rich facies are set equal to those of the sandy facies; the two facies distinguish themselves only by the different content of clay minerals and hence sorption capacity.
Cation exchange and surface complexation are included in the reactive transport simulations following Hennig et al. (2020) and Hennig and Kühn (2021b). The PSI/Nagra thermodynamic database 12/07 (Thoenen et al., 2014) with updated uranium data from Grenthe et al. (2021) was used for all simulations.
Two distinct initial conditions for pore water were considered in the models:
-
Homogeneous initial conditions for the whole domain reflecting the data in Table 2, or
-
Background gradient representing the expected geochemical gradients at Mont Terri. This case is furthermore conceptually divided in simulations towards either lower or higher pore water salinities.
The gradient in pore water chemistry was estimated with a linear regression based solely on the total Cl concentration of sampled pore water analyses between the peak within the OPA and the contact with the Dogger aquifer (Pearson et al., 2003). This resulted in a regression line with slope of 2.57 mmol m−1. For the carbonate-rich and sandy facies, the gradient was applied in either direction, hence depicting scenarios in which U migrates towards higher or lower salinities. In the following we indicate the first case with upwards (↑) and downward (↓) respectively. For the sandy and the carbonate-rich facies, a representative composition for the fresh water of the Dogger formation was then chosen as “lower” boundary for the ↓ case, since applying the computed gradient would have resulted in too low and thus not representative concentrations. A representative concentration of the shaly facies measured at ∼ 100 m from Dogger formation was retained as boundary for the ↑ simulations, which fits very well the computed gradient. For the shaly facies, since all its samples were taken close to the expected highest concentration with respect to the hydrogeologically active fresh water boundaries, it was deemed unrealistic to consider a gradient towards higher salinity, hence in this case only the ↓ gradient was retained. This has been set to the representative concentration measured at ∼ 80 m distance from the Dogger, which is the representative concentration used for the sandy facies. A summary of the imposed boundary conditions to achieve the initial gradients in the distinct scenarios is given in Table 3. It has to be noted that this choices for imposing initial gradients do not consider thermodynamical constraints such as carbonate equilibria and are to be considered very simplified. The intent of these numerical experiences was to explore how the impact of spatial variability (of pore diffusion coefficient) changes because of initial background gradients and not to assess the particular site. Considering more site-specific constraints is left for future work.
Table 3Summary of imposed boundary conditions for the simulation with initial gradients.
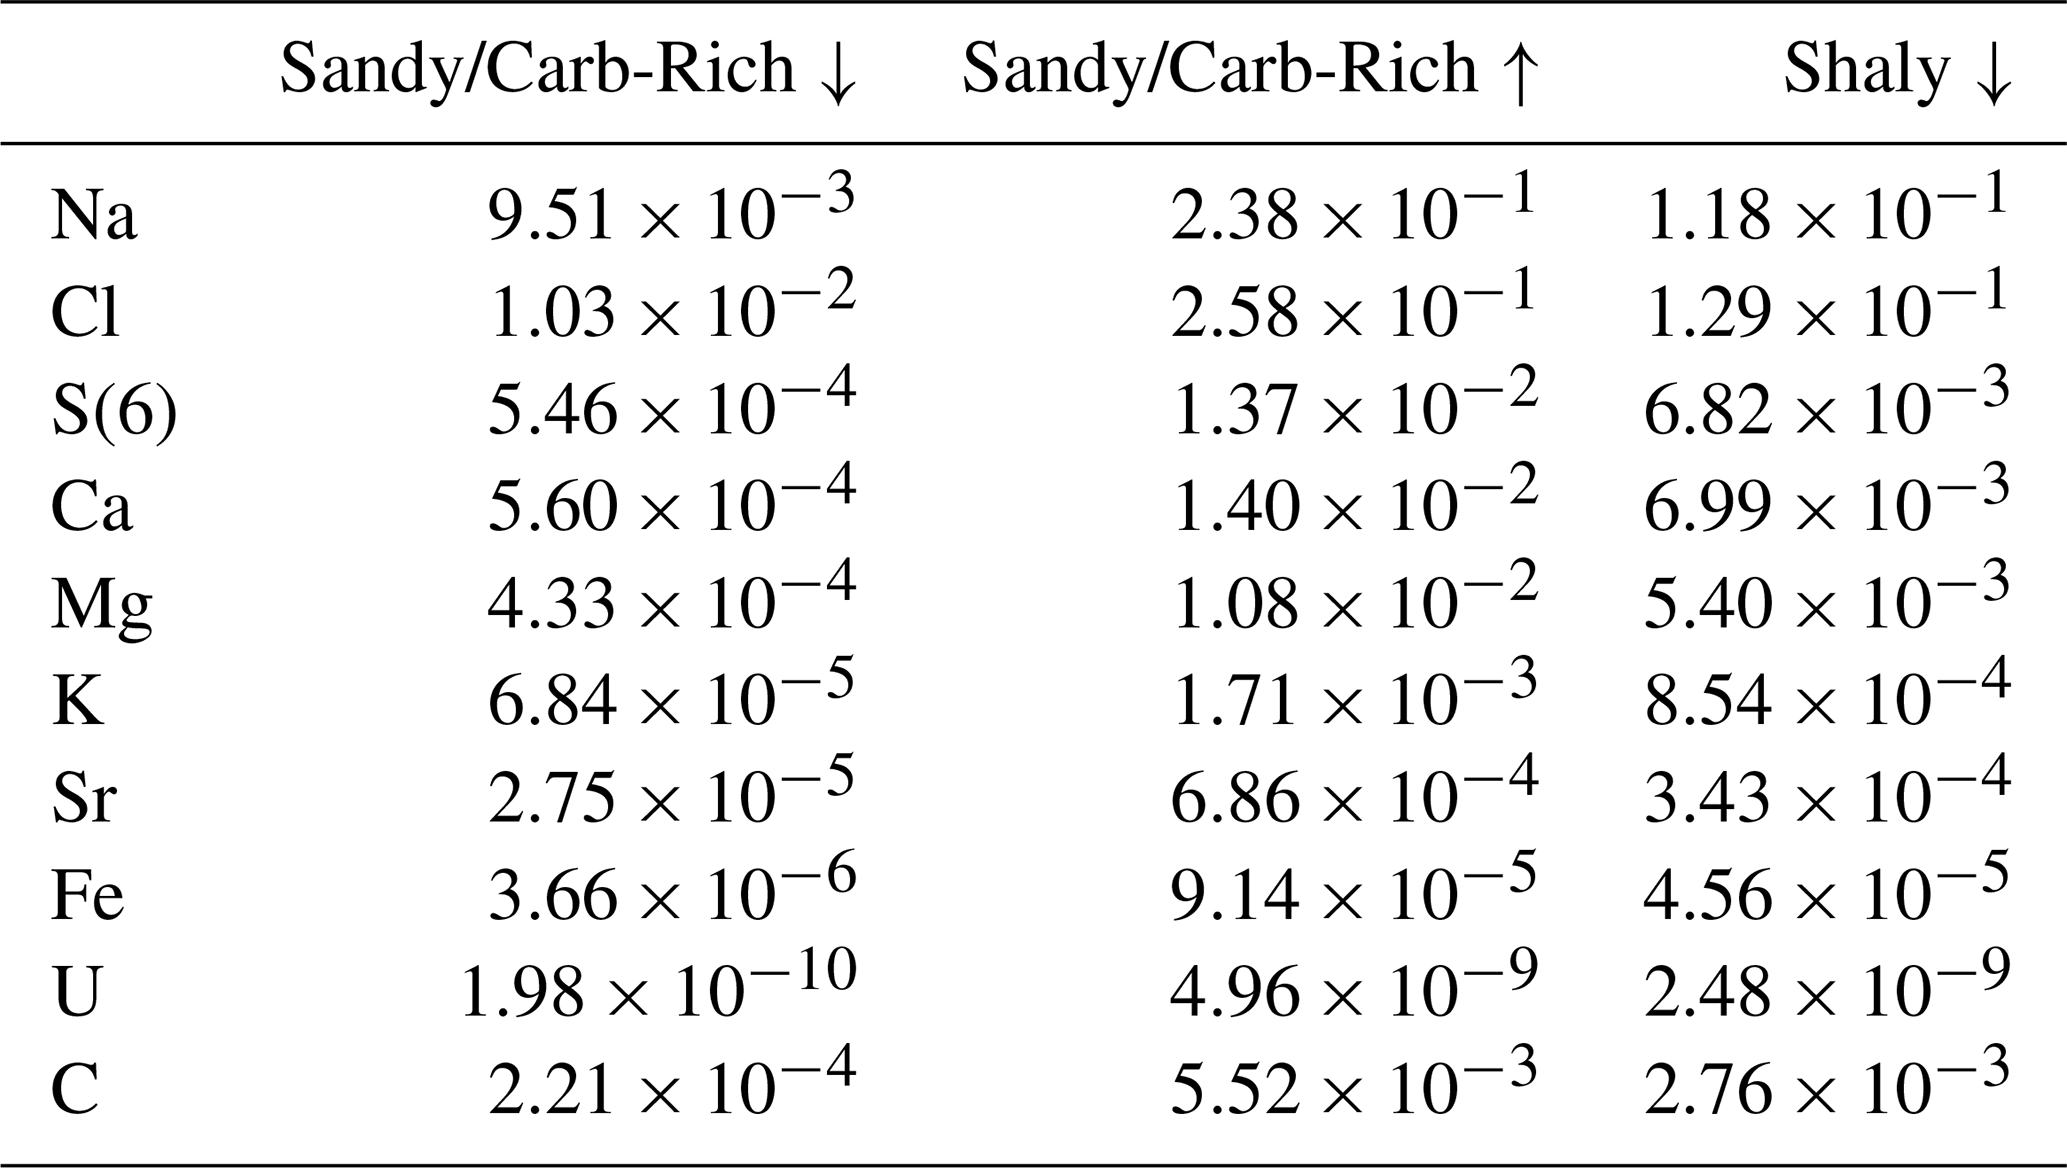
To obtain initial conditions with geochemical gradients, long-time equilibration runs (6×10⁶ a) were conducted for the same 50 × 50 m2 domain imposing on one side the same initial conditions as in Table 2 and on the opposite boundary either a more saline or a less saline solution as explained above and with the concentrations of Table 3. The latter were defined by imposing boundary conditions for pore water concentrations at the boundary opposed to the source, reflecting the observed gradient.
The equilibrated runs with boundary conditions reflecting the imposed gradients were used as initial state for the injection of the 10−6 molal of U for 1 million years. The simulations with initial gradients were run only for the 10 realisations of geostatistical range of 20 m, both for the linear and point source scenarios.
3.4 A Note on Fixed Time Stepping
The fixed time step used for all SNIA coupled POET simulations is of 2000 years, meaning that the end of simulation time at 106 years is reached with 500 coupling iterations. Note that this coupling time step is very large: solving similar problems with an explicit Euler scheme, such as that implemented in PHREEQC 1D transport simulations (FTCS, Forward Time Central Space finite difference scheme), would lead to a CFL (Courant-Friedrich-Lewy) condition of around 250 years, which is exactly 8 times shorter. The 2D heterogeneous ADI scheme implemented in POET gives the opportunity to dramatically increase such time step and hence spare geochemical simulations, at price of errors due to a coarser discretisation of the feedbacks between diffusion and chemistry. A comparison of POET simulations imposing fixed coupling time step of 250 and 2000 years resulted in a systematic overestimation of migration distance – computed for the 10−8 molal isoline of total uranium concentration – of 0.3 m for the coarser simulation. This limited systematic error, which affects both spatially homogeneous and variable simulations, was considered acceptable in view of the dramatic CPU-time savings produced, which amount to 87.5 %. Furthermore, this approximation affects equally all our simulations, both the spatially variable and the homogeneous, meaning that in relative terms the relative effects are “filtered out”. For reference, each POET run for 1 million years and for a 100 × 100 grid took approximately 30 min on 16 cores, and would have taken 4 h on the same hardware resources. Such a CPU time and energy saving becomes very significant when many hundreds of simulations must be run.
Figure 2 displays a summary of the simulations with homogeneous initial conditions for the sandy facies. The picture shows isolines for molal for all 10 realisations of geostatistical fields (in black) for a given variogram range and for reference also the corresponding isoline for the spatially homogeneous case.
The geometrical spread of the isolines clearly increases with increasing correlation lengths of the underlying geostatistical simulations, which means from left to right in Fig. 2. The average migration length of around 22.3 m after 1 million years is very similar to the one obtained for the spatially homogeneous reference case. Here larger correlation lengths cause an increased spread of the uranium isolines, achieving a maximum migration distance of 23.7 m for a correlation length of 20 m in the sandy facies, which is around 6 % longer than the homogeneous case. This can be taken as a rough estimate of the uncertainty of the maximum migration length due to spatial variability.
In Fig. 3 are exemplarily represented the results for the sandy facies in the cases with initial pore water gradients. In the picture, the dashed lines represent the corresponding results of the spatially homogeneous simulations with homogeneous initial conditions: this allows a visual estimation of the potential effect of the pore water salinity gradient (in either direction) on the migration of uranium.
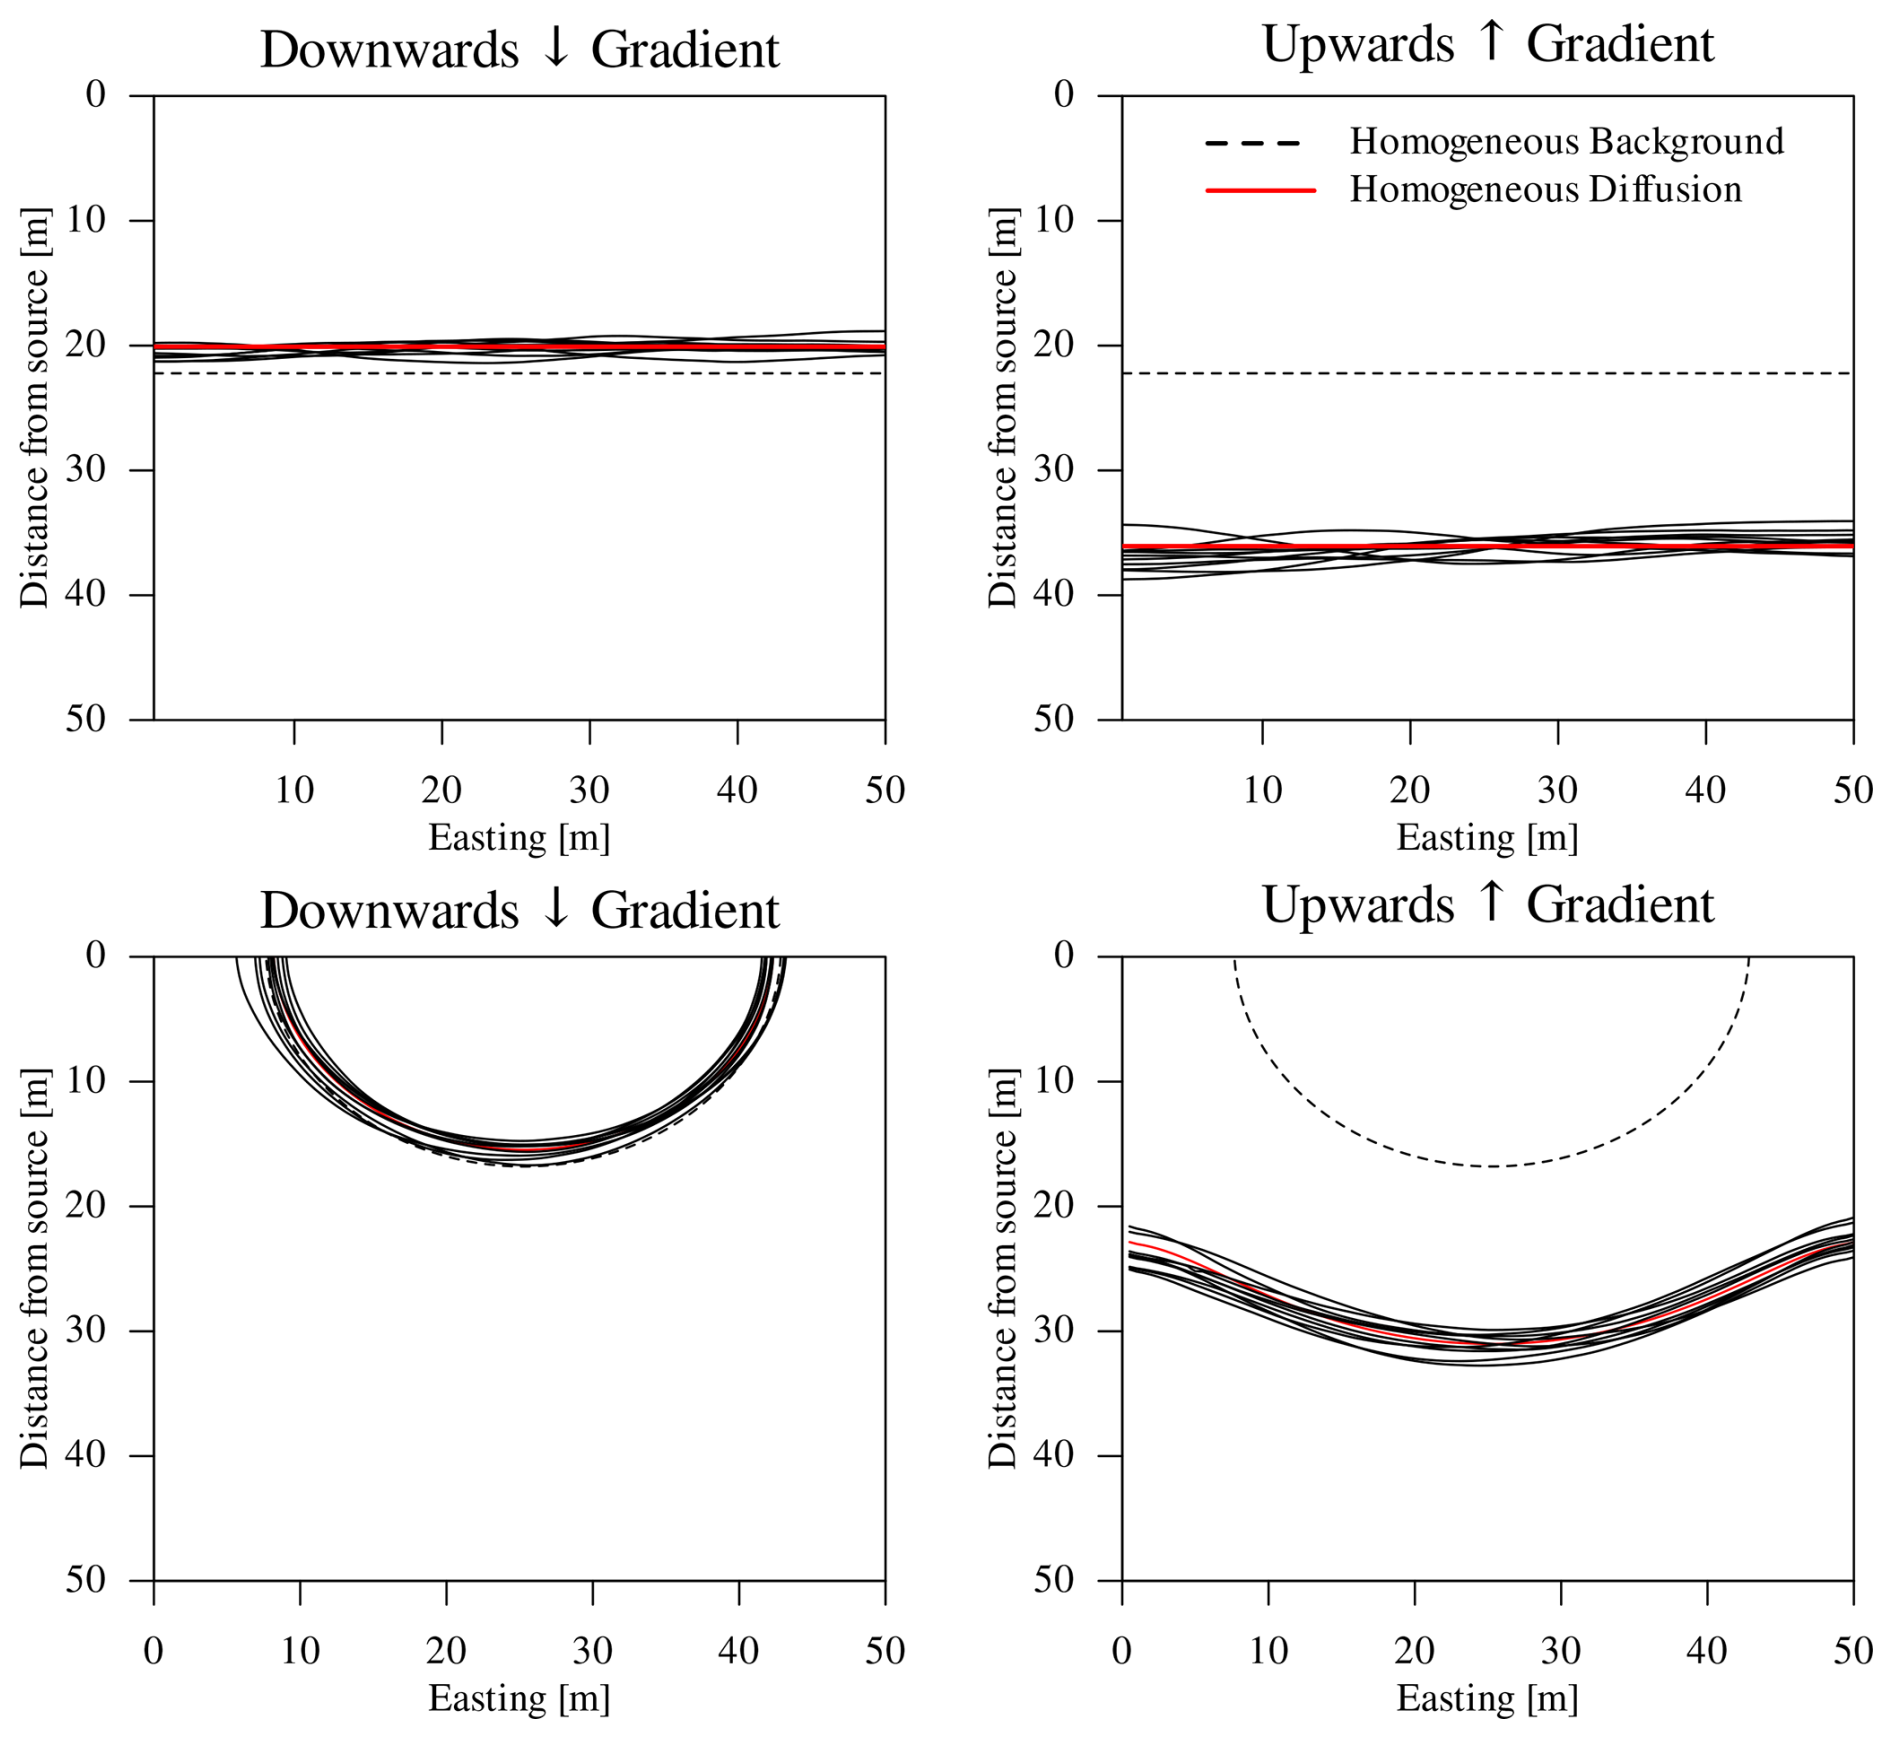
Figure 3Sandy facies, influence of initial concentration gradient on uranium migration lengths. The pictures refer to correlation length of 20 m for the isotropic geostatistical simulations. The dashed lines represent, for reference, the corresponding results for the spatially homogeneous simulations without initial pore water gradient. (Top row) linear source scenario; (bottom row) point source scenario.
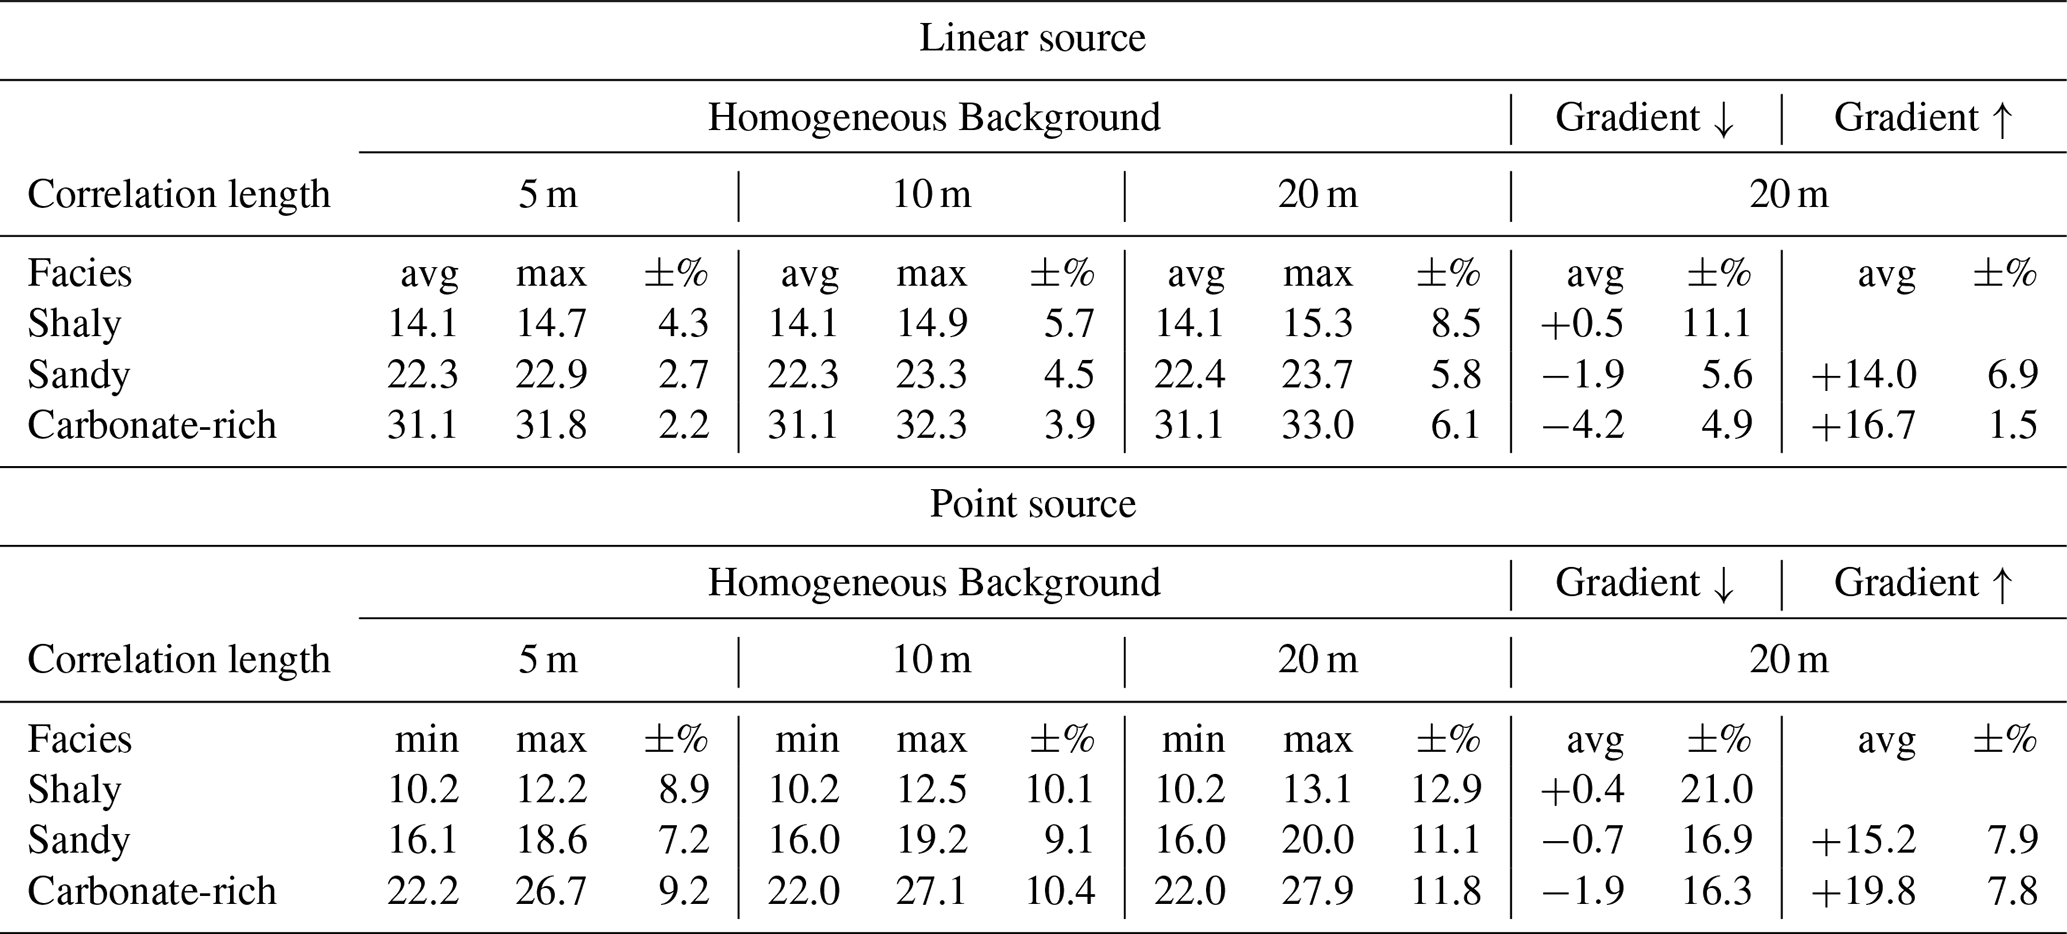
A synthetic summary of the results is given in Table 4, which reports the average, min and max migration lengths for the linear and point source scenarios across all realizations, aggregated per correlation length, and for both the simulations with initial homogeneous background and with gradients towards lower (↓) and higher (↑) concentrations which were run only for the 20 m geostatistical range. The migration distances in the point source scenario were computed based on the longest or shortest euclidean distances between the isoline and the center of the top boundary of the domain. The percentage spread ±% is computed as:
in which max and avg are the maximum and average migration distances of all isolines for a given geostatistical range.
From the table it is evident how larger variogram ranges consistently correlate with increased spreads in both linear and point source scenarios. This can be imputed to the appearance of spatial structures of characteristic dimension able to perturb more and more significantly the diffusive fluxes, which normally tend to smooth out spatial gradients of concentrations.
Table 4Summary of all results for spatially variable simulations in both linear and point source scenarios and for homogeneous initial conditions or with pore water gradients. All values refer to the 10−8 molal isoline of total U concentration; these are divided by facies and for the varying initial conditions, and aggregated by range of the geostatistical simulations. In the table are reported either the average (“avg”) or maximal (“max”) distances in meters of any points in the isoline from the source. The percentage variation ±% is the relative ratio (max − avg)avg × 100 and is a relative measure of the spread of the 10 realisations of spatially variable simulations w.r.t. the average migration lengths.
In the sandy and carbonate-rich facies the application of a downward ↓ gradient results in a decreased migration length and overall influence of spatial variability w.r.t. the spatially homogeneous simulations (Fig. 3). At the contrary, the upward gradient ↑ results in dramatic increases of migration distances for both scenarios (Table 4). Our simplified choice of imposed initial pore water gradients is probably the cause of this effect, notably with regard of initial U concentrations, which in these simulations are scaled in the same way as the unreactive Cl. Our intent thereby was to allow direct comparison with the reference simulations without initial background gradient rather than modeling the actual profiles at Mont Terri. A more careful treatment of site-specific gradients is left for future work.
The shaly facies displays as expected the shortest overall migration lengths due to the highest sorption capacity, ranging from an estimated 4.3 % spread for the a=5 m simulations and 8.5 % for the a=20 m in the linear source case. For this facies, the downward gradient result in an average enhancement of 0.4 m distance w.r.t. the simulations without gradient, while in both other facies the general impact of gradients is reversed. For the carbonate-rich facies, with the lowest sorption capacity, the migration lengths are significantly higher and the spread due to increasing correlation lengths of the geostatistical simulations increases from 2 % to ∼ 6 % in the linear source case.
The point source scenario results in pseudo-concentric uranium isolines and generally leads to shorter migration lengths computed w.r.t. to the center of the source boundary (the top of all figures). The spread in terms of percentage of the maximum distance over the average is in this scenario always significantly larger than in the linear one, but shows the same pattern increasing with larger correlation lengths. The spreads range hereby from a minimum of 7.2 % for the a=5 m simulation in the sandy facies to ∼ 13 % for a=20 m in the shaly.
The increase of average migration lengths for the simulations with upwards ↑ gradient in the sandy and carbonate-rich facies reaches around 50 % in the linear source case and ∼ 90 % in the point source. Note that the closed lateral boundaries in our simulations could affect the results in the latter case. The spread due to spatial variability, not shown in Table 4 because of missing estimation for shorter correlation lengths, but visually evident (for the sandy facies) in Fig. 3, again correlates with the average migration distances of these simulations: it varies from ∼16 % for the sandy facies, relative to an average migration length of 39.4 m, to ∼20 % for the carbonate-rich facies, for which the average migration length is 47.5 m.
For the shaly facies in the linear source scenario, which is directly comparable with 1D models, spatial variability results in maximum distances that diverge from 4.3 % up to 8.5 % with respect to spatially homogeneous models. For the geochemical conditions of the two other facies, the relative spread of uranium isolines is more moderate. The point source scenario, in which uranium migration is radial, results in shorter overall migration distances but a more pronounced impact of spatially variable Dp, reaching up to ∼13 % relative spread in the shaly facies.
For the linear source scenario, the effect of initial downwards ↓ gradient is larger than the effect of spatial variability by a factor of two for the sandy and carbonate-rich facies, but considerably lower in the shaly facies, again by a factor of two. In all the simulations for the point source scenario, the effect of spatial variability is slightly larger than that of downwards gradient. These results however need to be taken as a rough indication since modelling choices can be the reason for this effect, especially in view of the large impact on the results for the opposite upwards ↑ gradient.
The results here presented highlight significant potential effects of spatial variability in the long-term simulation of uranium migration in an argillaceous formation. Several simplifying hypotheses were made for the purposes of this work. The focus here was to estimate the expected uncertainties due to spatial variability of Dp with respect to 1D RTM simulations or 2D homogeneous ones. The choice of a simple spherical variogram model with no nugget effect is one such hypothesis, not based on any hard evidence, even if constrained by the range of accessible porosity observed in the OPA from Mont Terri. A further limitation of these models is the governing equation for linear Fickian diffusion in the domain, which actually neglects spatially variable porosity and mineral fractions. Furthermore, also the geochemical system incorporated in the coupled models only considers surface complexation and cation exchange of the clay mineral fractions, disregarding the contribution of other minerals such as the carbonates, which may be relevant for the OPA (Wersin et al., 2024).
Quantitative analysis of the results reveals that the relative increase in the spread of migration distances, which can be taken as a rough estimate of the uncertainty due to spatial variability, for the linear source scenario was highest in the carbonate-rich facies (from 2.2 % to 6.1 %), for which also the migration distance is the longest. The largest absolute spread in concentration profiles was observed in the shaly facies (4.3 % to 8.5 %). The evaluation of possible impact of spatial variability is made on only 10 realisations of a quite simple spatial model, and must be hence considered as a rough estimate.
The main take-home messages are:
-
Increasing correlation lengths of geostatistical simulations, for the scale addressed in this work, enhance the spread of migration lengths in all considered scenarios. Simulations with geostatistical range of a=20 m display up to ∼13 % spread w.r.t. the homogeneous case in the point source scenario and up to ∼9 % in the linear source scenario, both for the shaly facies;
-
Initial pore water upwards gradients ↑ (main diffusion direction towards increasing salinity), modelled only for the sandy and carbonate-rich facies, have the largest influence on computed migration lengths of uranium. However, a downward ↓ initial gradient had an effect of magnitude comparable to that of variable Dp: around factor two larger for the sandy and carbonate facies, and around factor two lower for the shaly. More refined models however need to be established for this particular purpose, given the simplifying assumptions upon which these results were based.
This study provides a foundation for future research by demonstrating the feasibility of incorporating host rock variability into reactive transport simulations. While limitations exist regarding data availability and needed model simplifications for practical reasons, these results emphasize the need for detailed characterization of spatial correlations at the host-rock scale. This concerns porosity, mineral fractions, and sorption capacities, which are left for future work to address in more depth. Future work should also explore 3D models to better assess the influence of boundary conditions. Furthermore, alternative variogram models should also be considered, also with respect to the possible nugget effect. The expected effect of large nugget is higher variability from geostatistical realisation to realisation, but overall decreased impact of spatial variability itself. Finally, better constraints for the background geochemical gradients are also needed to draw more reliable estimations for the specific site and specific facies. Ultimately, a comprehensive understanding of these factors is crucial for accurate long-term performance assessment of radioactive waste repositories in the OPA and in comparable rock formations.
The POET simulator version 0.4 (Lübke et al., 2025) can be downloaded from Zenodo (https://doi.org/10.5281/zenodo.17433418). Exemplary input scripts for the simulations performed in this work can be requested to the corresponding author. An R package based on the SPECSIM2 code (Pardo-Igúzquiza and Dowd, 2003) and used to generate the geostatistical simulations is also available upon request to the corresponding author.
MDL: Writing (original draft), Conceptualization, Methodology, Software, Funding acquisition, Supervision; MF: Investigation, Visualization, Writing (review and editing); TH: Data Curation, Writing (review and editing).
The contact author has declared that none of the authors has any competing interests.
Publisher's note: Copernicus Publications remains neutral with regard to jurisdictional claims made in the text, published maps, institutional affiliations, or any other geographical representation in this paper. While Copernicus Publications makes every effort to include appropriate place names, the final responsibility lies with the authors. Views expressed in the text are those of the authors and do not necessarily reflect the views of the publisher.
This article is part of the special issue “European Geosciences Union General Assembly 2025, EGU Division Energy, Resources & Environment (ERE)”. It is a result of the EGU General Assembly 2025, Vienna, Austria & Online, 27 April–2 May 2025.
This research was conducted in the framework of M. Fabbri’s Master Thesis, partially funded by an Erasmus+ exchange semester at GFZ Helmholtz Centre for Geosciences.
This research has been supported by the German Federal Ministry of Research, Technology and Space (grant no. 16ME0625).
The article processing charges for this open-access publication were covered by the GFZ Helmholtz Centre for Geosciences.
This paper was edited by Viktor J. Bruckman and reviewed by Sebastian Schramm and one anonymous referee.
Bossart, P., Bernier, F., Birkholzer, J., Bruggeman, C., Connolly, P., Dewonck, S., Fukaya, M., Herfort, M., Jensen, M., Matray, J.-M., Mayor, J. C., Moeri, A., Oyama, T., Schuster, K., Shigeta, N., Vietor, T., and Wieczorek, K.: Mont Terri rock laboratory, 20 years of research: introduction, site characteristics and overview of experiments, Swiss Journal of Geosciences, 110, 3–22, https://doi.org/10.1007/s00015-016-0236-1, 2017. a, b, c, d
Charlton, S. R. and Parkhurst, D. L.: Modules based on the geochemical model PHREEQC for use in scripting and programming languages, Computers & Geosciences, 37, 1653–1663, https://doi.org/10.1016/j.cageo.2011.02.005, 2011. a
Chilès, J.-P. and Delfiner, P.: Geostatistics: Modeling Spatial Uncertainty, Wiley, ISBN 9781118136188, https://doi.org/10.1002/9781118136188, 2012. a
De Lucia, M., Lagneau, V., de Fouquet, C., and Bruno, R.: The influence of spatial variability on 2D reactive transport simulations, Comptes Rendus. Géoscience, 343, 406–416, https://doi.org/10.1016/j.crte.2011.04.003, 2011. a, b
De Lucia, M., Kühn, M., Lindemann, A., Lübke, M., and Schnor, B.: POET (v0.1): speedup of many-core parallel reactive transport simulations with fast DHT lookups, Geosci. Model Dev., 14, 7391–7409, https://doi.org/10.5194/gmd-14-7391-2021, 2021. a, b
Grenthe, I., Gaona, X., Plyasunov, A., Rao, L., Runde, W., Grambow, B., Konings, R., Smith, A., and Moore, E.: Second update on the Chemical Thermodynamics of Uranium, Neptunium, Plutonium, Americium And Technetium, vol. 14 of Chemical Thermodynamics, OECD Nuclear Energy Agency, Boulogne-Billancourt (France), ISBN 9789264947566, https://doi.org/10.1787/bf86a907-en, 2021. a
Hennig, T. and Kühn, M.: Surrogate Model for Multi-Component Diffusion of Uranium through Opalinus Clay on the Host Rock Scale, Applied Sciences, 11, 786, https://doi.org/10.3390/app11020786, 2021a. a
Hennig, T. and Kühn, M.: Uranium migration through the Swiss Opalinus Clay varies on the metre scale in response to differences of the stability constant of the aqueous, ternary uranyl complex Ca2UO2(CO3)3, Adv. Geosci., 56, 97–105, https://doi.org/10.5194/adgeo-56-97-2021, 2021b. a, b
Hennig, T. and Kühn, M.: Potential Uranium Migration within the Geochemical Gradient of the Opalinus Clay System at the Mont Terri, Minerals, 11, 1087, https://doi.org/10.3390/min11101087, 2021c. a, b
Hennig, T. and Kühn, M.: Reactive transport simulations of uranium migration in the Opalinus Clay depend on ion speciation governed by underlying thermodynamic data, Adv. Geosci., 58, 11–18, https://doi.org/10.5194/adgeo-58-11-2022, 2022. a
Hennig, T. and Kühn, M.: Uranium migration lengths in Opalinus Clay depend on geochemical gradients, radionuclide source term concentration and pore water composition, Adv. Geosci., 62, 21–30, https://doi.org/10.5194/adgeo-62-21-2023, 2023. a
Hennig, T., Stockmann, M., and Kühn, M.: Simulation of diffusive uranium transport and sorption processes in the Opalinus Clay, Applied Geochemistry, 123, 104777, https://doi.org/10.1016/j.apgeochem.2020.104777, 2020. a, b, c
Hostettler, B., Reisdorf, A. G., Jaeggi, D., Deplazes, G., Bläsi, H., Morard, A., Feist-Burkhardt, S., Waltschew, A., Dietze, V., and Menkveld-Gfeller, U.: Litho- and biostratigraphy of the Opalinus Clay and bounding formations in the Mont Terri rock laboratory (Switzerland), 23–39, Springer International Publishing, ISBN 9783319704586, https://doi.org/10.1007/978-3-319-70458-6_2, 2017. a, b, c, d, e
Huysmans, M. and Dassargues, A.: Stochastic analysis of the effect of spatial variability of diffusion parameters on radionuclide transport in a low permeability clay layer, Hydrogeology Journal, 14, 1094–1106, https://doi.org/10.1007/s10040-006-0035-2, 2006. a, b
Joseph, C., Van Loon, L., Jakob, A., Steudtner, R., Schmeide, K., Sachs, S., and Bernhard, G.: Diffusion of U(VI) in Opalinus Clay: Influence of temperature and humic acid, Geochimica et Cosmochimica Acta, 109, 74–89, https://doi.org/10.1016/j.gca.2013.01.027, 2013. a, b
Kneuker, T. and Furche, M.: Capturing the structural and compositional variability of Opalinus Clay: constraints from multidisciplinary investigations of Mont Terri drill cores (Switzerland), Environmental Earth Sciences, 80, https://doi.org/10.1007/s12665-021-09708-1, 2021. a
Lübke, M., De Lucia, M., Lindemann, A., Signer, H., Schnor, B. and Straile, H.: POET: POtsdam rEactive Transport (0.4), Zenodo [code and data set], https://doi.org/10.5281/zenodo.17433418, 2025. a
Lüth, S., Steegborn, F., Heberling, F., Beilecke, T., Bosbach, D., Deissmann, G., Geckeis, H., Joseph, C., Liebscher, A., Metz, V., Rebscher, D., Rink, K., Ryberg, T., and Schennen, S.: Characterization of heterogeneities in the sandy facies of the Opalinus Clay (Mont Terri underground rock laboratory, Switzerland), Geophysical Journal International, 236, 1342–1359, https://doi.org/10.1093/gji/ggad494, 2024. a
Mazurek, M., Alt-Epping, P., Bath, A., Gimmi, T., Niklaus Waber, H., Buschaert, S., Cannière, P. D., Craen, M. D., Gautschi, A., Savoye, S., Vinsot, A., Wemaere, I., and Wouters, L.: Natural tracer profiles across argillaceous formations, Applied Geochemistry, 26, 1035–1064, https://doi.org/10.1016/j.apgeochem.2011.03.124, 2011. a
Mazurek, M., Gimmi, T., Zwahlen, C., Aschwanden, L., Gaucher, E., Kiczka, M., Rufer, D., Wersin, P., Fernandes, M. M., Glaus, M., Van Loon, L., Traber, D., Schnellmann, M., and Vietor, T.: Swiss deep drilling campaign 2019–2022: Geological overview and rock properties with focus on porosity and pore-space architecture, Applied Geochemistry, 159, 105839, https://doi.org/10.1016/j.apgeochem.2023.105839, 2023. a
Pardo-Igúzquiza, E. and Dowd, P. A.: SPECSIM2: a program for spectral simulation of anisotropic two-dimensional random fields, Computers & Geosciences, 29, 1013–1020, https://doi.org/10.1016/s0098-3004(03)00102-x, 2003. a, b
Parkhurst, D. L. and Appelo, C.: Description of input and examples for PHREEQC version 3: A computer program for speciation, batch-reaction, one-dimensional transport, and inverse geochemical calculations, USGS, https://doi.org/10.3133/tm6a43, 2013. a, b, c
Pearson, F. J., Arcos, D., Bath, A., Boisson, J.-Y., Fernández, A. M., Gäbler, H. E., Gaucher, E. C., Gautschi, A., Griffault, L., Hernán, P., and Waber, H. N.: Mont Terri Project – Geochemistry of water in the Opalinus Clay formation at the Mont Terri rock laboratory, Tech. rep., Federal Office for Water and Geology, FOWG, ISSN 1660–0754, 2003. a, b, c, d, e, f, g, h
Thoenen, T., Hummel, W., Berner, U., and Curti, E.: The PSI/Nagra chemical thermodynamic database 12/07, PSI Bericht 14-04, Paul Scherrer Institut, Villigen, Switzerland, ISSN 1019-0643, https://www.psi.ch/sites/default/files/import/les/DatabaseEN/PSI-Bericht%2014-04_final_druckerei.pdf (last access: 27 October 2025), 2014. a
Wersin, P., Aschwanden, L., and Kiczka, M.: Cation exchange parameters for Opalinus Clay and its confining units, Applied Geochemistry, 167, 106003, https://doi.org/10.1016/j.apgeochem.2024.106003, 2024. a