 | 23 Nov 2022
The influence of sedimentary heterogeneity on the diffusion of radionuclides in the sandy facies of Opalinus Clay at the field scale
Chaofan Chen
Renchao Lu
Cornelius Fischer
Olaf Kolditz
Haibing Shao
Radionuclide migration in clay-rich formations is typically dominated by diffusion considering the low permeability of these formations. An accurate estimation of radionuclide migration in host rocks using numerical tools plays a key role in the safety assessment of disposal concepts for nuclear waste. In the sandy facies of the Opalinus Clay (SF-OPA), the spatial variability of the pore space network and compositional heterogeneity at the pore scale (nm to µm) cause heterogeneous diffusion at the core scale (cm to dm). Such heterogeneous diffusion patterns affect the migration of radionuclides in various sedimentary layers even above the core scale (m). In this work, we study the heterogeneous diffusion of cations based on a two-dimensional (2D) structural model at the m-scale. As key parameters for the diffusive transport calculation, the effective diffusion coefficients in different sedimentary layers are quantified based on our previous developed up-scaling workflow from pore- to core-scale simulation combined with the multi-scale digital rock models. The heterogeneous effective diffusivities are then implemented into the large-scale structural model for diffusive transport simulation using the FEM-based OpenGeoSys-6 simulator. The sensitivity analysis focuses on the effects of the SF-OPA bedding angle and the effect of different layer-succession layout with different canister emplacement on the spatio-temporal evolution of radionuclide diffusion front line. Results show that the moving distance of the diffusion front is farther away from the canister center, along the direction with the neighboring layer having lower diffusion coefficient within the total simulation time of 2000 years. When the bedding angle increases, the diffusion front moves farther in in vertical upward direction direction, which has less retardation effect for the radionuclide from the ground surface point. For different layer-succession layout with different canister emplacement, the smallest migration distance of the diffusion front line is 1.65 m. Within 2000 years, for the conceptual model 2B that the canister is emplaced in the layer with the highest diffusivity coefficient, the diffusion front can migrate 0.19 m farther along vertical downward direction due to the influence of the neighboring layer. The numerical results provide insight into the effects of rocks heterogeneity on diffusion of radionuclides, contributing to enhanced long-term predictability of radionuclide migration in SF-OPA as potential host rock for a deep geological repository.
- Article
(1553 KB) - Full-text XML
- BibTeX
- EndNote


As a potential host rock for deep geological disposal of nuclear wastes, the Opalinus Clay (OPA) formation has been intensively studied in Switzerland and France (Nagra, 2002a). Radionuclide migration in clay formation is generally dominated by molecular diffusion due to the low permeability of the clay rocks (Van Loon et al., 2003). The Opalinus Clay shows a systematic change in mineralogical composition in Mt Terri as well as in more distant profiles (e.g. Weiach, 120 km away from Mt Terri). This is characterized by a significant increase in carbonate and quartz content to upper profile sections (Nagra, 2002b). The OPA formation is composed of three major lithological facies types including a shaly, a sandy, and a carbonate-rich sandy facies (Bossart and Thury, 2008). Compared to the shaly facies of OPA that shows a very homogeneous structure dominated by fine-grained clay mineral aggregates (Bossart and Thury, 2008), the sandy facies of OPA (SF-OPA) exhibits sedimentary and diagenetic heterogeneity in the mm–cm range (Houben et al., 2014; Bollermann et al., 2022), resulting in a spatial variabilities of the pore network at the pore scale (nm to µm). Such heterogeneities are responsible for the observed heterogeneous diffusion patterns at the core scale (Bollermann et al., 2022). At the core scale, Lauper et al. (2021) quantified the lithological heterogeneity within OPA from northern Switzerland. They concluded that most of the investigated OPA can be described by five distinctive subfacies types that are visually and quantitatively distinguishable by texture and composition. Kulenkampff et al. (2015) studied the anisotropy and compositional structural heterogeneity in OPA. They visualized and quantified the diffusion of 22Na+ radiotracer at the cm- to dm-scale using positron-emission-tomography. Their work shows heterogeneous diffusion patterns due to the preferential diffusion zones. Such heterogeneity shown in core scale will ultimately affect the radionuclide migration in various sedimentary layers of SF-OPA formation at the field scale.
At the meter scale, Hennig and Kühn (2021b) studied the differences between sandy and shaly facies of Swiss OPA. Besides, Hennig and Kühn (2021a) constructed the model with the total thickness of the low permeable section of 210 m. The uranium migration in homogeneous and heterogeneous OPA over six million years has been evaluated and compared. Their results showed that the mineralogical heterogeneity, the partial pressure of carbon dioxide, and the geochemical gradients are dominant factors affecting uranium migration in the OPA formation. Soler et al. (2008) compared the two-dimensional (2D) simulation results with the experimental data in the shaly facies of OPA at the Mont Terri URL. They pointed out that the anisotropic diffusion occurs mainly along bedding planes and the tracer concentrations is the result of a natural heterogeneity of the host rock. Among all different scales, the diffusivity is the key parameter for diffusive transport simulation (Yuan et al., 2019; Lu et al., 2022). Small-scale structural heterogeneities cause the variabilities in sedimentary and diagenetic facies in SF-OPA at larger scales. Consequently, it can affect radionuclides migration in SF-OPA at the larger scale. Improving understanding of the heterogeneous diffusion in SF-OPA will enhance predictability of radionuclide migration. Therefore, a meaningful study on the influence of sedimentary and diagenetic heterogeneities on the heterogeneous diffusion at the field scale requires a comprehensive consideration of pore network variability, compositional heterogeneity and subfacies variability at the smaller scales (pore- and core-scale) within an upscaling workflow.
In this study, using the upscaling strategy developed in a previous work by Yuan and Fischer (2021), the core-scale numerical results of the diffusivities served as input parameters in a 2D field-scale structural model. In the field-scale model, sodium is utilized as tracer for diffusive transport. We simulate its diffusive transport in heterogeneous SF-OPA formation over 2000 years. The sensitivity studies are focused on the effects of bedding angle and the effect of different layer-succession layout with different canister (tracer source) emplacement on the heterogeneous diffusion. The 2D structural model with the input diffusivities upscaled from the core scale allows us to better predict the radionuclides migration in heterogeneous SF-OPA formation in the field scale.
2.1 Mass balance equation
In this study, the Component Transport module in OpenGeoSys (OGS) software (Kolditz et al., 2012; Bilke et al., 2019) is utilized for the calculation of radionuclides migration in SF-OPA at the field scale. The general mass balance equation for the solute diffusion can be written as: (Van Loon et al., 2004; Appelo and Wersin, 2007; Bear and Bachmat, 2012; Lu et al., 2022),
where C (mol m−3) is the concentration of aqueous solute and De (m2 s−1) is the effective diffusion coefficient tensor. Assuming linear isotherm sorption (Wersin et al., 2008), the constant rock capacity α can be calculated by with the porosity ϕ (–), the bulk dry density ρbd (kg m−3), and distribution coefficient Kd (m3 kg−1).
2.2 Diffusivity quantification
The three-dimensional (3D) diffusion equation (Eq. 1) is solved numerically using a previously developed numerical simulator (Yuan et al., 2019; Yuan and Qin, 2020). By setting constant concentrations on both inlet and outlet and no flux at the other boundaries, the effective diffusion coefficient is calculated by the total mass flux J per unit cross-sectional area under steady-state conditions (Yuan and Fischer, 2021):
where Cin and Cout are the prescribed concentrations at the inlet and outlet, respectively. L is the length of the domain.
The effective diffusion coefficients are determined using an integrated upscaling workflow based on the multiscale digital rock models including nanometer scale, micrometer scale, and centimeter scale. At the nanometer scale, the digital rocks of pore network geometry are reconstructed from the image data acquired by focused ion beam scanning electron microscope (FIB-SEM). At this scale, the electrostatic diffusion for cations and anions within the diffuse layer is considered and the Donnan approach is applied to calculate the surface electrostatic potential (Appelo and Wersin, 2007; Parkhurst and Appel, 2013; Yuan and Fischer, 2021). The calculated effective diffusion coefficients at this scale are then used as input parameters in the µm-scale model for diffusive transport calculations.
At the µm scale, the digital rocks provide the variability of the mineral composition. Transport calculations at the nm scale show the effective diffusivity of the matrix-supported (MS) texture pores is up to two orders of magnitude higher than in the grain-supported texture pores (GS) and intragranular pores (IG). Therefore, we consider that the microstructure of the host rock is composed of the higher permeable MS and lower permeable non-MS (GS and IG) (for definition of MS, GS, and IG see Bollermann et al., 2022). According to the experimental analysis (Bollermann et al., 2022), the clay laminae consists of 70 % clay mineral aggregates, which contains 85 % MS. The mixture of clay and sand layers consists of 50 % clay mineral aggregates contaning 20 % MS. The carbonate lenses are composed of 54 % calcite and 10 % clay mineral aggregates, giving an GS content of 5 % and an IG content of 65 %. The effective diffusion coefficient of the digital rock at the µm scale is finally estimated by solving the Eqs. (1) and (2). For more details on the upscaling workflow from nm- to µm scale and digital rock models reconstruction, the readers are referred to Yuan and Fischer (2021) and Bollermann et al. (2022).
The calculated effective diffusivities of clay laminae, the mixture of clay and sand laminae, and carbonate lenses are used to estimate the effective diffusivity of SF-OPA with the subfacies compositions at the centimeter scale, which is quantified using μ-CT segmentation (cf. Fig. 1). At last, the effective diffusion coefficients of the sedimentary layers of SF-OPA are implemented into the large-scale structural model (e.g. Fig. 2) for diffusive transport simulation using the FEM-based OpenGeoSys-6 simulator (Kolditz et al., 2012; Bilke et al., 2019).
2.3 Molecular diffusion
In the diffusion process, the movement of molecules is represented as a molecular random migration from a microscopic point of view, which can be described by Brownian motion (Grathwohl, 1998; Berg, 2018). Because the diffusive spreading of molecules exhibits a Gaussian normal distribution, the effective diffusion coefficient is linearly correlated with mean square displacement, which is calculated by the displacement of the standard deviation of the molecular distribution, σ (Grathwohl, 1998).
where, N(x,t) is the number density of molecules at x after time t and N0 is the total number of molecules.
According to the Gaussian normal distribution, the mean square displacement in a 2D system can be described as a measure for the diffusion distance,
In this study, we consider these molecules fall within ±σ of the mean position, which localizes at 68 % of total molecules at each diffusion time (Yuan and Fischer, 2022). The concentration of molecules at the standard deviation, σ, is 61 % of the maximum concentration at each diffusion time (Grathwohl, 1998).
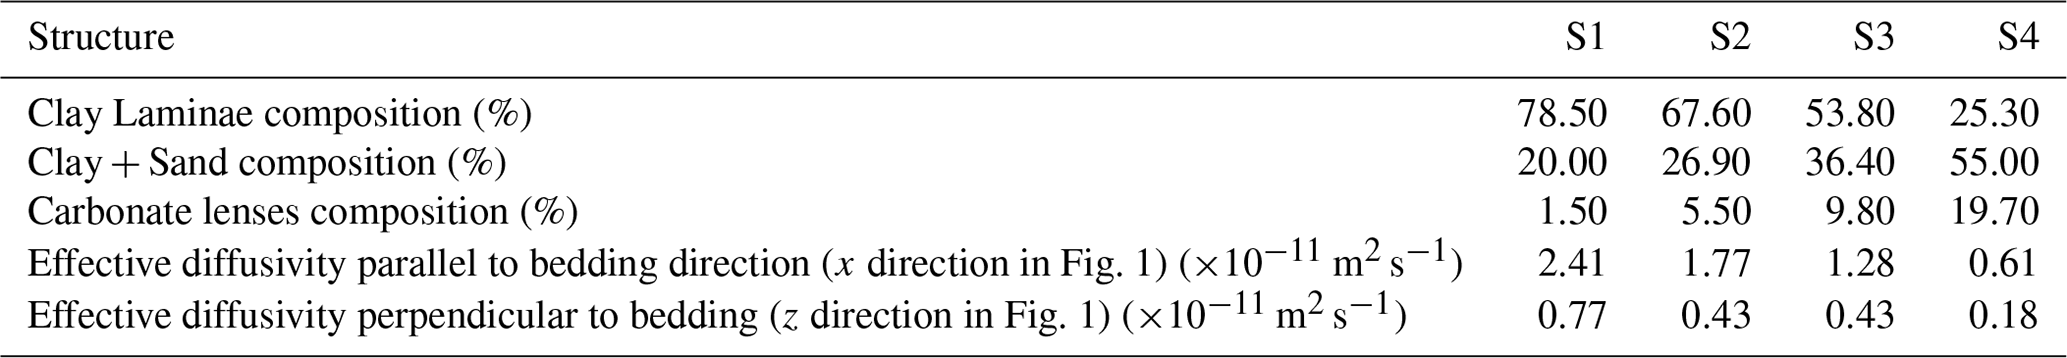
In this study, four representative structures of SF-OPA with different subfacies compositions (Fig. 1) are selected to represent various sedimentary layers of SF-OPA formation at the field scale. As shown in Fig. 1, structure 1 (S1) contains a low concentration of carbonate lenses distributed separately in the clay laminae of the shale. Structure 2 (S2) contains a continuous thin layer of carbonate lenses. The structures 3 (S3) and 4 (S4) contain some large patches of isolated carbonate lenses, resulting in a high concentration of carbonate lenses. The subfacies compositions of S1–S4 and the corresponding effective diffusivities based on the upscaling workflow are listed in Table 1.

Figure 1Four structures of SF-OPA with different subfacies compositions. The four cases show the different structure types with a low concentration of carbonate lenses (S1), single layer (S2), and a high concentration of carbonate lenses (S3 and S4). Figure is modified after Yuan and Fischer (2022).
Table 1Subfacies compositions and the effective diffusivities of four structures of SF-OPA. The compositions are quantified using μ-CT segmentation. The effective diffusivities are calculated using an upscaling workflow and digital rock models.
In the numerical experiment, we simulate the diffusive propagation of the Na+ tracer from a canister (length = 1.2 m, width = 1.2 m) into a simplified 2D structural SF-OPA formation (length = 40 m, thickness = 20 m), as shown in Fig. 2. The simplified 2D formation consists of four layers with different structures (S1–S4), which have an identical length of 40 m and an identical thickness of 5 m. We assume each layer has a homogeneously distributed structure resulting in a homogeneous diffusivity. The canister is placed inside of bentonite buffer (length = 2.4 m, width = 2.4 m), which has a porosity and effective diffusion coefficient of 0.36 and m2 s−1, respectively (Nagra, 2002a). The initial concentration of the Na+ is 0.3 mol L−1. All the boundaries are no-flux conditions. The total simulation time is 2000 years.
In the case studies, we first place the canister in the center of layer S3. In this case, based on the concentration at the σ, the displacements of diffusion front in both x− and z− direction are first calculated at each diffusion time. The positions of diffusion front are determined based on their σ values. We then compare the diffusion fronts after 1000 and 2000 years' diffusion to study the migration of tracer in the heterogeneous SF-OPA at the field scale.
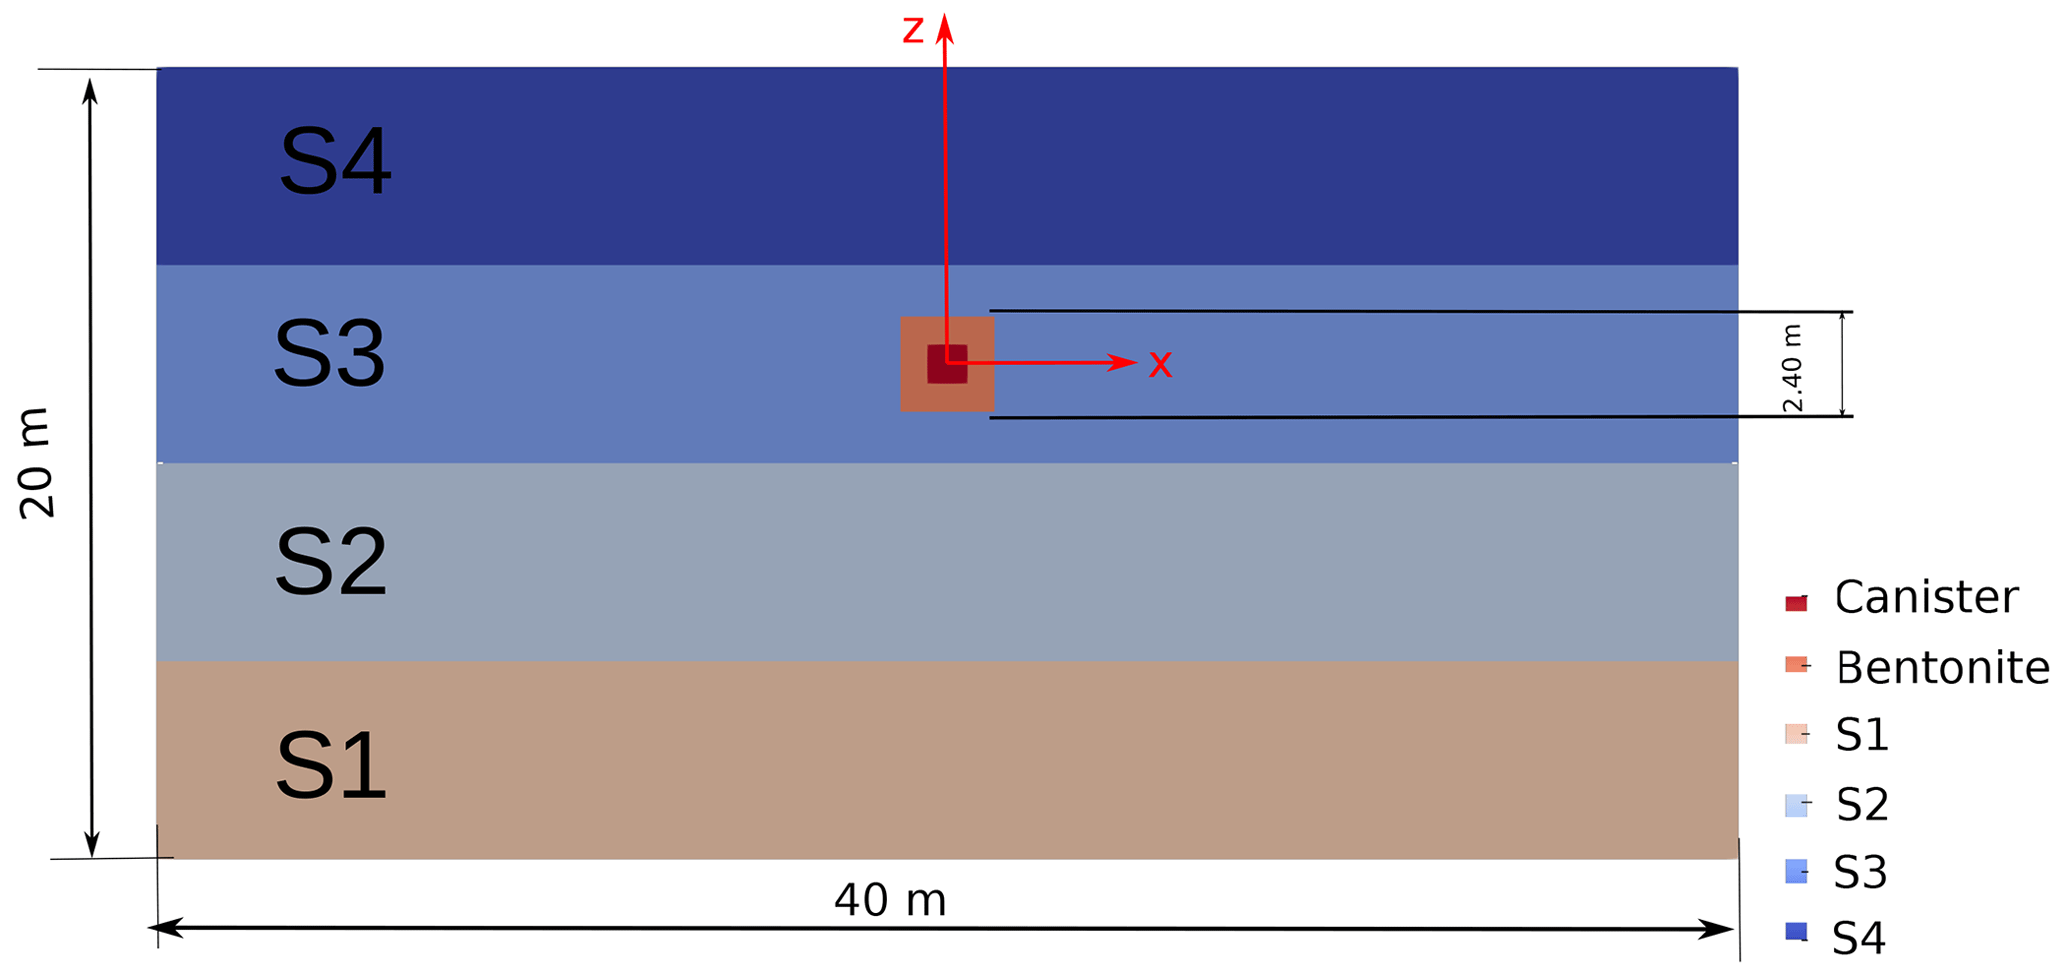
Figure 22D structure model of SF-OPA formation consisting of four different sedimentary layers. The structures of fours layers (S1–S4) are illustrated in Fig. 1. The canister covered (red color) with bentonite buffer (orange color) is placed in the center of layer S3.
Next, we study the effect of sedimentary heterogeneity on the spatial and temporal evolution of heterogeneous diffusion. In this case, we utilize the structural model with the same dimension and same sedimentary layers as described above. We consider another five conceptual models besides the base case, including different layer-succession layout with different canister emplacement and different orientations of bedding, as listed in Table 2. In conceptual models 0, 1A, and 1B, we assume that all the four sedimentary layers have three different bedding angles of 0, 30 and 50∘, respectively. In conceptual models 2A, 2B, and 2C, we assume that the combination of canister and bentonite buffer with the fixed position of z=0 m is placed in the center of different sedimentary layer, as shown in Fig. 3. For all the conceptual models, we localize the concentration at the σ at each time step and calculate the spatial and temporal evolution of diffusion fronts.
Table 2Overview of the conceptual models including the location of the canister and the orientation of bedding.
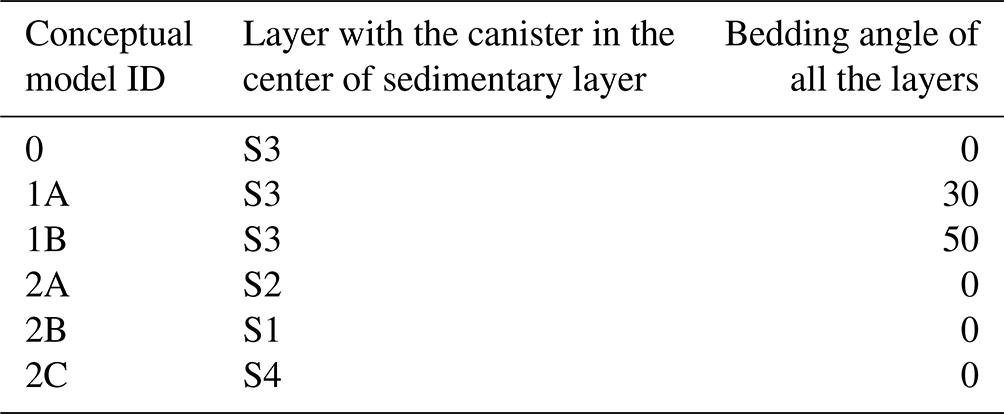
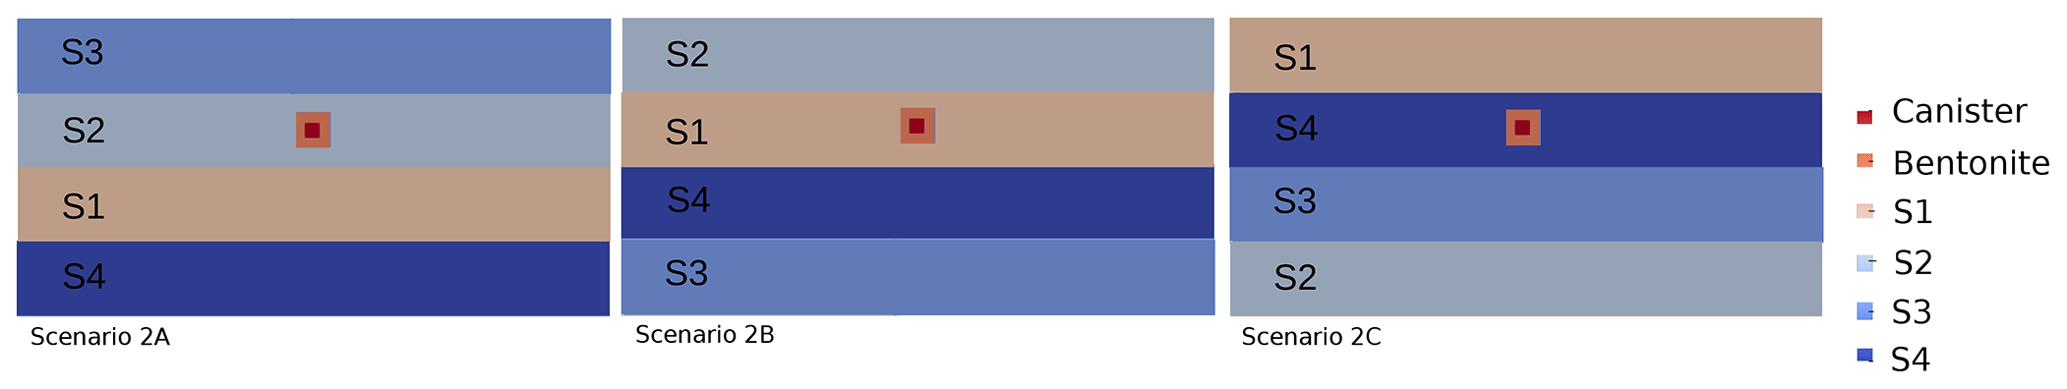
Figure 3The SF-OPA layer distribution in the conceptual models 2A, 2B and 2C, with the canister emplaced in the S2, S1 and S4 layer, respectively. The combination of canister and bentonite has the fixed position of 0 m.
4.1 Temporal and spatial evolution of heterogeneous diffusion
For the base case, the highest concentration value of the cation (sodium) in the canister decreases from 0.071 to 0.055 mol L−1 between 1000 and 2000 years. The sodium distribution profile along z direction is plotted in Fig. 4. After 1000 years, the sodium (Na+) is diffused around 5.80 m in z− direction, while it is about 4.76 m in z+ direction. This is because the neighboring layer in z− direction S2 has higher diffusivity coefficient than that in z+ direction of the S4 layer. The difference of such sodium concentration distribution is caused by the heterogeneous layer around the canister.
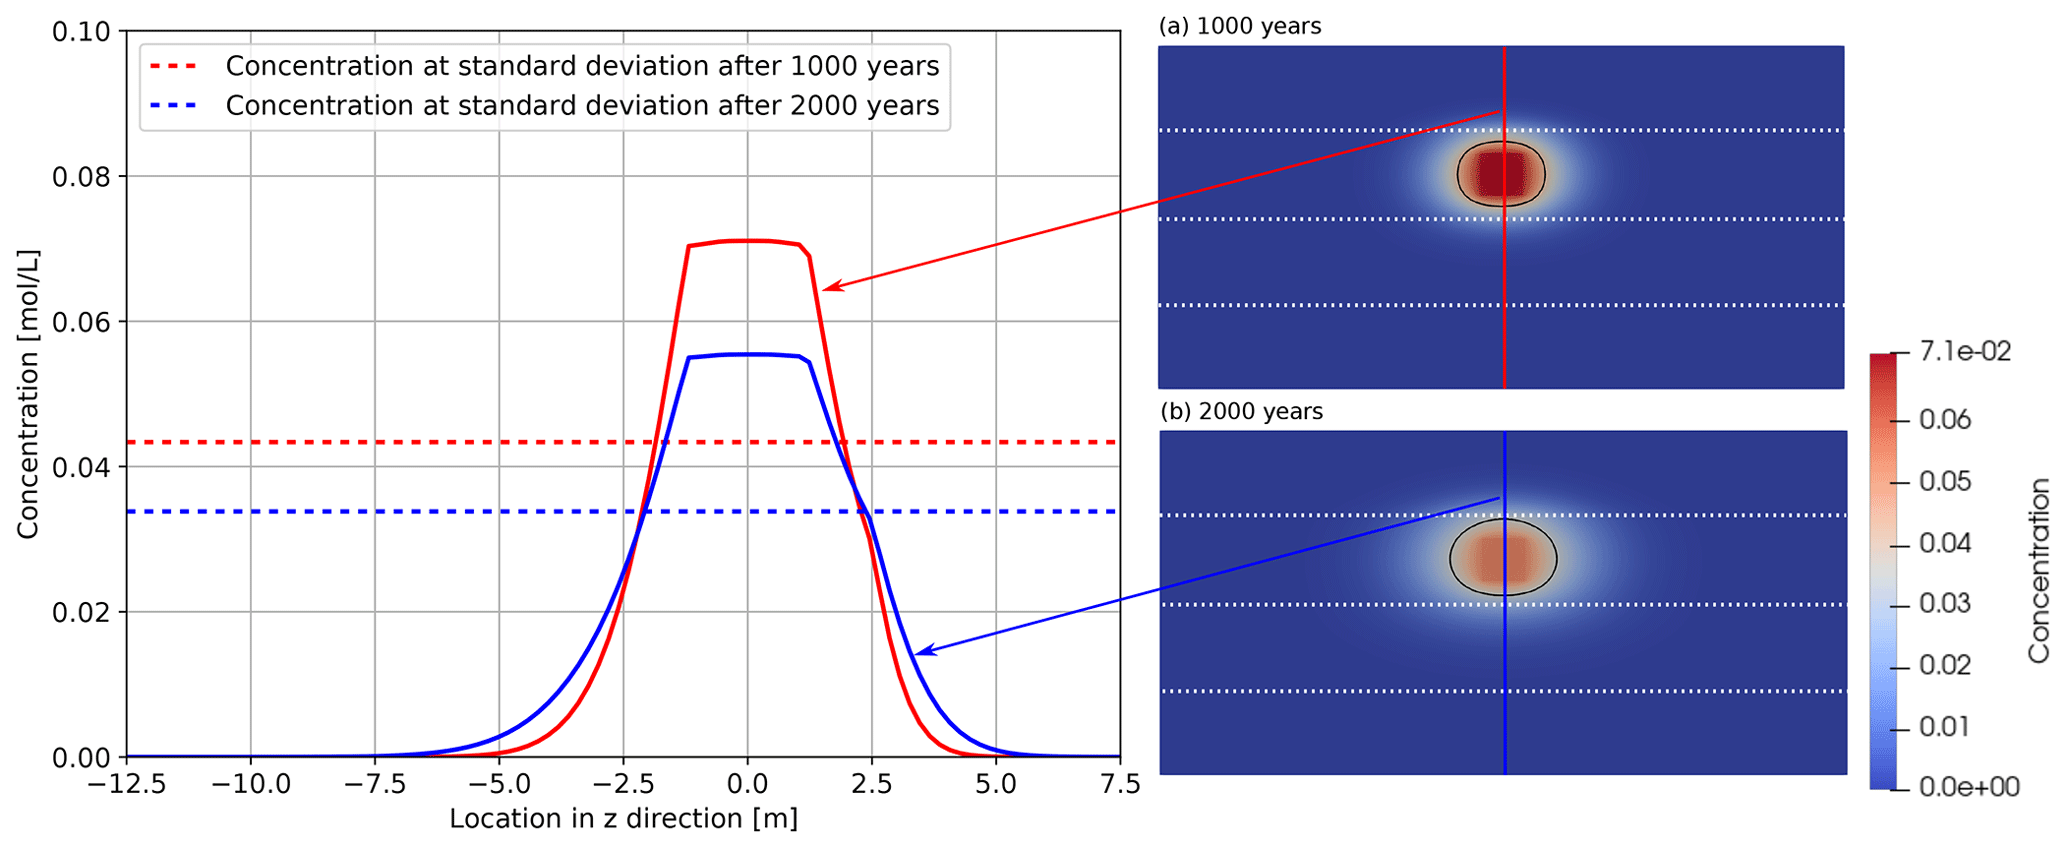
Figure 4Na+ concentration profiles along z direction after 1000 years' (red line) and 2000 years' (blue line) diffusion. Subsets show the concentration distribution in the entire domain after 1000 years' (a) and 2000 years' (b) diffusion. Red line (a) and blue line (b) are utilized to compare the concentration profiles along z direction. The canister center is located in the position: z=0 m. The white dashed lines represent boundaries between different layers. Black line represents diffusion front.
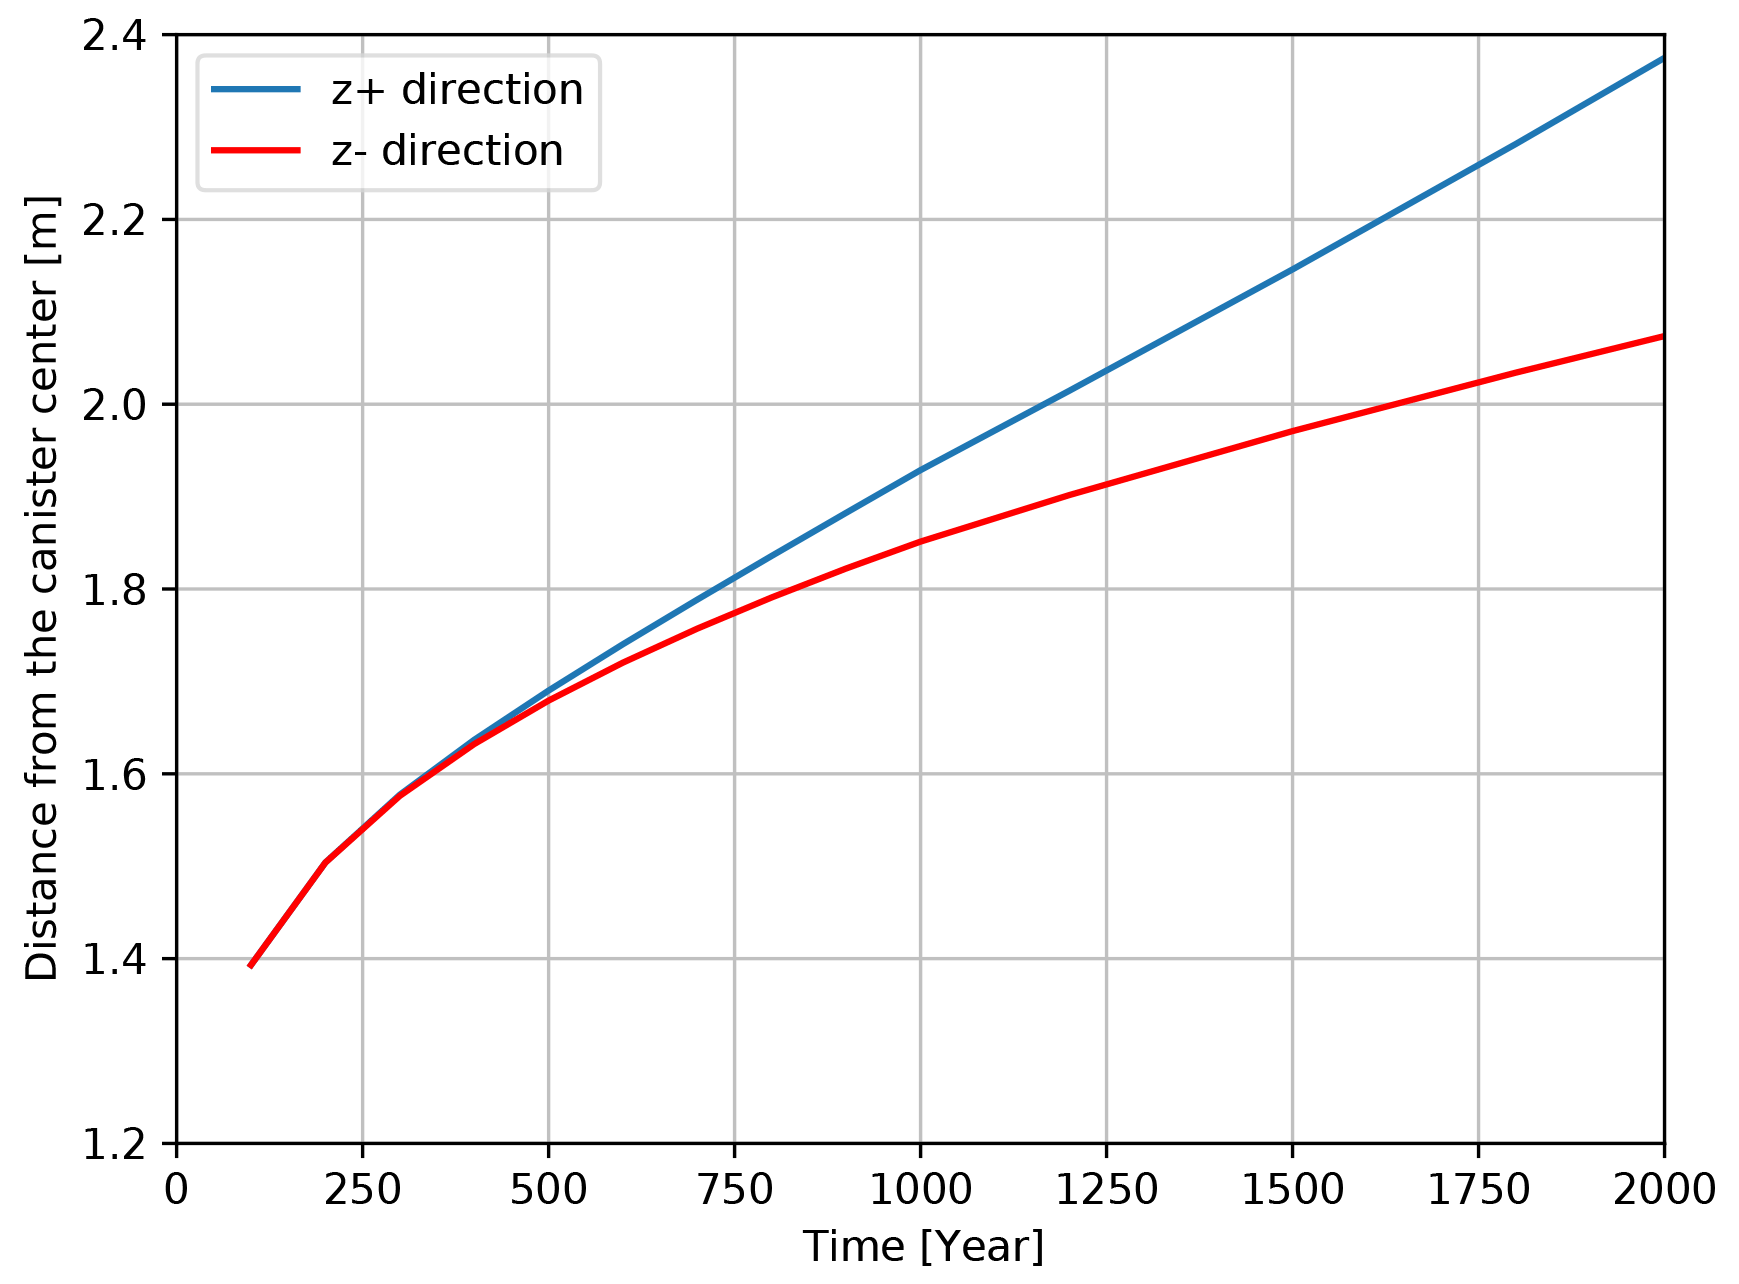
Figure 5The moving of diffusion front along z+ and z− direction versus diffusion time. The canister center is located in the position: z=0 m.
When looking into the diffusion front that the sodium concentration is at the standard deviation, both are located in the S3 layer after 2000 years as shown in Fig. 4. It is worth noting that the moving of diffusion front is farther in z+ direction, which is different from the moving distance of the sodium diffusion. The sodium can be actually diffused 1.04 m farther in z− direction. Figure 5 illustrates the detailed temporal evolution of the displacements of diffusion front in z+ and z− directions. It can be seen that the heterogeneity of the sedimentary layer starts to have influence after around 500 years. From 500 years, the diffusion front is moving farther in z+ direction. The distance difference reaches 0.07 and 0.3 m after 1000 and 2000 years, respectively. With the impact of neighboring layer that has lower diffusivity in z+ direction (S4), the sodium is hard to diffuse and easy to be accumulated within the layer S3. The diffusion front line here represents the 61 % of the highest concentration at each diffusion time, which also depicts the area containing 68 % of the total sodium mass. Therefore, within 2000 years in this study, the moving distance of the diffusion front is farther away from the canister center, along the direction with the neighboring layer having lower diffusivity property. However, for longer time scales, diffusion front can proceed more into z− direction. Then it can be observed that the calculated diffusion front reaches boundary between layer 3 and layer 4. From this point, the diffusion front in z+ is limited at the boundary ( m) whereas in z− direction the diffusion front still migrates.
4.2 The effect of the bedding angle
For real strata at the field scale, the bedding plane of the sedimentary SF-OPA is mostly not perpendicular to the z direction (Leupin et al., 2018). Due to the anisotropic diffusivity properties of the SF-OPA, different bedding angles will significantly affect the encapsulated effect of the radionuclides in z+ direction from the view of ground surface point. In this section, the diffusion front line movement in z+ direction for conceptual models 0, 1A and 1B with the SF-OPA bedding angle of 0, 30, 50∘ is plotted in Fig. 6.

Figure 6The displacements of diffusion front along z+ direction versus diffusion time under bedding angle of 0, 30 and 50∘.
As shown in Fig. 6, the diffusion front moves farther in z+ direction, along with the bedding angle increasing. After 100 years, the diffusion front is 1.39 m away from the canister center in z+ direction with the bedding angle of 0∘. This distance increases to 1.73 and 1.81 m when the bedding angle increases to 30 and 50∘. The diffusion front line location is quite similar between the two conceptual models with the bedding angle of 30 and 50∘, the difference is accounting for 0.08 m. Moreover, both diffusion front line locations with non-zero bedding angles are farther than that with the bedding angle of 0∘. This is because the diffusion plumes are both located in the vicinity of the canister after 100 years, and the impact of the heterogeneity caused by the neighboring layer is limited. Thus, the difference of the diffusion front line displacement is purely caused by the anisotropic diffusivity property under different bedding angles of the SF-OPA layer.
The condition has been changed when the simulation time increases to 2000 years. After 2000 years, the diffusion of the sodium is significantly slowing down by the upper neighboring layer S4 in the perpendicular direction of the bedding angle. In this case, all diffusion fronts are approaching to the layer interface in that direction. In z+ direction, the diffusion front is moving 2.37, 2.58, 2.85 m away from the canister center after 2000 years, respectively. The difference between the conceptual models with bedding angle of 30 and 50∘ is 0.27 m, which is 0.06 m larger than the difference between the conceptual models with 30 and 0∘. The difference is almost the same for the three conceptual models due to the good retardation effect caused by the upper neighboring layer S4.
4.3 The effect of the different layers where the canister is emplaced
In the disposal of radioactive waste in the SF-OPA, each sedimentary layer can be the potential site to emplace the canister. However, the heterogeneity of different layers where the canister is emplaced shows different impact on the radionuclide diffusion. In order to investigate such influence of different heterogeneities, the conceptual models of 2A, 2B and 2C are simulated in this section. The diffusion front displacement is presented in Fig. 7.

Figure 7The diffusion front movement in z direction after 1000 and 2000 years, with the canister emplaced in the layer of S2, S1, and S4, respectively.
It can be seen from Fig. 7 that the diffusion front after 2000 years is still within the layer where the canister was emplaced in the conceptual models 2A and 2C. The moving distance is both smaller than 2.5 m, which is even smaller than 2 m for the conceptual model 2C. Nevertheless, for the conceptual model 2B, due to the highest diffusivity coefficient of the S1 layer where the canister is emplaced, the diffusion front can be moving to 2.60 and 2.79 m along z+ and z− direction, respectively. The movement along z− direction is farther, because the neighboring layer S4 has the lowest diffusivity coefficient and the best retardation effect for the sodium migration within 2000 years.
It is worth noting that the difference of the diffusion front moving distance between z+ and z− direction is decreasing for the conceptual model 2B from 1000 to 2000 years, while it is increasing for the conceptual models 2A and 2C. Specifically, the difference decreases from 0.327 to 0.193 m in conceptual model 2B. In the contrast, such difference increases from 0.039 to 0.129 m in conceptual model 2A where the canister is emplaced in S2 layer, from 0.004 to 0.025 m in conceptual model 2C with the canister emplaced in S4 layer. This is because the distinctive feature of the conceptual model 2B is the neighboring layer in z− direction has lower diffusivity coefficient than that in z+ direction and the diffusion front is moving to the neighboring layers after 2000 years. Such effect caused by the m-scale heterogeneity will become different for longer time spans.
For the conceptual models 2B and 2C, both diffusion front along z− direction is moving farther than that in z+ direction. For both two conceptual models, the diffusivity coefficient of the neighboring layer in z− direction is lower than that in the z+ direction, resulting in a very good retardation effect and sodium accumulation in this direction. As for the conceptual model 2A, due to a high diffusivity coefficient in the neighboring layer (S1) in z− direction, the sodium is easy to be diffused. This leads to the diffusion front nearer to the canister compared with that in the z+ direction. Overall, although the neighboring layers can reshape the diffusion front of the radionuclide, the smallest moving distance of the diffusion front occurs in the conceptual model that the canister is placed in the layer with the lowest diffusivity coefficient.
In this work, a series of 2D field-scale heterogeneous models have been established and simulated for the evaluation of cation (sodium) migration in SF-OPA formation over 2000 years. The field-scale diffusion coefficients are upscaled from the core scale by using the μ-CT segmentation. The diffusion front line was defined at the concentration contour with 61 % of the maximum concentration at each diffusion time to observe the concentration of molecules at the standard deviation in the total distribution. The detailed findings are as follows:
-
In the base case, the diffusion front line after 2000 years is still within that layer (S3) in which the canister was emplaced. The moving distance of the diffusion front is farther away from the canister center, along the direction with the neighboring layer having lower diffusion coefficient.
-
When the bedding angle increases, the diffusion front moves farther in z+ direction, reflecting the increase in effective diffusivity and higher impact of parallel-to-bedding diffusion.
-
The neighboring layers can slightly reshape the diffusion front line of the radionuclide within 2000 years. For the conceptual model 2B that the canister is emplaced in the layer with the highest diffusivity coefficient, the diffusion front can migrate 0.19 m farther along vertical downward direction in 2000 years due to the influence of the neighboring layer. However, the m-scale heterogeneity will show a different influence in longer time spans.
The heterogeneity impact of the SF-OPA formation on the tracer migration has been evaluated through the 2D structural model. However, the simulation time in this work is much shorter than 1 million years, which is largely constrained by the model geometry and setup. For the real geological-scale (above km) model, the safety of the deep geological repository for the radioactive waste will be assessed with the diffusion front line moving of non-zero radionuclides concentration over at least 1 million years.
All applied software codes are referenced within the paper and are open access. The OpenGeoSys software used in this paper can be downloaded at https://doi.org/10.5281/zenodo.7092676 (Bilke et al., 2022).
All input data is referenced within the paper and the simulation files can be made available on specific user requests.
CC: Conceptualization, Methodology, Software, Formal analysis, Writing – Original Draft, Visualization. TY: Conceptualization, Investigation, Methodology, Formal analysis, Writing – Review & Editing. RL: Methodology, Software, Investigation. CF: Project administration, Writing – Review & Editing, Supervision. OK: Project administration, Funding acquisition. HS: Methodology, Software, Writing – Review & Editing, Resources, Supervision.
The contact author has declared that none of the authors has any competing interests.
Publisher’s note: Copernicus Publications remains neutral with regard to jurisdictional claims in published maps and institutional affiliations.
This article is part of the special issue “European Geosciences Union General Assembly 2022, EGU Division Energy, Resources & Environment (ERE)”. It is a result of the EGU General Assembly 2022, Vienna, Austria, 23–27 May 2022.
We deeply acknowledge the funding of the iCROSS-Project (Integrity of nuclear waste repository systems – Cross-scale system understanding and analysis) by the Federal Ministry of Research and Education (grant no. 02NUK053E, gefördert vom BMBF) and Helmholtz Association (Helmholtz-Gemeinschaft e.V.) through the Impulse and Networking Funds (grant number SO-093). This work is also contributing to the ELF-China-Pilot project (grant no. 02E11850A) and European Joint Programme on Radioactive Waste Management EURAD (Grant Agreement no. 847593) in particular to work package ACED (Assessment of Chemical Evolution of ILW and HLW Disposal Cells). Special thanks to Klaus-Jürgen Röhlig and Axel Liebscher for reviewing this manuscript with detailed and constructive comments.
This research has been supported by the Bundesministerium für Bildung und Forschung (grant no. 02NUK053E) and the Bundesministerium für Wirtschaft und Energie (grant no. 02E11850A).
The article processing charges for this open-access publication were covered by the Helmholtz Centre for Environmental Research – UFZ.
This paper was edited by Michael Kühn and reviewed by Axel Liebscher and Klaus-Jürgen Röhlig.
Appelo, C. A. J. and Wersin, P.: Multicomponent diffusion modeling in clay systems with application to the diffusion of tritium, iodide, and sodium in opalinus clay, Environ. Sci. Technol., 41, 5002–5007, 2007. a, b
Bear, J. and Bachmat, Y.: Introduction to modeling of transport phenomena in porous media, edited by: Vizcaino, A., Vol. 4, Springer Science & Business Media, ISBN 978-94-009-1926-6, 2012. a
Berg, H. C.: Diffusion: microscopic theory, in: Random walks in biology, 5–16, Princeton University Press, https://doi.org/10.1515/9781400820023-004, 2018. a
Bilke, L., Flemisch, B., Kalbacher, T., Kolditz, O., Helmig, R., and Nagel, T.: Development of Open-Source Porous Media Simulators: Principles and Experiences, Transport Porous Med., 130, 337–361, https://doi.org/10.1007/s11242-019-01310-1, 2019. a, b
Bilke, L., Fischer, T., Naumov, D., Lehmann, C., Wang, W., Lu, R., Meng, B., Rink, K., Grunwald, N., Buchwald, J., Silbermann, C., Habel, R., Günther, L., Mollaali, M., Meisel, T., Randow, J., Einspänner, S., Shao, H., Kurgyis, K., Kolditz, O., and Garibay, J.: OpenGeoSys, Zenodo [software], https://doi.org/10.5281/zenodo.7092676, 2022. a
Bollermann, T., Yuan, T., Kulenkampff, J., Stumpf, T., and Fischer, C.: Pore network and flow field analysis towards improved predictability of diffusive transport in argillaceous host rocks, Chem. Geol., 606, 120997, https://doi.org/10.1016/j.chemgeo.2022.120997, 2022. a, b, c, d, e
Bossart, P. and Thury, M.: Mont Terri Rock Laboratory—Project, programme 1996 to 2007 and results, no. 3, Swiss Geological Survey, Wabern, ISBN 978-3-302-40016-7, 2008. a, b
Grathwohl, P.: Diffusion in Natural Porous Media: Contaminant Transport, Sorption/Desorption and Dissolution Kinetics, 207, ISBN 978-1-4613-7602-6, 1998. a, b, c
Hennig, T. and Kühn, M.: Potential Uranium Migration within the Geochemical Gradient of the Opalinus Clay System at the Mont Terri, Minerals, 11, 1087, https://doi.org/10.3390/min11101087, 2021a. a
Hennig, T. and Kühn, M.: Uranium migration through the Swiss Opalinus Clay varies on the metre scale in response to differences of the stability constant of the aqueous, ternary uranyl complex Ca2UO2(CO3)3, Adv. Geosci., 56, 97–105, https://doi.org/10.5194/adgeo-56-97-2021, 2021b. a
Houben, M., Desbois, G., and Urai, J.: A comparative study of representative 2D microstructures in Shaly and Sandy facies of Opalinus Clay (Mont Terri, Switzerland) inferred form BIB-SEM and MIP methods, Mar. Petrol. Geol., 49, 143–161, 2014. a
Kolditz, O., Bauer, S., Bilke, L., Böttcher, N., Delfs, J., Fischer, T., Görke, U., Kalbacher, T., Kosakowski, G., McDermott, C., Park, C., Radu, F., Rink, K., Shao, H., Shao, H., Sun, F., Sun, Y., Singh, A., Taron, J., Walther, M., Wang, W., Watanabe, N., Wu, Y., Xie, M., Xu, W., and Zehner, B.: OpenGeoSys: An open-source initiative for numerical simulation of thermo-hydro-mechanical/chemical (THM/C) processes in porous media, Environ. Earth Sci., 67, 589–599, https://doi.org/10.1007/s12665-012-1546-x, 2012. a, b
Kulenkampff, J., Gründig, M., Zakhnini, A., Gerasch, R., and Lippmann-Pipke, J.: Process tomography of diffusion, using PET, to evaluate anisotropy and heterogeneity, Clay Miner., 50, 369–375, 2015. a
Lauper, B., Zimmerli, G. N., Jaeggi, D., Deplazes, G., Wohlwend, S., Rempfer, J., and Foubert, A.: Quantification of Lithological Heterogeneity Within Opalinus Clay: Toward a Uniform Subfacies Classification Scheme Using a Novel Automated Core Image Recognition Tool, Front. Earth Sci., 9, 645596, https://doi.org/10.3389/feart.2021.645596, 2021. a
Leupin, O. X., Loon, L. R. V., Gimmi, T., Wersin, P., and Soler, J. M.: Exploring diffusion and sorption processes at the Mont Terri rock laboratory (Switzerland): lessons learned from 20 years of field research, in: Mont Terri Rock Laboratory, 20 Years, 393–405, Springer, https://doi.org/10.1007/s00015-016-0254-z, 2018. a
Lu, R., Nagel, T., Poonoosamy, J., Naumov, D., Fischer, T., Montoya, V., Kolditz, O., and Shao, H.: A new operator-splitting finite element scheme for reactive transport modeling in saturated porous media, Comput. Geosci., 163, 105106, https://doi.org/10.1016/j.cageo.2022.105106, 2022. a, b
Nagra: Demonstration of Disposal Feasibility for Spent Fuel, Vitrified High-Level Waste and Long-Lived Intermediate-Level Waste (Entsorgungsnachweis), 2002a. a, b
Nagra: Projekt Opalinuston Synthese der geowissenschaftlichen Untersuchungsergebnisse, Nagra Technischer Bericht 02-03, 2002b (in German). a
Parkhurst, D. L. and Appelo, C. A. J.: Description of input and examples for PHREEQC version 3 – a computer program for speciation, batch-reaction, one-dimensional transport, and inverse geochemical calculations, US geological survey techniques and methods, book 6, chap. A43, 497 pp., 2013. a
Soler, J., Samper, J., Yllera, A., Hernández, A., Quejido, A., Fernández, M., Yang, C., Naves, A., Hernán, P., and Wersin, P.: The DI-B in situ diffusion experiment at Mont Terri: Results and modeling, Phys. Chem. Earth, 33, S196–S207, 2008. a
Van Loon, L., Soler, J., and Bradbury, M.: Diffusion of HTO, 36Cl− and 125I− in Opalinus Clay samples from Mont Terri: Effect of confining pressure, J. Contam. Hydrol., 61, 73–83, 2003. a
Van Loon, L. R., Wersin, P., Soler, J., Eikenberg, J., Gimmi, T., Hernan, P., Dewonck, S., and Savoye, S.: In-situ diffusion of HTO, 22Na+, Cs+ and I− in Opalinus Clay at the Mont Terri underground rock laboratory, Radiochim. Acta, 92, 757–763, 2004. a
Wersin, P., Soler, J., Van Loon, L., Eikenberg, J., Baeyens, B., Grolimund, D., Gimmi, T., and Dewonck, S.: Diffusion of HTO, Br−, I−, Cs+, 85Sr2+ and 60Co2+ in a clay formation: Results and modelling from an in situ experiment in Opalinus Clay, Appl. Geochem., 23, 678–691, 2008. a
Yuan, T. and Fischer, C.: Effective Diffusivity Prediction of Radionuclides in Clay Formations Using an Integrated Upscaling Workflow, Transport Porous Med., 138, 245–264, 2021. a, b, c, d
Yuan, T. and Fischer, C.: The influence of sedimentary and diagenetic heterogeneity on the radionuclide diffusion in the sandy facies of the Opalinus Clay at the core scale, Appl. Geochem., 146, 105478, https://doi.org/10.1016/j.apgeochem.2022.105478, 2022. a, b
Yuan, T. and Qin, G.: Numerical investigation of wormhole formation during matrix acidizing of carbonate rocks by coupling stokes-brinkman equation with reactive transport model under radial flow conditions, in: SPE International Conference and Exhibition on Formation Damage Control, OnePetro, February 2020, Lafayette, Louisiana, USA, https://doi.org/10.2118/199262-MS, 2020. a
Yuan, T., Wei, C., Zhang, C.-S., and Qin, G.: A numerical simulator for modeling the coupling processes of subsurface fluid flow and reactive transport processes in fractured carbonate rocks, Water, 11, 1957, https://doi.org/10.3390/w11101957, 2019. a, b