 | 11 Jul 2023
Spatially resolved generation profiles for building, land and water-bound PV: a case study of four Dutch energy transition scenarios
Nick Nortier
Michel Paardekooper
Chris Lucas
Anne Blankert
Arendjan van der Neut
Stefan Luxembourg
Agnes Mewe
Wilfried van Sark
Alongside a transition from steerable and centralized traditional electricity generation to intermittent and more decentralized renewable electricity generation from solar panels and wind turbines, Dutch energy transition scenarios project a widespread deployment of heat pumps and electric vehicles towards 2050. While clearly contributing to the decarbonization of the Dutch energy system, these developments impose challenges regarding electricity supply-demand mismatch and grid congestion. Spatially resolved electricity demand and supply profiles are required to gain a better insight into where and when such problems are likely to occur within the different scenarios. The present paper focuses on Dutch solar energy supply and features the construction of geodatabases of scenario-specific, spatially resolved electricity generation profiles for building, land and water-bound PV. Country-level PV capacities are geographically distributed based on spatial variance in roof PV potential and availability of suitable land and water use areas. Corresponding electricity generation profiles are constructed using historical meteorological measurements, a diffuse fraction model and a anisotropic transposition model. Empirically found performance ratio profiles are applied to account for a multitude of performance loss factors, including shading, dust and inverter efficiency. In 2050, building-bound capacity is projected to show only limited overlap with both land-bound and water-bound PV capacity. On the other hand, regions with considerable water-bound PV capacity also tend to show considerable land-bound PV capacity. Compared to the present-day situation, yearly country-level PV electricity generation is projected to be a factor 18.5, 15.7, or 7.7 higher in 2050 when respectively following the Regional, National or International Steering scenarios.
- Article
(16818 KB) - Full-text XML
- BibTeX
- EndNote


Photovoltaic (PV) solar energy has seen a remarkable growth in the past decade, most notably in China, the United States, India and the Netherlands (BP, 2021). It is expected to play a major role in the global transition towards a decarbonized energy system, with the International Energy Agency (IEA) declaring it the forerunner in renewable energy (IEA, 2020). In addition to continuous improvements regarding costs and efficiency, the observed trend in PV growth can be attributed to the technology's inherent scalability and its wide range of applications on buildings, land and water (Folkerts et al., 2017; Sijmons, 2017). For the Netherlands, this trend is reflected in multiple 2050 energy transition scenarios that are constructed in line with the Dutch Climate Agreement (Rijksoverheid, 2019), which in turn adheres to the international Paris Agreement (Center for Climate and Energy Solutions, 2015). Apart from a transition from steerable and centralized traditional electricity generation to intermittent and more decentralized renewable electricity generation, these scenarios project widespread deployment of heat pumps and electric vehicles (see Sect. 2.1 for details).
On the one hand, these developments clearly contribute towards the decarbonization of the Dutch energy system. On the other, they impose challenges regarding electricity supply-demand mismatch and grid congestion (Staudt et al., 2019; Costa-Campi et al., 2021). Spatially resolved electricity demand and supply profiles are required to gain a better insight into where and when such problems are likely to occur within the different Dutch energy transition scenarios (Kockel et al., 2022; Gils et al., 2019). In turn, this allows for better regional optimization of mitigation options such as energy storage systems, curtailment of PV peak supply and electricity grid reinforcement (van Westering and Hellendoorn, 2020; Bouloumpasis et al., 2019). In other words, it enables a more in-depth comparison between the proposed energy transition scenarios by exposing the spatial and temporal consequences of related policy decisions.
It is in this line of thought that the Advanced Scenario Management 2 (ASM2) model was developed. The model integrates multiple supply (solar and wind) and demand (electric vehicles, heat pumps, residences, commercial buildings and industry) modules that are able to produce scenario-specific geodatabases of low voltage (neighborhood level), mid voltage (municipality level) and high voltage (country-level) electricity supply and demand profiles. As a whole, they enable the construction of residual demand profiles on multiple voltage levels and the estimation of regional system performance indicators such as grid congestion and self-sufficiency (RVO, 2016; Nortier et al., 2022). The constructed profiles are open access and can be downloaded via the ASM2 Energy Transition API (Geodan, 2021a) or viewed directly via the interactive ASM2 Energy Transition Viewer (Geodan, 2021b).
As solar electricity generation is expected to play a major role in the Dutch energy transition (Netbeheer Nederland, 2020), it should be modeled in a technologically detailed way. The present paper focuses on the construction of spatially resolved generation profiles for future building, land and water-bound PV in the Netherlands, which can be utilized to identify congestion related problems in a carbon neutral Dutch energy system. It entails the development of a solar electricity module (SEM), which is integrated into the ASM2 model. During the construction of this module, the following research question remains central:
What are the projected developments in spatially and temporally resolved PV electricity generation in the Netherlands during the first half of the 21st century?
This main research question is supported by two sub questions regarding the spatial and temporal components of PV electricity generation:
Q1. What are the projected developments in spatially resolved building-bound, land-bound and water-bound PV capacity?
Q2. What is the temporally resolved electricity generation of this PV capacity under typical meteorological circumstances?
The SEM is run for the present-day situation (2019), a near future scenario (2030) and three distant future scenarios (2050). The near future scenario is in line with the Dutch Climate Agreement, and the distant future scenarios sketch different pathways regarding the degree of decentralization of electricity generation and consumption (see Sect. 2.1). Regarding meteorology, the same conditions are assumed for all runs to enhance the comparability between scenario results. The meteorological year 2017 is selected as it can be considered climatically typical. The main research boundaries are set by the encompassing ASM2 model. This implies a 1 h temporal resolution, a neighborhood level spatial resolution for low voltage PV (building-bound) and a municipality level spatial resolution for mid to high voltage PV (land-bound and water-bound). Since the ASM2 model focuses on assessing energy system performance in terms of electricity flows (e.g. grid congestion and self-sufficiency), detailed economic, environmental and greenhouse gas (GHG) analyses are outside the scope of the present paper. However, the use of climate neutral energy transition scenarios in this study guarantees net zero GHG emission for the 2050 energy system as a whole.
Case studies regarding geographical PV potential and suitability have been conducted by other research teams for building-bound PV (Kausika et al., 2017; Lee et al., 2018; Yang et al., 2020), land-bound PV (Mensour et al., 2019; Zhang et al., 2020) and water-bound PV (Tina et al., 2018; Di Grazia and Tina, 2023) for various regions and sites around the world. The suitability studies typically involve a PV potential map combined with a multi-criteria analysis, which might include economic and social factors. To the extent of the authors' knowledge, this work is the first publicly available spatiotemperal interpretation of Dutch energy transition scenarios. While Quintel's Energy Transition Model (Quintel Intelligence, 2022) does construct hourly generation profiles for future building-bound, land-bound and water-bound PV, it does so on a country level. And while the book Energie en Ruimte (Sijmons, 2017) does depict a possible spatial distribution of building-bound, land-bound and water-bound PV in a future Dutch energy system, it does not provide generation profiles. Featuring both a spatial and temporal component, the ASM2 SEM is especially suitable for providing input for electricity mismatch and grid-congestion analyses, since these phenomena are strongly related to both the location and timing of generation and demand.
2.1 Energy transition scenarios
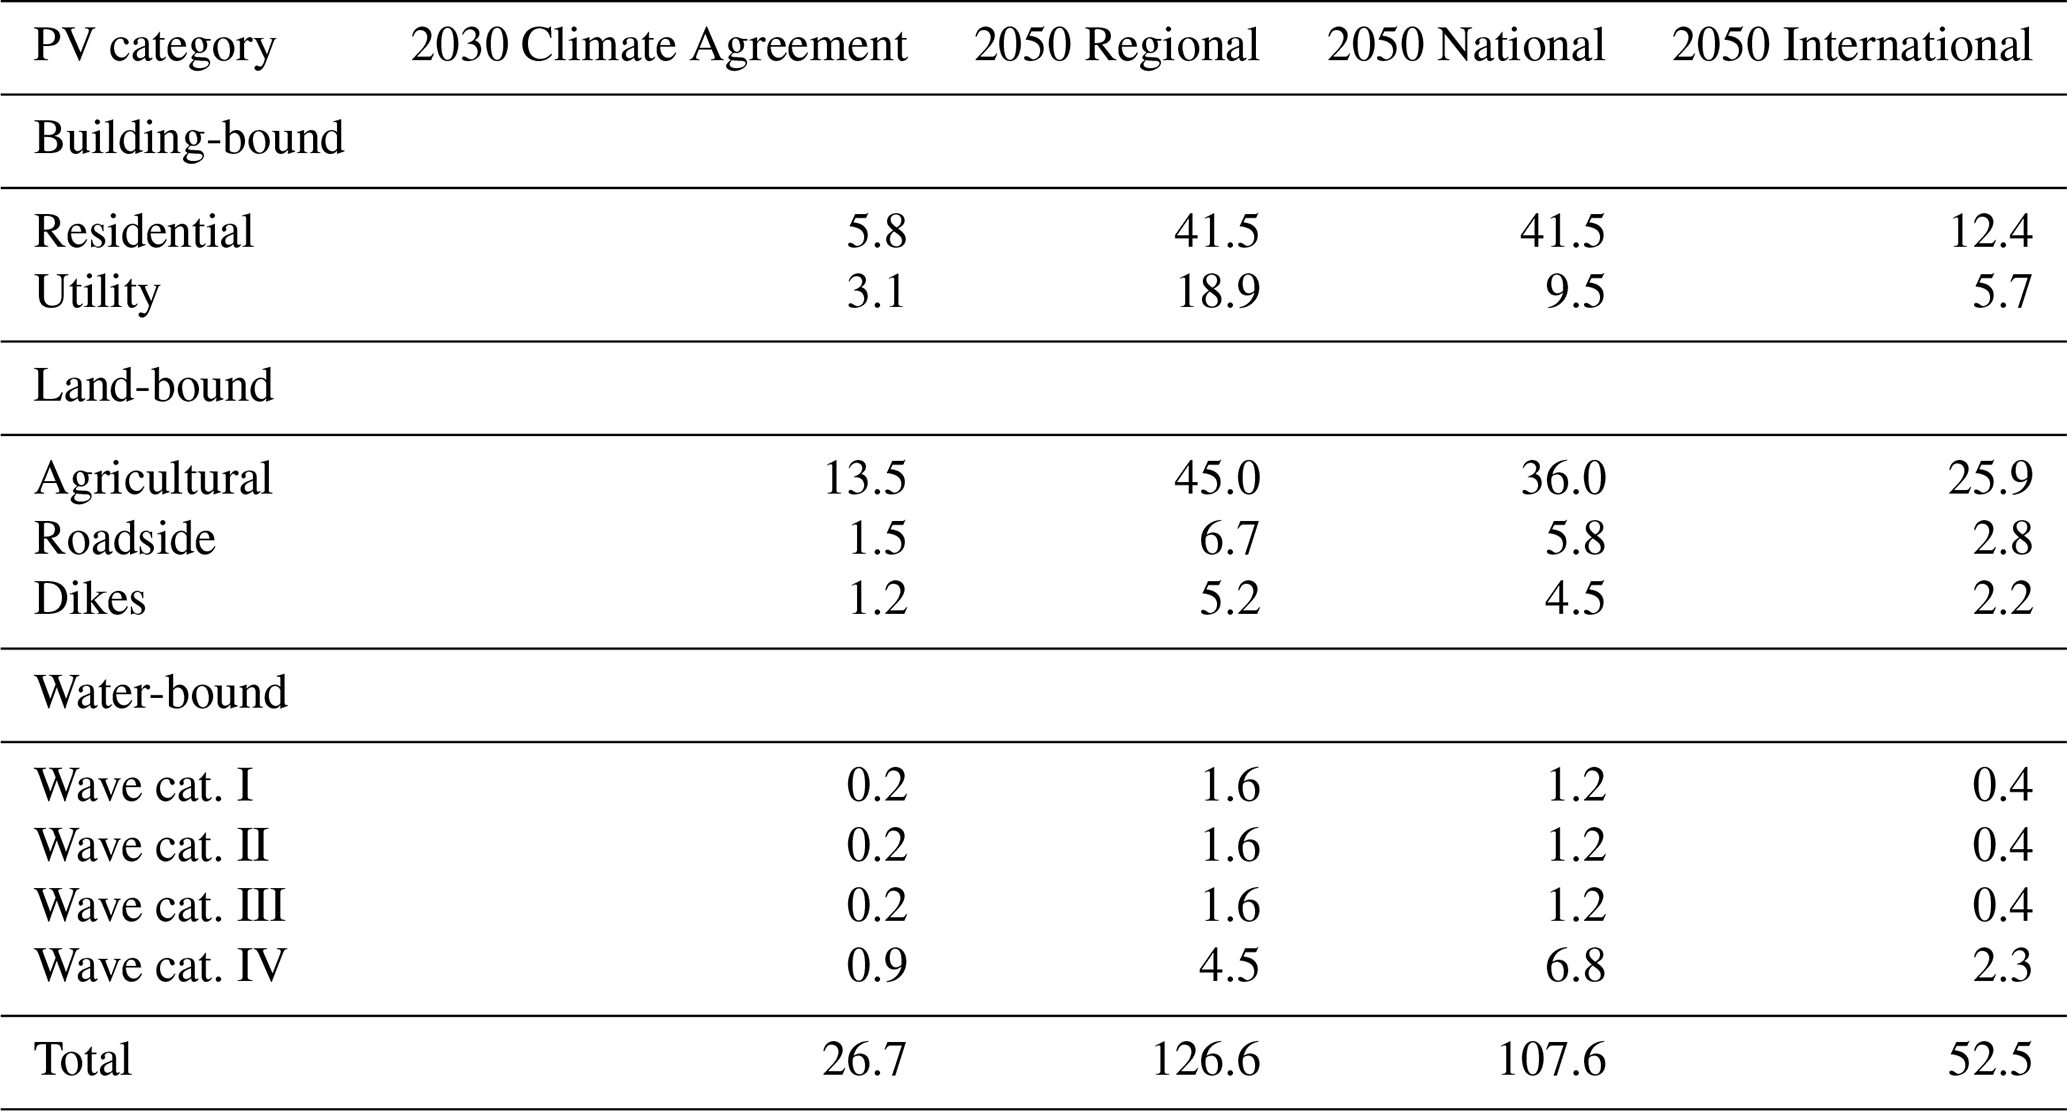
Energy transition scenarios are a key ingredient for this research, as they have strong implications for the future development of wind and solar electricity in the Netherlands. This section describes four energy transition scenarios, one for 2030 and three for 2050. Using these scenarios, country-level capacity values can be derived for small scale (<15 kWp) and large scale (≥15 kWp) PV installations, as well as for onshore and offshore wind turbines. The obtained PV capacity values are further subdivided into a total of nine PV categories, to allow for a detailed geographical distribution of the projected PV capacities later on. This detailing was performed using the results of the Dutch Roadmap PV Systemen en Toepassingen (Folkerts et al., 2017), which provides an extensive inventory of potential future deployment of a multitude of PV applications. In this work, small scale PV is subdivided into two categories of building-bound PV (Residential and Utility). Large scale PV is subdivided into three categories of land-bound PV (Agricultural, Roadside and Dikes) and four categories of water-bound PV (wave categories I, II, III and IV). Table 1 summarizes the resulting country-level capacities per PV category for each energy transition scenario. Note that small-scale PV (building-bound) and large-scale PV (land-bound and water-bound) totals might differ slightly between this table and values stated in Sect. 2.1.1 and 2.1.2 as a result of (intermediate) rounding.
Table 1Country-level capacity (GWp) per PV category for each energy transition scenario, rounded to one decimal.
2.1.1 Near Future (2030)
The basis for the energy transition scenario for 2030 is the Dutch Climate Agreement, which states the ambition to scale-up the renewable electricity generation from large scale installations (PV and wind) to 84 TWh yr−1 by 2030. Offshore wind turbines should provide 49 TWh yr−1 of this (Rijksoverheid, 2019). The remaining 35 TWh yr−1 required electricity generation is accounted for by a combination of 6.0 GWp onshore wind and 17.9 GWp large scale (land-bound and water-bound) PV (Kalavasta, 2019). In addition, according to the Climate Agreement, approximately 7 TWh yr−1 of electricity will be produced by small-scale (building-bound) PV installations (Rijksoverheid, 2019), which Kalavasta translates to a capacity of 8.8 GWp (Kalavasta, 2019).
2.1.2 Distant future (2050)
The three energy transition scenarios for 2050 are adopted from the study Klimaatneutrale Energiescenario's 2050 (den Ouden et al., 2020), which is part of the Integrale Infrastructuurverkenning 2030–2050 (Netbeheer Nederland, 2020). The scenarios sketch different carbon neutral futures as a result of alternative governance structures. The scenarios have in common that large amounts of variable renewable energy sources are integrated. Here, grid operators, energy companies, industry and the Ministry of Economic Affairs and Climate use the scenario outcomes to assess the flexibility and infrastructural requirements of the future electricity grid. Multiple energy carriers are incorporated (electricity, heat, biogas and hydrogen), warranting that energy demand is met at any moment in time. This safeguards the stability of energy supply based on large wind and PV capacities, which can otherwise lead to imbalance issues. The following paragraphs summarize the narratives of the three scenarios adopted for this research: Regional Steering (regionale sturing), National Steering (nationale sturing) and International Steering (internationale sturing).
In the Regional Steering scenario, the energy transition is largely steered by local and regional authorities. The largely local steering accommodates close involvement of companies and citizens. While a self-sufficient energy system is pursued at country level, the regional potential is fully exploited. This scenario shows the largest share of decentralized electricity generation, mainly due to a very high deployment of small scale building-bound PV (60.1 GWp) and large scale land-bound and water-bound PV (66.4 GWp). The projected onshore wind capacity is high (20.0 GWp) and the offshore wind capacity is intermediate (31.0 GWp). Heat to buildings is mainly provided by geothermal district heating networks and heat pumps. The electricity demand peaks are met by the introduction of biogas and green hydrogen. Biogas is produced from local biomass and green hydrogen through electrolysis (using surplus wind and PV electricity) (den Ouden et al., 2020).
In the National Steering scenario, national authorities largely steer the energy transition. Again, a self-sufficient energy system is pursued at country level, but now with more emphasis on the realization of very large scale projects. This is reflected by the much higher deployment of offshore wind turbines (51.5 GWp) and the somewhat lower deployment of both small scale and large scale PV (50.7 and 56.9 GWp, respectively). The projected onshore wind capacity is equal to that of the Regional Steering scenario (20.0 GWp). In total, the electricity generation from variable renewable resources (solar and wind) is highest in the this scenario. Similar to the Regional Steering scenario, heat pumps and geothermal district heating networks are the main providers of building heat. Biogas and green hydrogen are not only utilized to meet peak electricity demands, but also directly consumed for industrial processes in this scenario. This in turn requires larger amounts of wind and PV electricity to be consumed in hydrogen electrolysis plants (den Ouden et al., 2020).
In the International Steering scenario, there is an open, global market and a strong international climate policy. A self-sufficient energy system at country level is no longer pursued, but instead the energy carriers are produced where the techno-economic conditions are favorable. Cross-border exchange of electricity, hydrogen, biomass and biofuel is enabled by an advanced European infrastructure. In this scenario, the Netherlands shows a lower degree of electrification and large amounts of hydrogen are imported, also for direct heat consumption. Hybrid hydrogen heat pumps are the main providers of building heat and green hydrogen is directly consumed for industrial processes (den Ouden et al., 2020). This results in relatively low national capacities of onshore wind (10.0 GWp), offshore wind (27.5 GWp), small-scale building-bound PV (18.1 GWp) and large-scale land-bound and water-bound PV (34.5 GWp).
2.2 Assessment of building-bound PV potential
This subsection covers the construction of a geodatabase containing the technical PV potential for each residential and non-residential roof surface in the Netherlands. The geodatabase is used later on to spatially distribute scenario-specific building-bound PV capacity (see Sect. 2.3).
2.2.1 Roof surfaces
For the identification of roof surfaces for each building in the Netherlands, two national datasets are used: (1) the Actueel Hoogte Bestand Nederland (AHN3) (AHN, 2018) consisting of a high-density LiDAR point cloud measured over the period 2014–2019, and (2) building footprints from the Basisregistratie Adressen en Gebouwen (BAG) (Kadaster, 2017a). Each point in the AHN3 cloud is already assigned to one of the following classes: building, vegetation, water, ground level or other. Since the aim is to identify roof surfaces, all points which are not classified as being a building are filtered out. In order to reduce the noise of semi-transparent objects such as plants and trees even further, only the last return point of each LiDAR pulse is kept. Subsequently, the remaining points are assigned to residential and non-residential buildings by clipping them to corresponding BAG footprints. The filtered point cloud is then converted to a digital elevation map (DEM) with a 0.25 m resolution, where the value of each cell is equal to the highest point within a 0.4 m radius from the cell's center. This highest point method is chosen in favor of inverse distance weighting since it avoids interference of (lower) wall measurements along the edges of the buildings. The DEM is used to generate tilt and azimuth maps of equal resolution. By clustering cells with similar tilt and azimuth, one or more roof surface polygons are identified per building. Each of these surfaces is characterized by one of ten azimuth classes (0, 40, 80, 120, 160, 180, 200, 240, 280 or 320∘) and one of seven tilt classes (0, 15, 30, 45, 60, 75 or 90∘). Figure A1 visualizes the above described roof surface identification process for a sample area in Amsterdam.
2.2.2 Solar resource
To assess the solar resource on the identified roof surfaces, hour-by-hour global horizontal irradiation (GHI) measurements by 33 Dutch ground observation stations are gathered for a climate averaged year (1987–2017) (KNMI, 2018). Linear interpolation is used to convert this dataset to raster format with a resolution of 25 km. The GHI is disaggregated into beam horizontal irradiation (BHI) and diffuse horizontal irradiation (DHI) by applying the Erbs diffuse fraction model (Erbs et al., 1982). This model is chosen since Dervishi and Mahdavi (2012) showed it to have the lowest mean bias deviation (MBD) and root mean square deviation (RMSD) from measured values between a selection of eight diffuse fraction models. For each combination of earlier mentioned azimuth and tilt classes, the DHI and BHI are transposed to five tilted plane components: beam, circumsolar, isotropic sky, horizon brightening, and ground reflected. This is done using the Perez model (Perez et al., 1990), which showed on average the lowest MBD and RMSD scores in a comparative research on seven anisotropic transposition models (Ineichen, 2011). Together, the tilted plane components comprise the global tilted irradiation (GTI), also known as Plane of Array (POA) irradiation. The GTI values are stored in a lookup table with four dimensions: meteorological 25 km cell, azimuth class, tilt class and hour of the year. Since each of the identified roof surfaces are provided values for the first three dimensions, an hour-by-hour solar resource profile can be assigned to them using the GTI lookup table. The lookup table approach is chosen in favor of calculating the solar resource for each of the millions of roof surfaces separately, for it greatly reduces computation time and required disk storage space.
2.2.3 Performance losses
Time-dependent rooftop PV performance ratios (PR) are determined using a computationally light approach developed by Moraitis et al. (2018). In this approach, measured electricity generation profiles are gathered for a large number of installed Dutch PV systems. For the same systems, electricity generation profiles are also modeled. While accounting for meteorological conditions, solar panel type and system azimuth and tilt, the model deliberately disregards loss factors such as shading, dust and inverter efficiency. Therefore, the subsequently calculated measured-to-modeled generation ratios can be regarded as system PR profiles quantifying the effect of the above mentioned performance losses. Year averaged system PR values are linearly regressed against corresponding neighborhood compactness indicators such as average building height (ABH), building height standard deviation (SDBH), number of buildings per square km, and nearest neighbor index. This is done in a grouped fashion, where the year average PRs of all PV systems that fall within certain compactness indicator bin are averaged. A strong correlation with PR is shown for SDBH (R2=0.898, %); the larger the variation in height between buildings within a neighborhood, the lower the year-average PR of the PV systems within that neighborhood (Moraitis et al., 2018). Considering that the effect of shading is not constant over time but rather dependent on the position of the sun, it would be inappropriate to apply year averaged PR values in the current research. Therefore, all PR profile values calculated by Moraitis et al. (2018) are grouped in SDBH bins and averaged over and polynomially regressed against integer values of their corresponding solar elevation angles (SEA) (see Fig. 1). The resulting regression formulas are used to construct hourly PR profiles for all Dutch neighborhoods, taking into account their SDBH (Kadaster, 2017a). Finally, for each residential and non-residential roof surface in the Netherlands, the earlier calculated GTI profiles are converted to PV potential profiles by applying corresponding neighborhood PR profiles and an assumed panel efficiency of 20 %. The resulting profiles are spatially and temporally aggregated to obtain the residential and non-residential rooftop PV potential per neighborhood.
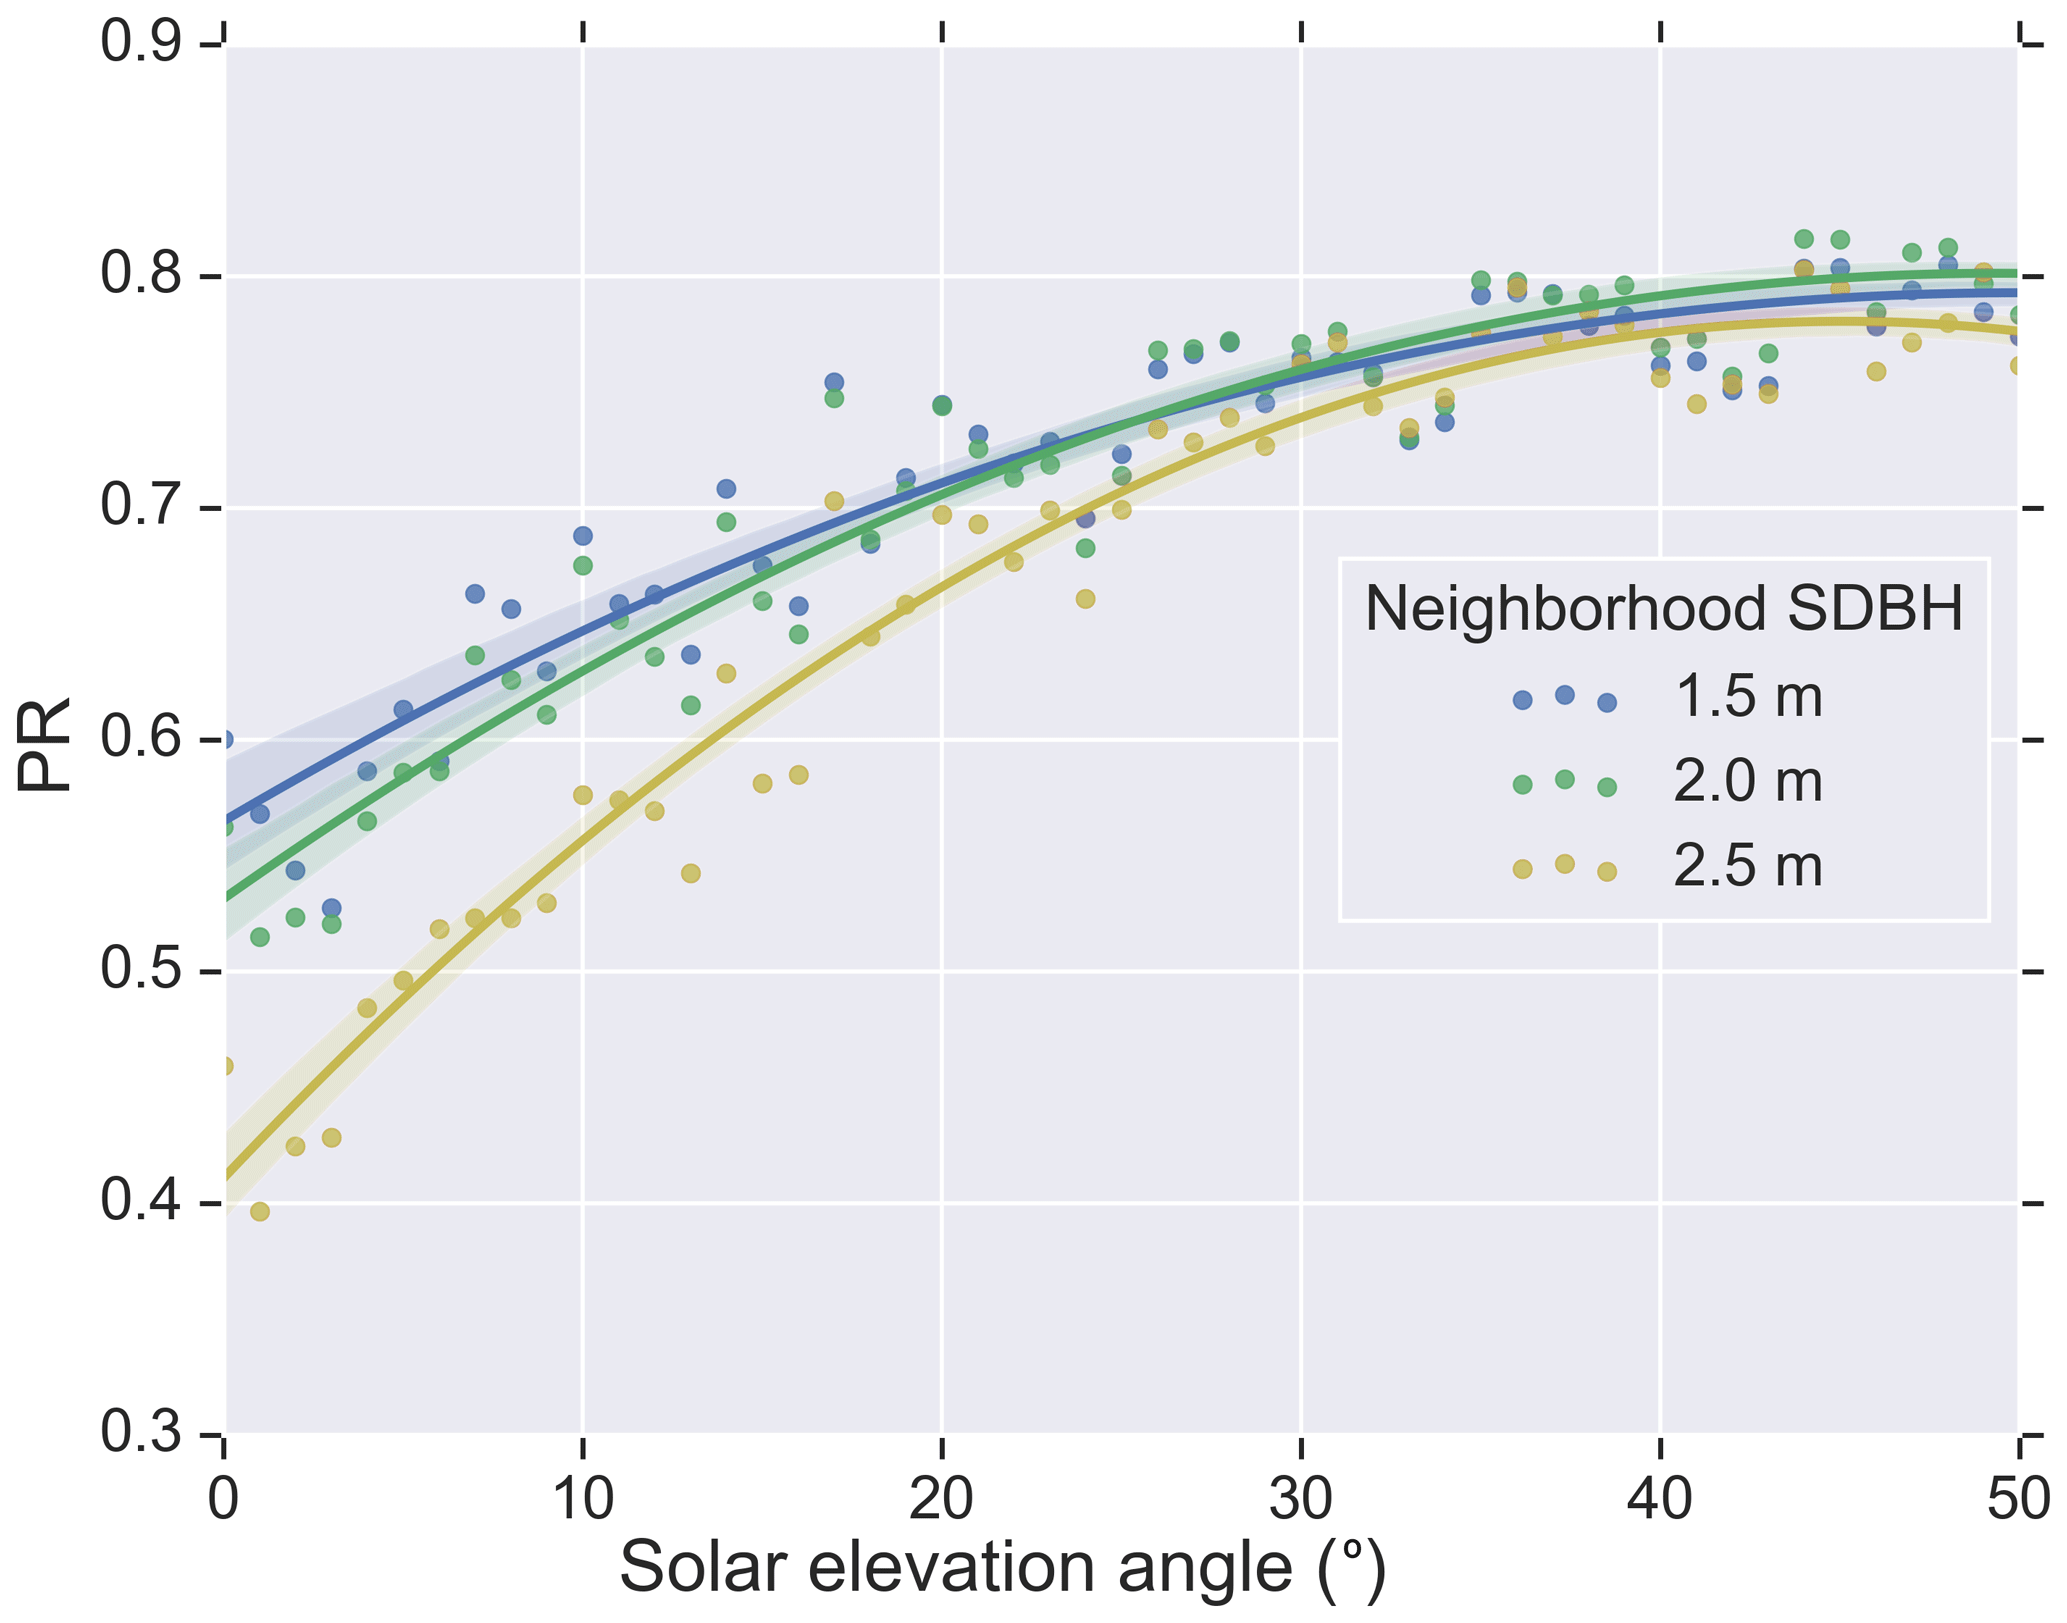
Figure 1Solar elevation dependent performance ratio (PR) per building height standard deviation (SDBH) class.
2.3 Spatial distribution of building-bound PV capacity
For the present-day situation (2019), residential and non-residential building-bound PV capacities per neighborhood are deduced from three datasets on currently registered PV systems (CBS, 2020, 2018; RVO, 2021). Residential building-bound PV capacity is directly available on a neighborhood level (CBS, 2020). However, non-residential PV capacity is provided on a municipality level, making no distinction between building-bound and land-bound systems (CBS, 2018). In order to make this distinction, a dataset comprising all large-scale SDE/SDE+ PV systems (>15 kWp) is used (RVO, 2021). Since this dataset does distinguish between building-bound and land-bound systems, the capacity of land-bound SDE/SDE+ PV systems operational in 2019 can be obtained on a municipality level. By subtracting it from the total non-residential capacity, the non-residential building-bound PV capacity is acquired on a municipality level. This is done under the assumption that all SDE/SDE+ projects are non-residential and all small scale installations (<15 kWh) are roof-mounted. The municipality-level capacities are further distributed over neighborhoods proportional to their non-residential roof surface areas. For the future situation, country-level residential and non-residential building-bound PV capacities (see Table 1) are distributed over neighborhoods proportional to their residential and non-residential rooftop PV potentials as calculated in Sect. 2.2. Subsequently, for both the present-day and future situation, the neighborhood PV capacities are subdistributed over tilt-azimuth-positions by applying the same distribution ratios as found in a large dataset of registered Dutch PV systems.
2.4 Spatial distribution of land and water-bound PV capacity
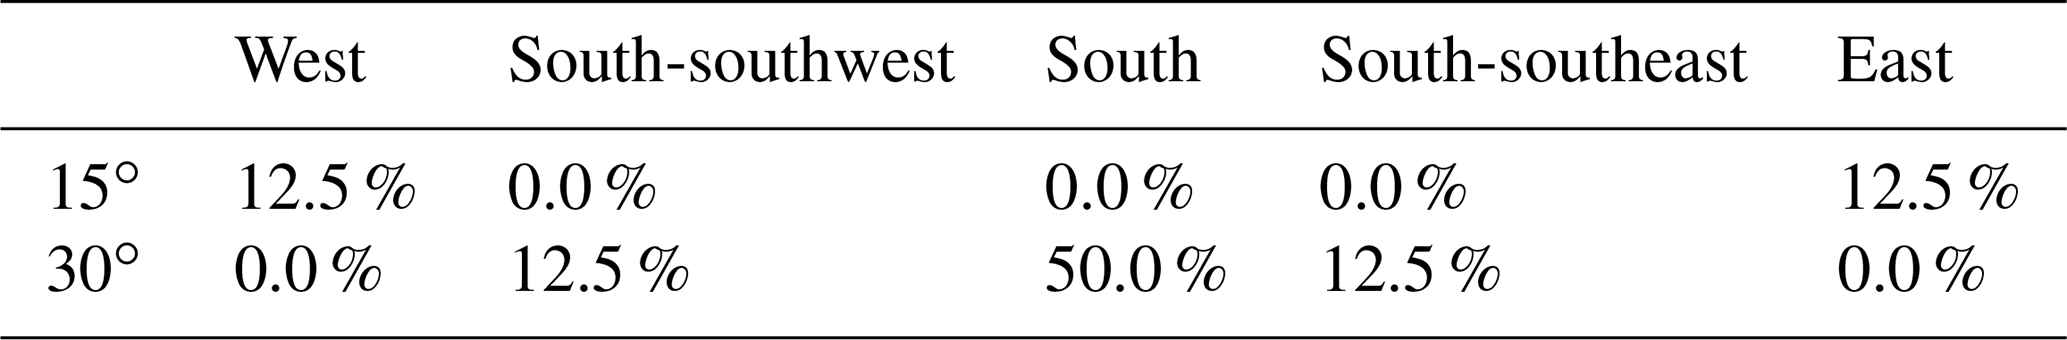
For the present-day situation, the land-bound PV capacity per municipality is obtained from the earlier utilized SDE/SDE+ dataset (RVO, 2021). For the future situation, country-level land and water-bound PV capacities (see Table 1) are distributed over municipalities proportional to their respective suitable land and water use areas. Here, agricultural land (Kadaster, 2017b) is deemed suitable for agricultural PV; regional and national motorways and railways (Kadaster, 2017b) for roadside PV; primary dikes (Rijkswaterstaat, 2020) for dike PV; small bodies of stagnant water (Kadaster, 2017b) for wave category I PV; larger bodies of stagnant water (CBS, 2017) for wave category II PV; and the Ijsselmeer, Markermeer and Zeeuwse Wateren (except for the Westerschelde) (CBS, 2017) for wave category III PV. Wave category IV (offshore) is kept on a country level. Table 2 provides the tilt-azimuth-position distribution assumed for all land and water-bound PV categories in both the present and future situations.
Table 2Tilt-azimuth-position distribution assumed for all field and water PV categories.
2.5 Construction of spatially resolved PV electricity profiles
Another lookup table is constructed using the process described in Sect. 2.2.2. Only this time, it is based on a specific meteorological year (2017) rather than a climate averaged year in order to capture the intermittent nature of solar irradiation. It is also normalized so that it provides hourly lossless PV generation per installed capacity (kW kWp−1) rather than GTI (kW m−2). The earlier determined regional building, land and water-bound capacities per tilt-azimuth-position (kWp) are multiplied by corresponding profiles from the normalized lookup table (kW kWp−1) to obtain lossless PV generation profiles (kW). This is done for the present-day situation and each energy transition scenario. The resulting building-bound generation profiles (neighborhood-level) are accounted for performance losses by applying the neighborhood PR profiles constructed in Sect. 2.2.3. For the land and water-bound generation profiles (municipality-level), this is done using a constant PR of 85 %. The corrected residential PV profiles are fully allocated to low voltage level. Non-residential profiles are distributed over low and mid voltage level, where the portion allocated to low voltage level is equal to the neighborhood floorspace share of utility buildings estimated to have a grid connection capacity of less than 300 kW. With the exception of wave category IV (which is fully allocated to high voltage level), land and water-bound profiles are uniformly distributed over mid and high voltage level with a 3:1 ratio.
3.1 Spatial distribution of PV generation
Figures 2 and 3 show building-bound, land-bound, water-bound and combined PV electricity generation densities (MWh ha−1 yr−1) on a municipality level. Figure 2 does this for the present-day situation (2019) and Fig. 3 for the 2050 Regional Steering scenario. Note that for each map, the density classes are optimized to expose geographical variation, and do therefore differ between PV categories (colors) and scenarios (figures). Furthermore, keep in mind that water-based PV electricity generated on the Ijsselmeer, Markermeer and Zeeuwse Wateren (wave category III) are attributed to municipalities surrounding them. Offshore PV generation (wave category IV) is excluded from the maps, as it is dealt with on a country-level.
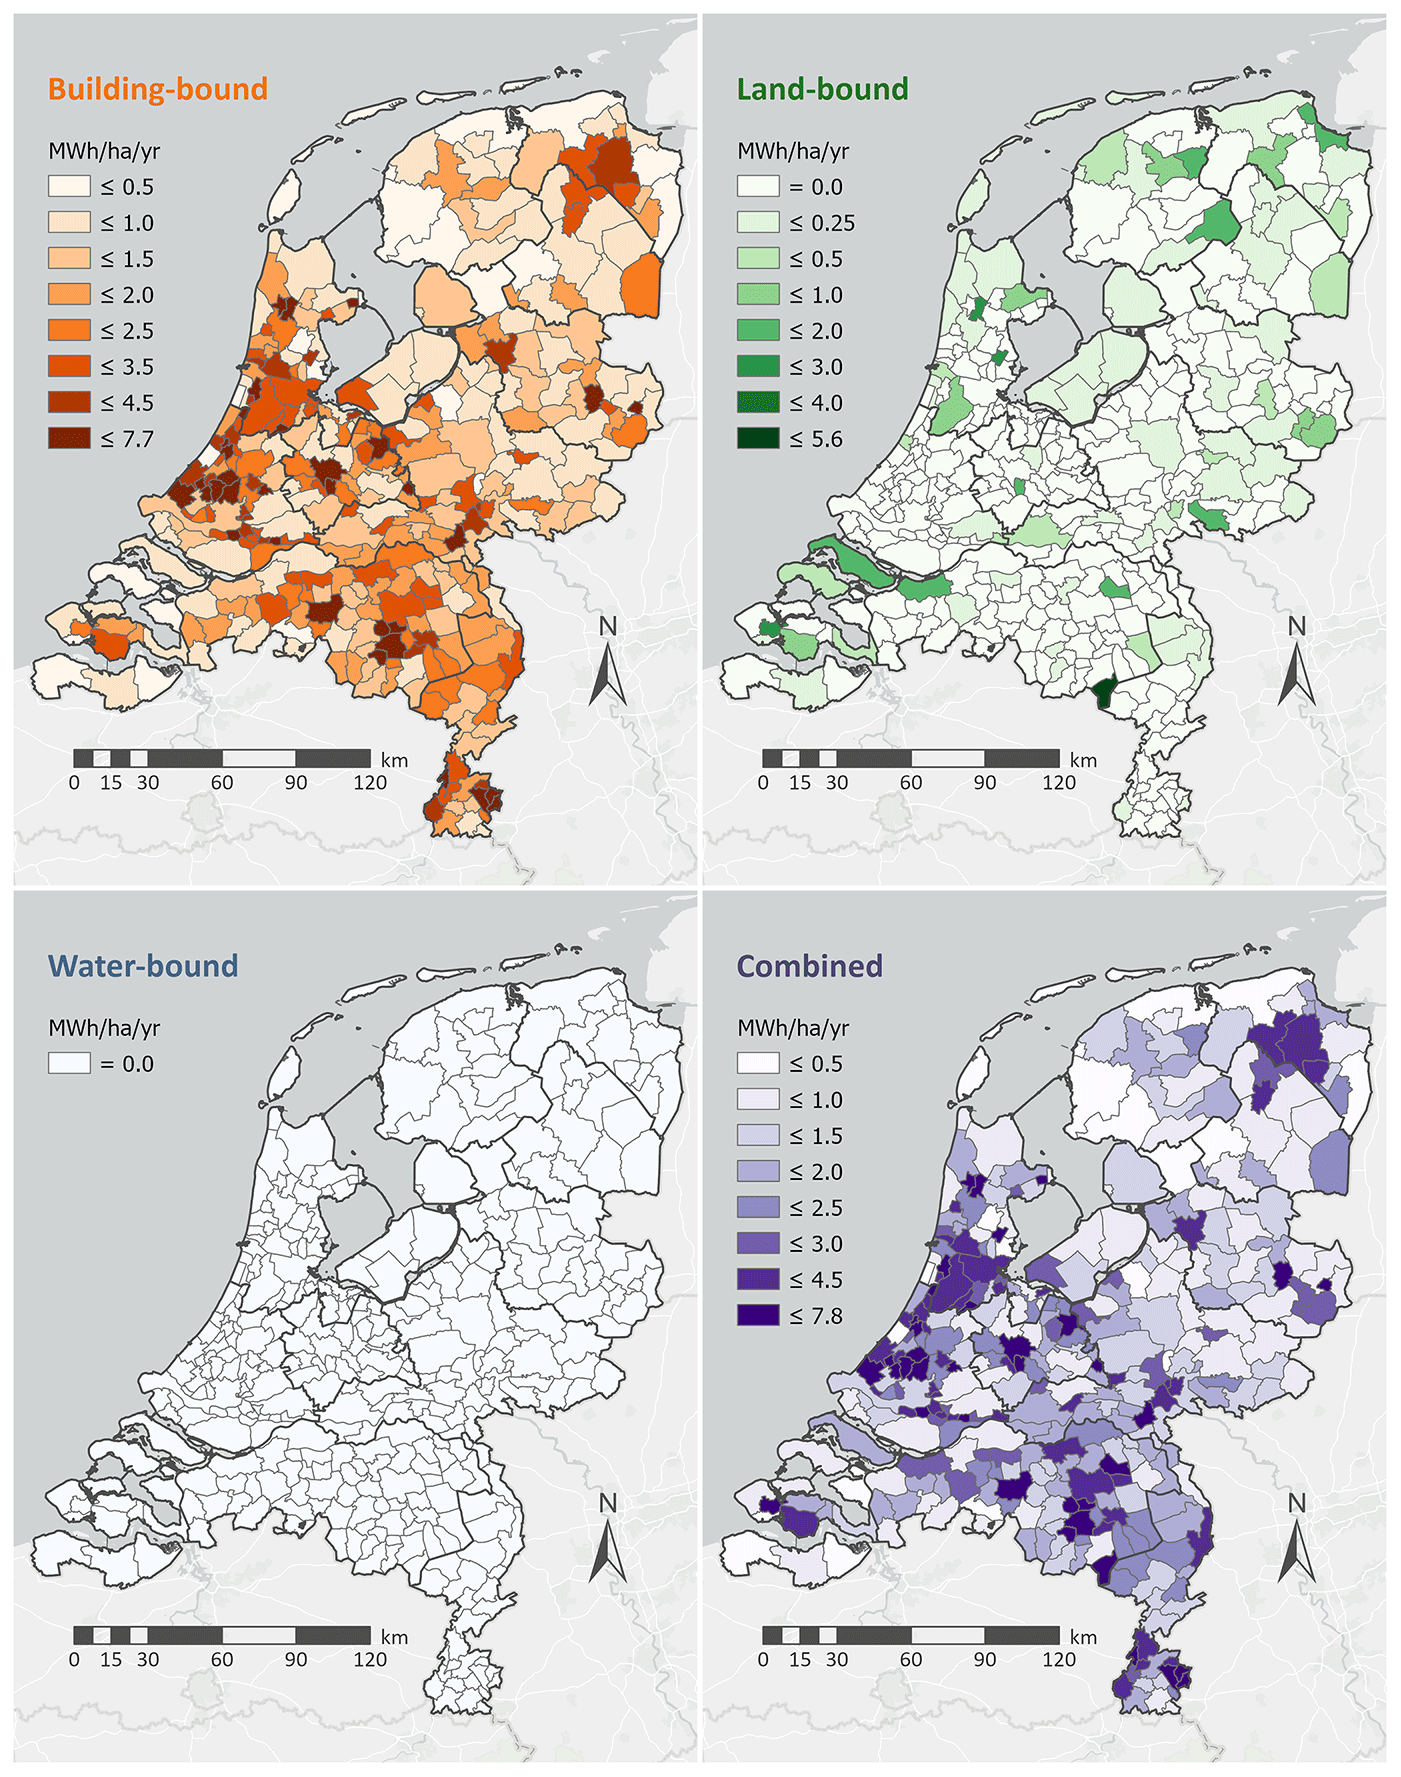
Figure 2Building-bound, land-bound, water-bound and combined PV generation densities per municipality, for the present-day (2019) situation. Basemap service layer credits: Esri, DeLorme, HERE, MapmyIndia.
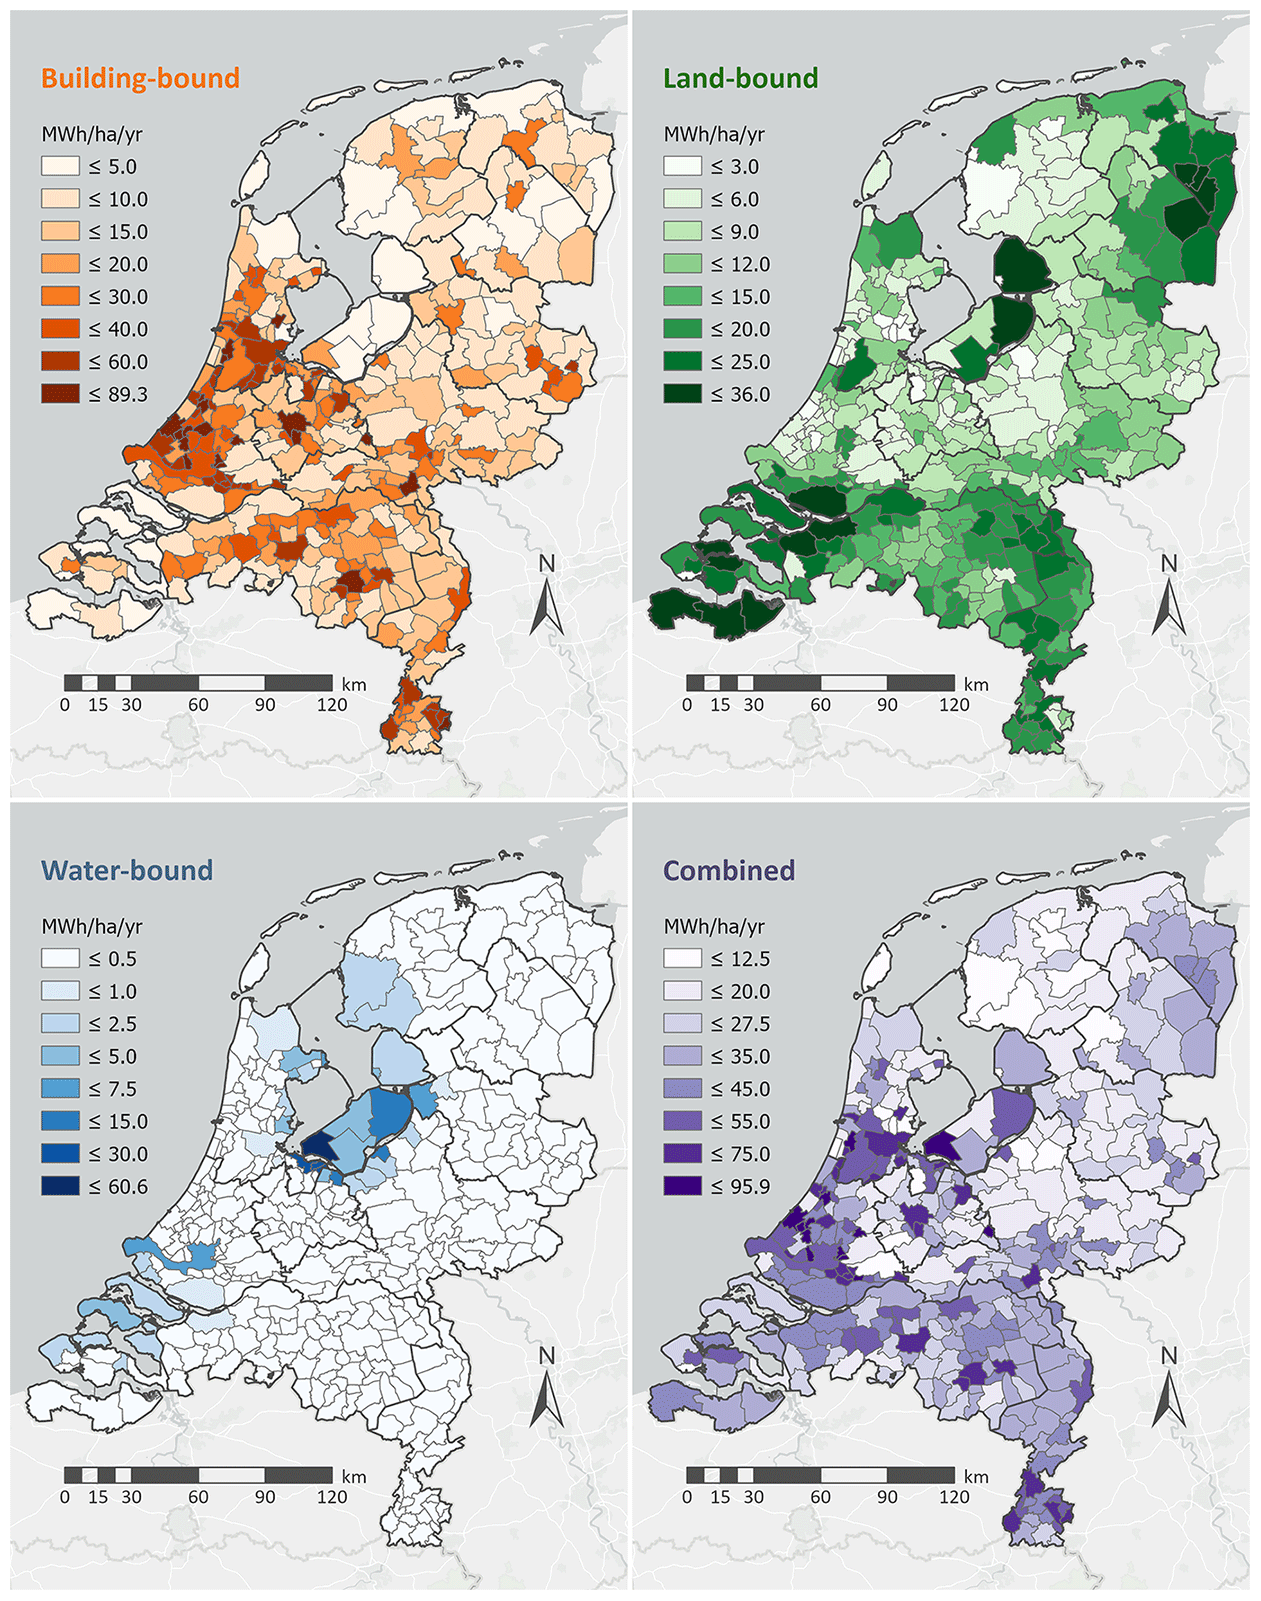
Figure 3Building-bound, land-bound, water-bound and combined PV generation densities per municipality, for the 2050 Regional Steering scenario. Basemap service layer credits: Esri, DeLorme, HERE, MapmyIndia.
Compared to the present-day situation, building-bound PV generation densities are generally much higher in the 2050 Regional Steering scenario. This scenario shows a maximum municipality generation density of 89.3 MWh ha−1 yr−1, 11.6 times higher than the present-day's maximum (7.7 MWh ha−1 yr−1). In 2050, building-bound PV generation densities seem to closely follow regional roof surface densities, as can be seen in more detail from Fig. 4. Deviations from this relationship can be explained through regional differences in meteorology, optimally of roof orientations and the ratio of residential to non-residential buildings. While this translates to very high concentrations towards city centers, generation densities of suburbs, towns and business areas are not that much lower. This can be explained by the fact that roof-bound PV generation is, in contrast to electricity demand, not proportional to building height (which is generally much larger for city center buildings). Looking at the building-bound 2050 Regional Steering map from a more zoomed-out perspective, very large and often joined clusters of high generation densities are revealed for the Randstad area (i.e. the provinces of Noord-Holland, Zuid-Holland and Utrecht) and the province of Noord-Brabant (see Fig. B1 for an overview of Dutch provinces). In contrast, the province of Zeeland and the northeastern half of the country show considerably sparser and smaller generation concentrations. Generally speaking, a similar (relative) geographical distribution is shown for building-bound generation in the present-day situation, with the notable exception of the province of Groningen.
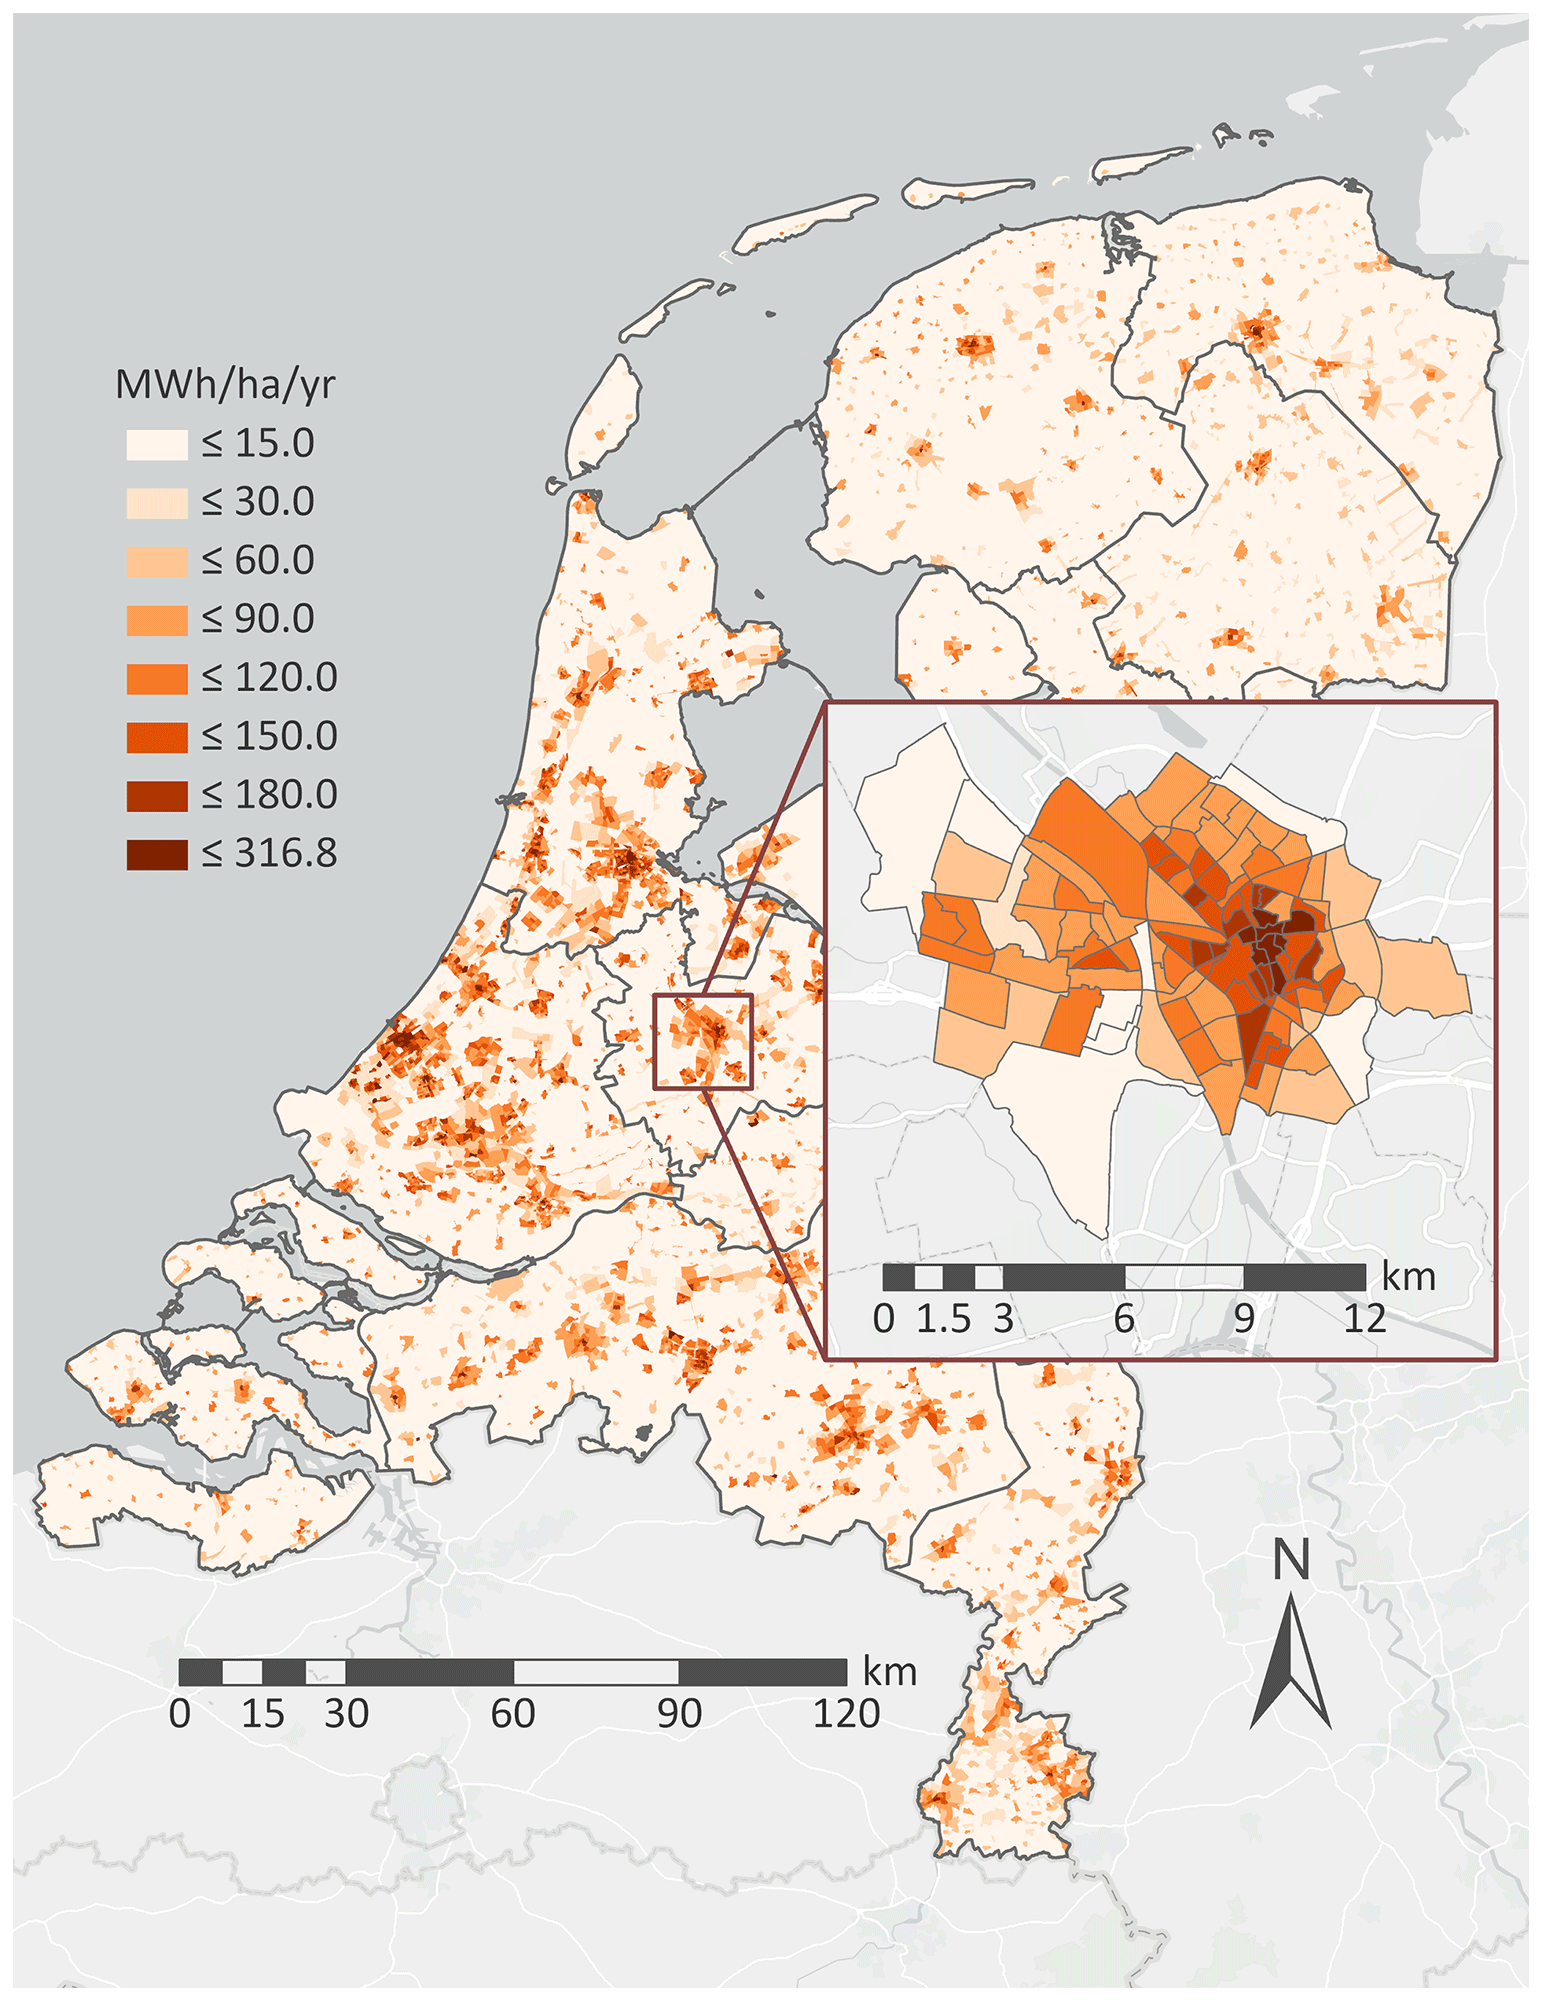
Figure 4Building-bound PV generation density per neighborhood, for the 2050 Regional Steering scenario. Basemap service layer credits: Esri, DeLorme, HERE, MapmyIndia.
Also for land-bound PV, the 2050 Regional Steering scenario generally shows much higher electricity generation densities than the present-day situation. The scenario shows a maximum generation density of 36.0 MWh ha−1 yr−1, 6.4 times higher than the maximum in the present-day situation (5.6 MWh ha−1 yr−1). In 2050, often large clusters of very high generation densities can be found in the northeast and the southwest of the country as well as in the province of Flevoland. High densities are shown throughout the province of Limburg. The Randstad area and the provinces of Gelderland, Overijssel and Friesland on the other hand typically show low to medium land-bound generation densities. The present-day map shows a much more scattered picture; a clear majority of very low to low generation density municipalities dotted with some higher density ones.
Water-bound PV is not yet operational in the present-day situation, hence the blank map. The 2050 Regional Steering scenario, on the other hand, shows water-bound electricity generation densities of up to 60.6 MWh ha−1 yr−1 (albeit a lone outlier). The clear majority of generation in this scenario is attributed to municipalities surrounding the Ijsselmeer, Markermeer and Zeeuwse Wateren (with the exception of the Westerschelde). The limited wave category I PV capacity is spread out to such an extent that it does not amount to considerable generation densities in the other municipalities.
In the 2050 Regional Steering scenario, building-bound electricity generation shows only limited geographical overlap with both land-bound and water-bound generation. On the other hand, many municipalities that show considerable water-bound generation densities also show considerable land-bound generation densities. Considering combined PV (building-bound, land-bound and water-bound PV taken together), one can roughly divide the country through northwest-southeast diagonal creating a southwestern part which is relatively generation rich and a northeastern part which is relatively generation poor. Notable exceptions to this notion are the municipalities along the western and southern boarders of the province of Utrecht, as they show relatively low generation densities. Municipality-level PV generation density maps for the 2030 Climate Agreement, 2050 National Steering and 2050 International Steering scenarios can be found in Appendix C.
3.2 Statistical distribution of PV generation
Figure 5 displays municipality-level solar electricity generation densities (MWh ha−1 yr−1) in the form of a cumulative distribution function (CDF) for each scenario. These CDFs indicate the probability that a randomly selected municipality has a generation density equal to or lower than the value on the x axis. The embedded table presents a numeric version of the graph, stating mean, first quartile, second quartile (also called median) and third quartile density values. All future scenarios show a short and gradual linear section (indicating an average representation of very low density municipalities) followed by a logarithmic section (indicating a high representation of low density municipalities and decreasing representation of municipalities with increasingly large generation densities). Through time, a clear increase in mean generation density can be perceived, especially when following the Regional Steering pathway.
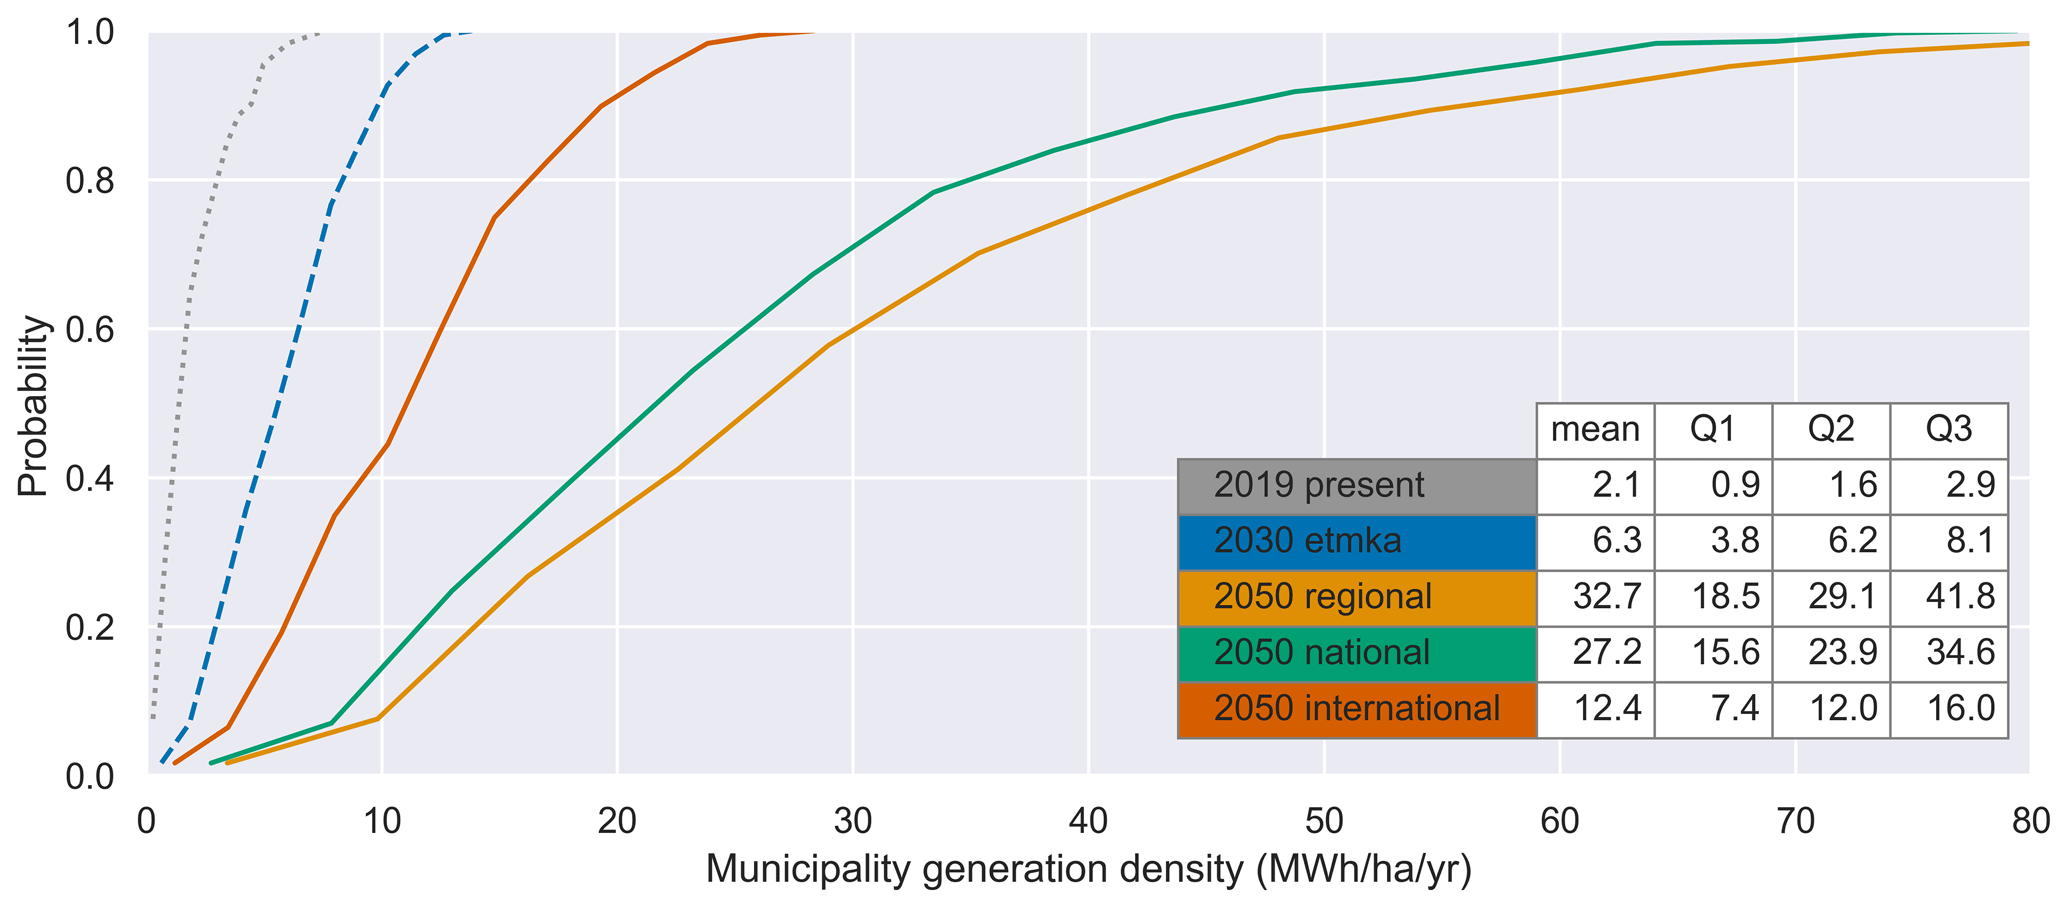
Figure 5Cumulative distribution functions (CDF) of municipality PV generation densities for all scenarios. The dotted line represents the present-day (2019) situation, the dashed line the 2030 situation and the solid lines the three 2050 situations.
3.3 Temporal distribution of PV generation
Considering the temporal component of solar electricity generation, the heatmap featured in Fig. 6 shows the present-day country-level power output for each hour of the day (y axis) for each day of the year (x axis). The accompanying line graphs (gray) display year-averaged values per day of the year (horizontal graph) and hour of the day (vertical graph). Generally speaking, the power output increases towards summer and decreases towards winter. However, the horizontal line graph shows high day-to-day variation and days with very low power output can be observed throughout the year, even in summer. When averaged over the year, hourly power output follows a clean bell-shaped curve peaking around noon, as can be seen from the vertical line graph. Nevertheless, alternative power output profiles can be observed for individual days (e.g. peaking in morning or afternoon), reflecting varying cloud conditions.
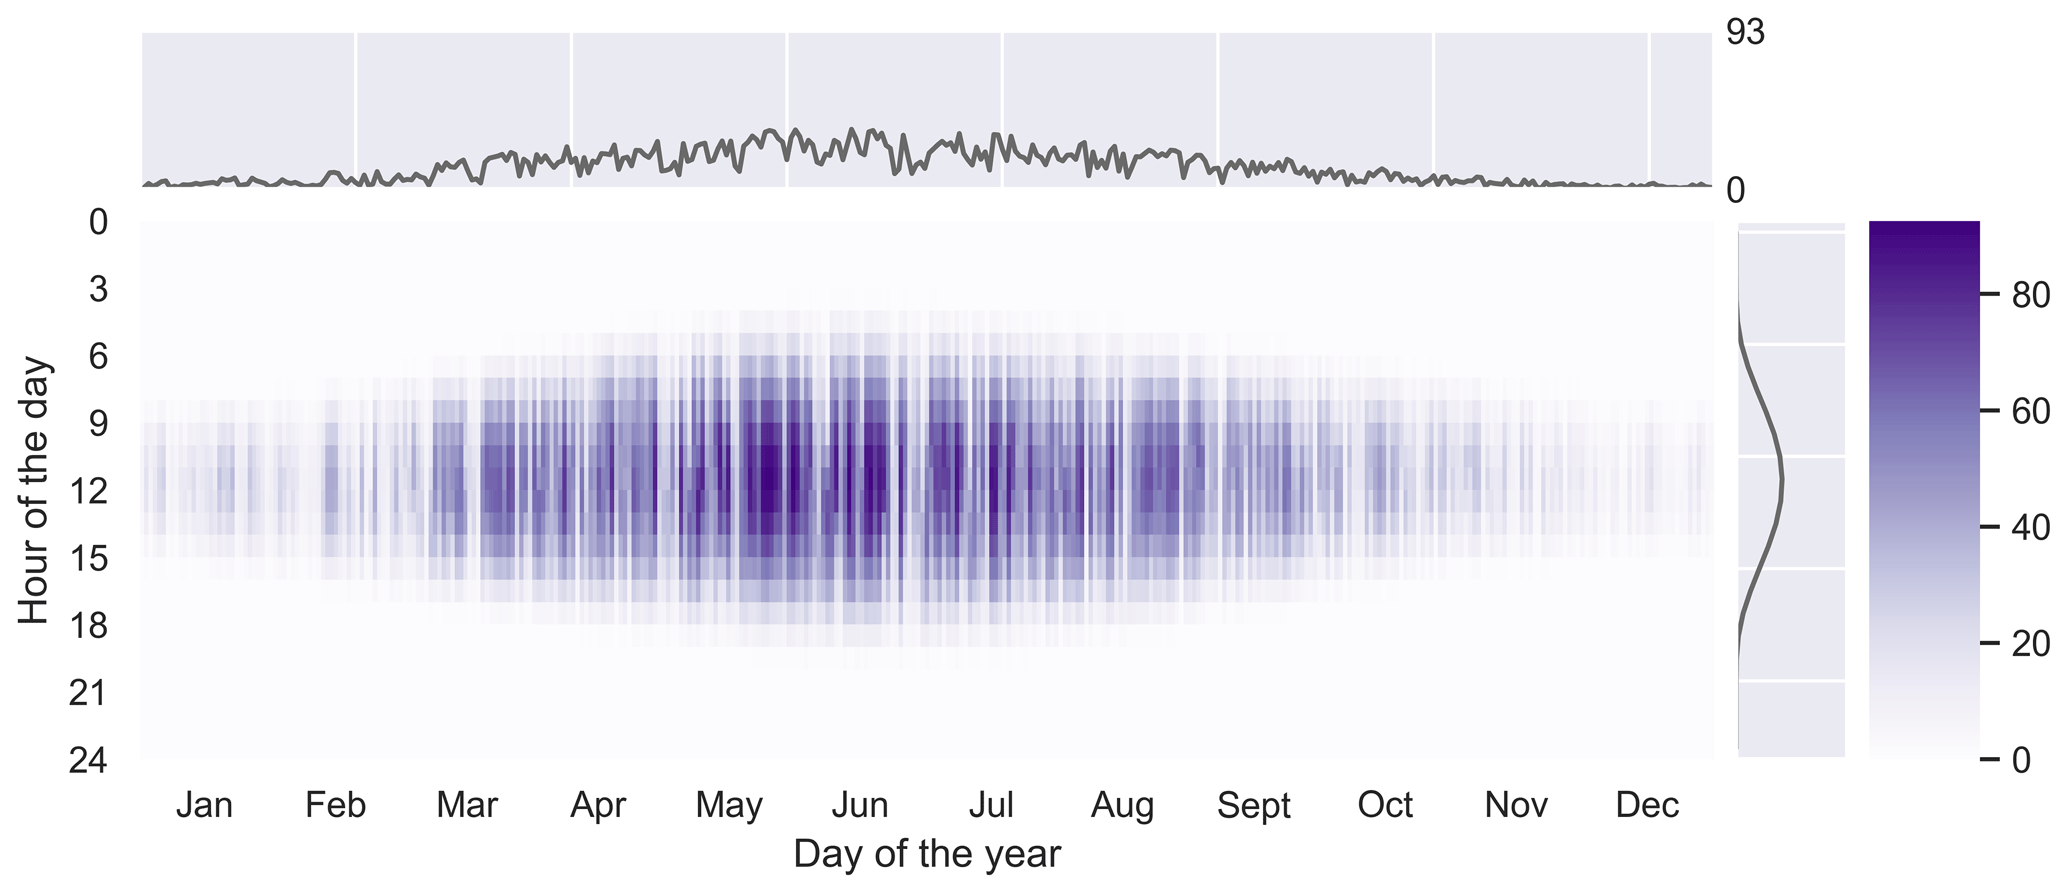
Figure 6Heatmap of country-level combined PV power output (GW), for the 2050 Regional Steering scenario.
3.4 Comparison between main categories and scenarios
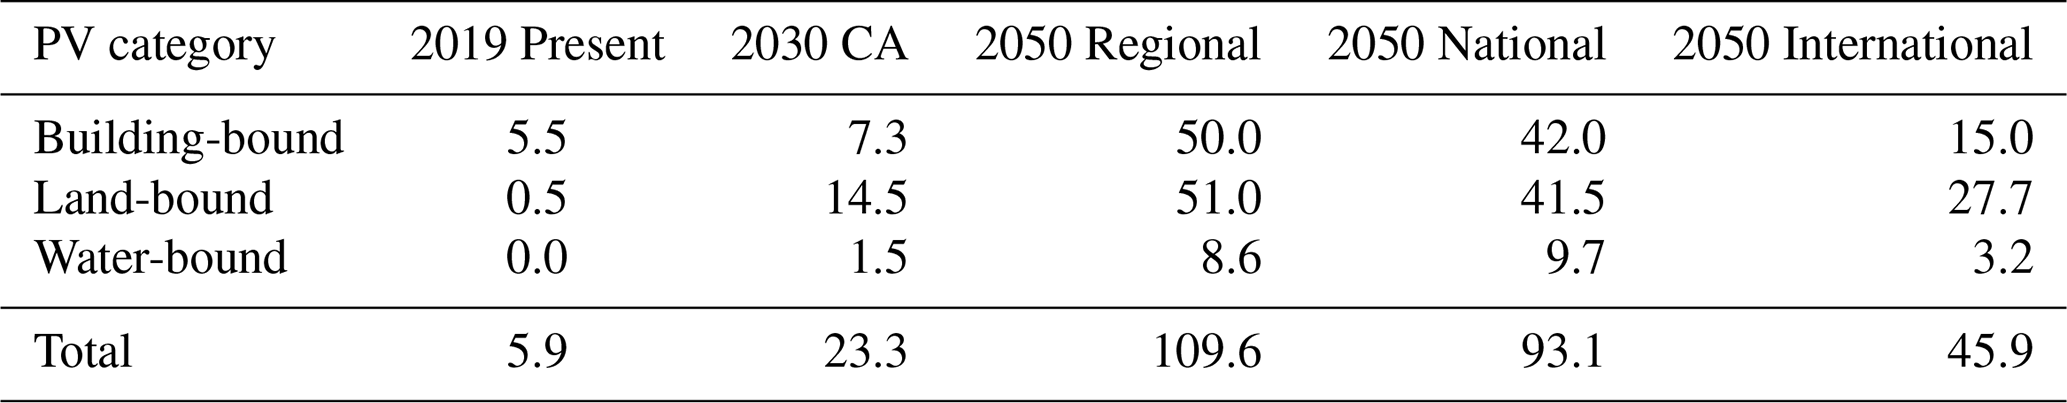
Table 3 presents the total building-bound, land-bound, water-bound and country-level solar electricity generation for the present-day situation and each energy transition scenario. It shows the country-level generation to be a factor 18.5, 15.7, or 7.7 higher in 2050 compared to the present-day situation when respectively applying Regional, National or International Steering. Where building-bound generation constitutes the vast majority of country-level generation in the present-day situation, it is on par with land-bound generation in the 2050 Regional and National Steering scenarios. In the 2030 Climate Agreement and 2050 International Steering scenarios, land-bound generation is even clearly dominant. While water-bound generation sees a clear growth through time (most notably when following the Regional Steering pathway), it remains small compared to building-bound and land-bound generation in 2030 and 2050.
Table 3Total PV generation (TWh yr−1) per main PV category for each energy transition scenario.
The developed solar energy model has some limitations and uncertainties, which are discussed in this section. In the current model, all building-bound PV capacity is assumed to be roof-mounted. However, it is expected that the share of facade-mounted PV is going to increase towards 2050 (Folkerts et al., 2017). Due to its vertical orientation, incorporating facade-bound PV into the model would likely result in somewhat higher generation in winter, but somewhat lower generation over the year.
The model currently distributes future building-bound PV capacities over neighborhoods proportional to their corresponding roof surface PV potentials. However, also certain socioeconomic factors have found to be correlated to regional PV adoption rates (van der Kam et al., 2018). Furthermore, building stocks (and therefore roof surfaces suitable for building-bound PV) are assumed to be static throughout time, while regionally varying developments can be expected. Although extrapolation of above mentioned factors into the future is challenging, incorporating them into the model might lead to improved geographic distribution of building-bound PV capacities.
Once distributed over neighborhoods, building-bound PV capacities are currently sub-distributed over tilt-azimuth-positions using present-day ratios which show very high representations of south-facing systems. This approach can lead to unrealistic amounts of south-facing systems within a neighborhood when a scenario dictates a very large increase in building-bound PV; there might simply not be enough south-facing or flat roof surface to accommodate it. Incorporation of an algorithm which redistributes capacity over tilt-azimuth-positions when insufficient properly orientated roof surface is regionally available would lead to more realistic generation profiles. Moreover, future electricity pricing models might favor installations orientated (fully or somewhat) towards the east or west over ones fully facing south (Litjens et al., 2017). This could for example be the case in residential areas, where generation profiles of installations deviating from full south tend match local demand profiles better. Therefore, it can be expected that in reality larger proportions of systems will be installed on non south-facing roof surfaces, leading to somewhat lower overall generation and less pronounced midday peaks.
Regarding meteorological input, the current model interpolates measurements from ground observations stations to obtain full country coverage. As an alternative, spatially explicit solar irradiation data obtained from the satellite-driven MSG-CPP model (KNMI, 2022) or the ERA5-Land reanalysis dataset (Muñoz-Sabater et al., 2012; Ramirez Camargo and Schmidt, 2020) can be used. This would enhance both the spatial resolution and accuracy of the meteorological input, thereby allowing for more realistic solar electricity generation profiles to be constructed. This approach would require considerably more computational power and disk space, though.
Currently, the model assumes the same meteorological conditions for all present-day, 2030 and 2050 runs. However, a general increase in both air temperature and solar irradiation is expected for the Netherlands as a result of global climate change (KNMI, 2023). Since both of these variables directly affect solar electricity generation, the incorporation of climate change scenarios into the model could lead to more accurate generation profiles for the future scenarios.
Section 3.1 mentions that, in the Regional Steering scenario, the country can roughly be divided in a southwestern half which is relatively generation rich and a northeastern half which is relatively generation poor. Climate average solar irradiation, on the other hand, is shown to be somewhat higher towards the west and somewhat lower towards the east of the country (with a maximum difference of 10 %) (KNMI, 2023). The partial geographical deviation between solar resource and generation can be explained through regional differences in solar capacity densities. This, in turn, underlines that solar generation is a product of both solar resource and suitable roof, land and water surfaces.
The methodology proposed in the present paper can also be applied to other areas around the word. It has to be verified, however, that the various area-specific input datasets required by the SEM are also available for the area of interest. If this is not the case, custom workarounds must be developed and incorporated.
In conclusion, a solar energy module is developed which is capable of constructing geodatabases of hourly electricity generation profiles for nine categories of building-bound, land-bound and water-bound PV. It does this on a neighborhood to municipality level for the present-day situation and available top-down scenarios for the near future (2030) and the distant future (2050). Country-level PV capacities are geographically distributed based on spatial variance in roof PV potential and availability of suitable land and water use areas. Corresponding electricity generation profiles are constructed using historical meteorological measurements, a diffuse fraction model and a anisotropic transposition model. Empirically found PR profiles are applied to account for a multitude of performance loss factors, including shading, dust and inverter efficiency. The added value of the SEM is underscored by its ability to construct not only temporally but also spatially resolved generation profiles. Being incorporated in the overlapping ASM2 model, this allows for more detailed analyses of grid congestion, energy storage and hydrogen production in future Dutch energy systems. Furthermore, the SEM can be easily updated with new versions of input data and re-runs for other scenarios (which support updated policy options) are straightforward. The following answers to the research questions are found:
Q1. What are the projected developments in spatially resolved building-bound, land-bound and water-bound PV capacity?
Country-level building-bound PV capacity is projected to increase from 6.6 GWp in 2019 to either 60.4, 51.0, or 18.1 GWp in 2050 when respectively following the Regional, National or International Steering pathway. In the 2050 Regional Steering scenario, building-bound PV capacity densities follow neighborhood roof surface densities, which translates to very large and often joined clusters of high capacity densities in the Randstad area and the province of Noord-Brabant. The province of Zeeland and the northeastern half of the country, on the other hand, show considerably sparser and smaller capacity concentrations. Compared to the present-day situation, the 2050 Regional Steering scenario shows a similar (relative) spatial distribution for building-bound capacity, with the notable exception of the province of Groningen. Considering land-bound PV, country-level capacity increases from 0.5 GWp in 2019 to 56.9, 46.3, or 30.9 GWp in 2050 when applying Regional, National or International Steering, respectively. In 2050, the northeast and the southwest of the country, as well as the province of Flevoland, host often large clusters of very high land-bound capacity densities. In contrast, low to medium land-bound capacity densities are typically shown in the Randstad area and the provinces of Gelderland, Overijssel and Friesland. A much more scattered picture is shown for the present-day situation; a clear majority of very low to low capacity density municipalities dotted with some higher density ones. Country-level water-bound PV is projected to increase from 0.0 GWp to either 9.3, 10.4, or 3.5 GWp in 2050 when respectively following the Regional, National or International Steering pathway. This capacity is almost entirely allocated to municipalities surrounding the Ijsselmeer, Markermeer and Zeeuwse Wateren. Building-bound capacity shows only limited geographical overlap with both land-bound and water-bound PV capacity in 2050. On the other hand, regions with considerable water-bound PV capacity also tend to show considerable land-bound PV capacity.
Q2. What is the temporally resolved electricity generation of this PV capacity under typical meteorological circumstances?
Under identical meteorological circumstances (2017), country-level combined PV generation is projected to increase from 5.9 TWh in 2019 to 109.6, 39.1, or 45.9 TWh in 2050 when applying Regional, National or International Steering, respectively. Logically, PV generation densities follow the regional capacity densities discussed above. Deviations from this relationship can be explained through regional differences in meteorology. While PV generation generally increases towards summer and decreases towards winter, the day-to-day variation is high and days with very low PV generation can be found throughout the year, even in summer. And while hourly generation follows a clean bell-shaped curve peaking around noon when average over the year, alternative generation profiles can be observed for individual days due to varying cloud conditions.
Some prominent recommendations for further research follow from the discussion. This includes the incorporation of facade-bound PV, the integration of socioeconomic factors into the capacity distribution algorithm, and the utilization of satellite-derived meteorological data. In addition, the incorporation of an algorithm which redistributes capacity over tilt-azimuth-positions when insufficient properly orientated roof surface is available in a certain neighborhood is highly recommended when aiming to further improve the module.
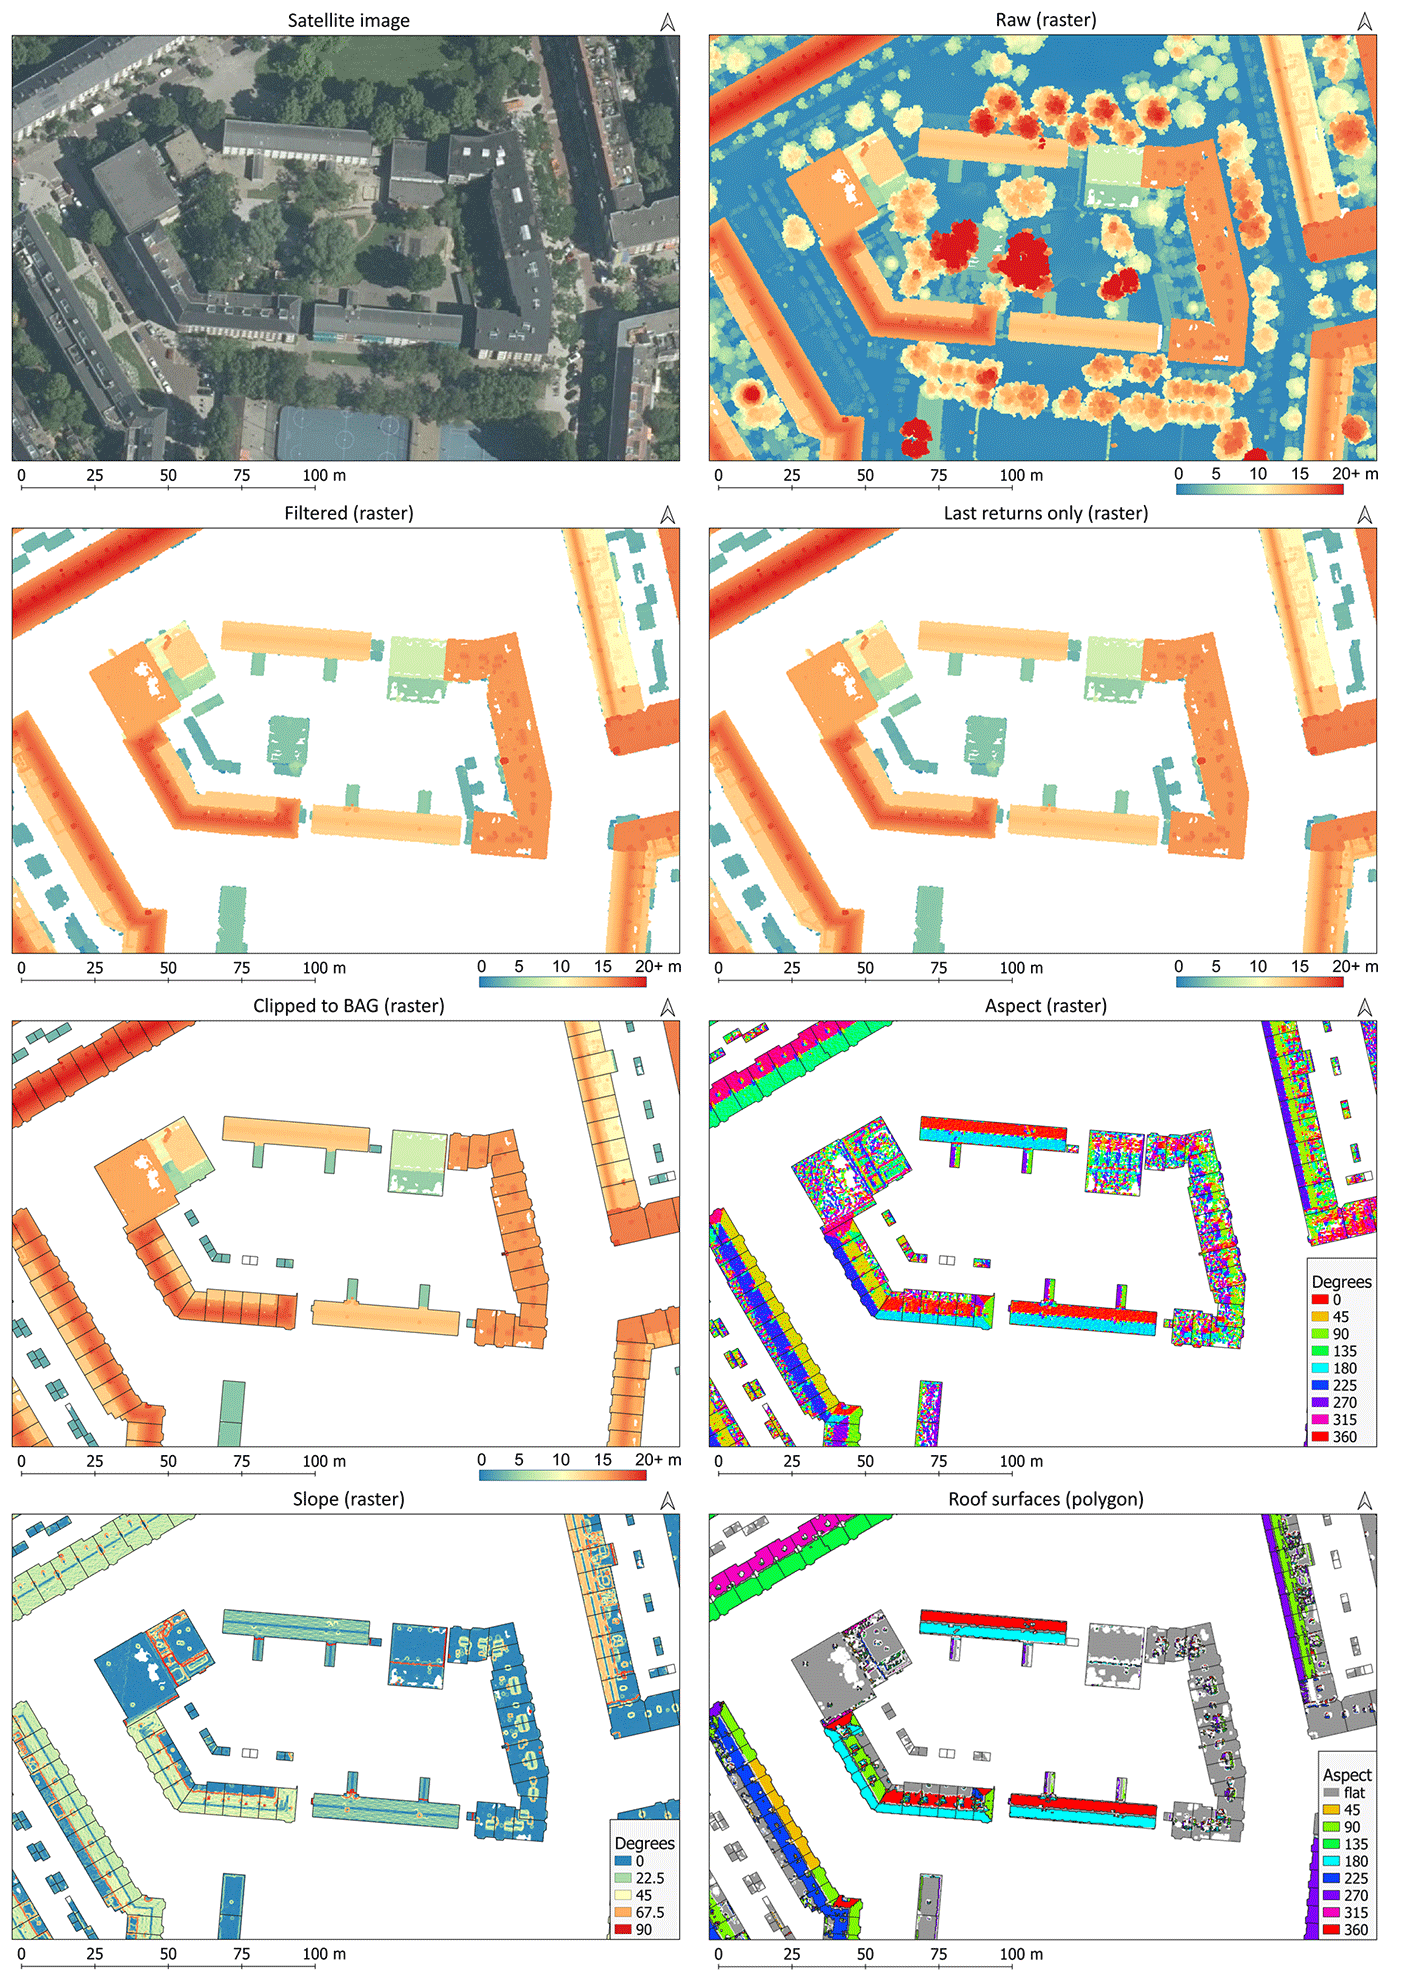
Figure A1Step-wise identification of roof surfaces for a sample area in the city of Amsterdam. Satellite image: © Google 2018.
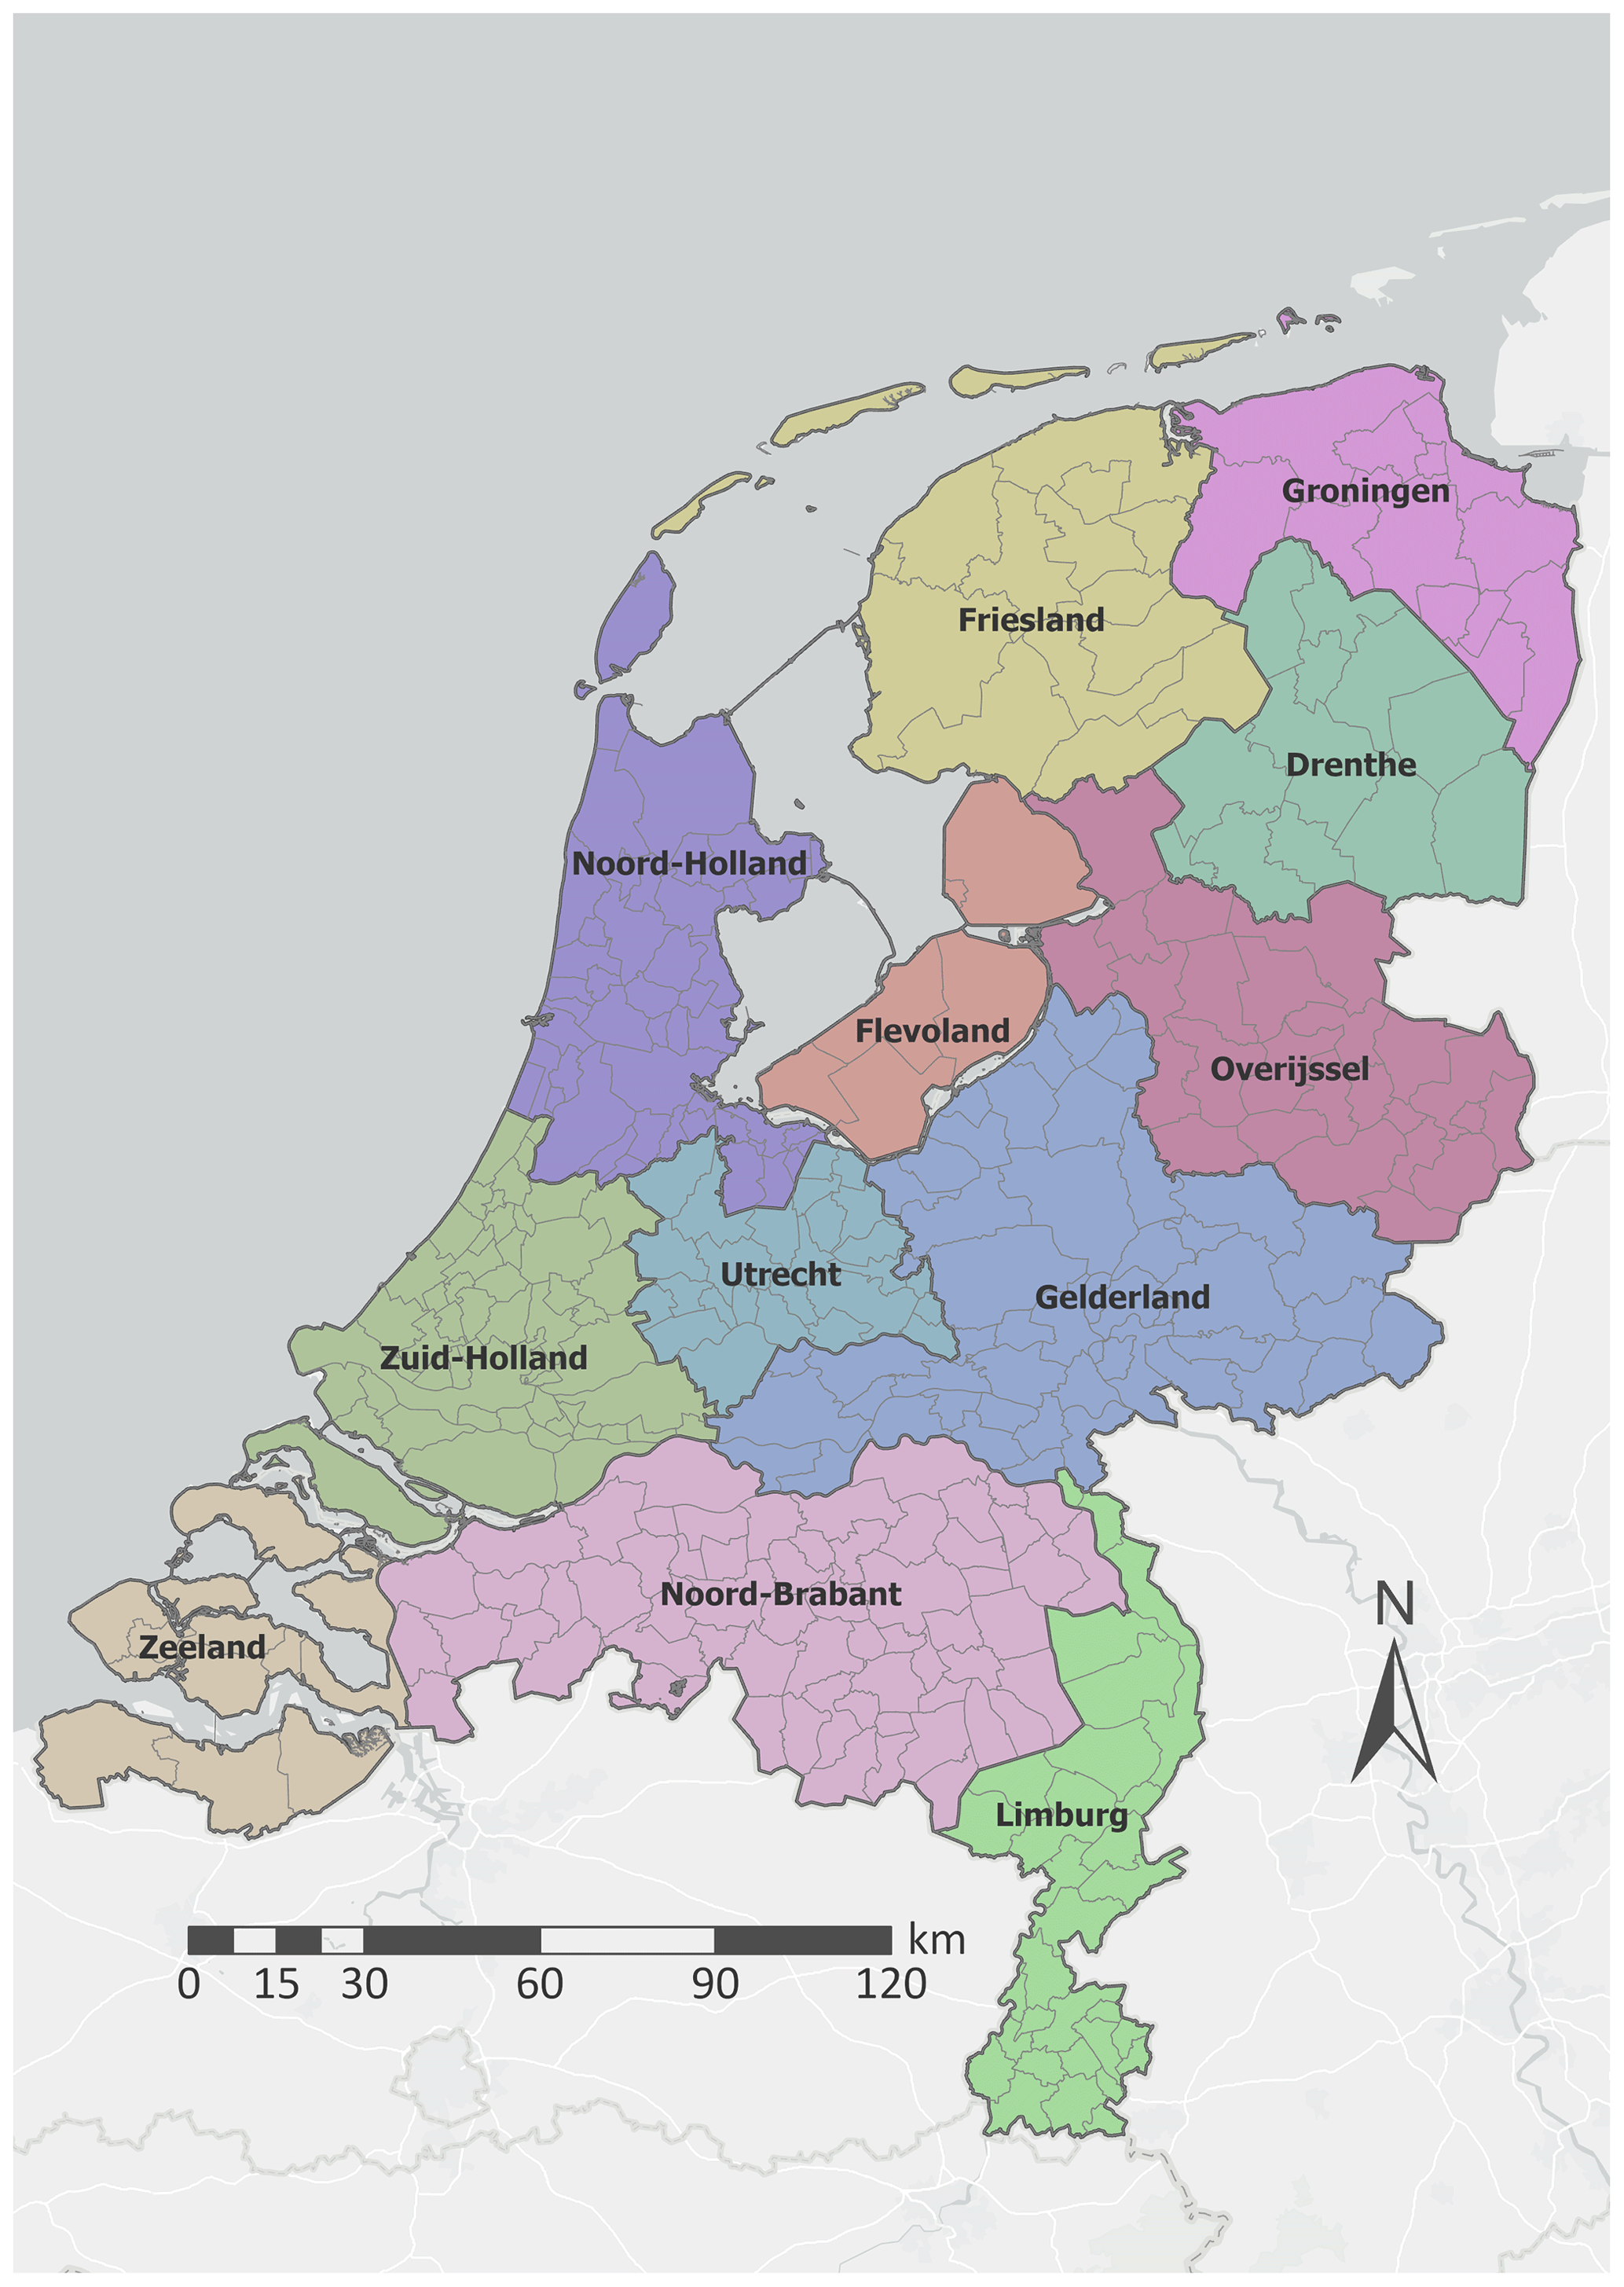
Figure B1Dutch provinces (thick outline, credits: Esri Nederland, CBS) and municipalities (thin outline, credits: CBS). Basemap service layer credits: Esri, DeLorme, HERE, MapmyIndia.
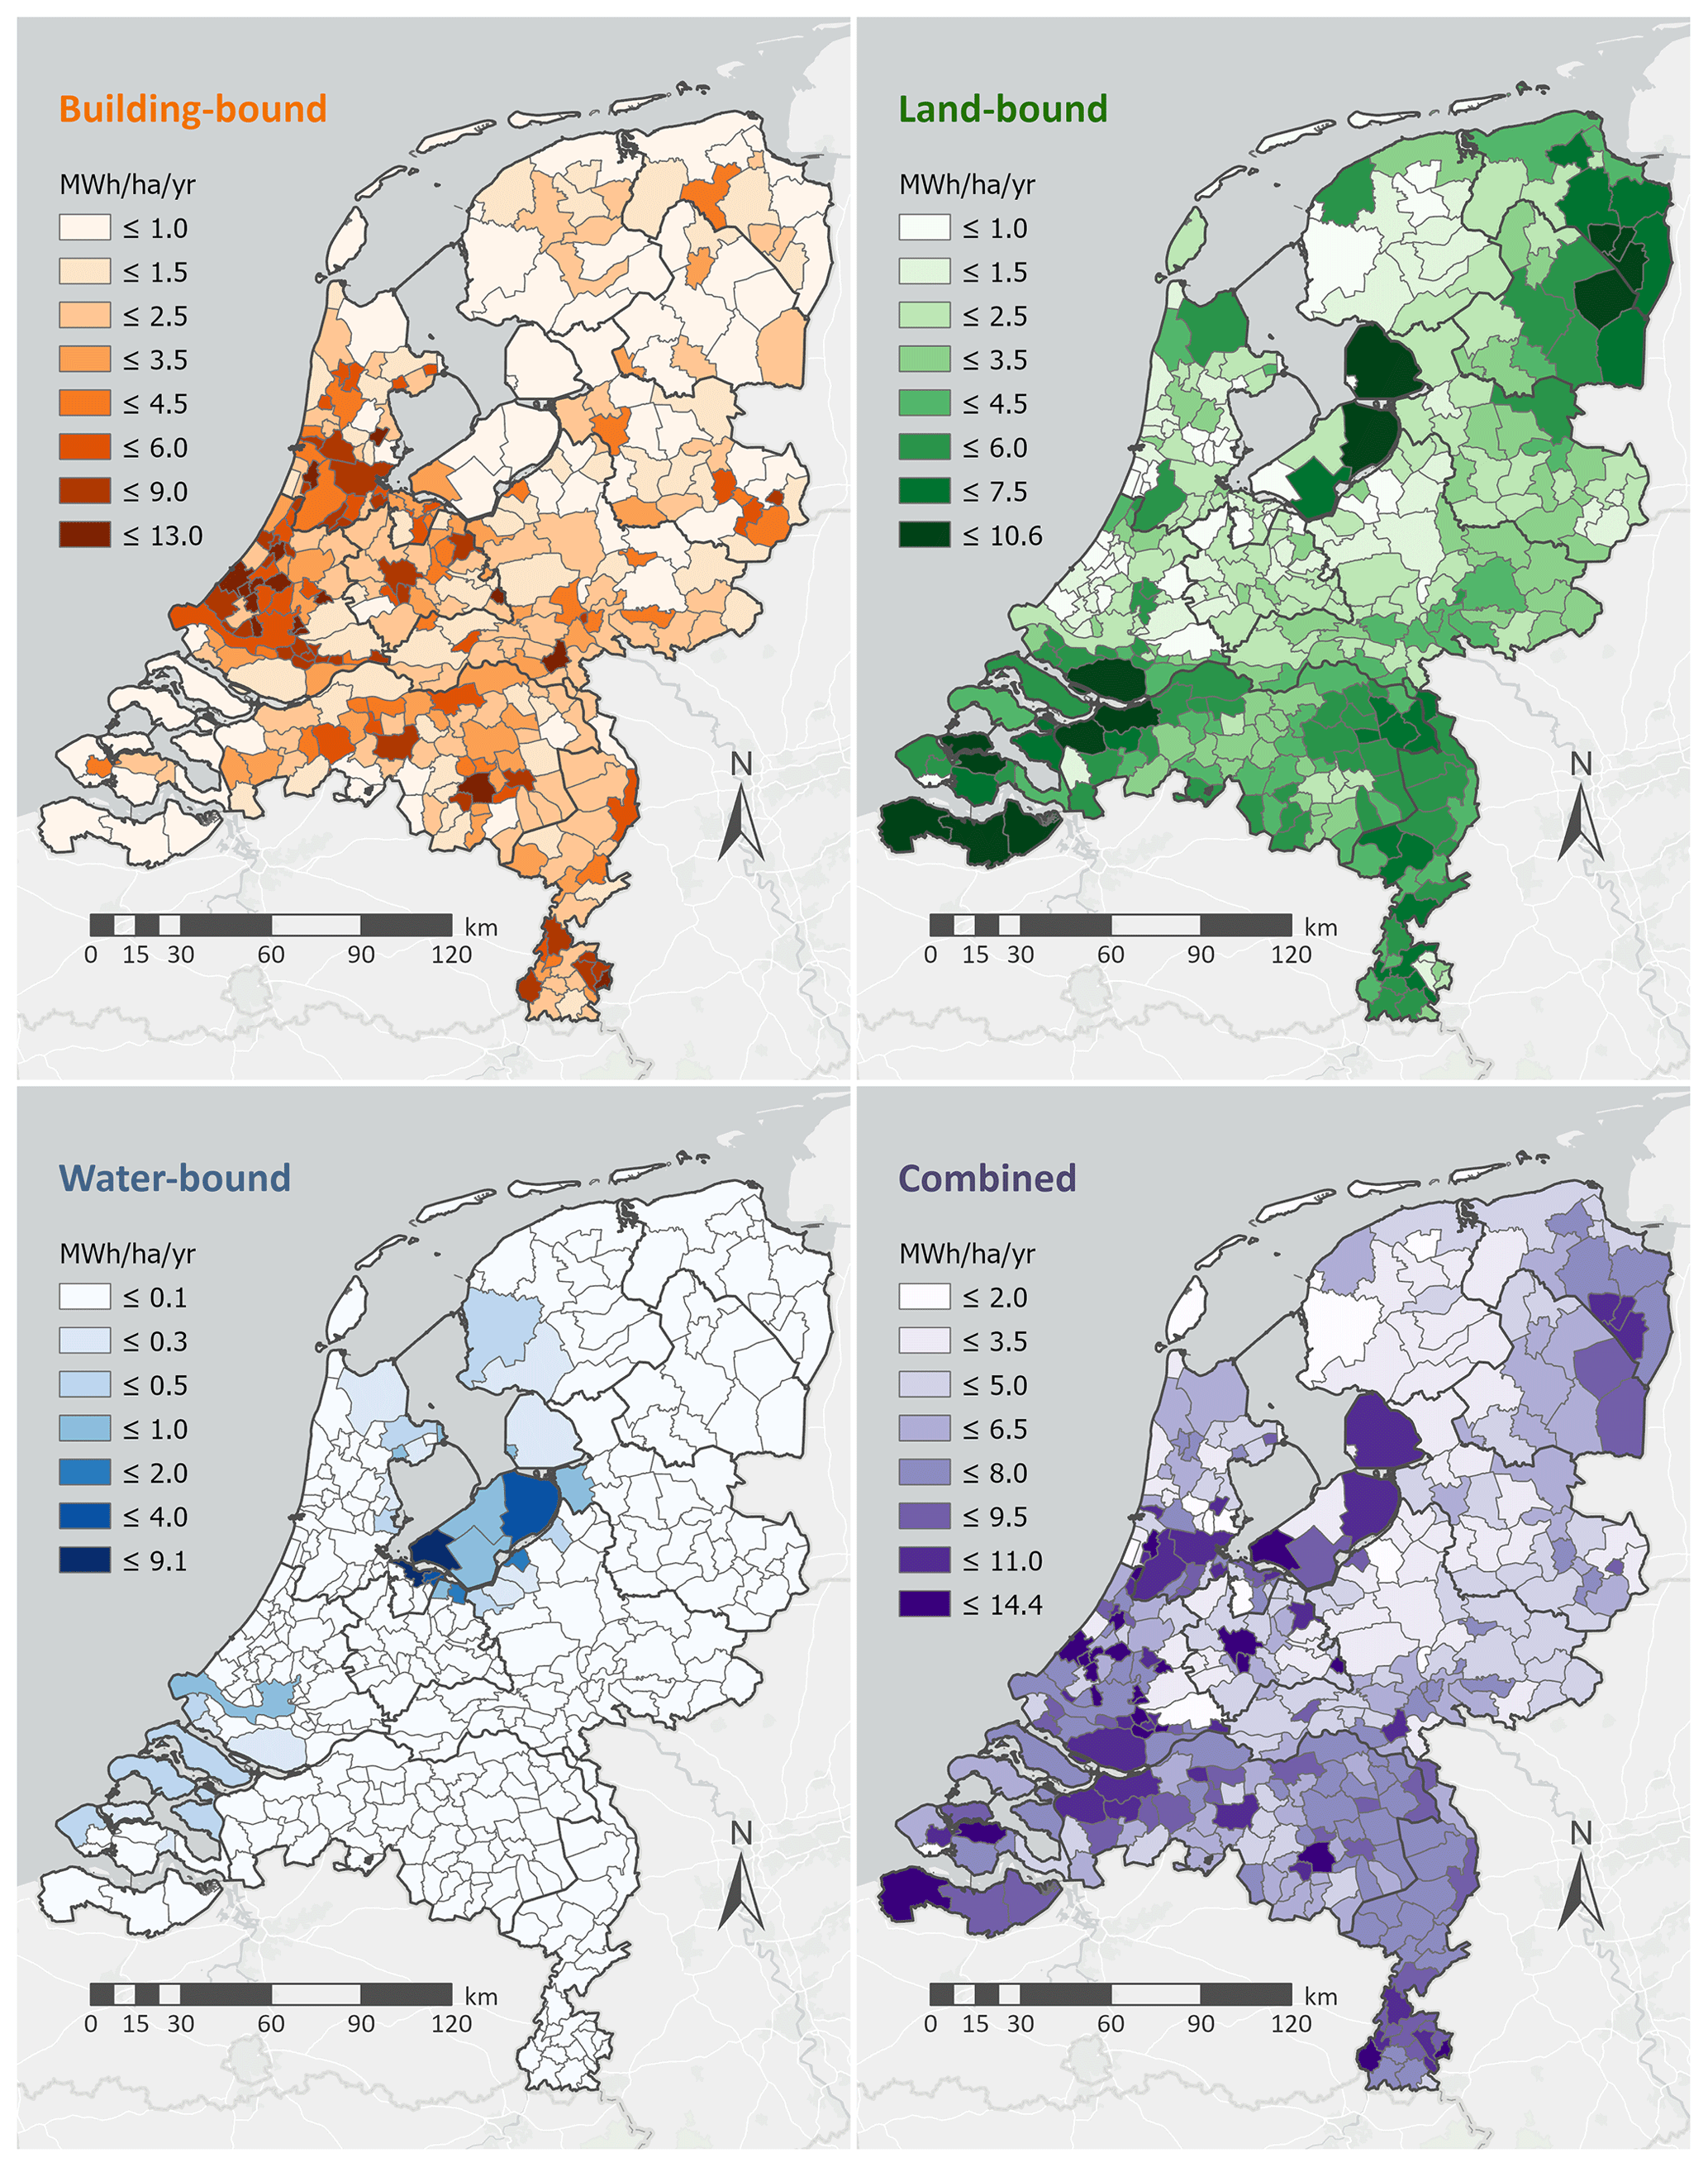
Figure C1Building-bound, land-bound, water-bound and combined PV generation densities per municipality, for the 2030 Climate Agreement scenario. Basemap service layer credits: Esri, DeLorme, HERE, MapmyIndia.
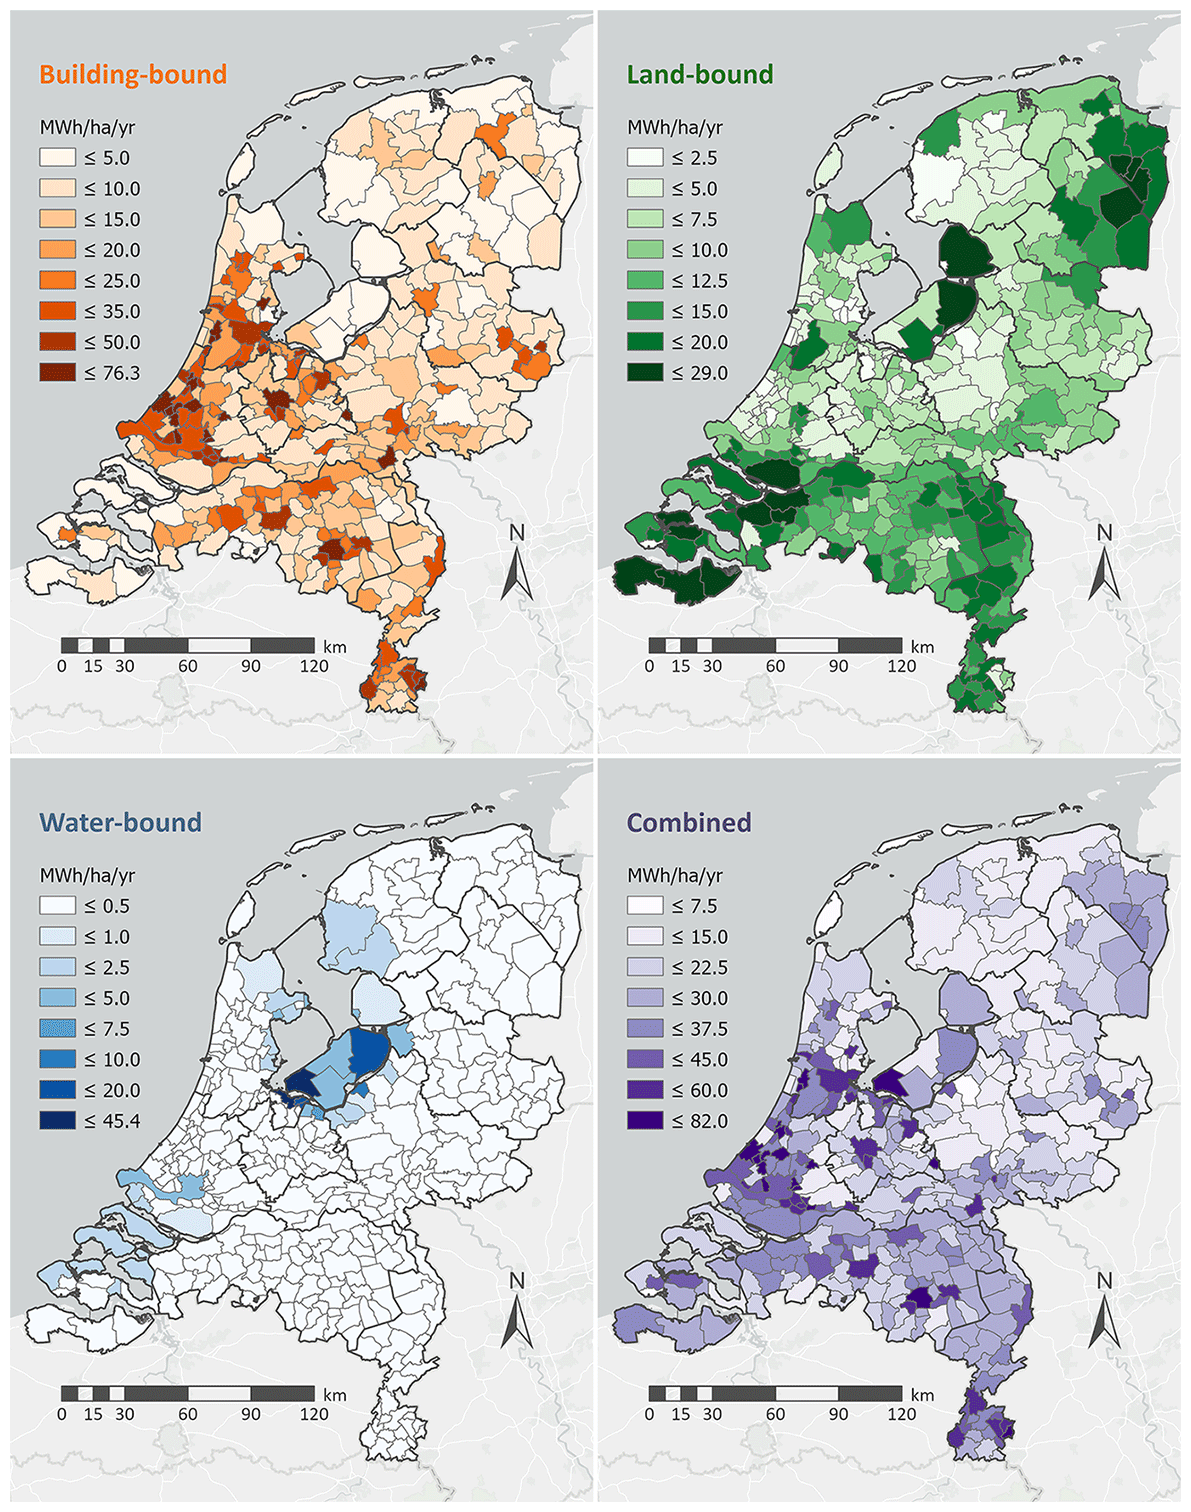
Figure C2Building-bound, land-bound, water-bound and combined PV generation densities per municipality, for the 2050 National Steering scenario. Basemap service layer credits: Esri, DeLorme, HERE, MapmyIndia.
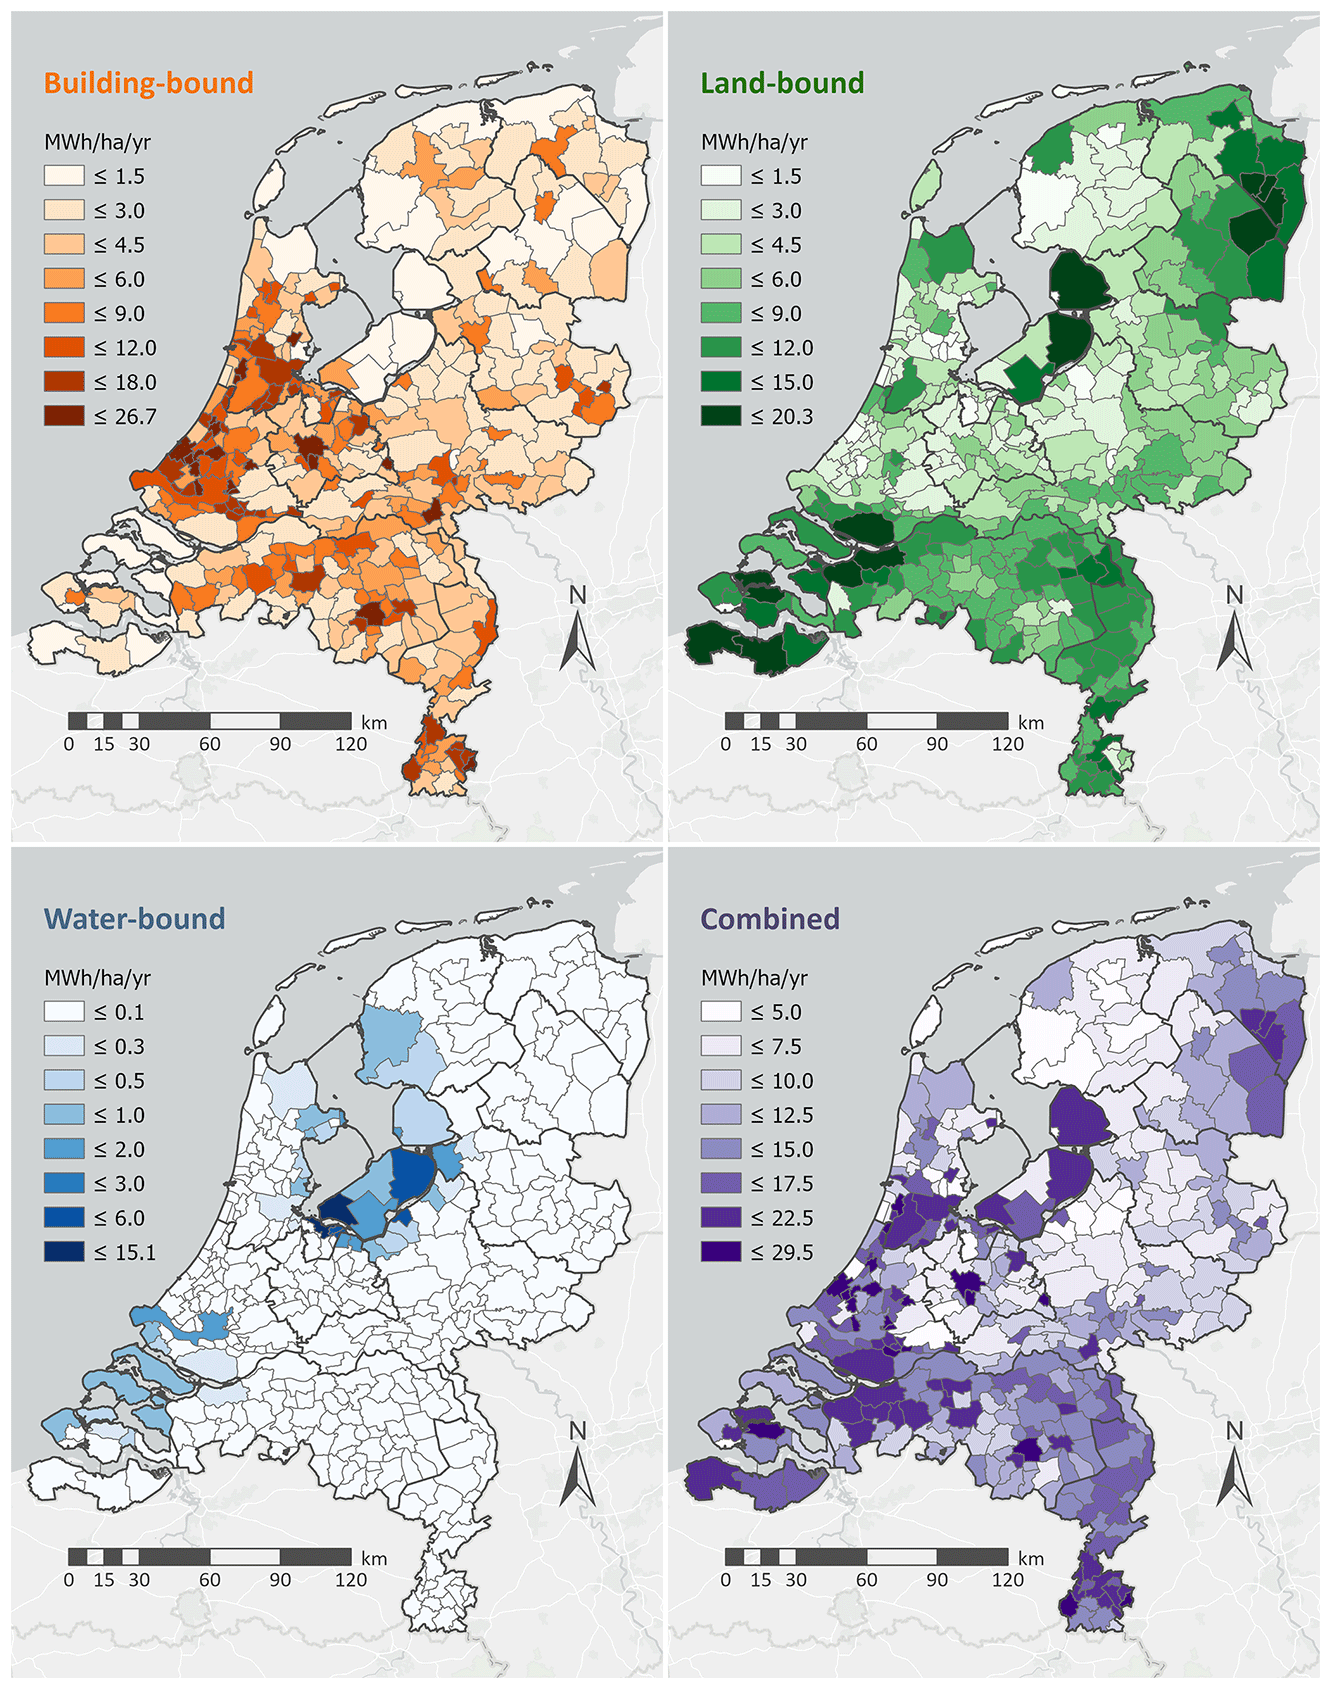
Figure C3Building-bound, land-bound, water-bound and combined PV generation densities per municipality, for the 2050 International Steering scenario. Basemap service layer credits: Esri, DeLorme, HERE, MapmyIndia.
| ABH | Average Building Height |
| AHN | Actueel Hoogte Bestand Nederland |
| ASM2 | Advanced Scenario Management 2 |
| BAG | Basisregistratie Adressen en Gebouwen |
| CBS | Statistics Netherlands |
| BHI | Beam Horizontal Irradiation |
| BHSD | Building Height Standard Deviation |
| DEM | Digital Elevation Model |
| DHI | Diffuse Horizontal Irradiation |
| GHG | GreenHouse Gas |
| GHI | Global Horizontal Irradiation |
| GTI | Global Tilted Irradiation |
| MBD | Mean Bias Deviation |
| POA | Plane Of Array |
| PV | Photovoltaic |
| PR | Performance Ratio |
| RMSD | Root Mean Square Deviation |
| SDE | Stimulation of Sustainable Energy Production |
| SEA | Solar Elevation Angle |
| SEM | Solar Electricity Module |
Code and data availability. Please contact the corresponding author for information on data and code availability.
NN: Conceptualization, Methodology and investigation, Writing – Original draft preparation, Visualization. MP: Methodology and investigation. CL: Methodology and investigation. AB: Methodology and investigation. AvdN: Methodology and investigation. SL: Methodology and investigation, Writing – Review and editing. AM: Conceptualization, Writing – Review and editing. WvS: Conceptualization, Methodology and investigation, writing – Review and editing.
The contact author has declared that none of the authors has any competing interests.
This article is part of the special issue “European Geosciences Union General Assembly 2022, EGU Division Energy, Resources & Environment (ERE)”. It is a result of the EGU General Assembly 2022, Vienna, Austria, 23–27 May 2022.
Publisher’s note: Copernicus Publications remains neutral with regard to jurisdictional claims in published maps and institutional affiliations.
The authors would like to thank the Ministry of Economic Affairs and Climate for the financial support of this work.
This research has been supported by the Rijksdienst voor Ondernemend Nederland (grant no. TEUE116903).
This paper was edited by Gregor Giebel and reviewed by two anonymous referees.
AHN: Actueel Hoogtebestand Nederland, https://www.ahn.nl/ (last access: 30 June 2023), 2018. a
Bouloumpasis, I., Steen, D., and Tuan, L. A.: Congestion Management using Local Flexibility Markets: Recent Development and Challenges, in: Proceedings of 2019 IEEE PES Innovative Smart Grid Technologies Europe, ISGT-Europe 2019, Bucharest, Romania, 29 September 2019–2 October 2019, IEEE, 1–5, https://doi.org/10.1109/ISGTEurope.2019.8905489, 2019. a
BP: Statistical review of world Energy 2021, Tech. rep., 70 pp., https://www.bp.com/content/dam/bp/business-sites/en/global/corporate/pdfs/energy-economics/statistical-review/bp-stats-review-2021-full-report.pdf (last access: 30 June 2023), 2021. a
CBS: Wijk- en buurtkaart 2017, CBS [data set], https://www.cbs.nl/nl-nl/dossier/nederland-regionaal/geografische-data/wijk-en-buurtkaart-2017 (last access: 30 June 2023), 2017. a, b
CBS: Zonnestroom: vermogen bedrijven en woningen, regio (indeling 2019), CBS [data set], https://opendata.cbs.nl/statline/#/CBS/nl/dataset/84783NED/table?ts=1688109394064 (last access: 30 June 2023), 2018. a, b
CBS: Zonnestroom; vermogen zonnepanelen woningen, wijken en buurten, CBS [data set], https://opendata.cbs.nl/statline/#/CBS/nl/dataset/85447NED/table?ts=1688108818772 (last access: 30 June 2023), 2020. a, b
Center for Climate and Energy Solutions: Outcomes of the U.N. Climate Change Conference in Paris, Tech. rep., 6 pp., Center for Climate and Energy Solutions, https://www.c2es.org/wp-content/uploads/2019/12/cop-25-madrid-summary-1.pdf (last access: 30 June 2023), 2015. a
Costa-Campi, M. T., Davi-Arderius, D., and Trujillo-Baute, E.: Analysing electricity flows and congestions: Looking at locational patterns, Energ. Policy, 156, 112351, https://doi.org/10.1016/j.enpol.2021.112351, 2021. a
den Ouden, B., Kerkhoven, J., Warnaars, J., Terwel, R., Coenen, M., Verboon, T., Tiihonen, T., and Koot, A.: Klimaatneutrale energiescenario's 2050: Scenariostudie ten behoeve van de integrale infrastructuurverkenning 2030-2050, Tech. rep. no. 61689, 146 pp., https://www.rijksoverheid.nl/documenten/rapporten/2020/03/31/klimaatneutrale-energiescenarios-2050 (last access: 30 June 2023), 2020. a, b, c, d
Dervishi, S. and Mahdavi, A.: Computing diffuse fraction of global horizontal solar radiation: A model comparison, Sol. Energy, 86, 1796–1802, https://doi.org/10.1016/j.solener.2012.03.008, 2012. a
Di Grazia, S. and Tina, G. M.: Optimal site selection for floating photovoltaic systems based on Geographic Information Systems (GIS) and Multi-Criteria Decision Analysis (MCDA): a case study, International Journal of Sustainable Energy, online first, https://doi.org/10.1080/14786451.2023.2167999, 2023. a
Erbs, D. G., Klein, S. A., and Duffie, J. A.: Estimation of the diffuse radiation fraction for hourly, daily and monthly-average global radiation, Sol. Energy, 28, 293–302, https://doi.org/10.1016/0038-092X(82)90302-4, 1982. a
Folkerts, W., van Sark, W., de Keizer, C., van Hooff, W., and van den Donker, M.: Roadmap PV Systemen en Toepassingen, Tech. rep., 46 pp., https://www.uu.nl/sites/default/files/roadmap-pv-systemen-en-toepassingen-final.pdf (last access: 30 June 2023), 2017. a, b, c
Geodan: ASM2 Energy Transition, https://pico.geodan.nl/asm2/#/scenario (last access: 30 June 2023), 2021a a
Geodan: ASM2 Energy Transition Viewer, https://pico.geodan.nl/asm2/#/viewer (last access: 30 June 2023), 2021b. a
Gils, H. C., Pregger, T., Flachsbarth, F., Jentsch, M., and Dierstein, C.: Comparison of spatially and temporally resolved energy system models with a focus on Germany's future power supply, Appl. Energ., 255, 113889, https://doi.org/10.1016/j.apenergy.2019.113889, 2019. a
IEA: World Energy Outlook 2020, Tech. rep., 464 pp., IEA, https://www.oecd-ilibrary.org/energy/world-energy-outlook-2020_557a761b-en (last access: 30 June 2023), 2020. a
Ineichen, P.: Global irradiance on tilted and oriented planes: model validations, University of Geneva, https://archive-ouverte.unige.ch/unige:23519 (last access: 30 June 2023), 2011. a
Kadaster: Basisregistratie Adressen en Gebouwen (BAG), PDOK [data set], https://www.pdok.nl/introductie/-/article/basisregistratie-adressen-en-gebouwen-ba-1 (last access: 30 June 2023), 2017a. a, b
Kadaster: Basisregistratie Grootschalige Topografie (BGT), PDOK [data set], https://www.pdok.nl/introductie/-/article/basisregistratie-grootschalige-topografie-bgt- (last access: 30 June 2023), 2017b. a, b, c
Kalavasta: Uitwerking van een 2030 scenario op basis van het ontwerp Klimaatakkoord en vast en voorgenomen beleid, Tech. rep., 15 pp., https://kalavasta.com/assets/reports/Kalavasta2030KEAenergiesysteemNL.pdf (last access: 30 June 2023), 2019. a, b
Kausika, B. B., Dolla, O., and Van Sark, W. G.: Assessment of policy based residential solar PV potential using GIS-based multicriteria decision analysis: A case study of Apeldoorn, The Netherlands, Enrgy Proced., 134, 110–120, https://doi.org/10.1016/J.EGYPRO.2017.09.544, 2017. a
KNMI: Uurgegevens van het weer in Nederland, KNMI [data set], https://www.knmi.nl/nederland-nu/klimatologie/uurgegevens (last access: 30 June 2023), 2018. a
KNMI: MSG-CPP: clouds, radiation and precipitation from Meteosat, https://msgcpp.knmi.nl/ (last access: 30 June 2023), 2022. a
KNMI: Klimaatviewer: gemiddelde globale straling, https://www.knmi.nl/klimaat-viewer/kaarten/zon/gemiddelde-globale-straling/jaar/Periode_1991-2020 (last access: 30 June 2023), 2023. a, b
Kockel, C., Nolting, L., Priesmann, J., and Praktiknjo, A.: Does renewable electricity supply match with energy demand? – A spatio-temporal analysis for the German case, Appl. Energ., 308, 118226, https://doi.org/10.1016/j.apenergy.2021.118226, 2022. a
Lee, M., Hong, T., Jeong, K., and Kim, J.: A bottom-up approach for estimating the economic potential of the rooftop solar photovoltaic system considering the spatial and temporal diversity, Appl. Energ., 232, 640–656, https://doi.org/10.1016/j.apenergy.2018.09.176, 2018. a
Litjens, G. B., Worrell, E., and van Sark, W. G.: Influence of demand patterns on the optimal orientation of photovoltaic systems, Sol. Energy, 155, 1002–1014, https://doi.org/10.1016/j.solener.2017.07.006, 2017. a
Mensour, O. N., El Ghazzani, B., Hlimi, B., and Ihlal, A.: A geographical information system-based multi-criteria method for the evaluation of solar farms locations: A case study in Souss-Massa area, southern Morocco, Energy, 182, 900–919, https://doi.org/10.1016/j.energy.2019.06.063, 2019. a
Moraitis, P., Kausika, B. B., Nortier, N., and Van Sark, W.: Urban environment and solar PV performance: the case of the Netherlands, Energies, 11, 1333, https://doi.org/10.3390/en11061333, 2018. a, b, c
Muñoz-Sabater, J., Dutra, E., Agustí-Panareda, A., Albergel, C., Arduini, G., Balsamo, G., Boussetta, S., Choulga, M., Harrigan, S., Hersbach, H., Martens, B., Miralles, D. G., Piles, M., Rodríguez-Fernández, N. J., Zsoter, E., Buontempo, C., and Thépaut, J.-N.: ERA5-Land: a state-of-the-art global reanalysis dataset for land applications, Earth Syst. Sci. Data, 13, 4349–4383, https://doi.org/10.5194/essd-13-4349-2021, 2021. a
Netbeheer Nederland: Aanbieding integrale infrastructuurverkenning 2030-2050, https://www.rijksoverheid.nl/documenten/brieven/2020/04/02/aanbieding-integrale-infrastructuurverkenning-2030-2050 (last access: 30 June 2023), 2020. a, b
Nortier, N., Löwenthal, K., Luxembourg, S., van der Neut, A., Mewe, A., and van Sark, W.: Spatially resolved generation profiles for onshore and offshore wind turbines: A case study of four Dutch energy transition scenarios, Renewable and Sustainable Energy Transition, 2, 100037, https://doi.org/10.1016/J.RSET.2022.100037, 2022. a
Perez, R., Ineichen, P., Seals, R., Michalsky, J., and Stewart, R.: Modeling daylight availability and irradiance components from direct and global irradiance, Sol. Energy, 44, 271–289, https://doi.org/10.1016/0038-092X(90)90055-H, 1990. a
Quintel Intelligence: Energy transition model, https://energytransitionmodel.com/ (last access: 30 June 2023), 2022. a
Ramirez Camargo, L. and Schmidt, J.: Simulation of multi-annual time series of solar photovoltaic power: Is the ERA5-land reanalysis the next big step?, Sustainable Energy Technologies and Assessments, 42, 100829, https://doi.org/10.1016/J.SETA.2020.100829, 2020. a
Rijksoverheid: Klimaatakkoord, Tech. rep., 239 pp., https://www.klimaatakkoord.nl/binaries/klimaatakkoord/documenten/publicaties/2019/06/28/klimaatakkoord/klimaatakkoord.pdf (last access: 30 June 2023), 2019. a, b, c
Rijkswaterstaat: RWS dijkringlijnen (actueel), Overheid [data set], https://data.overheid.nl/dataset/d1f6d623-d728-4130-a8b2-68793577f795 (last access: 30 June 2023), 2020. a
RVO: Advanced Scenario Management – Phase 2, https://www.rvo.nl/subsidies-regelingen/projecten/advanced-scenario-management-phase-2 (last access: 30 June 2023), 2016. a
RVO: Feiten en cijfers SDE(+)(+), RVO [data set], https://www.rvo.nl/subsidies-financiering/sde/aanvragen/feiten-en-cijfers#projecten-in-beheer (last access: 30 June 2023), 2021. a, b, c
Sijmons, D.: Energie & Ruimte: een nationaal perspectief, Vereniging Deltametropool, Rotterdam, ISBN: 978-90-76630-21-2, 2017. a, b
Staudt, P., Rausch, B., Gärttner, J., and Weinhardt, C.: Predicting transmission line congestion in energy systems with a high share of renewables, 2019 IEEE Milan PowerTech, Milan, Italy, 23–27 June 2019, IEEE, 1–6, https://doi.org/10.1109/PTC.2019.8810527, 2019. a
Tina, G. M., Cazzaniga, R., Rosa-Clot, M., and Rosa-Clot, P.: Geographic and technical floating photovoltaic potential, Therm. Sci., 22, 831–841, https://doi.org/10.2298/tsci170929017t, 2018. a
van der Kam, M. J., Meelen, A. A. H., van Sark, W. G. J. H. M., and Alkemade, F.: Diffusion of solar photovoltaic systems and electric vehicles among Dutch consumers: Implications for the energy transition, Energy Research & Social Science, 46, 68–85, https://doi.org/10.1016/j.erss.2018.06.003, 2018. a
van Westering, W. and Hellendoorn, H.: Low voltage power grid congestion reduction using a community battery: Design principles, control and experimental validation, Int. J. Elec. Power, 114, 105349, https://doi.org/10.1016/j.ijepes.2019.06.007, 2020. a
Yang, Y., Campana, P. E., Stridh, B., and Yan, J.: Potential analysis of roof-mounted solar photovoltaics in Sweden, Appl. Energ., 279, 115786, https://doi.org/10.1016/j.apenergy.2020.115786, 2020. a
Zhang, Y., Ren, J., Pu, Y., and Wang, P.: Solar energy potential assessment: A framework to integrate geographic, technological, and economic indices for a potential analysis, Renew. Energ., 149, 577–586, https://doi.org/10.1016/j.renene.2019.12.071, 2020. a
- Abstract
- Introduction
- Methodology
- Results
- Discussion
- Conclusions
- Appendix A: Identification of roof surfaces
- Appendix B: Dutch provinces and municipalities
- Appendix C: Additional electricity generation density maps
- Appendix D: Nomenclature
- Code and data availability
- Author contributions
- Competing interests
- Special issue statement
- Disclaimer
- Acknowledgements
- Financial support
- Review statement
- References