 | 14 Feb 2023
Assessment of frost damage risk in a historic masonry wall due to climate change
Guilherme Barreto Arez Coelho
Dimitrios Kraniotis
Historic masonry buildings are an integral part of human cultural heritage, and they need to be preserved for future generations. Brick is susceptible to frost damage which is common in regions with cold and humid climates. The frost damage on the masonry walls is accumulated over the years becoming more and more critical for the integrity of the historic buildings and it is also affected by climate change (CC).
In the current research, the focus was placed on a coastal region in southern Norway with a significant number of historic masonry buildings. The frost damage risk of the masonry walls was assessed by using data from a climate reanalysis for the present conditions and from a climate model under past, present, and future conditions. Two climate-based (CB) indices accounting for the air temperature and one material response-based (MRB) index considering the temperature and moisture content inside a simulated masonry wall were used for the frost damage risk assessment. The inputs for the MRB index were calculated by heat, air, and moisture (HAM) transfer simulations. Within the HAM simulations, the indoor climate was in one case representative of an unconditioned building with air leakages and many openings, while in the second case it was representative of a small, conditioned room.
The overall impact of CC was a decrease in the frost damage risk of the masonry walls. However, an increased frost damage risk was observed from the present to the future conditions according to the MRB index for the walls of small, conditioned rooms with higher driving rain load and lower solar radiation gains. The (i) number of freeze-thaw events, (ii) periods during which freeze-thaw events occur, and (iii) CC-related trends varied based on the considered index with the most explicit risk assessment being the MRB one. Moreover, the freeze-thaw events experienced by the masonry walls of unconditioned, leaky buildings were 20 times more than the ones for the small, conditioned rooms. Significant differences were observed between the results from the climate model and the climate reanalysis which were mainly linked to the underestimation of the air temperature and the overestimation of the precipitation by the climate model. The outputs of the MRB index were translated into certain damage categories while suggestions on improving the limitations of the current research were made.
- Article
(4077 KB) - Full-text XML
- BibTeX
- EndNote


Frost shattering or brick breakdown by freezing of water present in pore spaces and joints has been considered the prevailing weathering process in cold regions (French, 2017; Washburn, 1979; Matsuoka, 1990). Frost damage of masonry is attributed to a number of mechanisms (Mensinga et al., 2010) with the prime one being the 9 % volumetric expansion that accompanies the phase change of water to ice (Ollier, 1969; French, 2017; Matsuoka, 1990; Lisø et al., 2007). This theory was also supported by Davidson and Nye (1985) who found that the ice in a 1 mm-wide slot made in lucite produced pressures up to 11 bar by volumetric expansion. Since this value is greater than the tensile strength of some porous rocks, the volumetric expansion causes frost shattering.
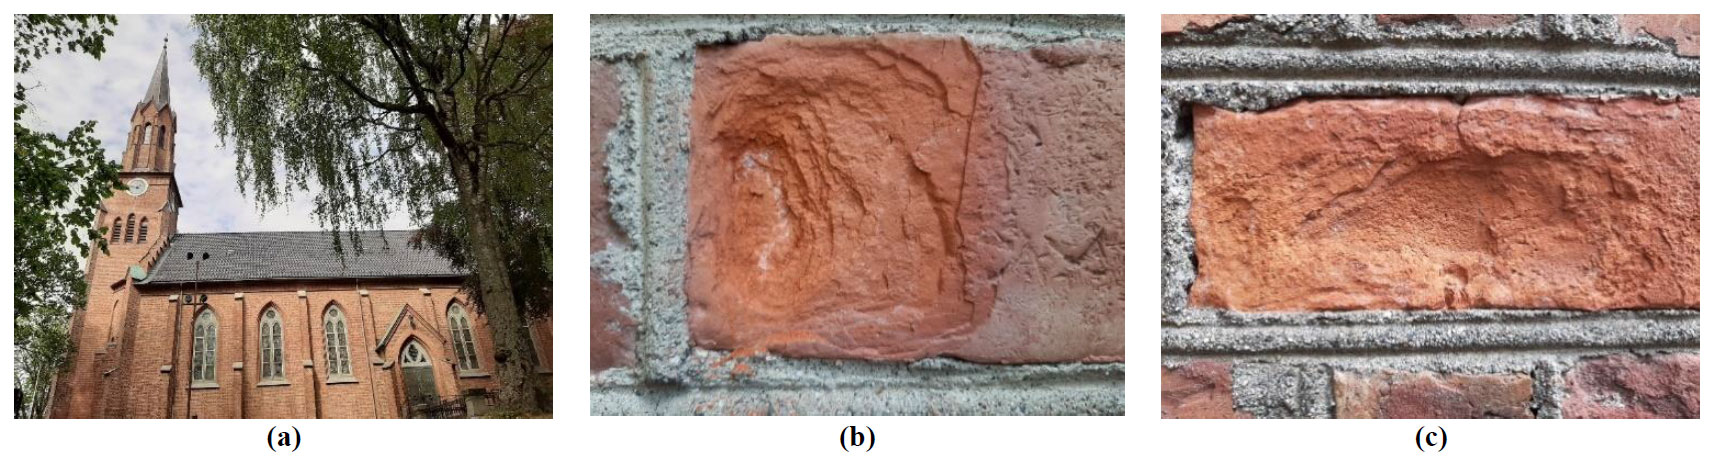
Figure 1The (a) Tønsberg cathedral and (b), (c) degraded bricks at its southeast-oriented façade.
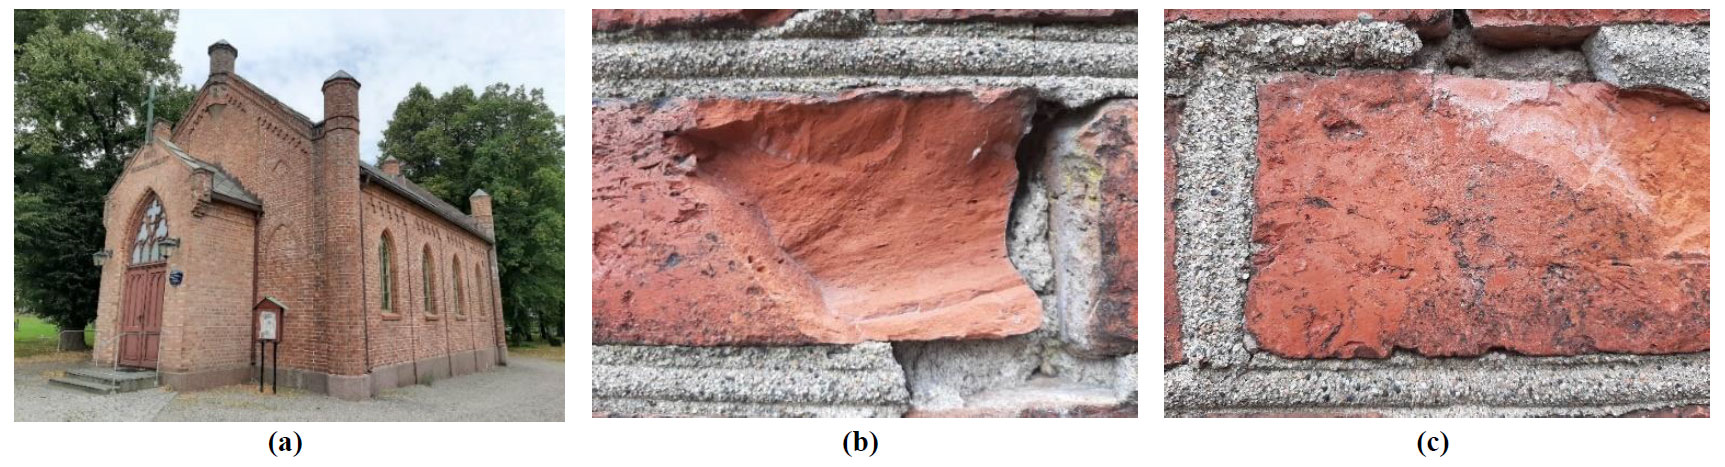
The city of Tønsberg, located on the south coast of Norway, has numerous masonry buildings of historical significance. Some examples are depicted in Figs. 1a, 2a, 3a, and 4a. Tønsberg has a cold season that lasts from November until April, during which the precipitation and the air relative humidity remain at high levels. In many cases, the wall surfaces of the historic masonry buildings flake off and crumble away due to frost damage (Figs. 1b, c, 2b, c, 3b c, 4b, c). Thus, it is important to investigate, understand, and strategize against the degradation caused by this deterioration mechanism. The assessment of past, present, and potential future conditions is also important.
Existing literature suggests a decreasing trend of the frost damage risk in southern Norway due to climate change (Sabbioni et all., 2010; Kaslegard, 2011; Leissner et al., 2015; Loli and Bertolin, 2018). However, the severity of the calculated degradation may vary significantly based on the modelling approach that is used for the frost damage risk assessment (Van Aarle et al., 2015; Sahyoun, et al., 2019; Vandemeulebroucke et al., 2019, 2021a, b). A well-accepted method to assess the frost damage risk of masonry buildings is by counting the freeze-thaw cycles that their building materials experience. The freeze-thaw events can be calculated by considering climate-based indices (Viles, 2002; Grossi et al., 2007; Brimblecombe, 2010; Sabbioni et al., 2010; Leissner et al., 2015; Loli and Bertolin, 2018) or material response-based indices (Sedlbauer and Kunzel, 2000; Straube and Burnett, 2005; Straube and Schumacher, 2006; Mantha and Arena, 2012; De Rose et al., 2014; Van Aarle et al., 2015; Vandemeulebroucke et al., 2019, 2020, 2021a, b; Zhou et al., 2020; Hao et al., 2020; Sahyoun et al., 2020).
A widely used climate index for the frost damage risk assessment accounts for the number of incidents within which the air temperature drops below 0 ∘C (Grossi et al., 2007; Sabbioni et al., 2010). According to this index, it is assumed that the transition of water to ice occurs when the air temperature drops below 0 ∘C. In addition, it is assumed that the ice melts above 0 ∘C. Thus, by measuring the 0 ∘C crossings it is possible to assess the freeze-thaw events experienced by the material of interest (Grossi et al., 2007; Sabbioni et al., 2010).
In reality, the water inside the material's pores does not freeze sharply below 0 ∘C but freezes at lower temperatures. That is mainly because of the soluble salts inside the water, and it is also dependent on the pore size of the material (Grossi et al., 2007; Sabbioni et al., 2010). The frozen water does not melt at temperatures sharply higher than 0 ∘C but it thaws at slightly higher temperatures. In order to take into account these phenomena, Grossi et al. (2007), Brimblecombe et al. (2010), Sabbioni et al. (2010), Bertolin and Camuffo (2014), Loli and Bertolin (2018) considered the −3 ∘C as the freezing point and 1 ∘C as the thawing point of water. Moreover, Brimblecombe and Camuffo (2003), Camuffo (2014), and Al-Omari et al. (2014) used the Kelvin equation to calculate the freezing point depression in the smaller pores of the material.
A climate-based index was used by Nelson and Outcalt (1987) as an indicator of the severity of the frost damage on the material of interest. Specifically, they calculated the number of degree days below 0 ∘C. In the same direction, Grossi et al. (2007) and Sabbioni et al. (2010) calculated the degree days below −10 ∘C which they mentioned as the frost intensity index. Grossi et al. (2007) and Sabbioni et al. (2010) also determined the cycle-intensity index which is equal to the frost intensity multiplied by the square root of the yearly number of freeze-thaw cycles. Moreover, Camuffo (2014), Leissner et al. (2015), Loli and Bertolin (2018) used the frosting-time index, which takes into account the time in hours during the year when the air temperature is below 0 ∘C. Last but not least, Grossi et al. (2007) and Sabbioni et al. (2010) took into account the wet-frost index, which is the number of days with precipitation more than 2 mm followed immediately by days with mean temperature below −1 ∘C.
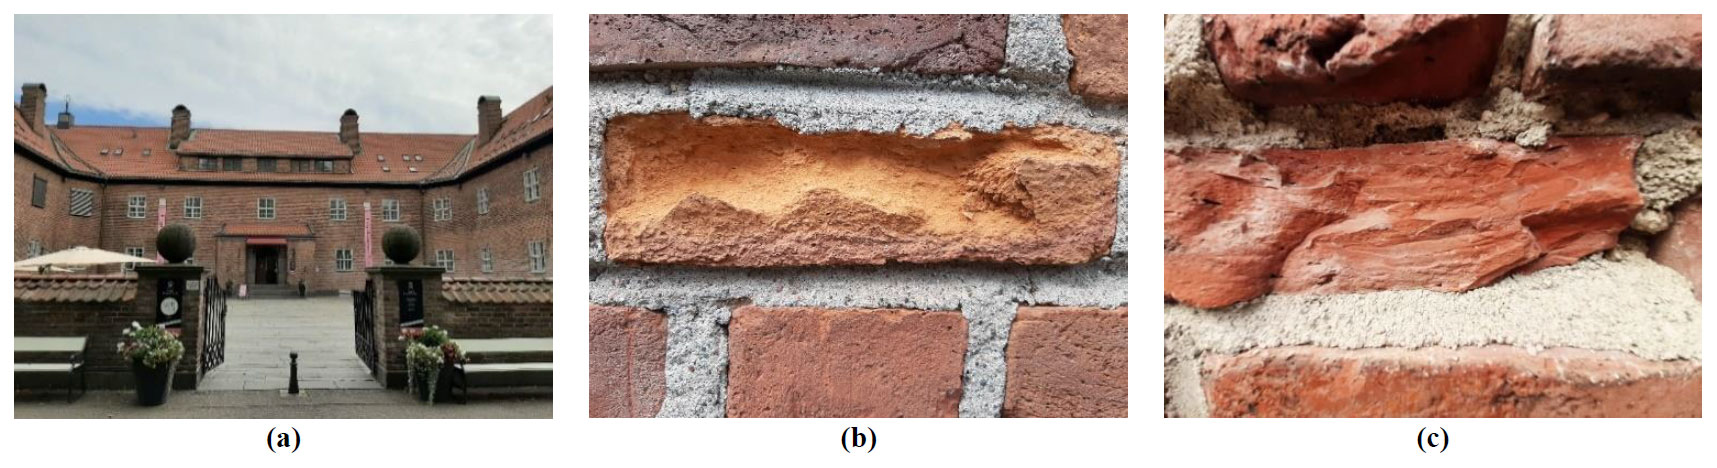
Figure 2The (a) Haugar Art Museum and degraded bricks on its masonry fence with (b) southeast and (c) southwest orientation.
The outputs of the climate-based indices can be used as an indicator of the frost damage risk of the material of interest. However, there are no certain threshold values above which the building material is considered to be damaged or has a certain degree of degradation. Thus, the climate-based indices can only be used for comparative analysis among data from different periods, areas, and data sources.
A more computationally demanding process to assess the frost damage risk of the masonry walls is to use material response-based indices. According to this approach, certain climate parameters and material properties serve as inputs in hygrothermal simulations (Delgado et al., 2010). The transient hygrothermal conditions, i.e., the temperature, relative humidity, and moisture content of the material serve as inputs in the material response-based indices to assess the frost damage risk of the material of interest. Sedlbauer and Kunzel (2000) and Van Aarle et al. (2015) used 0 ∘C as the critical temperature for both freezing and thawing. Straube and Schumacher (2006), Mantha and Arena (2012), Ueno et al. (2013a, b, c), De Rose et al. (2014), Van Straaten et al. (2016) and Sahyoun et al. (2020) took into account the −5 ∘C as the critical temperature for freezing and 0 ∘C for thawing. Zhou et al. (2017), Vandemeulebroucke et al. (2019, 2020, 2021a, b), Zhou et al. (2020) calculated the freezing temperature at each point in the porous material by using the Kelvin equation. In this way, the freezing point depression due to the material's pore size was taken into account (Straube and Burnett, 2005).
Moreover, it is clear that the material needs to be wet enough in order to get degraded after a freezing event. The material wetness is widely expressed by the degree of saturation (S), which is defined as the ratio of the moisture content over the moisture content when all accessible pores are filled with water, i.e., vacuum saturation (Fagerlund, 1977a, b). Fagerlund (1977a, b) showed that below a critical degree of saturation (Scrit) a porous material can be cycled thousands of times above and below freezing without any measurable damage. On the contrary, above the Scrit, damage is measurable after only a few cycles (Fagerlund, 1977a, b; Mensinga et al., 2010; Straube et al., 2012; Ueno et al., 2013a, b, c; De Rose et al., 2014; Van Straaten et al., 2016). The lowest value of the Scrit defined experimentally for a brick is 0.25 (Mensinga et al., 2010) and it was adopted by a lot of studies that included numerical simulations, such as Zhou et al. (2017), Vandemeulebroucke et al. (2019, 2020, 2021a, b), Sahyoun et al. (2020), Zhou et al. (2020). Other studies (Sedlbauer and Kunzel, 2000; Straube and Schumacher, 2006; Mantha and Arena, 2012; Ueno et al., 2013a, b, c; WTA, 2014; De Rose et al., 2014; Van Aarle et al., 2015; Van Straaten et al., 2016; Said et al., 2020) suggested higher values for the Scrit, ranging from 0.3 to 0.9.
One main benefit of the material response-based indices that take into account Scrit is that the outputs of the simulations can be combined with the outputs of experiments (Germinario et al., 2022; Salvini et al., 2022) within which the number of the freeze-thaw cycles is linked to a certain degree of degradation. Thus, by taking into account the cumulative freeze-thaw events experienced by the material of interest it is possible to estimate the point at which a certain degradation level will be reached.
A slightly different approach from the one that takes into account the Scrit was implemented by Kočí et al. (2014, 2017), Sahyoun et al. (2019). Kočí et al. (2017) suggested a portfolio of four material response-based damage functions to examine the frost damage risk and its severity, given the hourly temperature and moisture content at a control point 5 mm under the exterior side of the wall. The first index was the Modified Winter Index (MWI), which determines the cumulative material degradation when the moisture content is above the prescribed critical level and simultaneously the temperature drops below its critical value. The MWI is an indicator of the severity of the frost damage risk. The second was the Time of Frost (TOF), which accounts for the number of hours during the year when the conditions in the investigated point of the wall are favourable for ice formation, given the critical values for temperature and moisture content. The third was the Amount-of-Frozen-Water (AFW), which is the sum of the moisture content during freezing conditions. The AFW serves well for comparative analysis. The fourth was the Indicative Freeze/Thaw Cycles (IFTC) which is similar to the MWI with the addition that freezing should be at least 2 h while two consecutive freeze-thaw cycles must be separated by at least 2 h of thawing period. The indices were calculated for a critical moisture content equal to the maximum hygroscopic moisture content of the material and a critical temperature calculated by the Gibbs-Thomson equation.
In the current research, two climate-based indices, accounting for the outdoor air temperature (Grossi et al., 2007; Sabbioni et al., 2010), and one material response-based index, accounting for the temperature and moisture content of a 5 mm layer in the exterior side of a simulated historic masonry wall (Sedlbauer and Kunzel, 2000; Vandemeule-broucke et al., 2019), were utilized. Past, present, and potential future conditions were assessed by using data from a climate model derived from the EURO-CORDEX project data archive (Jacob et al., 2014). Data from ERA5 (Hersbach et al., 2020) were used to assess the accuracy of the climate model results. The frost damage risk according to the material response-based index was calculated for eight different orientations, i.e., the cardinal and the intermediate ones, and two different indoor climate cases corresponding to a worst-case and a best-case scenario. According to the worst-case scenario, the indoor temperature and relative humidity were considered equal to the outdoor ones, while in the best-case scenario, the indoor temperature and relative humidity were calculated according to EN 15026.
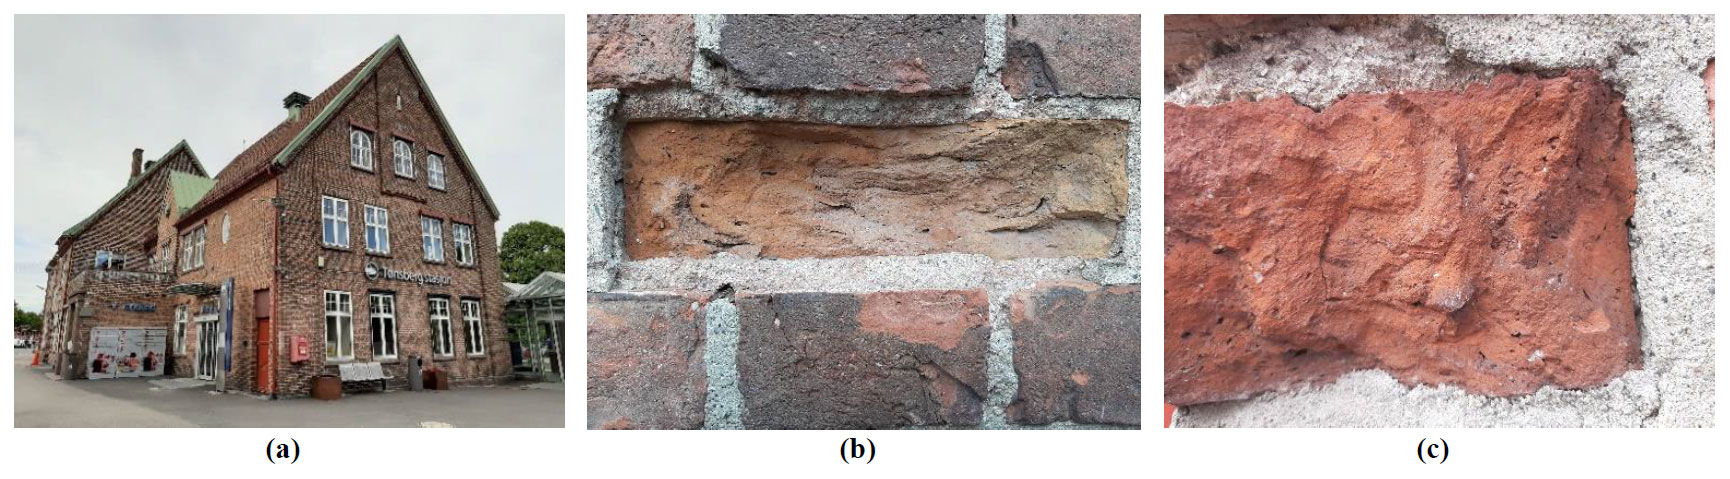
Figure 4The (a) Tønsberg train station and degraded bricks at its walls with (b, c) southeast orientation.
2.1 Outdoor climate data
The current research accounts for climate change by using data produced with the latest hydrostatic version of the REgional MOdel REMO, version REMO2015 (Jacob and Podzun, 1997), driven by the low-resolution version of the Max Planck-Institute Earth System Model, MPI-ESM-LR (Giorgetta et al., 2013). The model data were acquired from the EURO-CORDEX project (Jacob et al., 2014) data archive. They were synthesized into three 10-year periods, 1960–1969 referred to as past, 2010–2019 referred to as present and 2060–2069 referred to as future conditions. The Representative Concentration Pathway (RCP) 8.5 was taken into account for the present and future conditions. The RCP 8.5 represents a high-end emission scenario leading to accelerated global warming during the ongoing century (Riahi et al., 2011). The climate model data have a spatial resolution of 0.11∘ and a temporal resolution of 1 h.
In order to assess how much the modelled climate deviates from the actual one, a fourth climate file was prepared to contain data from the fifth-generation European Centre for Medium-Range Weather Forecasts (ECMWF) climate reanalysis, ERA5 (Hersbach, 2020) for the period 2010–2019 (present conditions). Climate reanalyses combine past observations with models to generate consistent time series of multiple climate variables. The spatial and temporal resolution of the ERA5 data is 0.25∘ and 1 h, respectively.
The climate parameters considered in the current research are the following:
-
Air temperature (∘C);
-
Air relative humidity (%);
-
Precipitation (mm);
-
Wind speed (m s−1);
-
Wind direction (∘);
-
Cloud cover (oktas);
-
Atmospheric long-wave counter-radiation incident on a horizontal surface (W m−2);
-
Global short-wave radiation incident on a horizontal surface (W m−2);
-
Diffusive short-wave radiation incident on a horizontal surface (W m−2);
-
Direct short-wave radiation incident on a horizontal surface (W m−2).
Some of the aforementioned parameters were downloaded directly from the respective online archive, while others needed some further processing in order to be calculated. The exact same data were used and described in detail by Choidis et al. (2021) in a study of the impact assessment of climate change on the biological deterioration of two timber historic buildings in Tønsberg.
Moreover, the driving rain and the incident solar radiation on vertical components facing toward the cardinal and intermediate orientations was calculated by using the hygrothermal software Wärme und Feuchte Instationär, WUFI® Pro (Kunzel, 1995; Karagiozis et al., 2001). In more detail, the driving rain was calculated using Eq. (1) (Karagiozis et al., 2001):
Where “Rain” is the normal rain, “Wind Speed” is the component which is orthogonal to the building surface, R1 = 0 for vertical surfaces and R2 = 0.07 s m−1 for low-rise buildings. The values for the coefficients R1 and R2 were determined by Karagiozis et al. (1997) by implementing advanced 3-D computational fluid dynamics simulations of droplet flow.
2.2 Climate-based indices for the assessment of frost damage
Frost damage on bricks is the result of mechanical stresses, mainly attributed to the volumetric expansion during the transformation of water into ice in the material pores (Ollier, 1969; French, 2017; Davidson and Nye, 1985; Matsuoka, 1990, 2001). In the current research, two climate-based indices were used to assess the frost damage risk. The first one is the number of 0 ∘C crossings of the air temperature (Grossi et al., 2007; Sabbioni et al., 2010). The second one is the number of freeze-thaw cycles based on the −3 and 1 ∘C threshold values for freezing and thawing, respectively (Grossi et al., 2007; Sabbioni et al., 2010; Leissner et al., 2015; Loli and Bertolin, 2018). In both cases, hourly values of the air temperature were used for all the examined ten-year periods.
The number of freeze-thaw cycles that occur during the examined periods can be used as an indicator of the frost damage risk. There is not a certain number of freeze-thaw events above which the building material is considered to be degraded. Thus, only a comparative analysis among data from different periods and between the data from the climate model and ERA5 is possible. The higher the number of freeze-thaw events, the greater the frost damage risk.
2.3 Material response-based index for the assessment of frost damage
A more detailed and computationally demanding process to assess the frost damage risk of the masonry walls is to use a material response-based index. In the current study, a commercial heat, air, and moisture (HAM) transport software was used to calculate the temperature and the moisture content of the material of interest, given proper climate data and material properties as inputs. Proper threshold values for the material temperature and moisture content were selected in order to account for the freeze and thaw events.
2.3.1 Hygrothermal simulations
The software WUFI® Pro (Kunzel, 1995; Karagiozis et al., 2001) was used to simulate the hygrothermal performance of the masonry walls. WUFI® Pro is a solver of two coupled heat and moisture transport equations. The software accounts for heat transport via (i) thermal conduction, (ii) enthalpy flow through moisture movement with phase change, (iii) short-wave solar radiation, (iv) night-time long-wave radiation cooling. Moreover, it accounts for vapor transport through (i) vapor diffusion and ii) solution diffusion. Finally, the liquid transport mechanisms included in WUFI® Pro are (i) capillary conduction and (ii) surface diffusion.
The outdoor climate parameters considered within the hygrothermal simulations are the ones mentioned in Sect. 2.1. For the indoor climate two different cases were examined for each outdoor climate excitation. According to the first one the indoor air temperature and relative humidity were considered equal to the outdoor ones. This worst-case scenario could be representative of a wall that is exposed to the outdoor climate on one side and on the other side, it is shaded (Choidis et al., 2020). It could also represent an unconditioned building with air leakages, and many openings. In the second case, the indoor climate conditions were computed based on the outdoor air temperature, as prescribed in EN 15026. The indoor temperature ranged between 20 and 25 ∘C, whereas the relative humidity was from 30 % to 60 %. These conditions are representative of a small, conditioned room and constitute the best-case scenario of the research since the indoor air has more capacity to store moisture from the masonry wall. In Fig. 5 the two different scenarios for the indoor air temperature and relative humidity are presented for the climate file derived from the ERA5. A similar approach was followed for the data derived from the climate model.
In practice, the indoor climate of historic masonry buildings can be in between the selected worst- and best-case scenarios of the current research. It may vary significantly based on the building volume, area of windows, wall dimensions and layers, moisture buffering performance, and presence of active climate control (Leissner et al., 2015; Loli and Bertolin, 2018; Choidis et al., 2020; Califano et al., 2022). All these parameters were taken into account by Bertolin and Camuffo (2014), Leissner et al. (2015), Loli and Bertolin (2018) in order to calculate the indoor climate in different building categories and further assess their energy performance and the deterioration of artifacts that are hosted indoors. In the current research, a more straightforward approach was followed with focus on a generic cross-section, a worst-case and a best-case scenario for the indoor climate and investigation of the hygrothermal performance and frost damage risk of a critical area at the exterior side of the masonry wall which according to observations (Figs. 1, 2, 3, 4) and literature (Straube and Schumacher, 2006; Ueno et al., 2013a, b, c; Van Straaten, 2016; Vandemeulebroucke et al., 2019, 2020, 2021a, b; Sahyoun, 2020) is at higher risk.
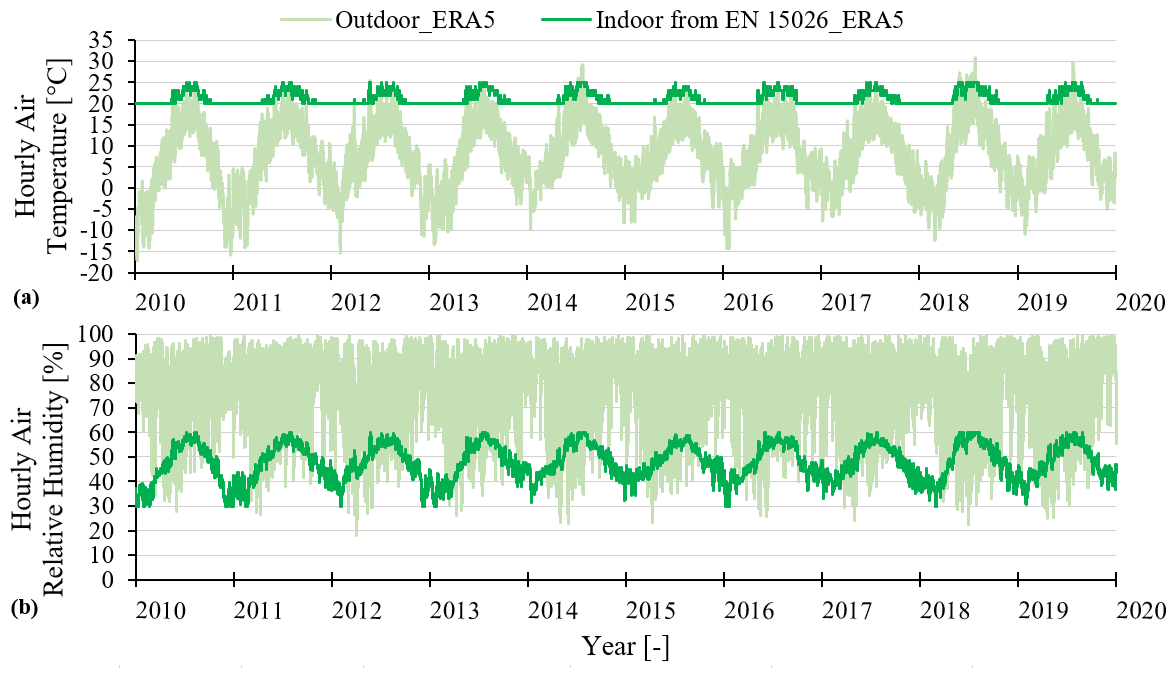
Figure 5The two different considered cases for the indoor (a) air temperature and (b) relative humidity under the ERA5 climate excitation. The indoor air temperature and relative humidity were in one case equal to the outdoor ones, while in the second case were calculated according to EN 15026.
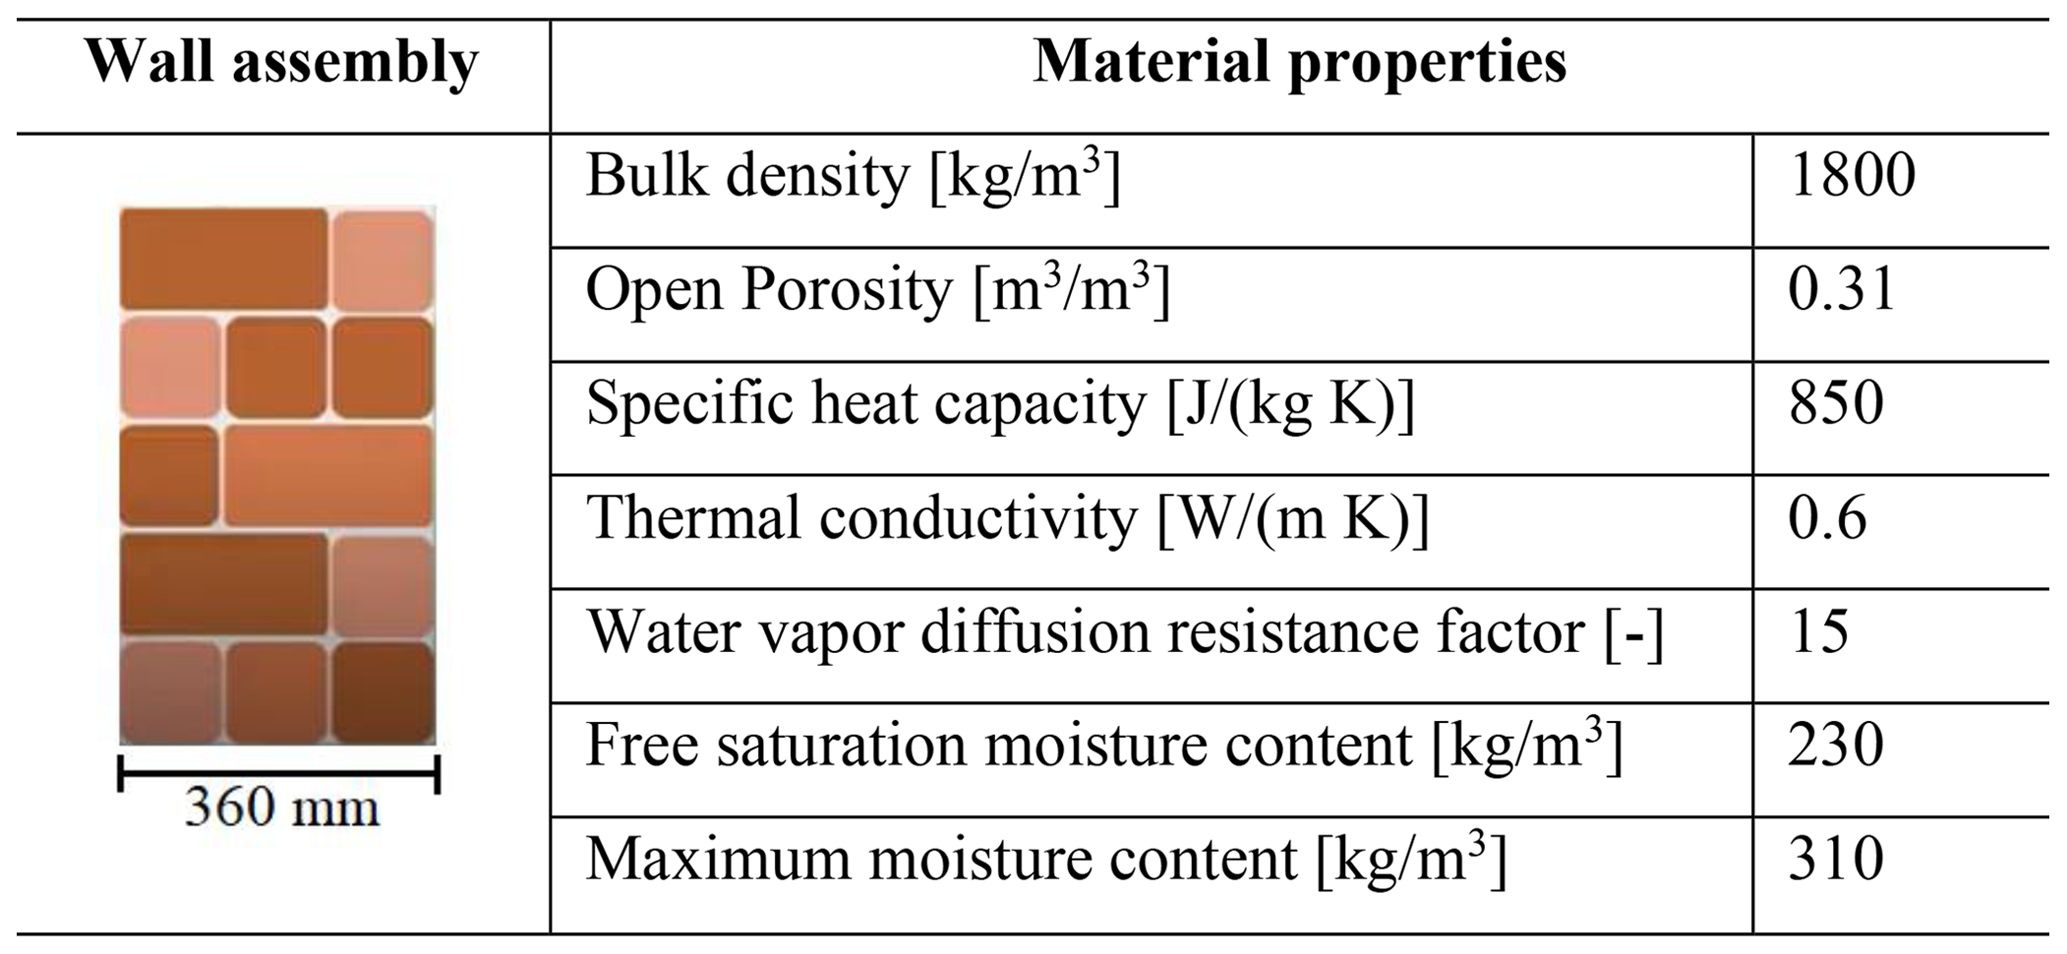
The measured dimensions of the bricks in Figs. 1, 2, 3, 4, were mm3. A brick-made wall assembly of 360 mm thickness was simulated (Table 1). The material properties of the simulated historic brick were derived from the WUFI® Pro database and they are presented in Table 1. It was also considered that the simulated assembly had no exterior treatment. The exterior 5 mm of the masonry wall are the ones with the greatest frost damage risk (Straube and Schumacher, 1991; Ueno et al., 2013a, c; Van Straaten, 2016; Vandemeulebroucke et al., 2019, 2020, 2021a, b; Sahyoun, 2020) and for computational purposes, relevant to the software used in the current research, were simulated as a separate layer. In addition, a control point was positioned at a depth of 2.5 mm from the exterior surface in order to monitor the temperature of the area of interest. The area under investigation (a) was sufficiently cold to experience freeze-thaw cycling (near the surface), (b) experienced outdoor precipitation events, but (c) had limited drying to the exterior (unlike the surface layer), resulting in the highest moisture contents (Ueno et al., 2013b). The software calculated with an hourly time step the material temperature and the moisture content of the layer of interest.
Table 1Simulated masonry wall and its material properties, derived from the WUFI® material database.
2.3.2 Critical material temperature and moisture content for the assessment of frost damage risk
Using the material temperature instead of the air temperature in order to account for the freeze-thaw events can more accurately describe the performance of the wall assembly. In literature, various values have been considered critical for freezing and thawing events. In the current research, the most conservative approach was adopted, which considers 0 ∘C as the critical temperature for both freezing and thawing (Sedlbauer and Kunzel, 2000; Van Aarle et al., 2015). Thus, the impact on the depression of the freezing point due to the presence of salts or according to the pore size distribution of the brick was not taken into account.
Below a critical degree of saturation (Scrit) a porous material can be cycled thousands of times above and below freezing without any measurable damage. On the contrary, above the Scrit, damage is measurable after only a few cycles (Fagerlund, 1977a, b; Mensinga et al., 2010; Straube et al., 2012; Ueno et al., 2013a, b, c; De Rose et al., 2014; Van Straaten et al., 2016). The lowest value of the Scrit defined experimentally for a brick is 0.25 (Mensinga et al., 2010) and was adopted by a lot of studies that included numerical simulations, such as Zhou et al. (2017), Vandemeulebroucke et al. (2019, 2020, 2021a, b), Sahyoun et al. (2020), Zhou et al. (2020). The same conservative approach, with Scrit=0.25, was taken into account as the actual value was unknown. For the simulated brick, the Scrit of 0.25 corresponds to a critical moisture content of 77.5 kg m−3 and according to its moisture storage function to a relative humidity of 99.82 %.
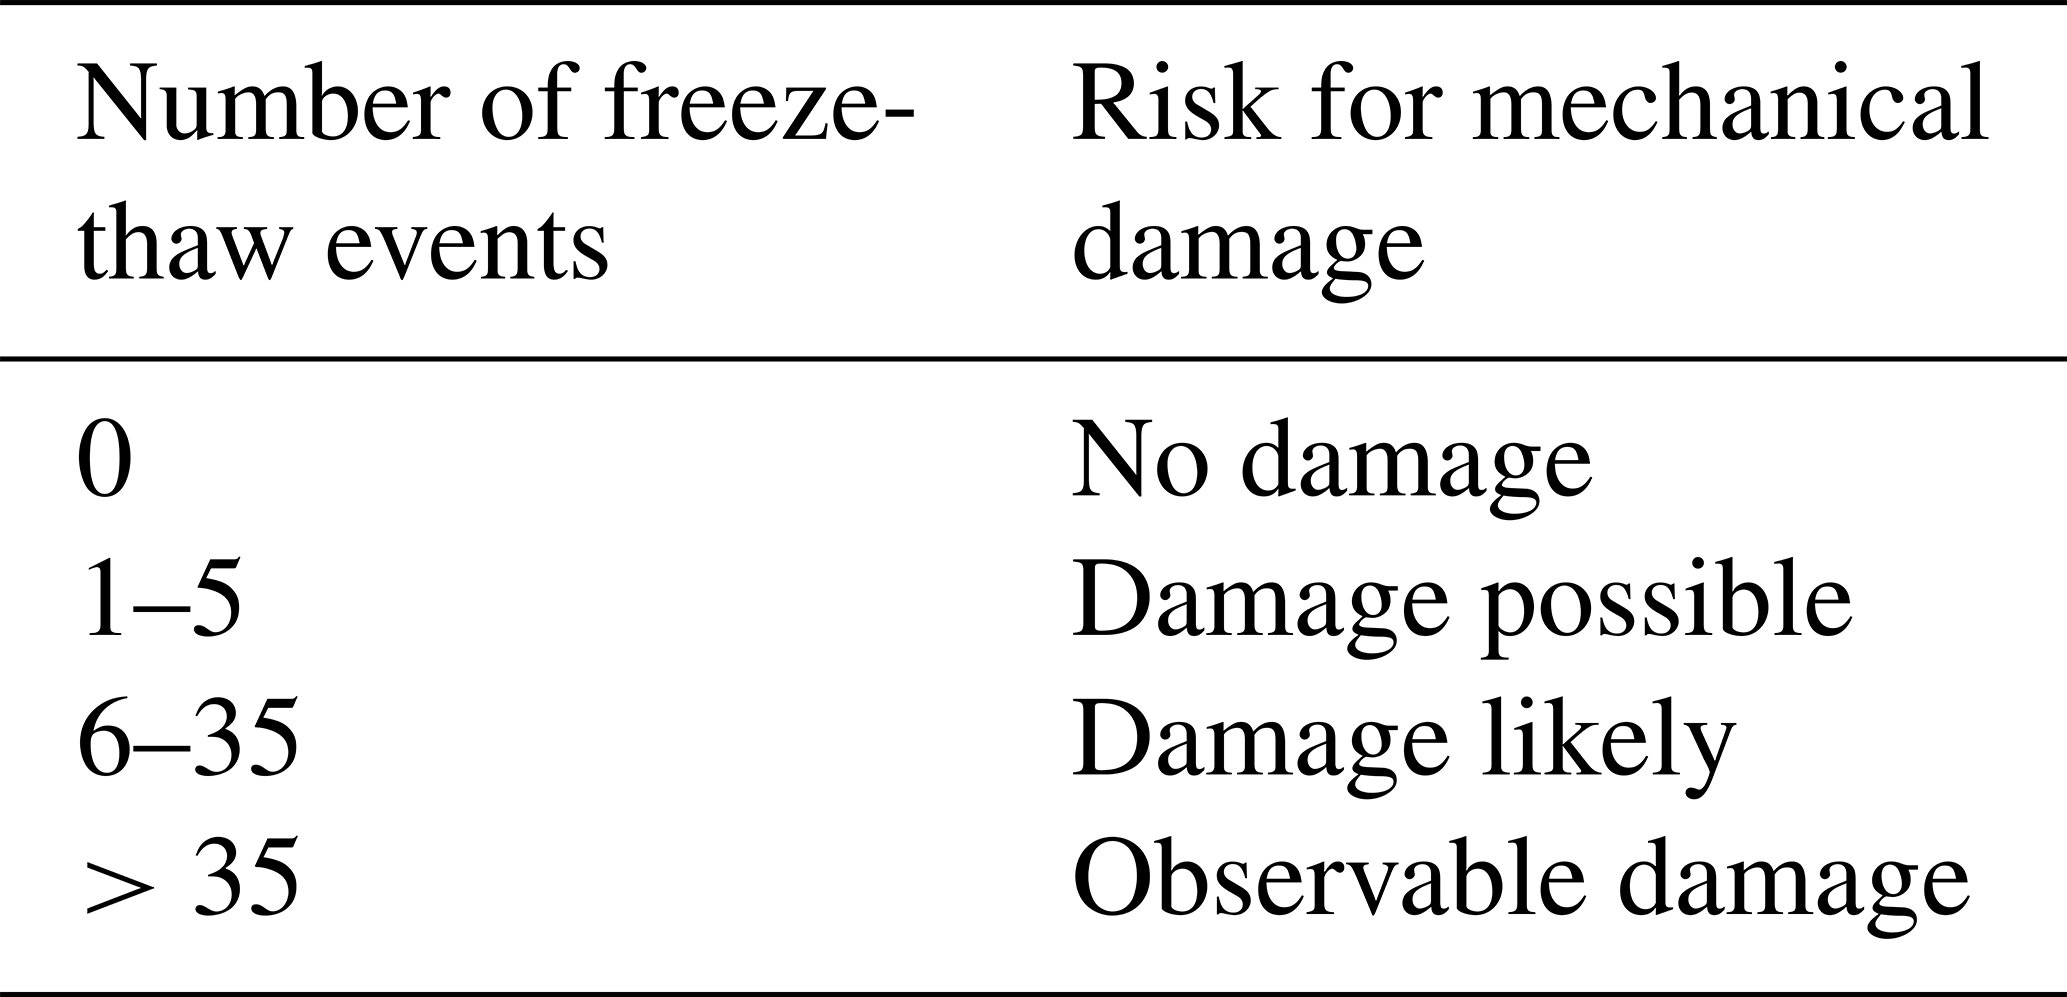
The selected critical material temperature and moisture content were used to assess the freeze-thaw cycles of the exterior 5 mm of the masonry wall. As mentioned above, even a small number of freeze-thaw cycles can cause significant degradation of the brick wall. Mensinga et al. (2010), Ueno et al. (2013a, c) noticed a degradation in the tested specimens after 6 cycles, while in many cases it took around 20 to 30 cycles. Prepens (1991) and Van Aarle et al. (2015) suggested that damage occurs after the brick is exposed to 25–35 freeze-thaw cycles. Thus, in the current research, the risk categorization of Table 2 was adopted.
Table 2Risk for mechanical damage of the masonry wall based on the number of freeze-thaw events.
3.1 Outdoor climate
Climate data for three different decades, i.e., 1960–1969 (referred to as past), 2010–2019 (referred to as present), and 2060–2069 (referred to as future), derived from the MPI-ES-LR_REMO2015 model were used for the examination of the climatic changes occurring throughout the years. A fourth climate file with data derived from the ERA5 for the period 2010–2019 (present) was used in order to examine the accuracy of the climate model data. The climate parameters that mostly affect the hygrothermal performance and the frost damage risk of the building components are presented in Figs. 6 and 7.
The signal of climate change in terms of the air temperature (Fig. 6a) is an average increase of 1.6 ∘C from past to present conditions, and 1.2 ∘C from present to potential future conditions. In the framework of the current research special focus was given to the cold months of the year. According to Fig. 6a, there are air temperatures below 0 ∘C from October until April. For these months, the air temperature increases 1.4 ∘C from the present to the future conditions, which is slightly higher than the annual average air temperature increase. In addition, according to the future climate excitation, there are not any air temperatures below 0 ∘C during April. February is the coldest month of the year under all considered climate excitations and is also the month that is the most significantly affected by climate change. In February, the air temperature increase is 2.2 ∘C from past to present conditions, and 3.1 ∘C from present to potential future conditions.
The air temperatures are slightly underestimated in the model data, showing an average difference of 0.3 ∘C compared to the ERA5. The most significant deviation between the air temperatures from the climate model and the ERA5 was observed for the month of February. The average air temperature during February according to the climate model is 1.25 ∘C lower than the respective one from the ERA5.
According to the climate model data, the air relative humidity remains at the same levels under past, present, and potential future conditions, with an average value of approximately 85 % (Fig. 6b). Within the cold months of the year, the air relative humidity is higher and has average values even above 90 % during January, February, and December. The air relative humidity is overestimated significantly by the climate model data since, according to the ERA5 dataset, its average value is 78 %. According to the ERA5, the monthly average relative humidity remains below 86 %.
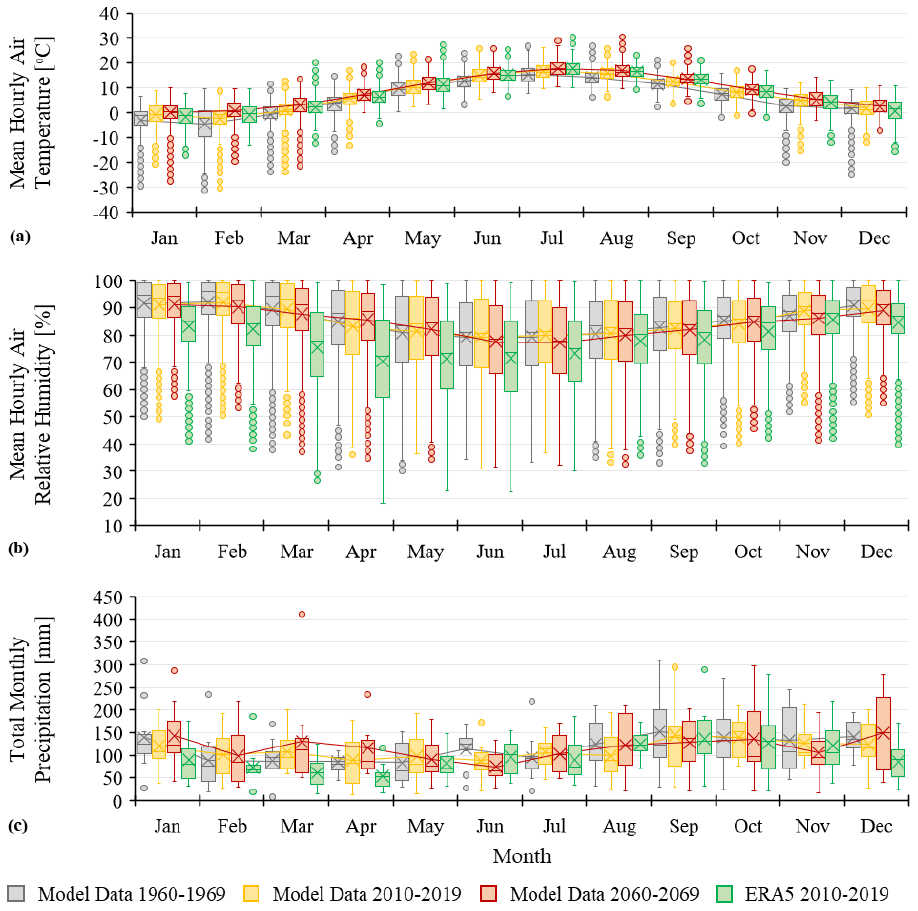
Figure 6Comparison among (a) air temperature, (b) air relative humidity, and (c) precipitation data derived from the MPI-ESM-LR_REMO2015 model and ERA5. In the boxplots, the box shows 50 % of the data, with the median represented as a horizontal bar and the average value highlighted with the “x” symbol. The whisker extends to two standard deviations of the data and the circles represent the outliers.
In some months, the precipitation levels seem to decrease slightly from past to present conditions and to increase from present to future conditions (Fig. 6c). However, precipitation levels vary considerably among different years in the region so, based on 10-year periods, it is hard to consistently detect any trends and the results might be different based on a continuous data series. Nevertheless, from December to April, the highest precipitation level is projected for the latest period 2060–2069. This agrees with other climate model simulations, indicating increasing wintertime precipitation in southern Norway (Lehtonen et al., 2014; Räisänen and Ylhäisi, 2015). The climate model data significantly overestimate the precipitation, especially during the cold months of the year.
The driving rain constitutes a major source of moisture for the brick and, according to the material response-based index, a source of frost damage risk thereof. Thus, the driving rain on vertical masonry walls facing toward the cardinal and intermediate orientations was calculated and depicted in Fig. 7a. The total driving rain load for each ten-year period was computed and divided by ten to get the annual average (Fig. 7a). The orientations with the highest driving rain load in descending order are the south, southeast, east, southwest, northeast, north, west, and northwest. The driving rain load, as well as the impact of climate change on it, are not significant for the west, northwest, and north orientations, and consequently, the focus was placed on the part of Fig. 7a that refers to the northeast, east, southeast, south, and southwest orientations. For the examined five orientations the driving rain load decreases from the past to the present conditions and increases from the present to the future conditions. The most significant changes are observed for the southeast, south, and southwest orientations. The distribution of the driving rain load to the different orientations based on the climate model data is in accordance with the results derived from the ERA5. In the case of the south and southeast orientations, which are the ones with the greatest exposure to wind-driven rain, the climate model underestimates the driving rain load compared to the ERA5. On the contrary, the driving rain load is overestimated in the case of the east orientation compared to the ERA5. For the rest orientations, minor differences were observed among the data from the climate model and ERA5.
Another important parameter that affects the material temperature and drying is the incident solar radiation. In Fig. 7b the solar radiation incident on vertical walls facing toward the cardinal and intermediate orientations is depicted. The total incident solar radiation for each ten-year period was calculated and divided by ten to get the annual average (Fig. 7b). According to the data derived from the climate model, the orientations with the highest solar radiation load in descending order are the south, southwest, southeast, west, east, northwest, northeast, and north. At this point, it is worth mentioning that in Tønsberg during the cold months of the year, the incident solar radiation is significantly lower than the average values of Fig. 7b. However, it can still contribute to the increase of the material temperature above the thawing threshold value during days with air temperatures below the freezing threshold. The incident solar radiation shows a slight decrease through the years for all examined orientations. Moreover, it is underestimated by the climate model data compared to the ERA5.
Figure 7The ten-year average of the total annual (a) driving rain and (b) solar radiation incident on vertical surfaces facing towards the cardinal and intermediate orientations under the examined climate excitations.
3.2 Climate-based indices for the assessment of frost damage
3.2.1 Freezing at air temperatures below 0 ∘C and thawing at air temperatures above 0 ∘C
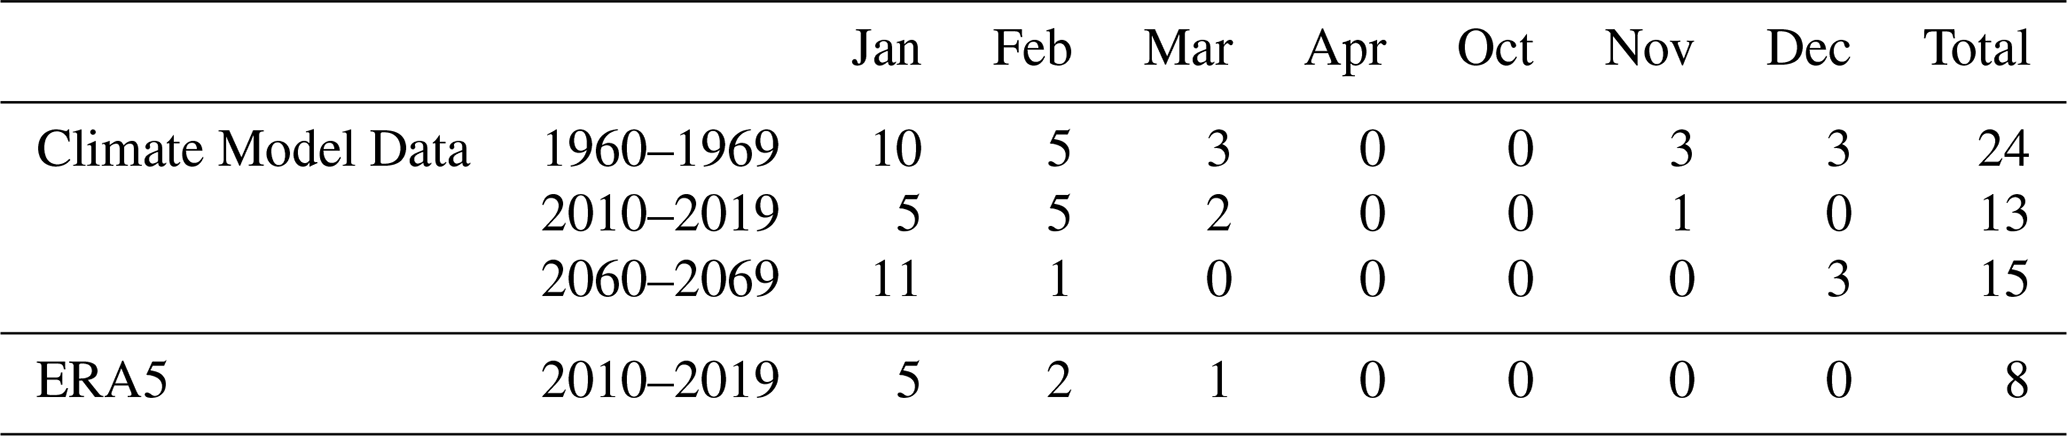
First, the frost damage risk of the historic masonry walls was assessed by counting the 0 ∘C crossings of the air temperatures, given the data from the climate model and the ERA5 (Table 3). In Table 3, only the months that had at least one 0 ∘C crossing were included. Based on the considered climate index there is a decreasing frost damage risk due to climate change which is in agreement with the outputs of Grossi et al. (2007), Sabbioni et al. (2010), Bertolin and Camuffo (2014), Leissner et al. (2015). There is a decrease in the number of freeze-thaw events from the past to the present conditions and a more significant decrease from the present to the future ones.
Observing the results on a monthly basis, there is a significant increase of the 0 ∘C crossing within February from the past to the present conditions, which contradicts the overall trend. February was a very cold month according to the past climate conditions with most of its air temperatures below 0 ∘C (Fig. 6a). The climate change-induced temperature increase from the past to the present conditions resulted in more temperatures hovering around 0 ∘C (Fig. 6a). Similar observations were published by Viles (2002), Brimblecombe and Camuffo (2003), Pakkala et al. (2014). The same conclusion is also relevant to the month of March (Table 3).
In another direction, it was observed that due to the existing climate change-from the past to the present conditions- the number of 0 ∘C crossings within the month of April was significantly reduced (Table 3). Moreover, according to the future climate excitation, there are not any temperatures below 0 ∘C during April.
The month with the greatest number of 0 ∘C crossings under past and present conditions was March (Table 3). March is also the month with the expected greatest reduction of the 0 ∘C crossings from the present to the future conditions and, thus, the one to be the most significantly affected by the upcoming climate change.
Reviewing other research results in the same field it was observed that the average annual number of the 0 ∘C crossings calculated by Grossi et al. (2007) using daily air temperature data was less than 21 for the past (1961–1990) and far future (2070–2099) conditions, in southern Norway. In the current research, the average annual number of 0 ∘C crossings was above 22 under all the examined climate excitations (Table 3). The main reason for the smaller number of 0 ∘C crossings calculated by Grossi et al. (2007) and Sabbioni et al. (2010) is the use of daily air temperature data, while in the current research hourly air temperature data were used. The different examination periods, climate models, and climate change scenarios also have an impact on the results. It is also worth mentioning that the used climate-based index is mainly focused on comparing the results from different periods and detecting the signal of climate change. In this direction, research outputs by Grossi et al. (2007), Sabbioni et al. (2010), Bertolin and Camuffo (2014), Leissner et al. (2015) are in agreement with the results presented in Table 3.
Finally, as can be seen in Table 3, the climate model underestimates the number of 0 ∘C crossings compared to the ERA5. Especially during January, April, and November, the number of 0 ∘C crossings according to the climate model was almost half of the respective ones calculated from the ERA5 data.
Table 3Number of freeze-thaw events with freezing occurring at air temperatures below 0 ∘C and thawing at air temperatures above 0 ∘C for each ten-year period.
3.2.2 Freezing at air temperatures below −3 ∘C and thawing at air temperatures above 1 ∘C
The number of freeze-thaw events was calculated for the four climate excitation of the current research under the assumption that freezing occurs at air temperatures below −3 ∘C and thawing at air temperatures above 1 ∘C (Table 4). October, a month without any freeze-thaw events, was also included in Table 4 in order to be consistent with Table 3 for comparison reasons. According to the considered climate index (Table 4) the number of computed freeze-thaw events was much less compared to the 0 ∘C crossings (Table 3). Moreover, the impact of climate change on the frost damage risk during certain months of the year showed differences depending on the considered climate index.
According to the data derived from the climate model, there is a decreasing trend of the frost damage risk due to climate change (Table 4), which agrees with the results from Grossi et al. (2007), Sabbioni et al. (2010), Bertolin and Camuffo (2014), Leissner et al. (2015). The impact of climate change is more significant from the past to the present conditions. In contrast to the overall decreasing trend of the frost damage risk over the years, there is one month, February, during which the frost damage risk increases due to climate change (Table 4). That is because during February, under the past climate conditions, almost half of the air temperatures were below the freezing threshold, while very few of them were above the thawing threshold value (Fig. 6a). With the air temperature increase due to climate change, there are more air temperatures hovering around the critical freezing and thawing thresholds under the present and future climate excitations and, thus, higher frost damage risk. This observation is in accordance with other studies that suggest an increased frost damage risk over the years in cases of very cold climates (Viles, 2002; Brimblecombe and Camuffo, 2003; Pakkala et al., 2014).
Moreover, freeze-thaw events were observed for the months of March and April under the past climate conditions (Table 4). Considering the present climate conditions there is not any freeze-thaw event during April, while under the future climate excitation, there is no frost damage risk for both March and April. This observation is linked to the air temperature increase due to climate change. Finally, the month with the highest number of freeze-thaw events is, in all examined cases, January.
The impact assessment of climate change on the frost damage risk of cultural heritage buildings was also investigated by Bertolin and Camuffo (2014) for the whole of Europe based on outdoor air temperature data. Bertolin and Camuffo (2014) accounted for the average conditions over the past (1961–1990), near future (2021–2050), and far future (2071–2100) under two different moderate emission scenarios, A1B from IPCC 4th assessment report (IPCC, 2007) and RCP4.5 from the IPCC 5th assessment report (IPCC, 2014). The number of freeze-thaw events depicted on the risk maps by Bertolin and Camuffo (2014) is in the same order of magnitude as the results presented in Table 4. The differences in the number of freeze-thaw events calculated by Bertolin and Camuffo (2014) and Table 4 can be attributed to the different threshold values for the freezing and thawing events, periods of examination, climate models, and climate change scenarios. Moreover, Bertolin and Camuffo (2014), Loli and Bertolin (2018) implemented hygrothermal simulations to calculate the indoor climate in various generic buildings and assessed the frost damage risk based on the indoor air temperature and the −3 and 1 ∘C threshold values for the freezing and thawing events, respectively. A decreasing frost damage risk due to climate change was calculated both by accounting for the outdoor air temperature (Sabbioni et al., 2010; Bertolin and Camuffo, 2014; Leissner et al., 2015) and the indoor air temperature (Bertolin and Camuffo, 2014; Leissner et al., 2015; Loli and Bertolin, 2018),which is in agreement with the results presented in Table 4.
The number of freeze-thaw events, calculated on the basis that freezing occurs at air temperatures below −3 ∘C and thawing at air temperatures above 1 ∘C, was significantly underestimated by the climate model compared to the ERA5 (Table 4). Overall, the freeze-thaw events computed from the climate model data were four times less than the respective ones from the ERA5. The greatest deviation was observed for the month of March. In addition, according to the climate model, there were no freeze-thaw events during April, while based on the ERA5 there is a small number of freeze-thaw events.
Table 4Number of freeze-thaw events with freezing occurring at air temperatures below −3 ∘C and thawing at air temperatures above 1 ∘C for each ten-year period.
3.3 Material response-based index for the assessment of frost damage
3.3.1 Indoor temperature and relative humidity equal to the outdoor ones
In the current section, the results of the material response-based index for the case that the indoor air temperature and relative humidity are equal to the outdoor ones are presented and discussed. In Fig. 8 (panel a) the number of events during which the material temperature drops below 0 ∘C, (panel b) the average moisture content when the material temperature is below 0 ∘C and (panel c) the number of freeze-thaw cycles under the four climate excitations of the current research are presented.
In Fig. 8a it can be seen that there is a very high number of events in which the material temperature drops below 0 ∘C for all the examined orientations. The number of the 0 ∘C crossings according to the material temperature (Fig. 8a) is significantly higher than the one that was calculated based on the air temperature data (Table 3). This observation is mainly attributed to the temperature increase of the material during cold days due to the solar radiation gains. The distribution of the results among the different orientations (Fig. 8a) follows the same pattern as the incident solar radiation results depicted in Fig. 7b. It is then clear that solar radiation significantly influences the material temperature close to the outer surface even in the darker months of the year. It is also observed that only a small number of the incidents within which the temperature drops below 0 ∘C are actually frost damage events according to the material response-based index (Fig. 8c).
This is attributed to the fact that the moisture content of the layer of interest remains at lower levels than the critical value of 77.5 kg m−3 most of the time (Fig. 8b). This is happening either due to a low driving rain load (Fig. 7a), remarkably observed for the west and northwest-oriented walls (Fig. 8b), or due to the significant solar radiation gains (Fig. 7b) and consequent drying, remarkably observed for the southwest and also south, west and southeast orientations (Fig. 8b). On the contrary, in the case of the northeast and east-orientated walls which have significant driving rain loads (Fig. 7a) and low solar radiation gains (Fig. 7b) the moisture content remains at high levels (Fig. 8b). For these two cases, the deviation between the 0 ∘C crossings of the material temperature (Fig. 8a) and the freeze-thaw cycles (Fig. 8c) is the minimum observed. Finally, the major role of the driving rain in the frost damage risk of the masonry walls according to the material response-based index is clearly observed in the similar patterns that the two graphs have (Figs. 7a and 8c).
According to the data derived from the climate model, the number of events during which the material temperature drops below 0 ∘C is decreased through the years (Fig. 8a). This observation is linked to the climate change-induced temperature increase and affects in a similar way all the examined orientations.
The average moisture content of the layer of interest during periods with material temperatures below 0 ∘C, decreases from the past to the present conditions and increases from the present to the future ones (Fig. 8b). This observation is in accordance with the changes in the precipitation and driving rain which were discussed in Sect. 3.1. In Fig. 8b, the decrease of the material moisture content from the past to the present conditions is more significant for the south, southeast, and southwest orientations. These are the orientation with the most significant decrease in the driving rain load from the past to the present conditions. Moreover, in Fig. 8c it can be seen that the freeze-thaw cycles according to the material response-based index are decreasing through the years. It is again observed that the decrease of the freeze-thaw events from the past to the present conditions is more significant in the case of the south, southwest, and southeast-oriented walls.
The data derived from the climate model underestimate the 0 ∘C crossing of the material temperature compared to the ERA5 (Fig. 8a). This is mainly attributed to the underestimation of the air temperature during the cold months of the year. Moreover, the observed differences are more intense for the west, southwest, northwest, north, and south-oriented walls (Fig. 8a). This is linked to the underestimation of the solar radiation gains by the climate model compared to the ERA5 for the mentioned orientations (Fig. 7b). The moisture content of the layer of interest is overestimated by the climate model data compared to the ERA5. This is attributed to the overestimation of the precipitation during the cold months of the year (Fig. 6c). In addition, the freeze-thaw cycles are overestimated significantly by the climate model data compared to the ERA5 (Fig. 8c). The differences between the climate model data and ERA5 are greater for the northeast, east, and north-oriented walls. According to both climate data sources, the orientation with the greatest frost damage risk is the southeast (Fig. 8).
The southeast-oriented wall which is the worst-case scenario experienced 187 freeze-thaw cycles during 2010–2019 according to the climate data from ERA5 (Figs. 8c and 9). This number of events corresponds to significant degradation risk with observable results according to Table 2. The same categorization is attributed to the northeast, east, south, and southwest-orientated walls (Fig. 8c). The simulation results refer to a 360 mm masonry wall with one side exposed to the outdoor climate (including all parameters mentioned in Sect. 2.1) and the other side exposed to the outdoor air temperature and relative humidity. The simulation results are in accordance with the on-site observations of a masonry fence (Fig. 2) in which extended damage was observed.
A more detailed analysis of the orientation with the highest frost damage risk is provided in Table 5. January is the month with the highest frost damage risk under all four climate excitations. The decreasing trend of the frost damage risk is more intense from the past to the present conditions than from the present to the future ones. There is no frost damage risk during the months of April and October, while according to the signal of climate change, the frost damage risk during the month of March will be very small in the future. An increase in the frost damage risk for the months of January and November is predicted for the future which is mainly attributed to the projected precipitation increase.
Figure 8(a) Number of events during which the temperature at the control point 2.5 mm in depth from the outer side of the simulated wall drops below 0 ∘C. (b) Average moisture content at the 5 mm layer at the outer side of the wall during the periods that the θcontrol point is below 0 ∘C. (c) Total number of freeze-thaw cycles according to the material response-based index.
Figure 9Hourly data of temperature at the control point 2.5 mm in depth from the outer side of the simulated wall and moisture content at the 5 mm layer at the outer side of the wall. The critical temperature, 0 ∘C, is highlighted with a red line, and the critical moisture content, 77.5 kg m−3 is highlighted with a blue line. The freeze-thaw events are pointed in black boxes. Within the hygrothermal simulations, the indoor air temperature and relative humidity were considered equal to the outdoor ones.
Table 5Number of freeze-thaw events of a 5 mm layer at the exterior side of the southeast-oriented masonry wall. Freezing occurs at a material temperature below 0 ∘C and a degree of saturation above 0.25. Within the hygrothermal simulations, the indoor air temperature and relative humidity were considered equal to the outdoor ones.
3.3.2 Indoor temperature and relative humidity according to EN 15026
In the following section, the results of the material response-based index for the case that the indoor air temperature and relative humidity were calculated according to EN 15026 are presented and discussed. In Fig. 10 (panel a) the number of events during which the material temperature drops below 0 ∘C, (panel b) the average moisture content when the material temperature is below 0 ∘C and (panel c) the number of freeze-thaw cycles under the four climate excitations of the current research are presented.
A very significant number of material temperature drops below 0 ∘C was calculated for all the examined orientations (Fig. 10a).The number of 0 ∘C crossings in Fig. 10a is significantly lower than the ones in Fig. 8a for all the orientations. This is linked to the increased heat transfer from the indoor environment to the outdoor one which results in significantly higher temperatures at the control point. The distribution of the number of 0 ∘C crossings among the different orientations (Fig. 10a) follows the same pattern as the incident solar radiation results depicted in Fig. 7b. This observation is mainly attributed to the higher solar radiation gains of certain orientations (Fig. 7b) which contributes to a more frequent increase of the control point temperature above 0 ∘C during the cold days of the examined periods.
Figure 10(a) Number of events during which the temperature at the control point 2.5 mm in depth from the outer side of the simulated wall drops below 0 ∘C. (b) Average moisture content at the 5 mm layer at the outer side of the wall during the periods that the θcontrol point is below 0 ∘C. (c) Total number of freeze-thaw cycles according to the material response-based index.
It is also observed that the average moisture content during periods with below 0 ∘C temperatures (Fig. 10b) and the freeze-thaw cycles (Fig. 10c) experienced by the layer of interest are significantly lower than the ones in Fig. 8b and c, respectively. This is attributed to the moisture transport from the material to the indoor air which based on the considered conditions has a greater capacity to store moisture. As can be seen in Fig. 10b and c the new indoor climate conditions, in combination with (i) the low driving rain load at the north, northwest, and west-oriented walls (Fig. 7a), and (ii) the high solar radiation gains at the southwest-oriented walls (Fig. 7b), finally result only to a limited number of orientations, namely the southeast, south, east, and northeast have moisture content values above the critical levels and experiencing freeze-thaw events.
According to the data derived from the climate model, the number of events during which the material temperature drops below 0 ∘C decreases through the years (Fig. 10a). This observation is linked to the climate change-induced temperature increase and affects in a similar way all the examined orientations. The average moisture content of the layer of interest during periods with material temperatures below 0 ∘C, decreases slightly from the past to the present conditions and increases from the present to the future ones (Fig. 10b). This observation is in accordance with the changes in the precipitation and driving rain which were discussed in Sect. 3.1. In Fig. 10b, the increase of the material moisture content from the present to the future conditions is more significant for the northeast and east orientations. Moreover, in Fig. 10c it can be seen that the number of freeze-thaw cycles decreases from the past to the present conditions, while in some cases it increases from the present to the future conditions. The orientations which are mostly affected by these changes are the east, northeast, and southeast.
The data derived from the climate model underestimate the 0 ∘C crossing of the material temperature compared to the ERA5 (Fig. 10a). This is mainly attributed to the underestimation of the air temperature during the cold months of the year. Moreover, the observed differences are more intense for the west, southwest, northwest, north, and south-oriented walls (Fig. 10a). This is linked to the underestimation of the solar radiation gains by the climate model compared to the ERA5 for the mentioned orientation (Fig. 7b). The moisture content of the layer of interest is overestimated by the climate model data compared to the ERA5. This is attributed to the overestimation of the precipitation during the cold months of the year (Fig. 6c). In addition, the number of freeze-thaw cycles is overestimated by the climate model data compared to the ERA5 (Fig. 10c) with the exception of the south orientation for which they are underestimated. The differences between the climate model data and ERA5 are greater for the east, then southeast, and finally the south-oriented walls. According to the climate model data, the orientation with the greatest frost damage risk is the southeast while according to the ERA5 is the south (Fig. 10c).
The southeast-oriented wall was selected as in Sect. 3.4.1 in order to be examined in more detail. As can be seen in Figs. 10c and 11 it experiences 8 freeze-thaw cycles during 2010–2019 according to the climate data from ERA5, which is significantly less than the 187 freeze-thaw cycles of Fig. 9. The calculated number of freeze-thaw events corresponds to “damage likely” according to Table 2. It is worth mentioning that the frost damage risk level for all the examined orientations ranges from “no damage” to “damage likely” (Fig. 10c, Table 2). The simulation results refer to a 360 mm masonry wall with one side exposed to the outdoor climate (including all parameters mentioned in Sect. 2.1) and the other side exposed to an indoor climate calculated according to EN 15026. The indoor air temperature ranges from 20 to 25 ∘C and the relative humidity from 30 % to 60 %. These conditions can be representative of a small conditioned room like certain rooms of the building in Fig. 4. The observed degradation on the walls of the Tønsberg train station was mostly observed in the southeast-oriented walls, while the overall degradation was much less compared to the masonry fence of Fig. 2b and c. It is also worth mentioning that the examples of the damaged wall in Fig. 4b and c are not the result of deterioration during the period 2010–2019 but in reality, is the outcome of cumulative degradation for many decades.
A month-by-month analysis of the southeast orientation according the ERA5 data is provided in Table 6. January is the month with the highest frost damage risk under all four climate excitations. There is a decrease of the frost damage risk from the past to the present conditions and an increase from the present to the future ones which is linked with the respective changes in the driving rain load. There is no frost damage risk during the months of April, October, November, and December. Based on the signal of climate change it is possible that in the future February and March will also be months with no frost damage risk, while an increase in the number of freeze-thaw cycles during December is also possible.
Figure 11Hourly data of temperature at the control point 2.5 mm in depth from the outer side of the wall with southeast orientation and moisture content at the 5 mm layer at the outer side of the same wall. The critical temperature, 0 ∘C, is highlighted with a red line, and the critical moisture content, 77.5 kg m−3 is highlighted with a blue line. The freeze-thaw events are pointed in black boxes. Within the simulations, the indoor air temperature and relative humidity were calculated according to EN 15026.
Table 6Number of freeze-thaw events of a 5 mm layer at the exterior side of the southeast-oriented masonry wall. Freezing occurs at a material temperature below 0 ∘C and a degree of saturation above 0.25. The indoor air temperature and relative humidity were calculated according to EN 15026.
Brick is a building material vulnerable to frost damage. As a result of the action of this deterioration mechanism the material surface flakes off and crumbles away. The main cause is the pressure exerted when the water inside the material pores freezes to ice and increases its volume. Tønsberg is a city in southern Norway that has a significant number of historic masonry buildings which are affected by this deterioration mechanism. The warmer and more humid climate during the cold months of the year, which is attributed to climate change, is expected to affect the action of this deterioration mechanism.
In the current research, climate data from a climate model under past, present, and future conditions were used in order to account for the signal of climate change. An additional climate file for the present conditions derived from the ERA5 was used to assess the accuracy of the climate model results. Two climate-based indices and one material response-based index were used for the assessment of the frost damage risk. The first climate index accounts for the number of 0 ∘C crossings of the air temperature. The second considers that freezing occurs at air temperatures below −3 ∘C and thawing at air temperatures above 1 ∘C. The material response-based index accounted for (i) the temperature at a control point 2.5 mm in depth from the exterior side of a simulated masonry wall and (ii) the moisture content of a 5 mm layer at the outer side of the same wall. The critical temperature and degree of saturation for a freezing event were 0 ∘C and 0.25, respectively.
The material temperature and moisture content were calculated by simulating the hygrothermal performance of a 360 mm masonry wall under the four mentioned outdoor climate excitations. The indoor climate was in one case considered equal to the outdoor one – worst-case scenario –, while in the second case it was calculated according to EN 15026 – best-case scenario –.
Significant differences were observed in (i) the number of freeze-thaw events, (ii) the periods during which freeze-thaw events occur and (iii) the climate change-related trends for the different indices.
The overall impact of climate change is a decrease in the frost damage risk of the masonry walls. The only exception was the east, northeast, and southeast-oriented walls of the simulated small, conditioned room – with indoor climate calculated according to EN 15026 – for which an increased frost damage risk was predicted from the present to the future conditions. At this point, it is worth highlighting that the degradation by this deterioration mechanism is cumulative and despite the overall decreasing trend of the number of freeze-thaw events, the actual damage on the masonry walls increases through the years.
Moreover, a decrease in the number of months with freeze-thaw events is observed due to climate change. This observation is linked to the climate change-induced air temperature increase.
In contrast with the overall trend, there are certain months of the year for which the frost damage risk increases. Based on the results of the climate-based indices these are the coldest months of the year, like February, which due to the climate change-induced temperature increase experience more incidents with air temperatures hovering around the freezing and thawing thresholds. According to the material response-based index, an increased frost damage risk was observed from the present to the future conditions for the months and orientations with an increased driving rain load due to climate change. Such an example is January for the southeast-oriented masonry walls. At this point, it is also worth highlighting that, firstly, the driving rain and, secondly, the solar radiation gains are the parameters that define the orientation with the maximum frost damage risk. The frost damage risk of the masonry walls varies significantly among the different orientations and, as described above, so does the signal of climate change.
In the case of the material response-based index, the indoor climate has a very significant role in the frost damage risk assessment. The freeze-thaw cycles calculated for the worst-case scenario were even 20 times more than the ones for the best-case scenario. This is mainly attributed – according to the best-case scenario – to the greater capacity of the indoor air to store moisture from the material. In this way, during freezing temperatures, there is not enough moisture in the material pores to freeze, swell, and cause damage.
In another direction, it was observed that the climate model underestimates the frost damage risk compared to the ERA5 according to the climate-based indices. This is attributed to the underestimation of the air temperature by the climate model data compared to the ERA5.
On the other hand, the climate model in most of the examined cases overestimated the frost damage risk according to the material response-based index. This is mainly linked to the overestimation of the precipitation and, consequently, the driving rain load and material moisture content by the climate model compared to the ERA5. The only exception to this observation was the south-oriented wall of a room with an indoor climate calculated according to EN 15026. It was, also, observed that the differences in the calculated frost damage risk between the data from the climate model and ERA5 were more significant for the orientations with high driving rain load and low solar radiation gains.
In addition, of great importance is the fact that the outputs of the material response-based index were translated into certain damage categories. This allows the validation of the simulation results, the prediction of the point at which a critical level of damage will be reached, and also makes the results understandable to a wider audience. Additional experimental data would help to define the critical values more accurately for the various risk levels.
Finally, future research could focus on improving certain limitations of the current study and, specifically, (i) include data from more climate models and climate change scenarios and bias correct the data (Gaur et al., 2019; Gaur and Lacasse, 2022), (ii) use climate data until the far future, (iii) collect information about the geometry, materials, climate control, and moisture loads of case studies, (iv) take into account the depression of the freezing point due to the pore size of the material and the presence of salts, (v) leverage experimental data for the critical number of freeze-thaw events (Germinario et al., 2022; Salvini et al., 2022), (vi) account for more deterioration mechanism, like salt crystallization. In this way, it will be possible to investigate and quantify even more accurately the degradation of cultural heritage buildings and, finally, organize proper strategies to improve their preservation and resilience.
The climate data that support the findings of this study are derived from the online databases of the Copernicus climate change service (https://cds.climate.copernicus.eu/cdsapp#/dataset/reanalysis-era5-single-levels?tab=form, last access: 22 July 2022, Copernicus Climate Change Service, 2022) and the Earth System Grid Federation (ESGF) (https://esgf.nci.org.au/search/esgf-nci/, last access: 22 July 2022, NCI ESGF Node, 2022). The results from the hygrothermal simulations and the frost damage risk assessment are available upon request from the authors.
Conceptualization, PC; data curation, PC; formal analysis, PC; investigation, PC; methodology, PC; project administration, PC; resources, PC; software, PC; validation, PC; visualization, PC; writing – original draft preparation, PC; writing – review & editing, PC, GBAC and DK; funding acquisition, PC and DK. All authors have read and agreed to the published version of the manuscript.
The contact author has declared that neither of the authors has any competing interests.
Publisher’s note: Copernicus Publications remains neutral with regard to jurisdictional claims in published maps and institutional affiliations.
This article is part of the special issue “European Geosciences Union General Assembly 2022, EGU Division Energy, Resources & Environment (ERE)”. It is a result of the EGU General Assembly 2022, Vienna, Austria, 23–27 May 2022.
This work is a part of the HYPERION project. HYPERION has received funding from the European Union's Framework Program for Research and Innovation (Horizon 2020). The content of this publication is the sole responsibility of Oslo Metropolitan University and does not necessarily reflect the opinion of the European Union. The authors would also like to acknowledge Ilari Lehtonen (Finish Meteorological Institute) for providing information and guidelines for the use of the climate data of the current research, Jørgen Solstad (Vestfold and Telemark County Council) for providing information about the historic masonry buildings in the city of Tønsberg, and Claudio Mazzoli (Department of Geosciences, University of Padova) for providing information on the frost damage of porous materials.
This research has been supported by the Horizon 2020 (grant no. HYPERION (821054)).
This paper was edited by Michael Kühn and reviewed by three anonymous referees.
Al-Omari, A., Brunetaud, X., Beck, K., and Al-Mukhtar, M.: Effect of thermal stress, condensation and freezing–thawing action on the degradation of stones on the Castle of Chambord, France, Environ. Earth Sci., 71, 3977–3989, https://doi.org/10.1007/s12665-013-2782-4, 2014.
Bertolin, C. and Camuffo, D.: Deliverable 5.2 Climate change impact on movable and immovable cultural heritage throughout Europe, 2014: https://www.climateforculture.eu/index.php?inhalt=furtherresources.projectresults, last access: 20 October 2022.
Brimblecombe, P. and Camuffo, D.: Long term damage to the built environment, The effects of air pollution on the built environment, 2, Imperial College Press, 1–30, https://doi.org/10.1142/p243, 2003.
Brimblecombe, P., Grossi, C. M., and Harris, I.: Climate change critical to cultural heritage, in: Survival and sustainability, edited by: Gökçekus, H., Türker, U., LaMoreaux, J., Springer, Berlin, Heidelberg, Germany, 195–205, https://doi.org/10.1007/978-3-540-95991-5_ 20, 2010.
Califano, A., Baiesi, M., and Bertolin, C.: Analysing the Main Standards for Climate-Induced Mechanical Risk in Heritage Wooden Structures: The Case of the Ringebu and Heddal Stave Churches (Norway), Atmosphere, 13, 791, https://doi.org/10.3390/atmos13050791, 2022.
Camuffo, D.: Microclimate for Cultural Heritage Conservation, Restoration and Maintenance of Indoor and Outdoor Monuments, Elsevier, New York, USA, 519 pp., https://doi.org/10.1016/C2013-0-00676-7, 2014.
CEN, EN 15026: Hygrothermal Performance of Building Components and Building Elements – Assessment of Moisture Transfer by Numerical Simulation, CEN, Brussels, Belgium, ISBN 9780580547416, 2007.
Choidis, P., Tsikaloudaki, K., and Kraniotis, D.: Hygrothermal performance of log walls in a building of 18th century and prediction of climate change impact on biological deterioration, in: E3S Web of Conferences: 12th Nordic Symposium on Building Physics (NSB 2020), 172, 15006, https://doi.org/10.1051/e3sconf/202017215006, 2020.
Choidis, P., Kraniotis, D., Lehtonen, I., and Hellum, B.: A Modelling Approach for the Assessment of Climate Change Impact on the Fungal Colonization of Historic Timber Structures, Forests, 12, 819, https://doi.org/10.3390/f12070819, 2021.
Copernicus Climate Change Service: ERA5 Hourly Data on Single Levels from 1979 to Present: https://cds.climate.copernicus.eu/cdsapp#/dataset/reanalysis-era5-single-levels?tab=form [data set], last access: 22 July 2022.
Davidson, G. and Nye, J. F.: A photoelastic study of ice pressure in rock cracks, Cold Reg. Sci. Technol., 11, 141–153, https://doi.org/10.1016/0165-232X(85)90013-8, 1985.
De Rose, D., Pearson, N., Mensinga, P., and Straube, J.: Towards a limit states approach to insulating solid masonry walls in a cold climate, in: Proceedings of the 14th Canadian Conference on Building Science and Technology, Toronto, Canada, 28–30 October 2014, 521–530, 2014.
Delgado, J., Ramos, N. M., Barreira, E., and De Freitas, V. P.: A critical review of hygrothermal models used in porous building materials, J. Porous Media, 13, 221–234, https://doi.org/10.1615/JPorMedia.v13.i3.30, 2010.
Fagerlund, G.: The critical degree of saturation method of assessing the freeze/thaw resistance of concrete, Mat. Constr., 10, 217–229, https://doi.org/10.1007/BF02478693, 1977a.
Fagerlund, G.: The international cooperative test of the critical degree of saturation method of assessing the freeze/thaw resistance of concrete, Mat. Constr., 10, 231–253, https://doi.org/10.1007/BF02478694, 1977b.
French, H. M.: The periglacial environment, Fourth Edition, Wiley-Blackwell, Hoboken, New Jersey, USA, 544 pp., ISBN 9781119132783, 2017.
Gaur, A. and Lacasse, M.: Climate Data to Support the Adaptation of Buildings to Climate Change in Canada, Data, 7, 42, https://doi.org/10.3390/data7040042, 2022.
Gaur, A., Lacasse, M., and Armstrong, M.: Climate Data to Undertake Hygrothermal and Whole Building Simulations Under Projected Climate Change Influences for 11 Canadian Cities, Data, 4, 72, https://doi.org/10.3390/data4020072, 2019.
Germinario, L., Coletti, C., Girardi, G., Maritan, L., Praticelli, N., Sassi, R., Solstad, J., and Mazzoli, C.: Microclimate and Weathering in Cultural Heritage: Design of a Monitoring Apparatus for Field Exposure Tests, Heritage, 5, 3211–3219, https://doi.org/10.3390/heritage5040165, 2022.
Giorgetta, M. A., Jungclaus, J., Reick, C. H., Legutke, S., Bader, J., Böttinger, M., Brovkin, V., Crueger, T., Esch, M., and Fieg, K.: Climate and carbon cycle changes from 1850 to 2100 in MPI-ESM simulations for the Coupled Model Intercomparison Project phase 5, J. Adv. Model. Earth Syst., 5, 572–597, https://doi.org/10.1002/jame.20038, 2013.
Grossi, C. M., Brimblecombe, P., and Harris, I.: Predicting long term freeze–thaw risks on Europe built heritage and archaeological sites in a changing climate, Sci. Total Environ., 377, 273–281, https://doi.org/10.1016/j.scitotenv.2007.02.014, 2007.
Hao, L., Herrera, D., Troi, A., Petitta, M., Matiu, M., and Del Pero, C.: Assessing the impact of climate change on energy retrofit of alpine historic buildings: consequences for the hygrothermal performance, in: IOP Conference Series: Earth and Environmental Science, Sustainability in the built environment for climate change mitigation, Thessaloniki, Greece, 23–25 October 2019, 410, https://doi.org/10.1088/1755-1315/410/1/012050, 2020.
Hersbach, H., Bell, B., Berrisford, P., Hirahara, S., Horányi, A., Muñoz-Sabater, J., Nicolas, J., Peubey, C., Radu, R., Schepers, D., and Simmons A.: The ERA5 global reanalysis, Q. J. R. Meteorolog. Soc., 146, 1999–2049, https://doi.org/10.1002/qj.3803, 2020.
IPCC: Climate Change 2007: Synthesis Report, Contribution of Working Groups I, II and III to the Fourth Assessment Report of the Intergovernmental Panel on Climate Change, edited by: Core Writing Team, Pachauri, R. K., and Reisinger, A., IPCC, Geneva, Switzerland, 104 pp., 2007.
IPCC: Climate Change 2014: Synthesis Report. Contribution of Working Groups I, II and III to the Fifth Assessment Report of the Intergovernmental Panel on Climate Change edited by: Core Writing Team, Pachauri, R. K., and Reisinger, A., IPCC, Geneva, Switzerland, 151 pp., 2014.
Jacob, D. and Podzun, R.: Sensitivity studies with the regional climate model REMO, Meteorol. Atmos. Phys., 63, 119–129, https://doi.org/10.1007/BF01025368, 1997.
Jacob, D., Petersen, J., Eggert, B., Alias, A., Christensen, O. B., Bouwer, L. M., Braun, A., Colette, A., Déqué, M., and Georgievski, G.: EURO-CORDEX: new high-resolution climate change projections for European impact research, Reg. Environ. Change, 14, 563–578, https://doi.org/10.1007/s10113-013-0499-2, 2014.
Karagiozis, A., Hadjisophocleous, G., and Cao, S.: Wind-driven rain distributions on two buildings, J. Wind Eng. Ind. Aerodyn., 67, 559–572, https://doi.org/10.1016/S0167-6105(97)00100-1, 1997.
Karagiozis, A., Künzel, H., and Holm, A.: WUFI-ORNL/IBP – A North American hygrothermal model, in: Proceedings of the 8th International Conference on Thermal Performance of the Exterior Envelopes of Whole Buildings, Buildings VIII, Clearwater Beach, Florida, USA, 2–7 December 2001.
Kaslegard, A. S.: Climate change and cultural heritage in the Nordic countries, Norden, Copenhagen, Denmark, 55 pp., ISBN 9789289321952, 2011.
Kočí, J., Maděra, J., and Černý, R.: Generation of a critical weather year for hygrothermal simulations using partial weather data sets, Build. Environ., 76, 54–61, https://doi.org/10.1016/j.buildenv.2014.03.006, 2014.
Kočí, J., Maděra, J., Keppert, M., and Černý, R.: Damage functions for the cold regions and their applications in hygrothermal simulations of different types of building structures, Cold Reg. Sci. Technol., 135, 1–7, https://doi.org/10.1016/j.coldregions.2016.12.004, 2017.
Künzel, H. M.: Simultaneous heat and moisture transport in building components, One-and two-dimensional calculation using simple parameters, Fraunhofer Institute of Building Physics, Stuttgart, Germany, 65 pp., 1995.
Lehtonen, I., Ruosteenoja, K., and Jylhä, K.: Projected changes in European extreme precipitation indices on the basis of global and regional climate model ensembles, Int. J. Climatol., 34, 1208–1222, https://doi.org/10.1002/joc.3758, 2014.
Leissner, J., Kilian, R., Kotova, L., Jacob, D., Mikolajewicz, U., Broström, T., Ashley-Smith, J., Schellen, H. L., Martens, M., and van Schijndel, J.: Climate for Culture: assessing the impact of climate change on the future indoor climate in historic buildings using simulations, Herit Sci., 3, 1–15, https://doi.org/10.1186/s40494-015-0067-9, 2015.
Lisø, K. R., Kvande, T., Hygen, H. O., Thue, J. V., and Harstveit, K.: A frost decay exposure index for porous, mineral building materials, Build. Environ., 42, 3547–3555, https://doi.org/10.1016/j.buildenv.2006.10.022, 2007.
Loli, A. and Bertolin, C.: Indoor multi-risk scenarios of climate change effects on building materials in Scandinavian countries, Geosci., 8, 347, https://doi.org/10.3390/geosciences8090347, 2018.
Mantha, P. and Arena, L. B.: A systematic approach to hygrothermal modeling and compliance with failure criteria using WUFI, in: Proceedings of SimBuild Conference: 5th conference of IBPSA USA, 5, 414–422, 2012.
Matsuoka, N.: Mechanisms of rock breakdown by frost action: An experimental approach, Cold Reg. Sci. Technol., 17, 253–270, https://doi.org/10.1016/S0165-232X(05)80005-9, 1990.
Matsuoka, N.: Microgelivation versus macrogelivation: towards bridging the gap between laboratory and field frost weathering, Permafrost Periglac., 12, 299–313, https://doi.org/10.1002/ppp.393, 2001.
Mensinga, P., Straube, J., and Schumacher, C.: Assessing the freeze-thaw resistance of clay brick for interior insulation retrofit projects, in: Proceedings of the 11th International Conference on Thermal Performance of the Exterior Envelopes of Whole Buildings, Buildings XI, ASHRAE/DOE Conference, Clearwater Beach, Florida, USA, 5–9 December 2010, 2–7, 2010.
NCI ESGF Node: https://esgf.nci.org.au/search/esgf-nci/ [data set], last access: 22 July 2022.
Nelson, F. E. and Outcalt, S. I.: A Computational Method for Prediction and Regionalization of Permafrost, Arct. Alp. Res., 19, 279–288, https://doi.org/10.1080/00040851.1987.12002602, 1987.
Ollier, C.: Weathering Geomorphology Texts, First Edition, Clayton, K.M. (editor), Oliver and Boyd, Edinburg, Scotland, ISBN 9780050017951, 1969.
Pakkala, T. A., Köliö, A., Lahdensivu, J., and Kiviste, M.: Durability demands related to frost attack for Finnish concrete buildings in changing climate, Build. Environ., 82, 27–41, https://doi.org/10.1016/j.buildenv.2014.07.028, 2014.
Prepens, M.: Der Einfluß von Beschichtungen und Imprägnierungen auf die Frost- und Witterungsbeständigkeit von Verblendmauerwerk aus Kalksandsteinen, Ph.D. thesis, University of Hannover, Germany, 1991.
Räisänen, J. and Ylhäisi, J. S.: CO2-induced climate change in northern Europe: CMIP2 versus CMIP3 versus CMIP5, Clim. Dynam., 45, 1877–1897, https://doi.org/10.1007/s00382-014-2440-x, 2015.
Riahi, K., Rao, S., Krey, V., Cho, C., Chirkov, V., Fischer, G., Kindermann, G., Nakicenovic, N., and Rafaj, P.: RCP 8.5 – A scenario of comparatively high greenhouse gas emissions, Clim. Change, 109, 33-57, https://doi.org/10.1007/s10584-011-0149-y, 2011.
Sabbioni, C., Brimblecombe, P., and Cassar, M. (Eds.): The atlas of climate change impact on European cultural heritage: scientific analysis and management strategies, Anthem Press, London, UK, 160 pp., ISBN 9781843317982, 2010.
Sahyoun, S., Ge, H., Defo, M., and Lacasse, M.: Evaluating the potential of freeze-thaw damage in internally insulated masonry under climate change using different models, in: MATEC Web of Conferences 282, 4th Central European Symposium on Building Physics, Prague, Czech Republic, 2–5 September 2019, 02081, https://doi.org/10.1051/matecconf/201928202081, 2019.
Sahyoun, S., Wang, L., Ge, H., Defo, M., and Lacasse, M.: Durability of Internally Insulated Historical Solid Masonry Under Future Climates: A Stochastic Approach, in: Current Topics and Trends on Durability of Building Materials and Components, XV International Conference on Durability of Building Materials and Components, Barcelona, Spain, 20–23 October 2020, https://doi.org/10.23967/dbmc.2020.044, 2020.
Said, M., Demers, R., and McSheffrey, L.: Hygrothermal performance of a masonry wall retrofitted with interior insulation, in: Research in Building Physics, CRC Press, 445–454, 2020.
Salvini, S., Bertoncello, R., Coletti, C., Germinario, L., Maritan, L., Massironi, M., Pozzobon, R., and Mazzoli, C.: Recession rate of carbonate rocks used in cultural heritage: Textural control assessed by accelerated ageing tests, J. Cult. Heritage, 57, 154–164, https://doi.org/10.1016/j.culher.2022.08.010, 2022.
Sedlbauer, K. and Kunzel, H.: Frost damage of masonry walls-a hygrothermal analysis by computer simulations, J. Therm. Envelope Build. Sci., 23, 277–281, 2000.
Straube, J. and Schumacher, C.: Assessing the durability impacts of energy efficient enclosure upgrades using hygrothermal modeling, WTA-J., 2, 197–222, 2006.
Straube, J., Ueno, K., and Schumacher, C.: Measure guideline: internal insulation of masonry walls, National Renewable Energy Lab. (NREL), Golden, CO, United States, https://doi.org/10.2172/1048975, 2012.
Straube, J. and Burnett, E.: Building science for building enclosures, Building Science Press, Westford, Massachusetts, USA, ISBN 9780975512746, 2005.
Ueno, K., Van Straaten, R., and Schumacher, C.: Interior insulation of mass masonry walls: Joist monitoring, material test optimization, salt effects, Report for the U.S. Department of Energy’s Building America Program, Building Science Corporation, 88 pp., 2013a.
Ueno, K., Straube, J., and Van Straaten, R.: Field monitoring and simulation of a historic mass masonry building retrofitted with interior insulation, in: Proceedings of the 12th International Conference on Thermal Performance of the Exterior Envelopes of Whole Buildings, Clearwater, Florida, USA, 1–5 December 2013, 56-71, ISBN 9781510827837, 2013b.
Ueno, K., Kerrigan, P., Wytrykowska, H., and Van Straaten, R.: Retrofit of a multifamily mass masonry building in New England, Report for the U.S. Department of Energy’s Building America Program, Building Science Corporation, United States, 162 pp., https://doi.org/10.2172/1090969, 2013c.
Van Aarle, M., Schellen, H., and van Schijndel, J.: Hygro thermal simulation to predict the risk of frost damage in masonry; effects of climate change, Energy Procedia, 78, 2536–2541, https://doi.org/10.1016/j.egypro.2015.11.268, 2015.
Van Straaten, R., Trainor, P. T., and Schumacher, M. C.: Critical Freeze/Thaw Saturation Measurement of In-Service Masonry, in: Proceedings of the XIII International Conference on Thermal Performance of the Exterior Envelopes of Whole Buildings, Buildings XIII, Clearwater Beach, Florida, USA, 4–8 December 2016, 177–186, 2016.
Vandemeulebroucke, I., Calle, K., Caluwaerts, S., De Kock, T., and Van Den Bossche, N.: Does historic construction suffer or benefit from the urban heat island effect in Ghent and global warming across Europe?, Can. J. Civ. Eng., 46, 1032–1042, https://doi.org/10.1139/cjce-2018-0594, 2019.
Vandemeulebroucke, I., Caluwaerts, S., and Van Den Bossche, N.: Freeze-thaw risk in solid masonry: are “hygrothermal response based” analyses mandatory when studying the sensitivity of building envelopes to climate change?, in: Current Topics and Trends on Durability of Building Materials and Components, XV International Conference on Durability of Building Materials and Components, Barcelona, Spain, 20–23 October 2020, 67–74, https://doi.org/10.23967/dbmc.2020.070, 2020.
Vandemeulebroucke, I., Caluwaerts, S., and Van Den Bossche, N.: Factorial Study on the Impact of Climate Change on Freeze-Thaw Damage, Mould Growth and Wood Decay in Solid Masonry Walls in Brussels, Buildings, 11, 134, https://doi.org/10.3390/buildings11030134, 2021a.
Vandemeulebroucke, I., Defo, M., Lacasse, M., Caluwaerts, S., and Van Den Bossche, N.: Canadian initial-condition climate ensemble: Hygrothermal simulation on wood-stud and retrofitted historical masonry, Build. Environ., 187, 107318, https://doi.org/10.1016/j.buildenv.2020.107318, 2021b.
Viles, H. A.: Implications of future climate change for stone deterioration, in: Natural Stone, Weathering Phenomena, Conservation Strategies and Case Studies, J. Geol. Soc. London, 407–418, https://doi.org/10.1144/GSL.SP.2002.205.01.29, 2002.
Washburn, A. L.: Geocryology: A survey of periglacial processes and environments, First Edition, Edward Arnold, London, UK, 406 pp., ISBN 9780713161199, 1979.
Washburn, A. L.: Geocryology: A survey of periglacial processes and environments, First Edition, Edward Arnold, London, UK, 406 pp., ISBN 9780713161199, 1979.
Zhou, X., Derome, D., and Carmeliet, J.: Hygrothermal modeling and evaluation of freeze-thaw damage risk of masonry walls retrofitted with internal insulation, Build. Environ., 125, 285–298, https://doi.org/10.1016/j.buildenv.2017.08.001, 2017.
Zhou, X., Carmeliet, J., and Derome, D.: Assessment of risk of freeze-thaw damage in internally insulated masonry in a changing climate, Build. Environ., 175, 106773, https://doi.org/10.1016/j.buildenv.2020.106773, 2020.