 | 26 Jan 2023
Storm Kyrill and the storms of mid-January 2007: Societal and Energy Impacts in Europe
Anthony J. Kettle
January 2007 was a stormy period in Europe with impacts on societal infrastructure and implications for energy meteorology. A series of cyclones tracked across the North Atlantic and into Europe during the two week period 8–22 January 2007. For many parts of Europe, Storm Kyrill on 18 January 2007 was the most important of these for the infrastructure damage that it caused. It had the highest European storm-related insurance losses in recent history. The storm spawned a high intensity derecho that started in Germany and travelled across eastern Europe into the Black Sea region. It was associated with severe convection, lightning, several tornadoes, and strong wind gusts. The storm caused over 50 fatalities, widespread disruption of transport and power networks, and a lot of forest damage. The highest coastal water levels for the month at many tide gauge stations in northwest Europe (and also for the year, in some cases) were registered during Storm Kyrill. This contribution presents a literature review of the storm characteristics and its impacts. This is followed by an analysis of the North Sea tide gauge data to assess the storm surge, tidal variation, and short-period seiche component around the North Sea. The water level information is compared with shipping accidents and offshore incidents to assess possible links. Unusually large waves had been registered at the FINO1 offshore wind energy research platform and off the northern coast of the Netherlands only a couple of months previously on 1 November 2006. While Storm Kyrill caused a lot of societal damage on land areas, there was comparatively little coastal damage around the North Sea and few reports of offshore infrastructure damage linked to wave strikes.
- Article
(6743 KB) - Full-text XML
-
Supplement
(14540 KB) - BibTeX
- EndNote


Extreme weather is a major contributing factor to most cases of wind turbine collapse. The database review of Ma et al. (2018) reveals that more than half of wind turbine collapses occur during typhoons and storms. Environmental conditions are implicated in most other incidents including blade failure, material fatigue arising from repetitive loading in a turbulent environment, and lightning strikes. Across the accident database, typhoons represent the most important cause of wind turbine collapse, with single storm events in south and east Asia causing the collapse of tens of wind turbines in extreme cases (Ma et al., 2018). While the extratropical winter storms of Europe are not as intense as tropical cyclones, the wind speeds of winter storms can exceed the threshold of a category 1 hurricane (Diamond, 2012). Turbines do collapse at onshore wind farms, though these tend to be rare, isolated events. For offshore wind energy in Europe, additional threats have been identified, including waterspouts (Dotzek et al., 2010) and rogue waves (Rosenthal et al., 2011; Pleskachevsky et al., 2012). While extreme environmental conditions are infrequent, their cumulative impact may be significant across the full 20 year lifetime of a turbine. As highlighted by the case of hurricane encounter rates and turbine survivability in the US (Rose et al., 2012), extreme wind events on long time scales must be taken into account when assessing the economic viability of wind energy projects. Given the importance of storms for wind energy infrastructure, it is illustrative to analyze major winter storms for their general impact on societal infrastructure and on wind energy in particular. Storm case studies highlight the spatial and temporal patterns of extreme environmental conditions and also the failure modes of engineered structures. For northern European winter storms, high winds and gusts are important for onshore societal infrastructure, although storm surges are important in coastal regions, and rogue wave strikes may be important offshore.
Europe was impacted by a sequence of damaging storms in the middle of January 2007. The trajectories of these storms are shown in Fig. S1.1 in the Supplement. The storm sequence started with Storm Dieter on 8 January 2007. (The storm names used in this contribution have been assigned by the Free University of Berlin, except where otherwise noted). This was followed by Storm Franz on 11–12 January 2007, which was characterized by high winds between Ireland and Poland and was known particularly for offshore fatalities off the southeast coast of Ireland and the English Channel. Storm Gerhard occurred next, and it was followed by Storm Hanno (also known as Storm Per by the meteorological services of Norway and Sweden) on 14 January 2007. Storm Hanno was serious for southern Norway (Kvamme, 2007) and southern Sweden where it was classified as a 50 year wind event (SMHI, 2009). It had significant impacts including fatalities, power outages, and forest damage. Storms Ikarus and Juergen came next in the sequence. These were followed by Storm Kyrill, which was the most serious storm of the period and is presented with more detailed information below. The storm sequence ended with Storm Lancelot, which was noted for its maritime impacts, including the threat of coastal flooding at some places in north-western Europe. The low pressure centres followed a similar trajectory across North Atlantic, which was determined by the fixed position of the Jet Stream at the time. The storms travelled in a type of conveyor belt, spaced about two days apart, with a new storm entering the storm track on the western side of the Atlantic at the same time as the preceding storm culminated in Europe (Pinto et al., 2014). The occurrence of the storm sequence may be linked with the record high northern hemisphere surface air temperatures during the winter of 2006–2007 (Rückversicherung Aktiengesellschaft, 2007; Lloyds Casualty Week, 2007b; Met Eireann, 2007; Rosenorn, 2007). The January 2007 storm sequence was comparable with previous storm clusters in January–March 1990 and December 1999 (Pinto et al., 2014), which were both associated with positive European winter temperature anomalies.
Storm Kyrill on 18–19 January 2007 was chosen as a case study relevant for offshore wind energy because it occurred only a few months after Storm Britta on 31 October–1 November 2006, an event known for North Sea rogue wave strikes and offshore infrastructure damage (RWS, 2006; Petroleum Safety Authority Norway, 2007; Magnusson et al., 2008; Pleskachevsky et al., 2012). A literature overview is presented of the storm damage onshore, including energy impacts, transportation networks, and fatalities. This summarizes a more comprehensive set of thematic tables for the storm in Sect. S19 in the Supplement. A more detailed analysis of the tide gauge network around the North Sea is conducted to characterize the storm surge and shorter period water fluctuations that may be linked to rogue wave events. Tide gauges are the focus of the analysis because there is a high density of instruments around the North Sea. Wave recorders, by contrast, are fewer in number and may have digital filters in place that remove the largest waves (Magnusson, 2009; Christou and Ewans, 2011). High waves and sea state have been a problem for offshore petroleum since the start of development in the North Sea in the late 1960's (Kvendseth, 1988). However, in the mid-2000's offshore wind energy was at the start of a growth phase, and the nature of the wave damage being encountered was a surprise (Neumann and Nolopp, 2007). The contribution follows other overview reports for Storm Anatol in December 1999, Storm Britta in November 2006, Storm Tilo in November 2007, and Storm Xaver in December 2013 (Kettle, 2018, 2019, 2020, 2021).
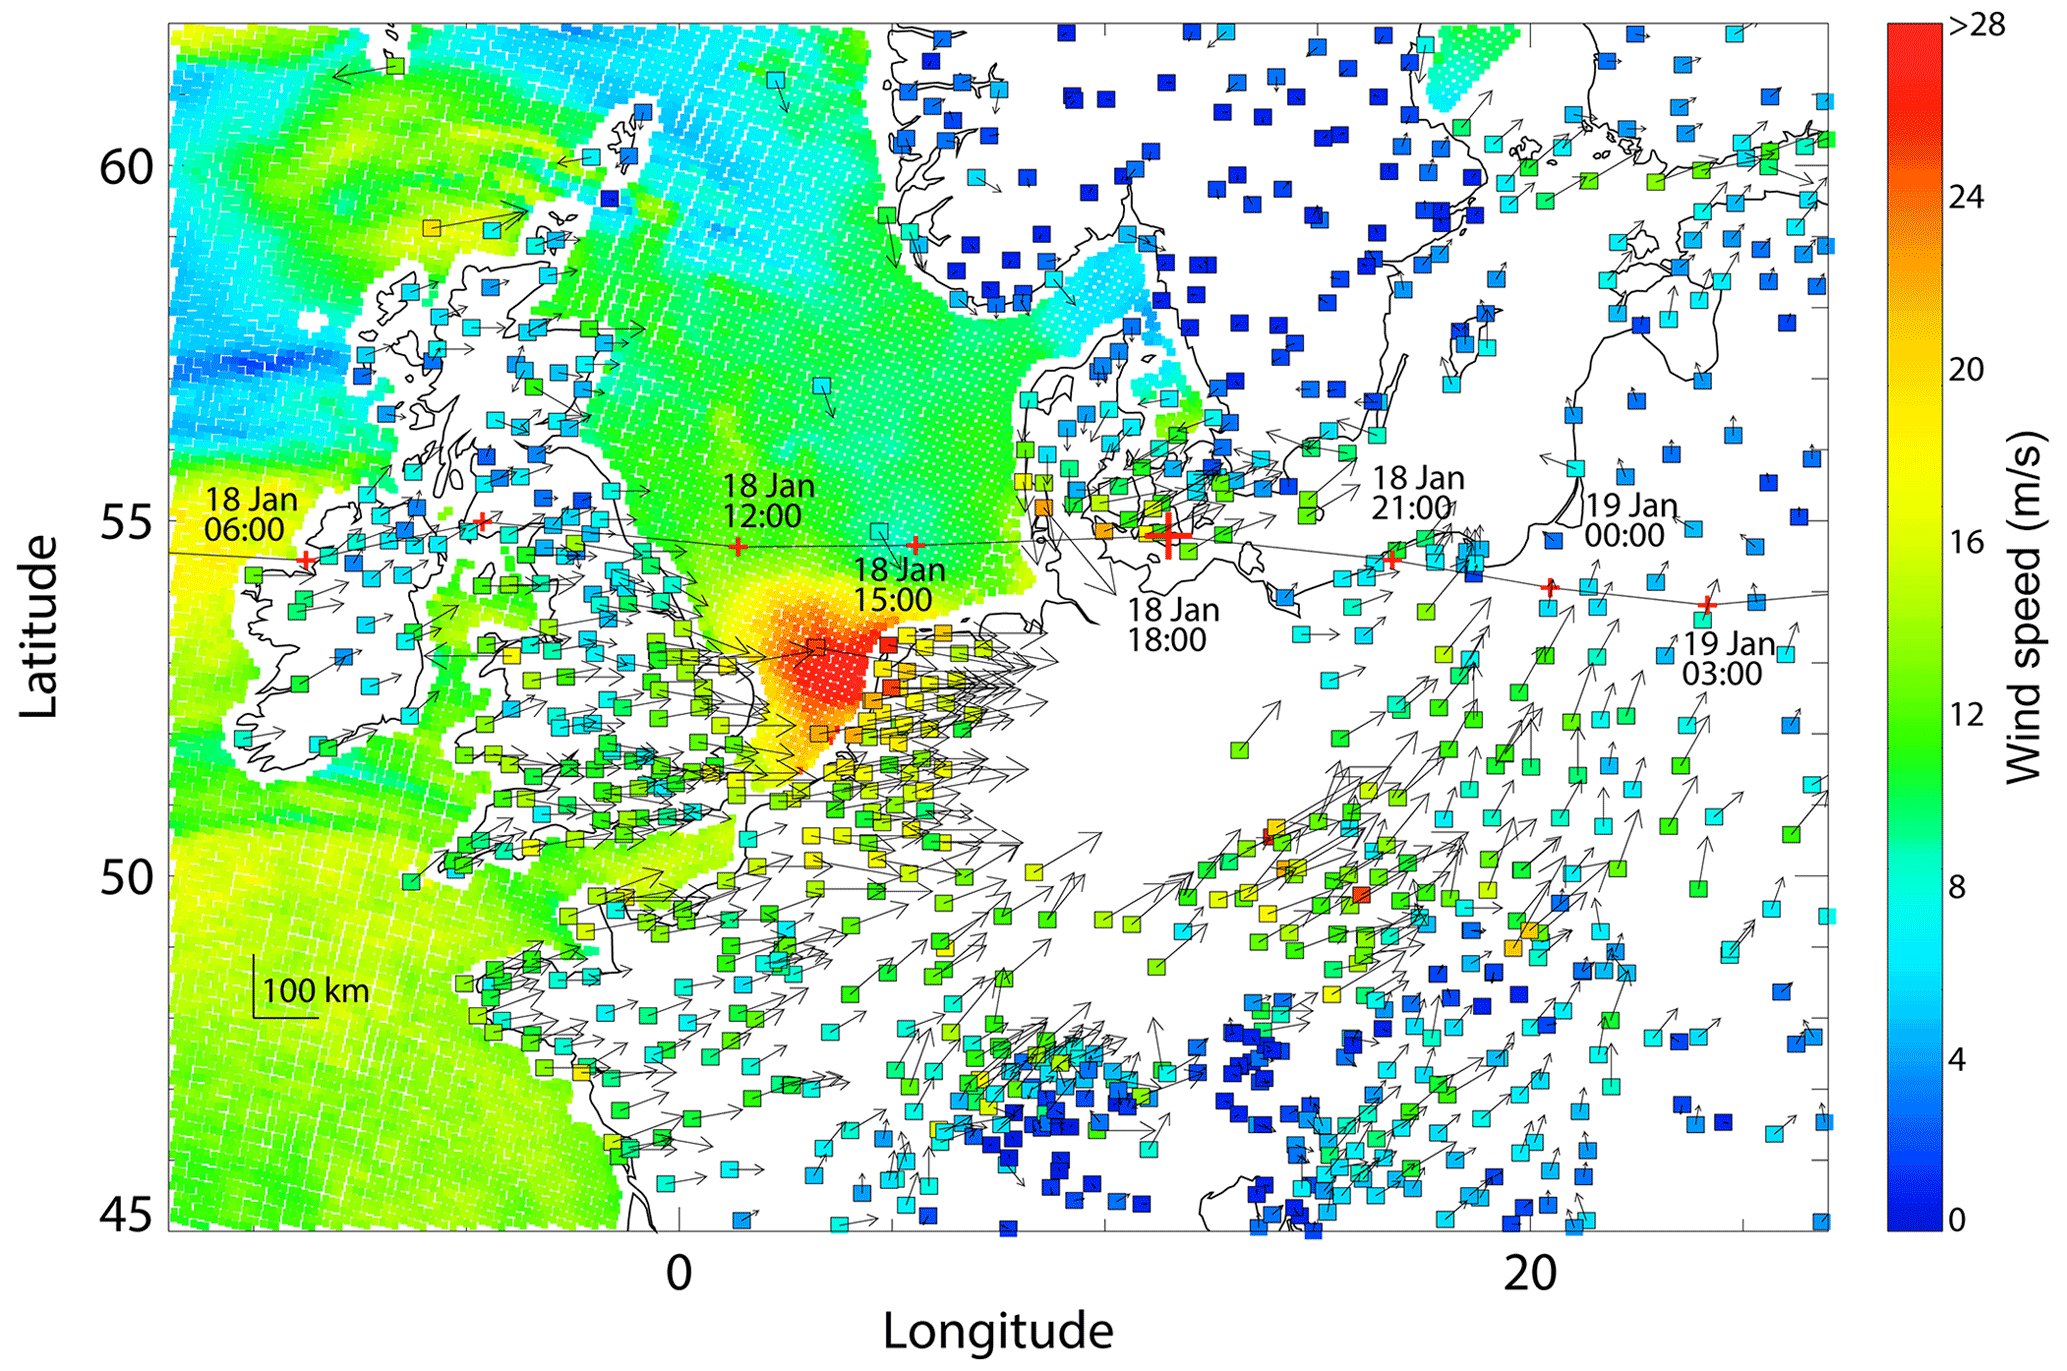
Figure 1Wind speed and direction for Storm Kyrill at 18:00 UTC 18 January 2007 from selected stations of the USAF data set. The trajectory of the low pressure centre is indicated by the black line with red crosses at 3 h intervals (Roberts et al., 2014; XWS, 2023). The location of the pressure centre at the time of wind field is shown by a larger cross. QuikSCAT sea surface wind speeds are shown for a satellite overpass at about 19:10 UTC or ∼ 70 min after the synoptic station reports.
Storm Kyrill was tracked from its point of deepening in the western Atlantic days in advance of its arrival in Europe (Deutsche Rückversicherung Aktiengesellschaft, 2007; Tetzlaff, 2007; Fink et al., 2009; DWD, 2012). The storm was actually composed of two pressure centres. The first (Kyrill I) moved eastward across the western Atlantic. In the eastern Atlantic, a second pressure centre formed in front of the first (Kyrill II) and continued its journey across Europe. The Kyrill II low pressure centre moved across northern Ireland, northern England, the middle of the North Sea, Denmark and the southern Baltic region. The low pressure culminated over Denmark with a minimum of 965 hPa (Müller-Westermeier, 2007). The trajectory was one of the most southerly of the sequence of storms of January 2007 (see Fig. S1.1). The highest wind field on the right hand side of its trajectory impacted populated areas of southern England, the Netherlands, Germany, Czech Republic, Austria, and Poland. The wind field covered a greater spatial extent and was more intense than typical winter storms because of the high meridional pressure gradient across Europe at the time (Müller-Westermeier, 2007). Damaging winds occurred from Ireland to Russia on a wide latitudinal swath from the southern North Sea and Baltic Sea to the Alps. Figure 1 shows a map of the surface wind field at 18:00 UTC on 18 January 2007 at the time when many wind-related damage incidents were occurring in central Europe. Figures S2.1 to S2.9 show maps of the near surface wind at 3 h intervals between 18 January 2007 06:00 UTC and 19 January 2007 06:00 UTC when the storm was passing across northern Europe. The early evening overpasses of the QuikSCAT satellite registered strong westerly winds in the southern North Sea soon after the low pressure centre had crossed Denmark (Figs. 1, S3.3 and S3.4). Patchiness in the spatial wind speed fields was evident in the western North Sea. This may indicate inhomogeneity in the travelling convective gust field that has been linked to rogue waves in certain circumstances (Pleskachevsky et al., 2012). The morning overpass of the QuikSCAT satellite on 18 January 2007 revealed the presence of the approaching storm to the northwest of Ireland (Fig. S3.1).
Wave measurement records from January indicate that the high wave field for Storm Kyrill only developed in a relatively limited area in the southernmost part of the North Sea, south of the track of the low pressure trajectory (Figs. S4.1 and S4.2). Other storms during the month had a higher wave field covering a larger part of the North Sea. Part of the reason that the wave field was not higher for Storm Kyrill was that the westerly winds had a limited fetch across the North Sea (Behrens and Günther, 2009). However, the westerly winds were also associated with warm air temperatures and stable atmospheric conditions (as revealed in the FINO1 meteorological record of Neumann, 2007), and the mechanical energy transfer from the atmosphere to the ocean was limited.
Radiosonde data show high upper tropospheric wind speeds >80 m s−1 during the storm for stations in central and western Europe and south of the latitude of Denmark (Figs. S5.1 to S5.6). For certain stations, high wind speeds, far above the hurricane threshold of 32 m s−1, penetrate below 5 km height in the troposphere. These may give an indication of the source of the surface gusts and wind damage reported during the storm. Although not reported in the literature, the storm would have been remarkable for continuing the trend of extreme upper air wind speeds >80 m s−1 that had started after 1996 (DWD, 2000).
Reports from the storm period noted intense rainfall and convection activity with rain band features apparent in weather radar images. There were a series of tornadoes in Germany, Poland and the Czech Republic (Fig. 2). Scientific investigations afterward identified that a derecho – an intense travelling squall line – started in eastern Germany and travelled across eastern Europe into the Ukraine (Gatzen et al., 2011). The wind speed animation in the online Extreme Wind Storms Catalogue (http://www.europeanwindstorms.org, last access: 10 January 2023) indicates that the gust front may have moved into the eastern Black Sea.
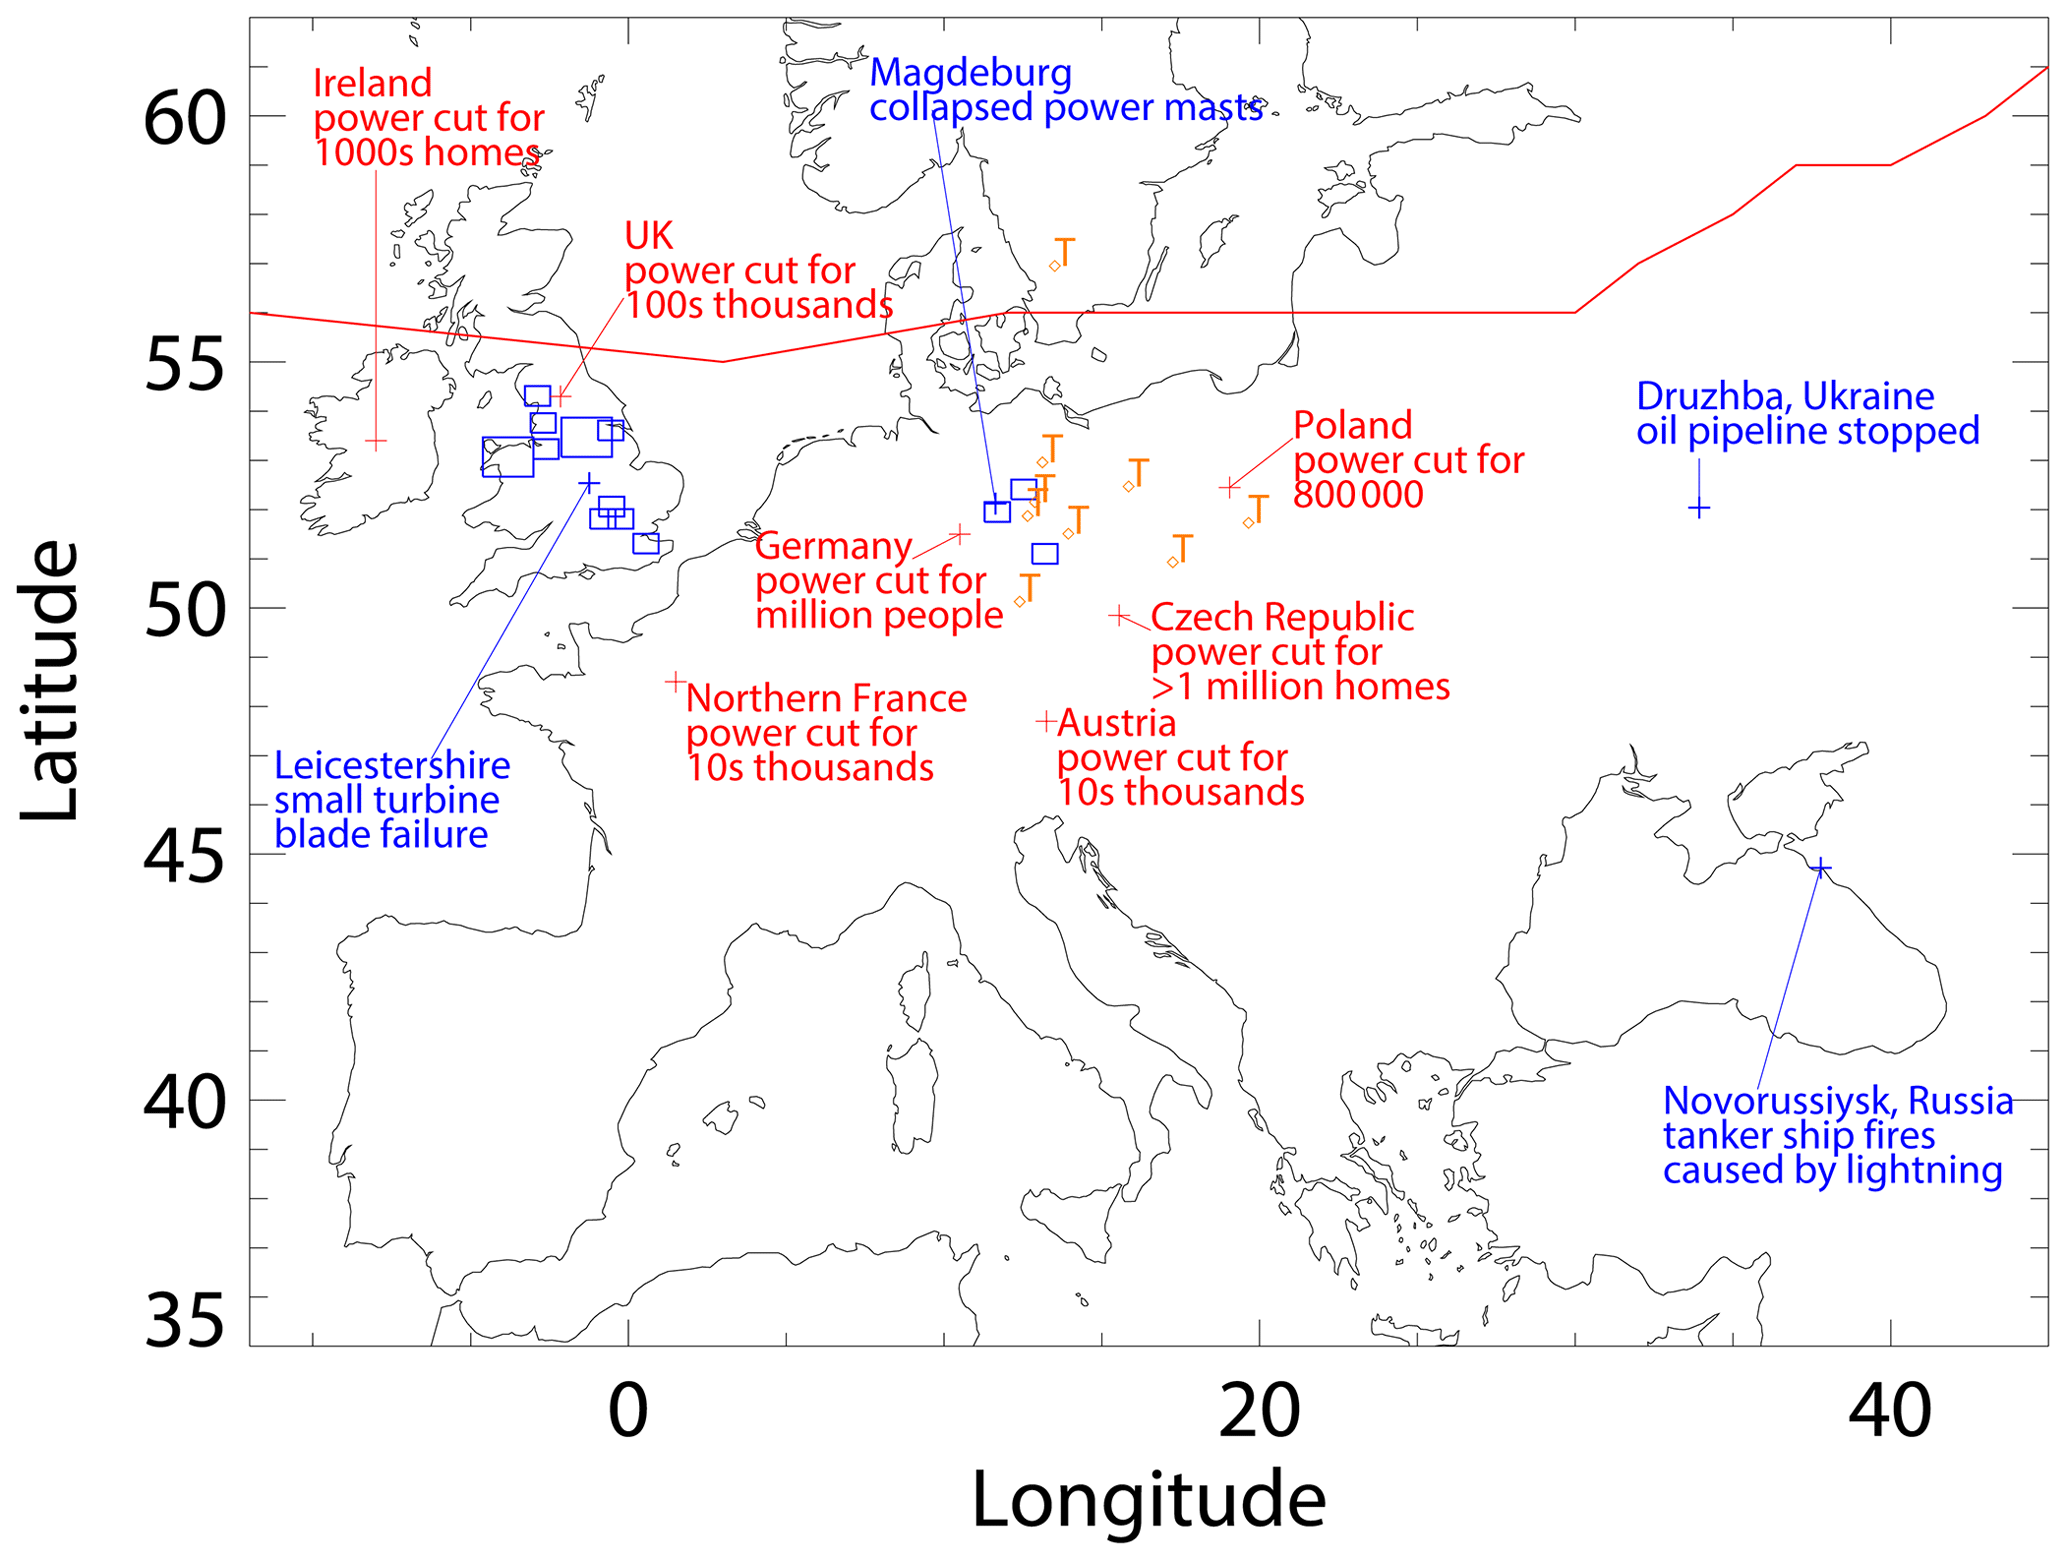
Figure 2Thematic map of power outages, wind turbine incidents, and interruptions of oil supply infrastructure that were reported in the literature for Storm Kyrill 18–19 January 2007. The trajectory of the low pressure centre is given by the red line. Country reports of power cuts are given in red font. Power cuts for counties and states are presented with blue squares. Energy impact incidents are labelled in blue font. Tornado occurrences are marked with an orange T symbol.
The storm had significant impacts on societal infrastructure. These are summarized in a series of thematic maps for power outages and other energy related impacts (Figs. 2 and S6.1), air transport impacts (Fig. S6.2), port incidents and interruptions (Fig. S6.3), ferry cancellations (Fig. S6.4), rail transport interruptions (Fig. S6.5), road transport interruptions (Fig. S6.6), damage to buildings and monuments (Fig. S6.7), forest damage (Fig. S6.8), and fatalities (Fig. S6.9). Most of the information compiled in the maps has been taken from online media reports and other Internet sites (e.g., Wikipedia, 2022). The European Severe Weather Database (https://eswd.eu, last access: 10 January 2023) provides additional information on the storm impacts, most notably the occurrence of tornadoes and compilations of ground transport interruptions and building damage in central and eastern Europe. These are summarized in additional maps in Sect. S7. Media reports tended to focus on the highest profile events, and there were incidents that highlighted the extraordinary intensity of this storm. Millions of people between Ireland and Russia were affected by power outages from fallen transmission lines. There were some petroleum infrastructure impacts with power loss to a pumping station in the Ukraine halting the flow of oil in a pipeline to Europe (Lloyds Casualty Week, 2007b; Wikipedia, 2022). Cases of ship fires from lightning strikes at the oil port of Novorussiysk in the eastern Black Sea (Lloyds Casualty Week, 2007b) may have been linked with the derecho that started in Germany. Air transport was quite heavily impacted with hundreds of cancelled flights at airports across Europe. The train network in Germany was shut down for the first time in its post-World War II history (DW, 2007b). The train network in the Netherlands was also closed, and in both countries tens of thousands of passengers were stranded at rail stations. Rail interruptions and route closures were reported for the UK, but these were not as extensive as in Germany and the Netherlands. The Eurostar train service to London-Brussels-Paris was affected with cancelled services. Road transport was impacted by fallen trees and the overturning of high-sided trucks in the strong winds. Ferry transport was also shut down in northern Europe, and commercial port operations were affected at some locations (Lloyds Casualty Week, 2007b). There was a lot of building damage during the storm, and the highest profile cases were the main train stations in Berlin and Amsterdam, airport terminals serving Amsterdam and Warsaw, and a museum in Cologne where a Roman mosaic was damaged (DW, 2007a; Deutsche Rückversicherung Aktiengesellschaft, 2007). There was extensive commercial forest damage across Europe with the largest losses reported for Germany and the Czech Republic (Gardiner, 2010). There were approximately 50 fatalities in storm related accidents. These were mostly due to road accidents that were linked to the large number of fallen trees, but some fatalities occurred during building collapse or at construction sites (Wikipedia, 2022).
In contrast with the damage that took place on land, offshore damage was comparatively minor. The most serious maritime accident took place in the English Channel when a large container vessel, MSC Napoli, developed large hull cracks amidships soon after a strong wave event. It had to be abandoned and was towed to the south coast of England where it was intentionally grounded to prevent sinking (Lloyds Casualty Week, 2007a, b; MAIB, 2008). A potentially dangerous storm surge was forecast for the North Sea, but the actual water levels were lower than expected (NLWKN, 2007b; Jensen and Müller-Navarra, 2008). A few storm surge protective barriers were closed during the storm (NLWKN, 2007b; RWS, 2007, Environment Agency, 2018). Only minor coastal erosion in the German Bight was reported during Storm Kyrill (NLWKN, 2007b), much less than Storm Franz from the previous week (NLWKN, 2007a). Figure S8.1 shows coastal erosion along the west coast of Sylt between 15 September 2006 and 25 January 2007, encompassing the period of Storm Kyrill. More than 100 m of coastal cut back was registered at certain places during the ∼ 4 month period, although this would have been mostly due to the worst maritime storms: Storm Britta 31 October–1 November 2006 and Storm Franz 11–12 January 2007.
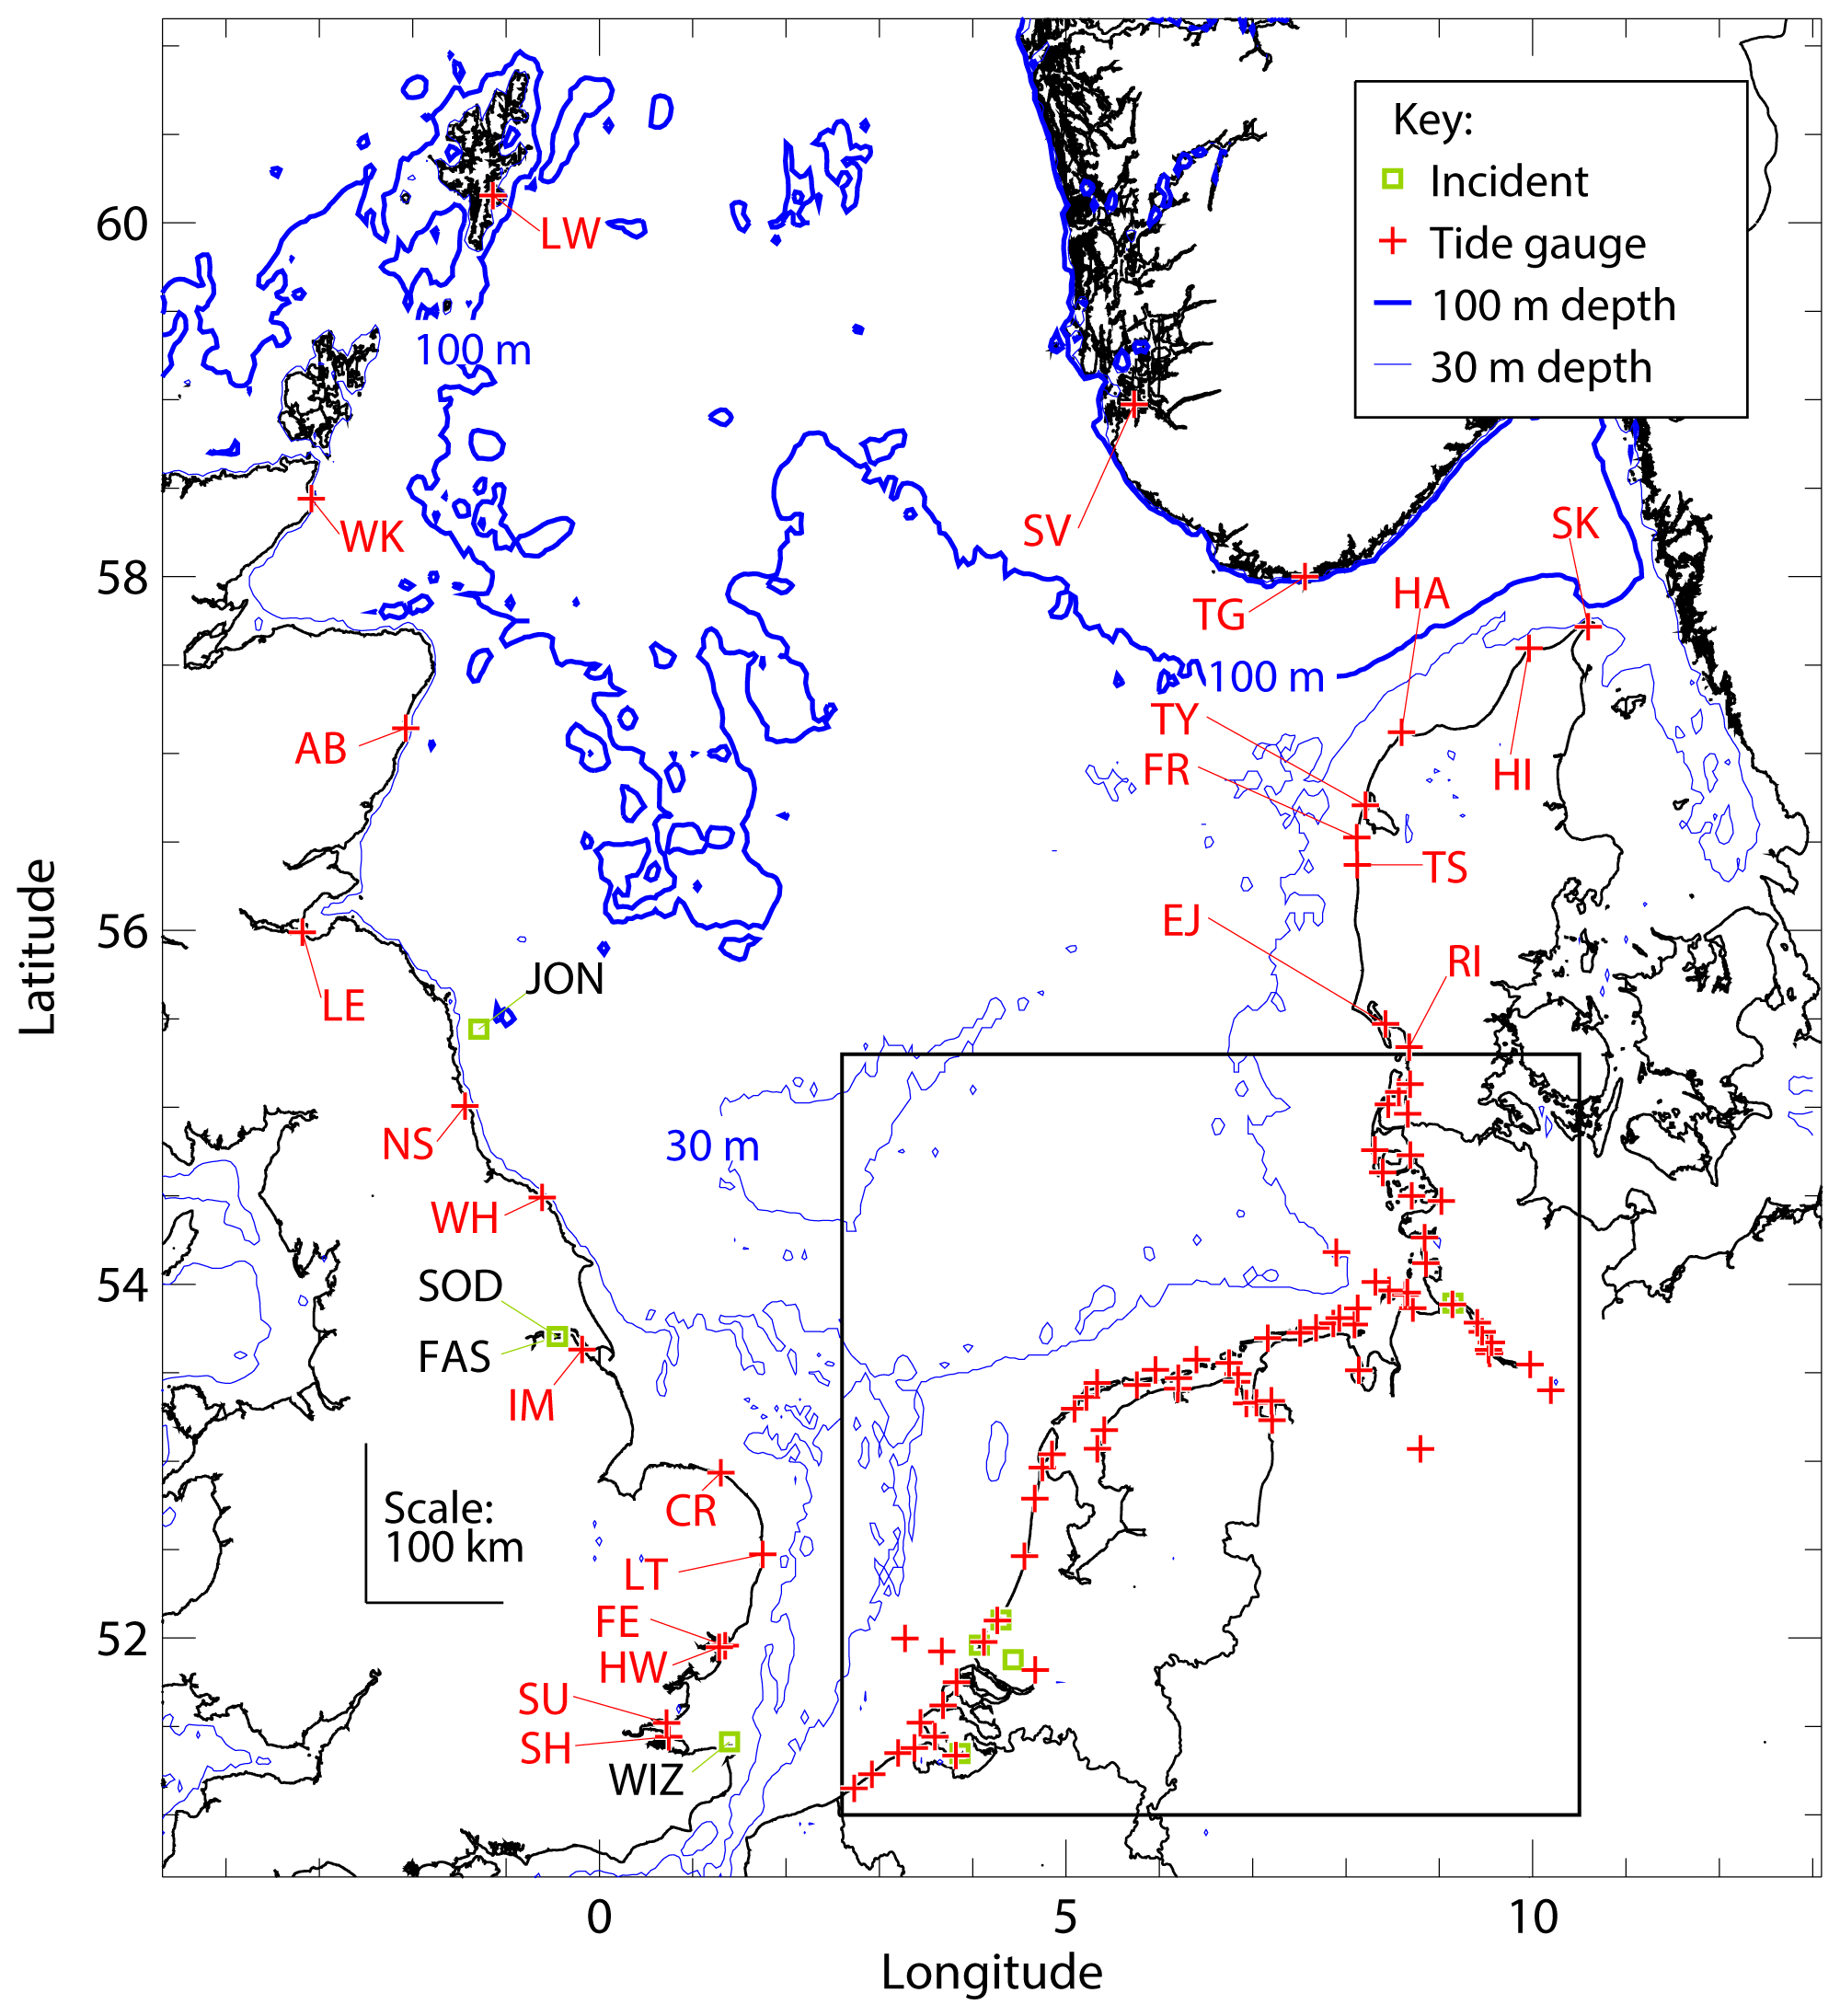
Figure 3Location of tide gauges analyzed in this study and of North Sea maritime incidents that were reported over the 2 d period 18–19 January 2007. For presentation clarity, the information in the inset box covering the south eastern North Sea is shown in Fig. 4. The abbreviation codes for the tide gauges and maritime incidents are explained in Tables S9.1 and S14.1.
Water level data from tide gauges around the North Sea are analysed to trace the progress of the storm surge and to investigate the short period component of water level variation that may be linked with meteo-tsunamis or infragravity waves. The same procedure was followed as in the previous storm investigations of Kettle (2018, 2019, 2020, 2021) with minor modifications. For the North Sea, water level variations are dominated by the tidal component. The tidal wave enters over the top of Scotland and propagates as an along-shore Kelvin wave counter-clockwise around the basin, passing the coasts of England, the Netherlands, Germany, Denmark, and Norway in succession. The presence of amphidromic points in the basin complicates tidal features and creates shifts in tide arrival times mainly for the Belgian coast, as well as accounting for large (e.g., Cromer, German Bight) and small (e.g., northern Denmark) tidal ranges at certain locations. The tide must be modelled and subtracted from the measured water level time series to isolate the surge residual, which may be larger than the tidal range for bad winter storms (Pugh, 1987). The surge residual originates from high winds forcing water onto a leeward coast, from the possible effect of a travelling external surge entering the North Sea over Scotland, and from the rise of water under the storm low pressure area (i.e., inverted barometer effect).
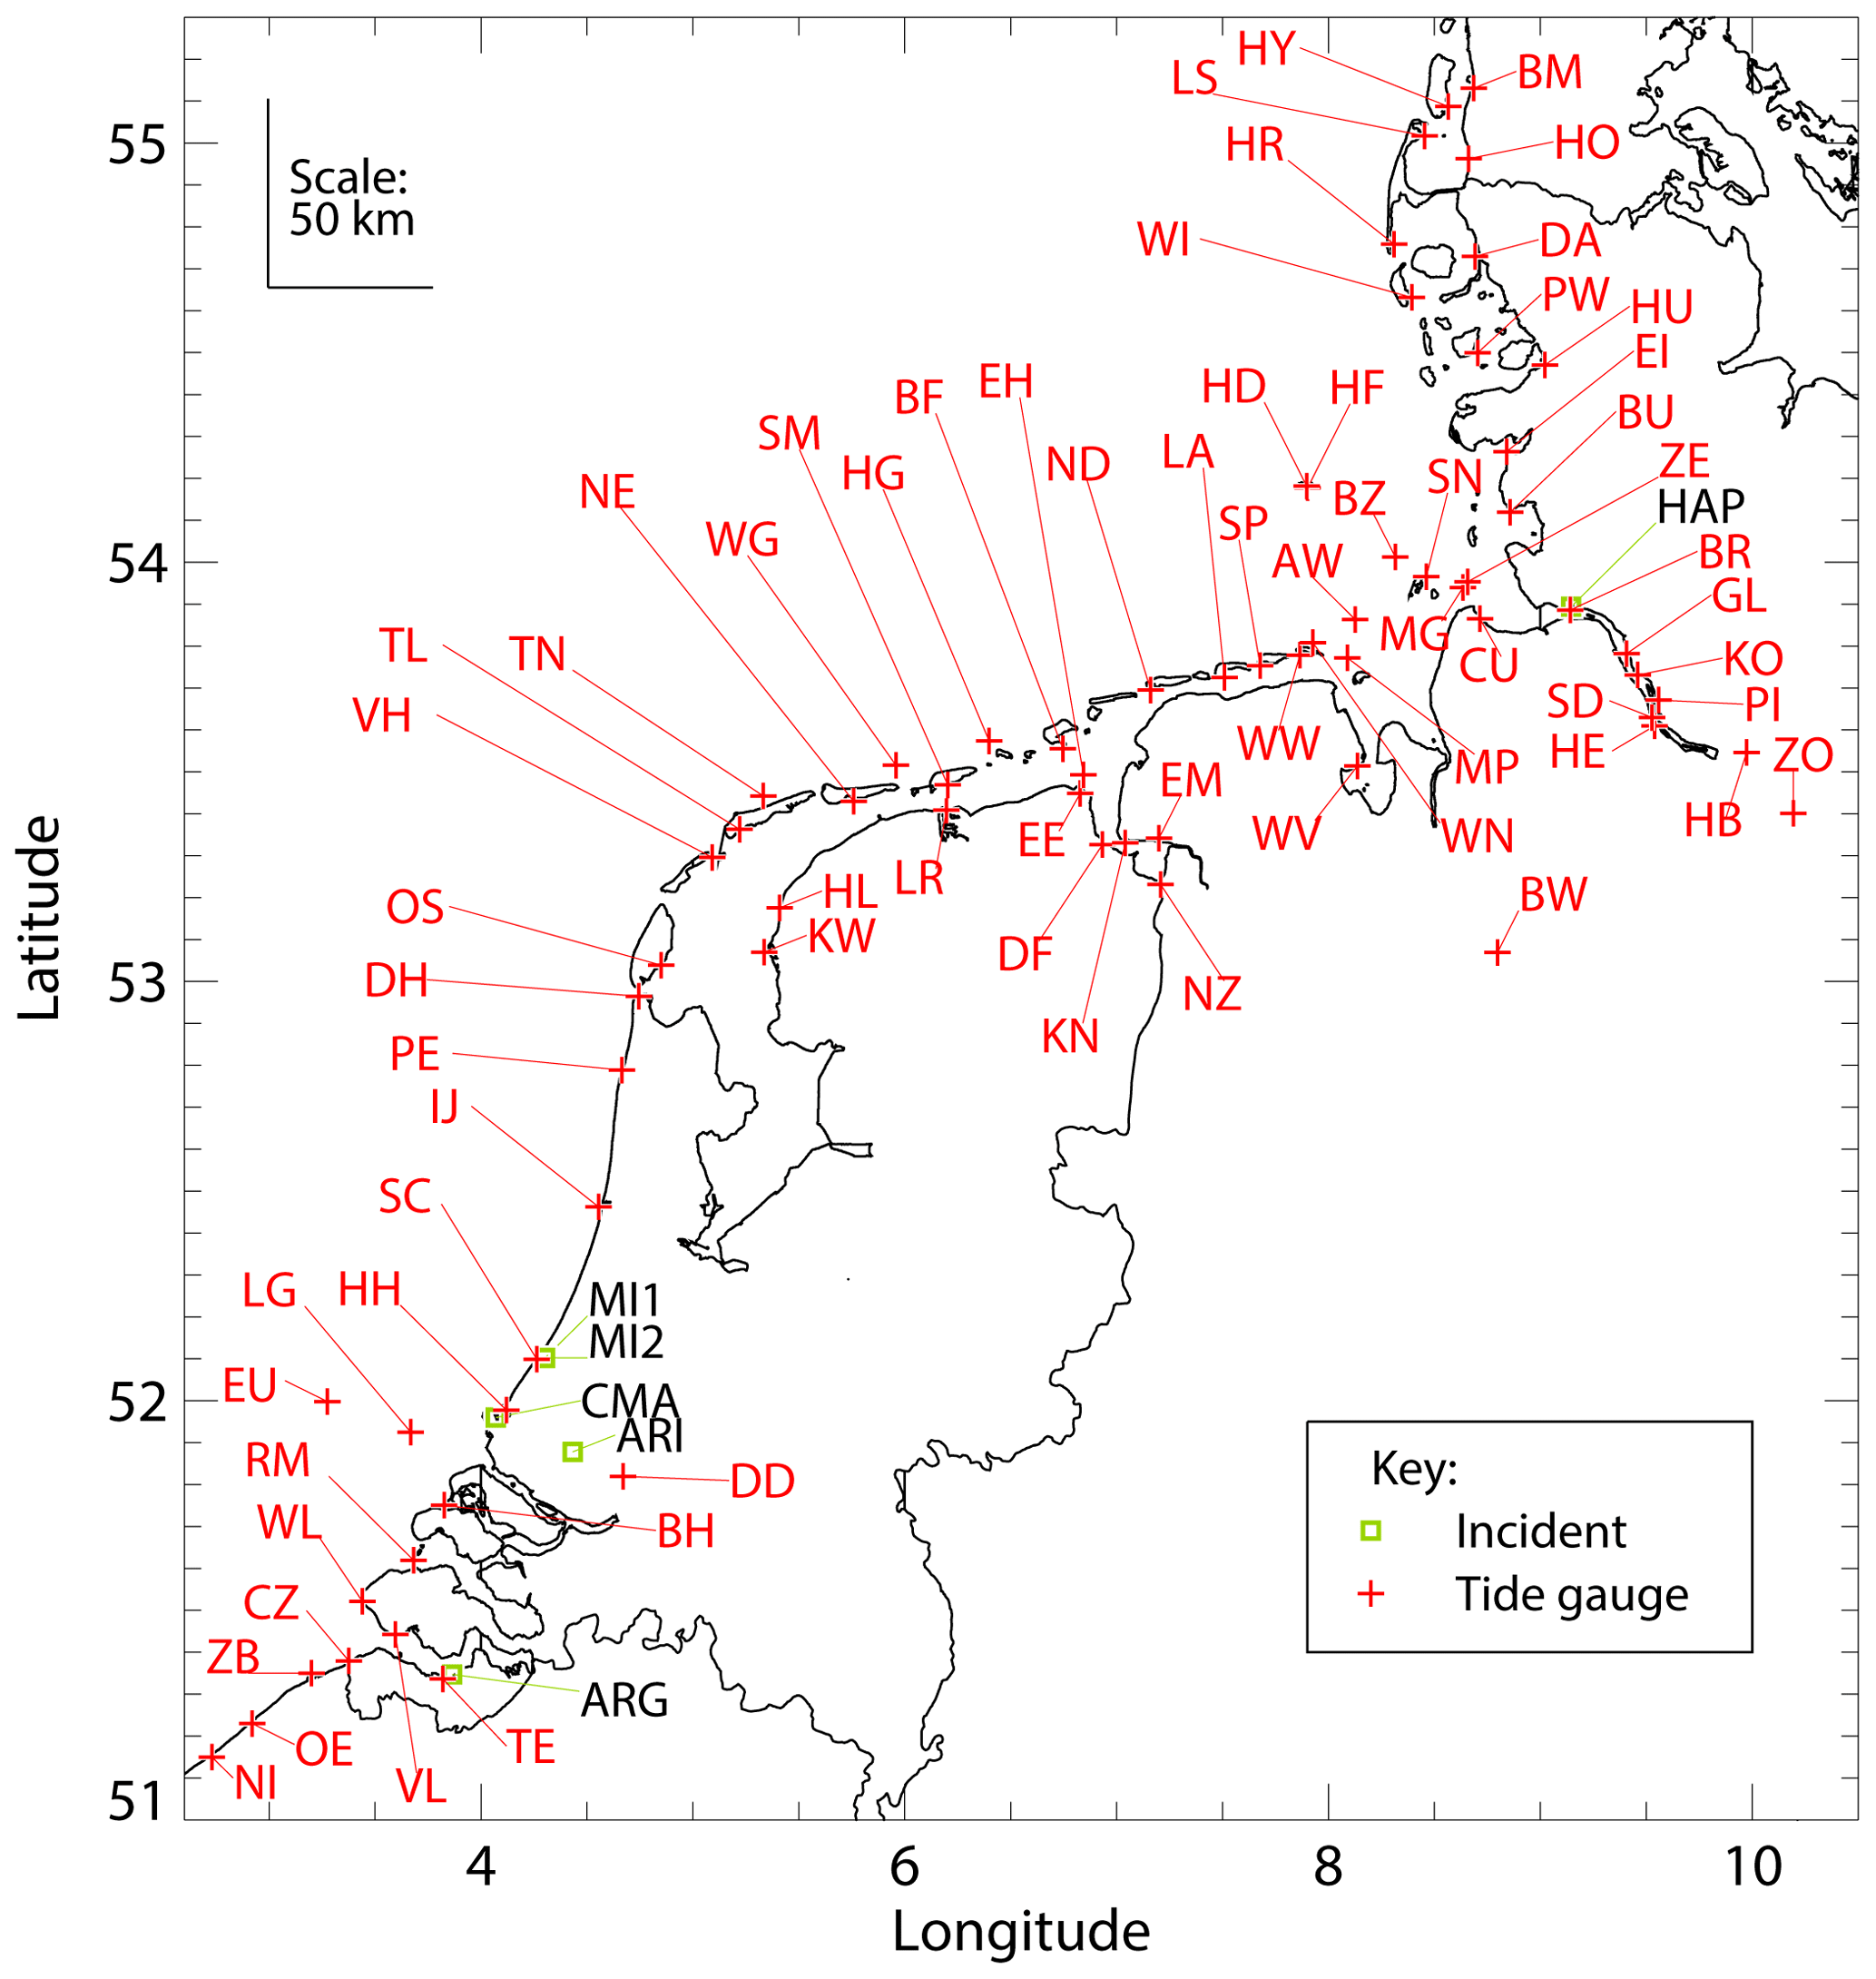
Figure 4Location of tide gauges and maritime incidents along the North Sea coasts of the Netherlands, Germany, and southern Denmark. The abbreviation codes for the tide gauges and maritime incidents are explained in Tables S9.1 and S14.1.
The data to investigate the surge originate from the national water level monitoring agencies of the UK, Belgium, the Netherlands, Germany, Denmark, and Norway. The data have been downloaded from public websites, except for the data from Germany (emailed by Wilfried Wiechmann of the Bundesanstalt für Gewässerkunde BAFG), three tide gauge data sets from northern Denmark (emailed by Bjørn Frederiksen of Kystdirektoratet), and the UK station at Southend (emailed by Victoria Grobler of the Environment Agency). The water level recorders of most of the national authorities are at locations that show tidal variations. For the Netherlands and Germany, the water level databases of the national authorities include both coastal and inland sites, and the stations for the current project were selected on the basis if they showed a tidal signal. The source and key characteristics for the data sets are shown in Table S9.1 in the Supplement. The water level data from the various agencies had different temporal resolutions: UK 15 min, Belgium 5 min, the Netherlands 10 min, Germany 1 min, Denmark 10 min, and Norway 10 min. The 1 min data set from Germany was averaged onto a standard 10 min grid. Data sets with time discretizations of 5, 10, or 15 min were used without modification. Preliminary checks were made to ensure that there were no extended data gaps or data irregularities across the 16 d period (from 8–23 January 1999, inclusive) encompassing the storm period. A list of the rejected stations is presented in Table S9.2. For the UK (BODC stations), Belgium, Germany, and Norway, the retained stations had no data gaps. For the UK Environment Agency gauge at Southend, there were multiple single point data gaps of duration not longer than 15 min. For the Netherlands, the water level stations had data gaps of 10–30 min duration except for Dordrecht (100 min data gap). For Denmark, most of the retained tide gauge records contained data gaps usually not longer than 10 min. Data gaps less than 2 h were linearly interpolated so that complete data arrays were available for the spectral analysis, described below. Altogether, 93 stations were used in the analysis after this quality control, and these are shown on the maps in Figs. 3 and 4.
A spectral analysis technique was used to separate the water level time series into different components corresponding to the long period (mostly storm surge), short period (mostly harbour seiche or meteo-tsunami), and tidal (diurnal plus semidiurnal, combined) contributions. The analysis follows similar tide gauge studies of Gönnert et al. (2004) and Kettle (2018, 2019, 2020, 2021). A discrete Fourier transform was used to convert the detrended time series data into a power spectrum (Stull, 1988), similar to the example for Aberdeen in Fig. 5. (The power spectra for other stations along the east coast of the UK are shown in Fig. S10.1. Also spectra for 2 week data segments across the entire period of 2007 are shown in Figs. S11.1–S11.3 for the three Belgian stations to illustrate the difference between storm and non-storm conditions.) The spectral plots were used to empirically assess the frequency thresholds for the different water level components. Figure 5 shows the narrow bands that were used to clip out the diurnal (∼ 24 h) and semidiurnal (∼ 12 h) tidal components from the long-period water level reconstruction. The 0.2 d threshold was chosen to separate the long-period and short-period reconstructions. This choice of threshold is similar to previous studies that have aimed to isolate meteo-tsunami signals in water level data showing a strong tidal component (Monserrat et al., 2006; Pattiaratchi and Wijeratne, 2015).
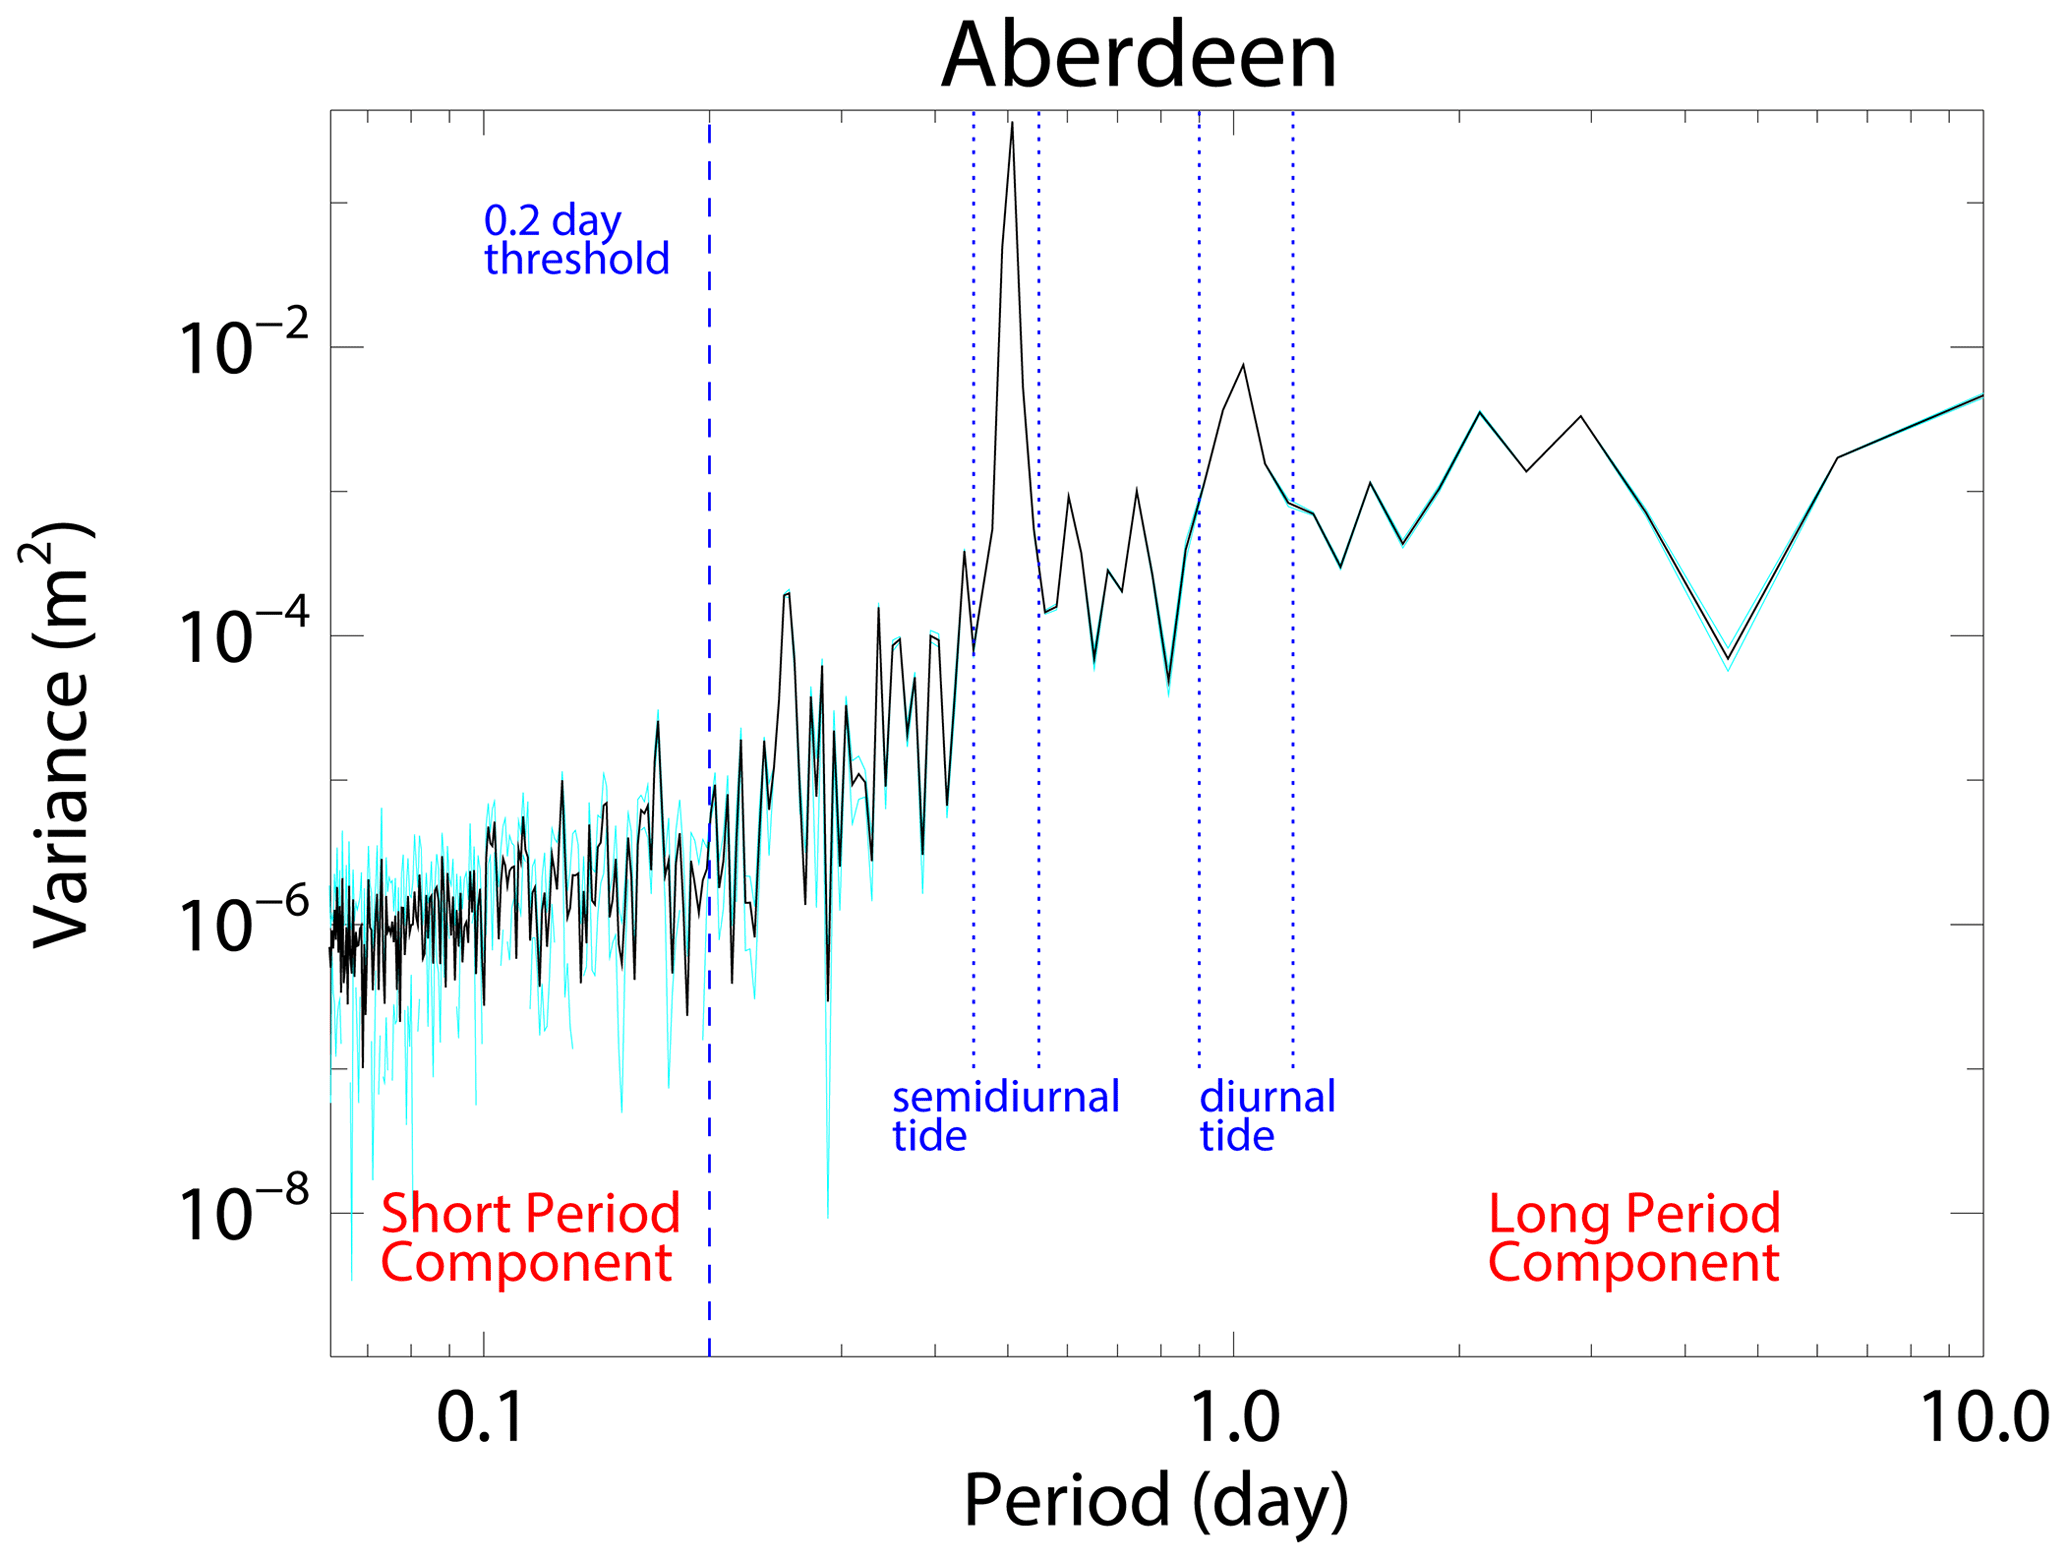
Figure 5Sample spectrum of water level for Aberdeen across the 16 d period 8–23 January 2007. The 0.2 d threshold separating the short period and long period components of the time series reconstructions is shown, as well as the thresholds defining the diurnal and semidiurnal components that were used to de-tide the time series. The uncertainty in the spectrum (light blue line) was calculated as the standard deviation of three spectra derived from re-sampling the time series at every third point.
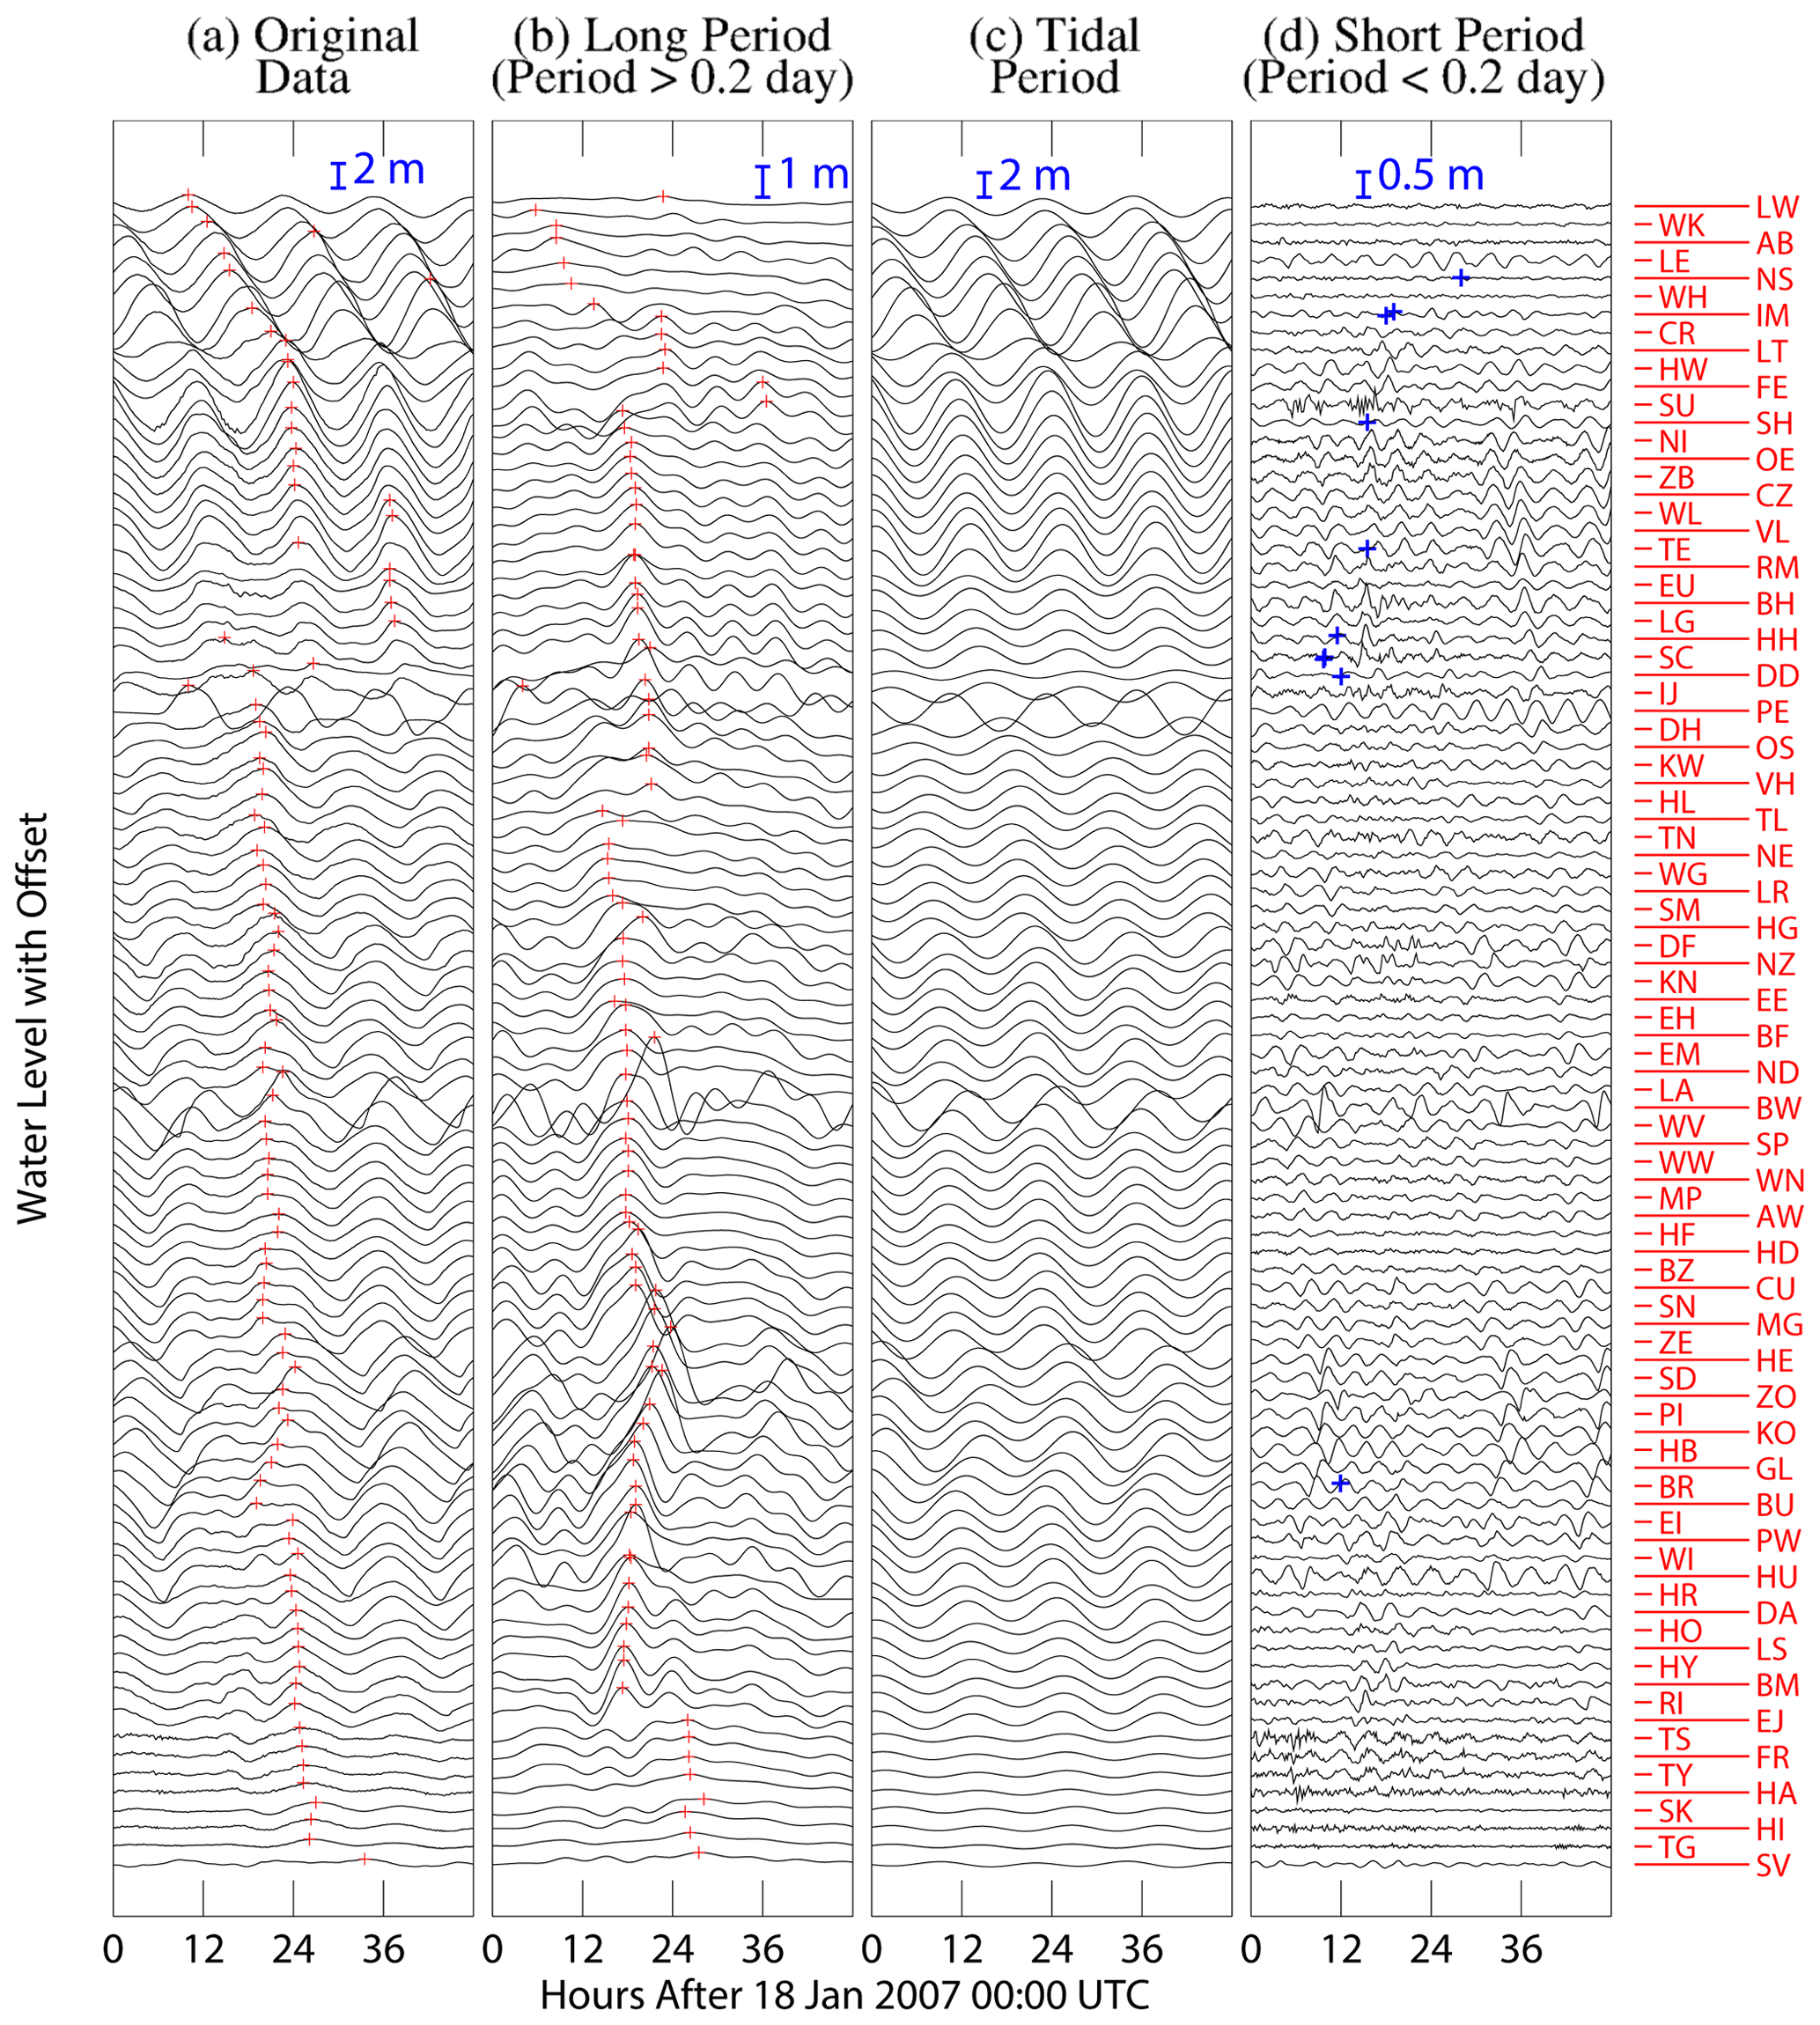
Figure 6Time series of the (a) original water level data, and reconstructions of the (b) long period, (c) diurnal plus semi-diurnal tide, and (d) short period components of the original time series. The station identifications are given by two letter codes along the right hand side of (d). The stations have been vertically offset according to their relative arrangement counter-clockwise around the North Sea, starting from Lerwick in Scotland at the top and ending with Stavanger in Norway at the bottom. Blue vertical crosses mark the time of maritime incidents at the closest tide gauge station. Red vertical crosses indicate the maximum of the data segment shown.
The potential levelling issue among the tide gauge water levels that was raised by Kettle (2021) was unresolved in the present study. The issue concerns the difference in average water level calculated directly from the 16 d data sets and the official sea level that is reported for each tide gauge. The bias seems to be similar for the stations within a country collection, so that the biases for the tide gauge stations for the UK, for example, are similar to each other but different from Germany or Denmark. Figure S12.1 gives more information about the problem. Only the three Belgian tide gauge stations appear to show consistency in the average water level data across the 16 d period in January 2007 and the reported sea level. Bradshaw et al. (2016) presents background information to understand the zero level of the UK tide gauges and how this relates to mean sea level in 2007 from the NTSLF annual tide gauge report (Bradshaw, 2007). For the UK, the reference zero for mainland tide gauges is Ordnance Datum Newlyn (ODN), which is the average sea level at Newlyn in the period 1915–1921. Because of sea level rise, average tide gauge water levels are expected to be about 20 cm higher in 2007 (see Fig. S13.1). Land elevation changes from glacial isostatic rebound introduce a second order effect of a few centimetres for stations in the extreme north and south of the country. However, the pronounced ∼ 20 cm offset for stations mostly in the northern UK compared with the south may be a legacy of a levelling error in a surveying campaign from the early 20th century, which was intended to establish a common geoid reference level for all the tide gauge stations. The zero level convention used by other countries is less clear, but Denmark has modified its reference levels a couple of times in recent decades and additionally uses a convention to report surge heights versus a shifting baseline to take account of sea level changes (Ditlevsen et al., 2018). For the present investigation, values of skew surge and true surge are adjusted upward by the amount of their apparent sea level inconsistency to compare with literature reports. An additional adjustment was made for the German literature skew surge reports to account for difference when skew surge is calculated using long term average high water (i.e., the convention in Germany) versus the nearest high water at the time of the storm. Figures S12.2 and S12.3 illustrate the impact of these corrections for the true surge and skew surge in comparison with literature values.
A short database of maritime incidents was compiled to compare with largest events in the short period reconstruction of the water level time series (i.e., with characteristic periods <0.2 d). These were gathered mostly from Lloyd's Casualty Week (2007b), and supplemented with information by email contact from the Netherlands KNRM service. For many of these reports, weather and wave conditions are mentioned, usually to clarify the circumstances of the incident or complications in recovering a marine casualty. Sometimes, the maritime accident is attributed directly to the weather (e.g., large wave sweeps off deck cargo). More often, a mechanical failure is reported without mention of the environmental conditions, although from the time and location it is known that it is in the middle of a significant storm. Most the maritime incidents could be located precisely in latitude and longitude, and fairly precisely in time. Altogether, 10 maritime incidents were identified in the North Sea. The location of these is shown in Figs. 3 and 4 with additional information in Table S14.1.
The results of the water level analysis are shown in Fig. 6 for the full set of the tide gauge stations. The time series are arranged in order of counter-clockwise placement around the North Sea starting from Lerwick in Scotland with vertical offsets for presentation clarity. This arrangement was chosen because the tides and external storm surges travel as coastally trapped Kelvin waves, entering the North Sea across the top of Scotland and then passing along the coasts of England, the Netherlands, Germany, and Denmark in succession. However, this arrangement produces an order of water level events (storm surge and wind waves) which is different if the high westerly winds of this storm were the causal mechanism. This competing influence between the tide/external surge and wind may be important for interpreting some features of the water levels in the southeast corner of the North Sea. The panel in Fig. 6a shows the original time series with the maximum water levels indicated. The long period component of the time series is shown in the second panel (Fig. 6b), also with the maximum levels indicated. It is difficult to identify a single important external surge starting in Scotland and travelling southward along the east coast of England during this storm. Instead, there appears to have been two coherent travelling surges: one travelling between East Anglia in England and the central part of the Netherlands coast and a second that is offset 6–12 h earlier in time for the north Netherlands coast, German Bight, and southern Denmark. For this second event, the arrangement of the peaks indicates a surge travelling eastward along the north Netherlands coast and southward along the Danish coast to converge in the German Bight. The tidal component is shown in Fig. 6c, and it reveals that the semi-diurnal tide is prominent in most stations with its peak about every 12 h.
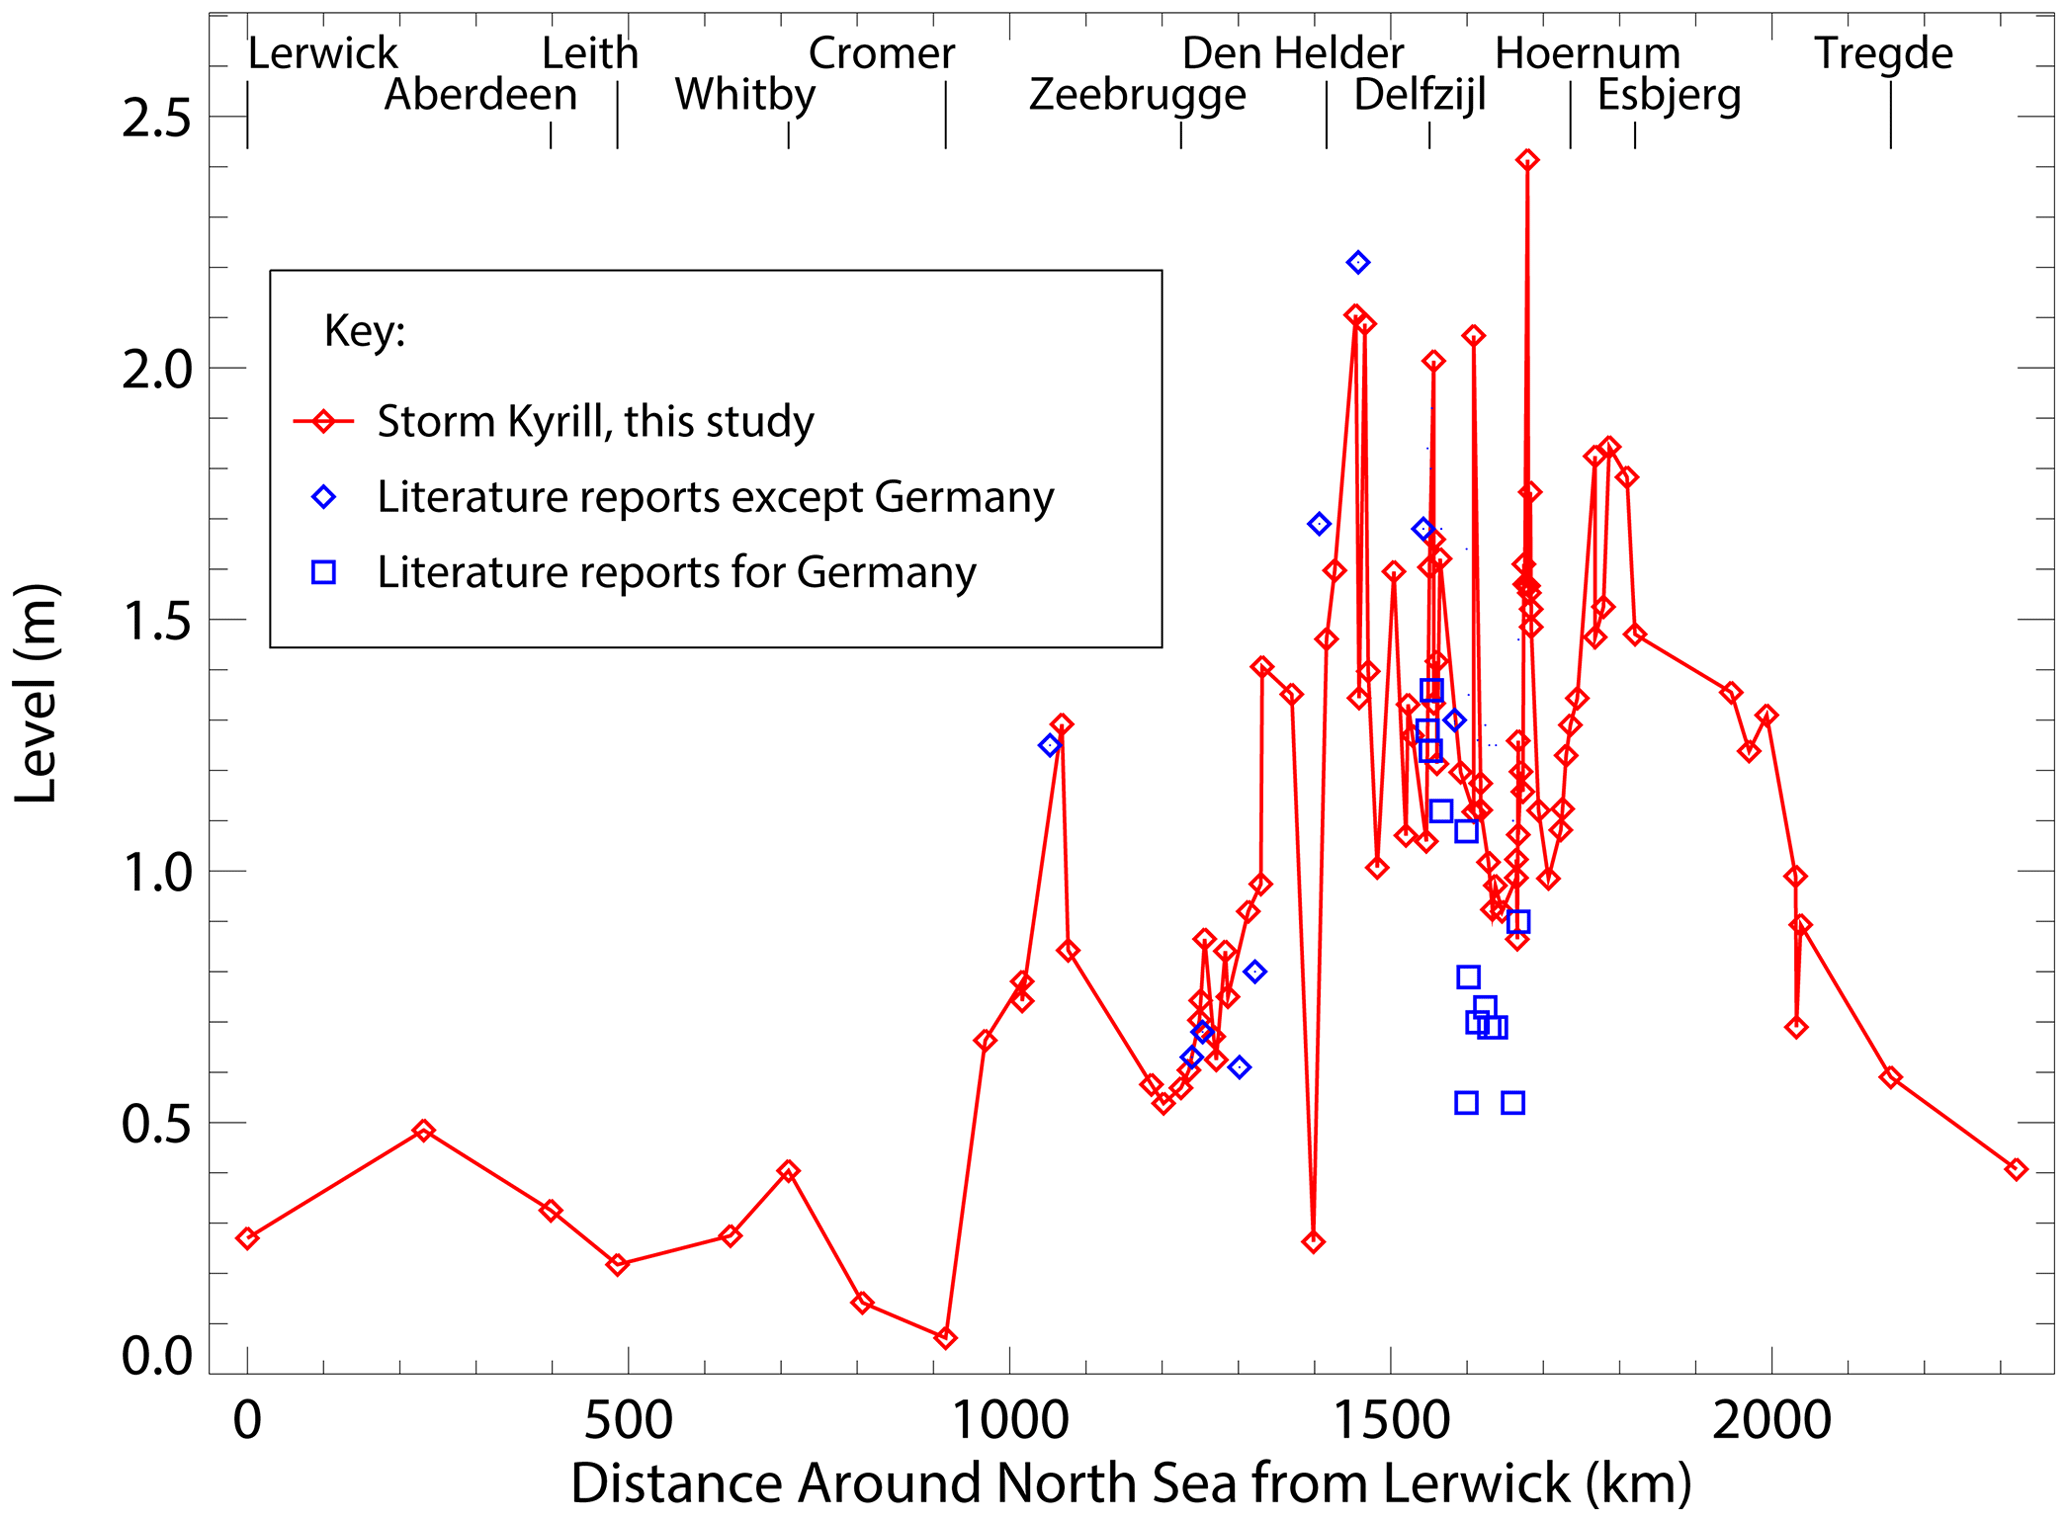
Figure 7Skew surge during storm Storm Kyrill on 18–19 January 2007. The values are calculated from tide gauge records and arranged by counter-clockwise distance around the North Sea starting from Lerwick in Scotland. Literature reports are included for comparison.
The short period component of the water level measurements is shown in Fig. 6d. Many stations show oscillations, although the zero crossing periods vary. While most oscillations appear to have periods >1 h, for some stations in northern Denmark the oscillation period is so short that the time series resembles noise. For the present storm, there appears to be a spatial clustering of certain groups of stations based on the short period behaviour. In particular, several neighboring tide gauges on the eastern side of the German Bight and along the coast of Denmark show a sudden onset of oscillations in the afternoon of 18 January 2007, as if they are initiated suddenly by a single forcing event. For each station, a statistical analysis of the oscillations was conducted following the conventions used for high resolution recordings of wind waves. The sequence of oscillations was separated according to the zero-crossing times, and an assessment was made of the zero-crossing wave period, minimum/maximum amplitude, and oscillation range. The maximum oscillation range was identified, and the stations were ranked according to this value. The maximum range was about 93 cm for Bremen Grosse Weserbrücke in Germany in mid-morning of 18 January 2007. Eleven stations had maximum ranges greater than 50 cm during the 2 d storm period. These are located along the coast of Germany and the Netherlands, and the maximum oscillation events occur mostly during mid-morning on 18 and 19 January 2007. The maximum ranges of ∼ 31 cm at Hanstholm and Thyborøn in northern Denmark are noteworthy because they were associated with a short duration oscillation <1 h in contrast with most other stations. Tables S15.1 and S15.2 give a complete list of the maximum ranges and amplitudes of oscillations for all stations around the North Sea, together with ancillary information. Figure S15.1 presents the maximum amplitude versus distance around the North Sea from Lerwick, highlighting its spatial characteristics with peaks in the southern North Sea.
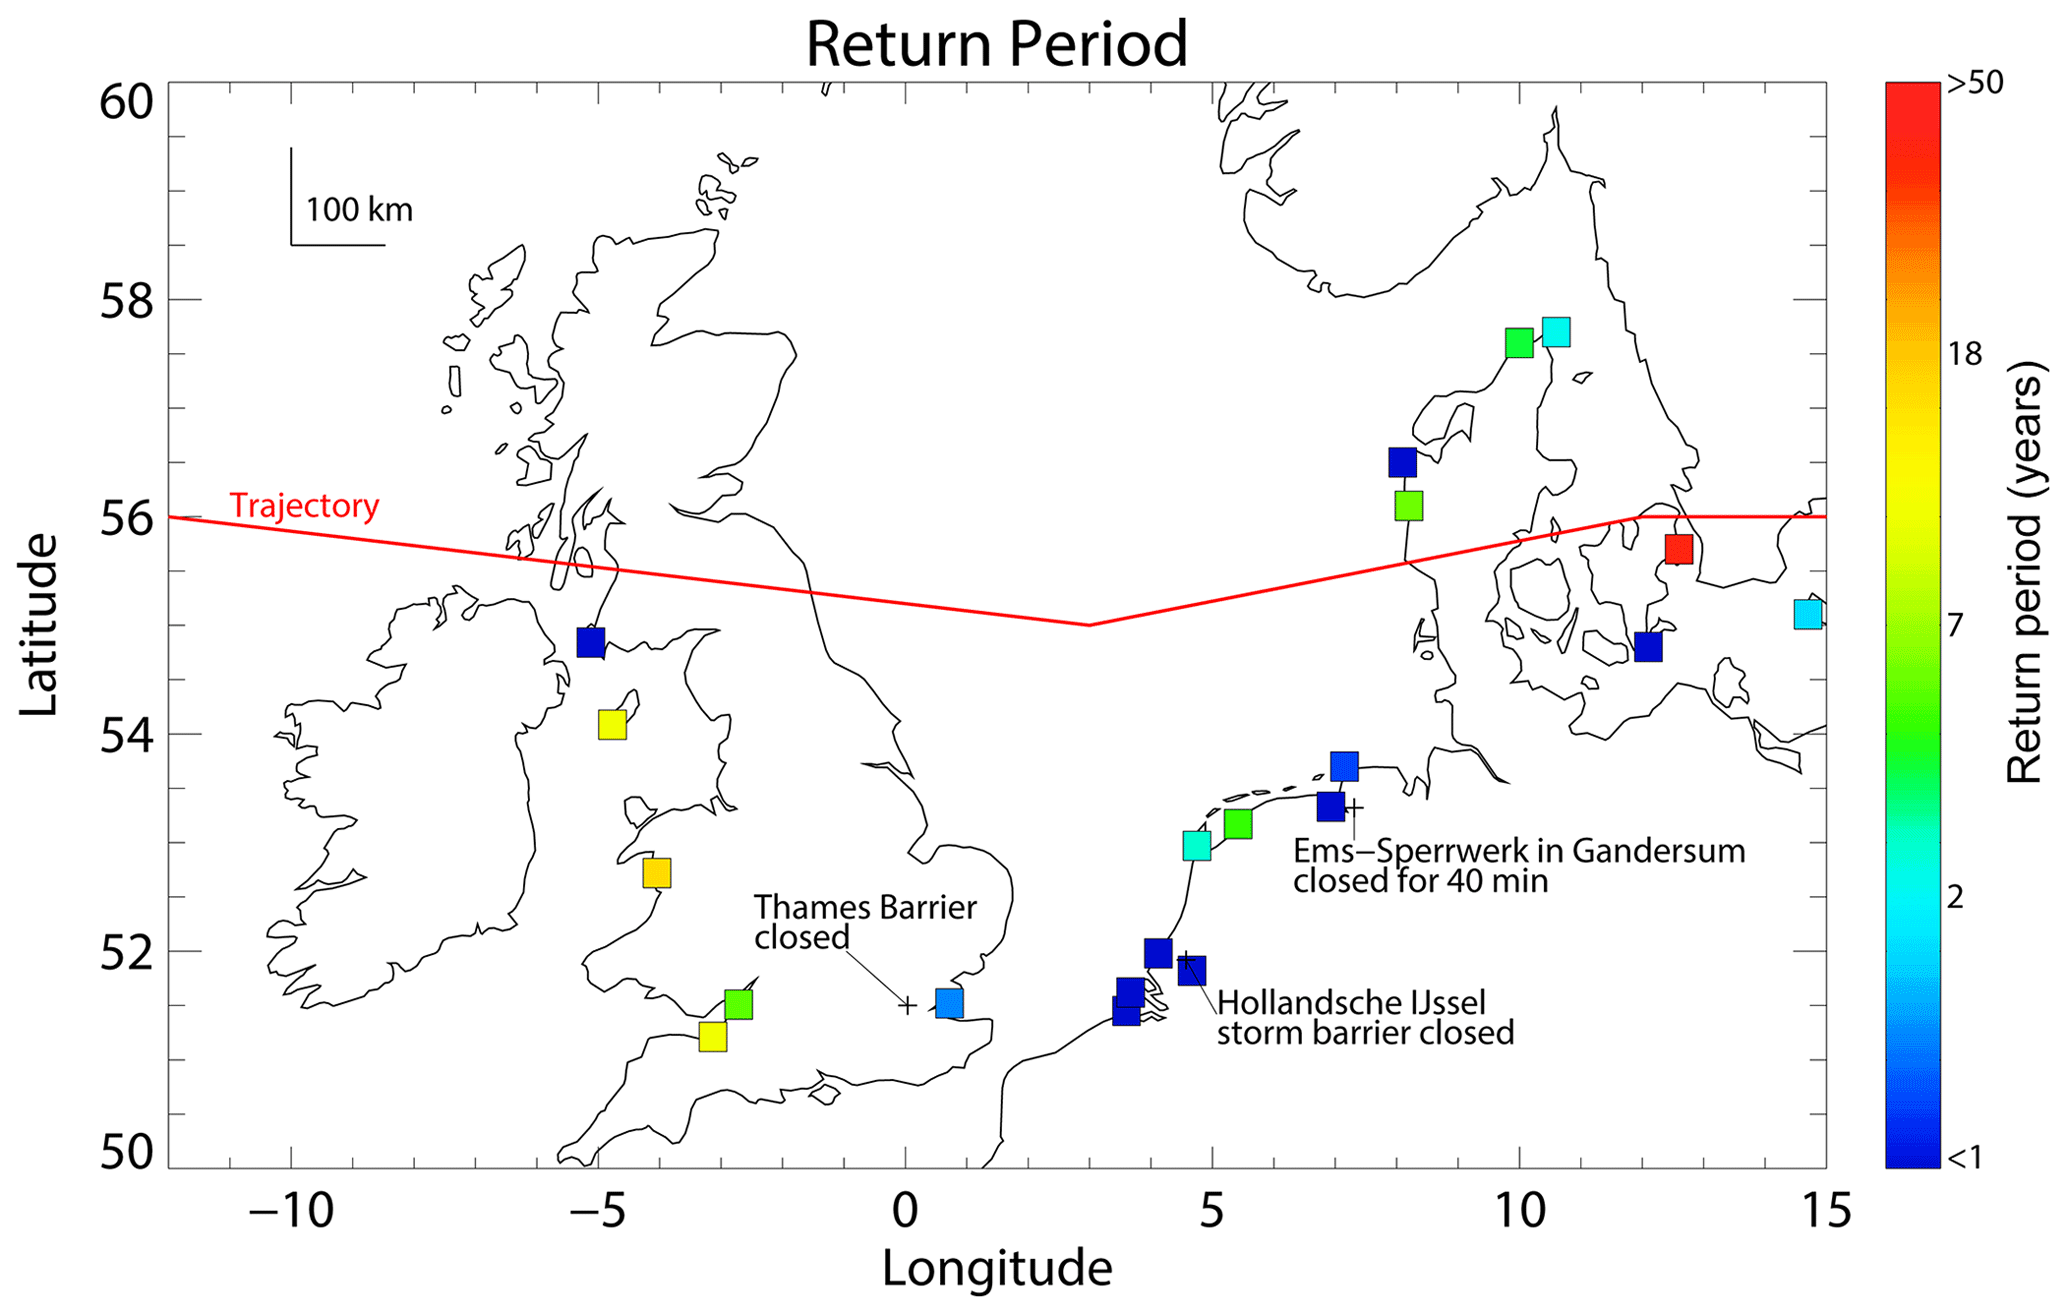
Figure 8Return period of maximum water level during Storm Kyrill 18–19 January 2007, as calculated from literature summary results. Surge barrier closures are indicated by text.
The highest skew surge for tide gauge stations around the North Sea is shown in Fig. 7 for the results of the present analysis and the literature reports. Skew surge is the most common way that storm water levels are presented in the media, and it denotes the difference between the maximum measured water level and model predictions of the expected high tide. There are large differences in the skew surge values around the North Sea, with stations in the northern Netherlands and German Bight >2 m in some instances. The original tide gauge data for Germany, which were recorded at one minute intervals, give an indication of shorter period dynamical features that may be masked by longer sampling intervals of normal tide gauge records. Figures S16.1 and S16.2 of the Supplement show the range of water levels over 10 min intervals for different locations around the North Sea coast of Germany. Values are generally larger in the southeast corner of the German Bight, compared with stations further north and west along the coast. The highest value >35 cm was registered at the tide gauge at Bremen Grosse Weserbrücke at the mid-morning on 18 January 2007. The water level progression at this station is different from Storm Anatol in 1999 (Kettle, 2021). The gauge is located quite far up a tidal river, and the results might point to a type of resonance or tidal bore effect if instrument malfunction could be ruled out.
The significance of the skew surge levels shown in Fig. 7 is placed in a historical context by expressing absolute water levels in terms of their return period of recurrence. This requires a data base of past storm surges or at least a report of the last time that a given water level was exceeded. For cases where there is no precedent of an extreme measured water level within the measurement record, statistical extrapolation techniques are used to derive a return period. The return periods of water level for Storm Kyrill are shown in Fig. 8. This map has been constructed from different sources that are given in Table S17.1. The return periods of maximum water level were mostly <20 years with several significant reports along the west-facing coasts of the UK. Copenhagen had an anomalously high water level with an associated return period of >40 years, which was confirmed in two Danish government reports (Sørensen et al., 2007; Ditlevsen et al., 2018). This may reflect an inverted barometer effect as the low pressure centre of the storm passed close overhead. Other storm surge contributions are less likely. Wind set-up contributions to the surge – which are important in the North Sea – are unlikely for Copenhagen because of its sheltered location facing the Baltic Sea to the east. Likewise, a Baltic Sea seiche can be ruled out because no other Danish Baltic Sea stations had comparable water levels.

Figure 9Summary of the progression of the tidal crests and storm surge peak around the North Sea on 18–19 January 2007, and spatial-temporal relationship of peak-to-trough range of the highest up-crossing short period oscillations in the tide gauge record and maritime incidents/accidents. The data are plotted on axes of time versus counter-clockwise distance around the North Sea starting from Lerwick in Scotland.
Figure 9 shows the crests of the tidal wave and storm surge plotted on axes of time versus counter-clockwise distance around the North Sea (see also Fig. S18.1 for a simplified graph of this information). For Storm Kyrill, Fig. 9 indicates that the storm surge peak followed the approximate trend of the tidal peaks. However, there were phase shifts along different sections of coast (see also Fig. 6) so that the surge peak became associated with at least two and perhaps three different travelling tidal cycles in the North Sea. In general, the surge peak travelled in a counter-clockwise direction around the North Sea, except on the eastern side of the German Bight where the travelling direction appears to be southward (clockwise). There was a strong westerly wind in the southern North Sea during Storm Kyrill, and this pattern may reflect differences in timing of the wind field or the southward passage of a squall line. The apparent travelling characteristics of the surge peak for Storm Kyrill shows broad similarity with Storm Anatol in 1999 (Kettle, 2021) which had a similar trajectory across the central North Sea. By contrast, Storms Britta (2006), Tilo (2007), and Xaver (2013) had more northerly trajectories, and their associated storm surges followed the tidal cycles more closely (Kettle, 2018, 2019, 2020).
The timing of the extreme short period oscillations and maritime incidents/accidents are plotted on the same axes of time versus counter-clockwise coastal distance around the North Sea also in Fig. 9 (see also Fig. S18.2 for a simplified graph of this information). The figure shows the timing of the short period up-crossing oscillations with the highest and second highest range for each of the 93 stations around the North Sea. The highest oscillations appear in several clusters. In the German Bight, many stations show short period peaks in mid-morning on 18 January 2007. For the coastal segments between East Anglia and the southern Netherlands, and also Denmark, the highest oscillations were in the afternoon and early evening of 18 January 2007 when the highest winds were registered. For most of the Dutch coast, the highest oscillations occurred between mid-morning and early afternoon of 19 January 2007. Most marine incidents appear in a fairly small time window between mid-morning and early evening on 18 January 2007 in the south-western section of the North Sea. In many cases, they are associated with high short period oscillations from the tide gauge network. However, the QuikSCAT image in Figs. 1 and S3.4 highlights that many of the maritime accidents occurred in a small zone of high wind speeds in the south-western corner of the North Sea.
Storm Kyrill had serious impacts that had not been seen for many years and in some cases were unprecedented. In the aftermath of the event, it was possible to assess the scale of the impacts by comparison with previous storms. In Germany, it was reported to be the worst storm of the previous 30 years (Deutsche Rückversicherung Aktiengesellschaft, 2007). Wind speeds were assessed at the level of 50 year return period event (Tetzlaff, 2007). For insurance losses, Storm Kyrill was a rank 1 event for Germany in the time frame from the early 1970s (Donat et al., 2011; AON Benfield, 2013). For the Czech Republic, forest damage was emphasized with storm windfall amounting to 65 % of the annual harvest (Gardiner, 2010). For the Netherlands, the storm was not ranked as severely as Germany, and higher wind speeds had been registered during Storm Jeanett on 27 October 2002, less than 5 years previously (KNMI, 2007). In the UK, the wind speeds were the highest since Storm Daria (or the Burns' Day Storm as it is known in that country) in January 1990 (BBC, 2007; Brugge, 2007). For Ireland, Storm Kyrill was noteworthy for the highest winds ever recorded at Dublin airport since its opening in 1941 and also the closure of Dublin Port (Met Eireann, 2007). Europe-wide, Storm Kyrill was ranked second for the highest insurance losses of any European winter storm (after Storm Lothar in 1999) and rank 5 in terms of the number of fatalities (after Storm Lothar in 1999, Daria in 1990, Xynthia in 2010, and Vivian in 1990) (Statistica, 2015). The damage on land was severe, but the storm was forecast a week in advance, and severe weather warnings were broadcast before the event (Deutsche Rückversicherung Aktiengesellschaft, 2007; Tetzlaff, 2007; Behrens and Günther, 2009; Fink et al., 2009; Petroliagis and Pinson, 2014).
In spite of its significant economic impacts on land, the storm's maritime impacts were actually comparatively small. There were fewer maritime casualties in the North Sea compared with other storms reviewed by Kettle (2018, 2019, 2020, 2021). The storm surge did not reach extreme levels, and the reported coastal damage in the southern German Bight was small (NLWKN, 2007b). This was partly due to the short fetch of the westerly winds that predominated during the storm (Behrens and Günther, 2009; Emeis and Türk, 2009; Larsén et al., 2017). Also, air temperatures were warmer than the sea surface temperatures in the southern North Sea, and this created a very different atmospheric convection situation compared with the cold air outbreak during Storm Britta (Larsén et al., 2017). There was significant damage to energy transmission infrastructure leading to power outages in many countries between Ireland and Russia. However, there was little reported damage to wind energy turbines (Caithness Windfarm, 2018) and no storm damage reports from the offshore wind farms that were coming into operation in the North Sea.
The water level data for this study were measured by the national tide gauge networks of the UK, Belgium, the Netherlands, Germany, Denmark, and Norway. The data were downloaded from publicly accessible websites maintained by the national authorities, except for Germany (datasets were sent by Wilfried Wiechmann of the Bundesanstalt für Gewässerkunde BAFG), one station in the UK (dataset for Southend was sent by Victoria Grobler of the Environment Agency), and three stations in Denmark (datasets for Hanstholm, Hirtshals, and Skagen were sent by Bjørn Frederiksen of Kystdirektoratet). Further information on the URL addresses is given in Table S9.1 of the Supplement.
The supplement related to this article is available online at: https://doi.org/10.5194/adgeo-58-135-2023-supplement.
The author has declared that there are no competing interests.
Publisher’s note: Copernicus Publications remains neutral with regard to jurisdictional claims in published maps and institutional affiliations.
This article is part of the special issue “European Geosciences Union General Assembly 2022, EGU Division Energy, Resources & Environment (ERE)”. It is a result of the EGU General Assembly 2022, Vienna, Austria, 23–27 May 2022.
The author gratefully acknowledges data from national tide gauge networks of the UK, Belgium, the Netherlands, Germany, Denmark, and Norway. The tide gauge data for the UK, Belgium, the Netherlands, Denmark, and Norway was downloaded from Internet servers. For the UK, Victoria Grobler (Environment Agency) emailed data for one additional tide gauge at Southend. For Germany, Wilfried Wiechmann of the Bundesanstalt für Gewässerkunde kindly provided tide gauge data by email. Bjørn Frederiksen of Kystdirektoratet also emailed data for three tide gauge stations in northern Denmark that were not provided on the public Internet server. Gerda van Vliet provided information on rescues by the Koninklijke Nederlandse Redding Maatschappij (KNRM, the Dutch lifeboat service) along the Netherlands coast. The following people provided background reports, data, or other information to support this review: Maria Bluemel and Theide Wöffler (Landesbetrieb für Küstenschutz, Nationalpark, und Meereschutz Schleswig-Holstein, Germany), Christoph Gatzen (Free University of Berlin, Germany), Edwin Granneman (Kustwacht, the Netherlands), Polly Hadziabdic (British Oceanographic Data Centre, UK), Ivan Haigh (National Oceanography Centre, University of Southampton, UK), Julia Lockwood (Met Office Hadley Centre, UK), Delila Montes (International Energy Agency), Irene Perez-Gonzalez (Bundesamt für Seeschifffahrt und Hydrographie, Germany), Reidun Gangstø Skaland (Met.no, Norway), and Annette Zijderfeld (Rijkswaterstaat, the Netherlands). The manuscript benefitted from the comments and suggestions of two reviewers, the editor (Gregor Giebel), and the copy editor (Viola Zierenberg).
This paper was edited by Gregor Giebel and reviewed by two anonymous referees.
AON Benfield: Historie von 1703 bis 2012: Winterstürme in Europa, Stand: Januar 2013, AON Benfield, 2013.
BBC: Huge storms sweep northern Europe, http://news.bbc.co.uk/2/hi/europe/6274377.stm (last access: 10 January 2023), 18 January 2007.
Behrens, A. and Günther, H.: Operational wave prediction of extreme storms in Northern Europe, Nat. Hazards, 49, 387–399, 2009.
Bradshaw, E.: Annual Report for 2007 for the UK National Tide Gauge Network and Related Sea Level Science, National Tide and Sea Level Facility, NERC 100017897, 2007.
Bradshaw, E., Woodworth, P. L., Hibbert, A., Bradley, L. J., Pugh, D. T., Fane, C., and Bingley, R. M.: A century of sea level measurements at Newlyn, Southwest England, Mar. Geod., 39, 115–140, 2016.
Brugge, R.: British Isles weather diary, https://www.met.reading.ac.uk/~brugge/diary2007.html#200701 (last access: 10 January 2023), January 2007.
Caithness Windfarm: Detailed accidents to 19 June 2018, Wind turbine accident compilation, updated regularly, https://scotlandagainstspin.org/wp-content/uploads/2023/01/Detailed-incidents-to-31-Dec2022.pdf (last access: 10 January 2023), 30 July 2018.
Christou, M. and Ewans, K.: Examining a comprehensive dataset containing thousands of freak wave events. Part 1 – Description of the data and quality control procedure, Proceedings of the ASME 2011 30th International Conference on Ocean, Offshore and Arctic Engineering, OMAE2011, 19–24 June 2011, Rotterdam, the Netherlands, OMAE2011-50168, 2011.
Deutsche Rückversicherung Aktiengesellschaft: Sturmdokumentation 2007 Deutschland, edited by: Axer, T., Bistry, T., Müller, M., Reiner, A., and Süsser, M., 38 pp., Deutsche Rückversicherung Aktiengesellschaft, Düsseldorf, Berlin, https://www.deutscherueck.de/fileadmin/Downloads/Sturmdoku_2007_web.pdf (last access: 10 January 2023), 2007.
Diamond, K. E.: Extreme weather impacts on offshore wind turbines: Lessons learned, Nat. Resour. Env., 27, 1–5, 2012.
Ditlevsen, C., Ramos, M. M., Sørensen, C., Ciocan, U. R., and Pionkowitz, T.: Højvandsstatistikker 2017, Miljo- og Fødevareminsteriet, Kystdirektoratet Lemvig, https://www.kyst.dk/media/80372/hoejvandsstatikker2017revideret11022019.pdf (last access: 10 January 2023), February 2018.
Donat, M. G., Pardowitz, T., Leckebusch, G. C., Ulbrich, U., and Burghoff, O.: High-resolution refinement of a storm loss model and estimation of return periods of loss-intensive storms over Germany, Nat. Hazards Earth Syst. Sci., 11, 2821–2833, https://doi.org/10.5194/nhess-11-2821-2011, 2011.
Dotzek, N., Emeis, S., Lefevre, C., and Gerpott, J.: Waterspouts over the North and Baltic Seas: Observations and climatology, prediction and reporting, Meteorol. Z., 19, 115–129, 2010.
DW: Killer winds in Europe expected to cause heavy financial loss, https://www.dw.com/en/killer-winds-in-europe-expected-to-cause-heavy-financial-loss/a-2317752 (last access: 10 January 2023), 18 January 2007a.
DW: Power cuts in Europe as continent begins to clean up, https://www.dw.com/en/power-cuts-in-europe-as-continent-begins-clean-up/a-2319624 (last access: 10 January 2023), 20 January 2007b.
DWD: Klimatologische Bewertung der jüngsten Starkwindereignisse (ANATOL und LOTHAR) aus der Sicht der Klimatologie der freien Atmosphäre, 8 pp., https://www.dwd.de/DE/leistungen/besondereereignisse/stuerme/20000201_bewertung_lothar-anatol.html (last access: 10 January 2023), 2000.
DWD: 18. Januar 2007: Windfeld von Kyrill über Deutschland, Rückblick auf einen der bisher schwersten Orkane, Pressemitteilung, Deutscher Wetterdienst, Offenbach, 16 Januar 2012.
Emeis, S. and Türk, M.: Wind-driven wave heights in the German Bight, Ocean Dynam., 59, 463–475, 2009.
Environment Agency: Thames Barrier Project Pack 2018, Environment Agency, Thames Barrier View Cafe and Information Centre, London, available upon request, email: thamesbarrierenquiries@environment-agency.gov.uk, January 2018.
Fink, A. H., Brücher, T., Ermert, V., Krüger, A., and Pinto, J. G.: The European storm Kyrill in January 2007: synoptic evolution, meteorological impacts and some considerations with respect to climate change, Nat. Hazards Earth Syst. Sci., 9, 405–423, https://doi.org/10.5194/nhess-9-405-2009, 2009.
Gardiner, B.: Appendix 3: Background information on 11 storms selected for detailed analysis, European Forest Institute, Atlantic European Regional Office – EFIAtlantic, 161 pp., https://ec.europa.eu/environment/forests/pdf/Final_Report_Appendix_3.pdf (last access: 10 January 2023), 23 July 2010.
Gatzen, C., Pucik, T., and Ryva, D.: Two cold-season derechoes in Europe, Atmos. Res., 100, 740–748, 2011.
Gönnert, G., Isert, K., Giese, H., and Plüss, A.: Charakterisierung der Tidekurve, Die Küste, 68, 99–141, 2004.
Jensen, J. and Müller-Navarra, S. H.: Storm surges on the German coast, Die Küste, 74, 92–124, 2008.
Kettle, A. J.: The North Sea surge of 31 October–1 November 2006 during Storm Britta, Adv. Geosci., 45, 273–279, https://doi.org/10.5194/adgeo-45-273-2018, 2018.
Kettle, A. J.: Storm Tilo over Europe in November 2007: storm surge and impacts on societal and energy infrastructure, Adv. Geosci., 49, 187–196, https://doi.org/10.5194/adgeo-49-187-2019, 2019.
Kettle, A. J.: Storm Xaver over Europe in December 2013: Overview of energy impacts and North Sea events, Adv. Geosci., 54, 137–147, https://doi.org/10.5194/adgeo-54-137-2020, 2020.
Kettle, A. J.: Storm Anatol over Europe in December 1999: impacts on societal and energy infrastructure, Adv. Geosci., 56, 141–153, https://doi.org/10.5194/adgeo-56-141-2021, 2021.
KNMI: Nieuwsbericht, De zware storm Kyrill van 18 januari 2007, https://www.knmi.nl/over-het-knmi/nieuws/de-zware-storm-kyrill-van-18-januari-2007 (last access: 10 January 2023), 17 January 2007.
Kvamme, D.: Ekstremvaer nr.1/2007 – “Per”, Intern Rapport, 15 pp., Meteorogisk Institutt met.no, Bergen, 14 February 2007.
Kvendseth, S. S.: Giant Discovery, A history of Ekofisk through the first 20 years, Phillips Petroleum Company Norway, https://www.nb.no/items/URN:NBN:no-nb_digibok_2019090248002?page=5 (last access: 10 January 2023), 1988.
Larsén, X. G., Du, J., Bolanos, R., and Larsen, S.: On the impact of wind on the development of wave field during storm Britta, Ocean Dynam., 67, 1407–1427, 2017.
Lloyds Casualty Week: 26Jan2007, Lloyd's MIU, Telephone House, London, https://dione.lib.unipi.gr/xmlui/bitstream/handle/unipi/1916/Casualty_Week_Jan_26_2.pdf?sequence=3&isAllowed=2 (last access: 10 January 2023), 2007a.
Lloyds Casualty Week: 02Feb2007, Lloyd's MIU, Telephone House, London, https://dione.lib.unipi.gr/xmlui/bitstream/handle/unipi/1902/Casualty_Week_Feb_2_2.pdf?sequence=3&isAllowed=2 (last access: 10 January 2023), 2007b.
Ma, Y., Martinez-Vazquez, P., and Baniotopoulos, C.: Wind turbine collapse cases: a historical overview, Institution of Civil Engineers, Proceedings, Structures and Buildings, 172, 547–555, https://doi.org/10.1680/jstbu.17.00167, 2018.
Magnusson, A. K.: What is true sea state? Proceedings of the 11th International Workshop on Wave Hindcasting and Forecasting and Coastal Hazard Symposium, JCOMM Halifax, Canada, 18–23 October 2009, Technical Report No. 52, WMO/TD-No. 1533, IOC Workshop Report No. 232, 2009.
Magnusson, A. K., Johannessen, J., Dagestad, K.-F., Breivik, O., Aarnes, O. J., and Furevik, B.: Bølge-strøm interaksjon til nytte for oljeindustri, WACUSAR_sluttrapport.doc, NERSC, met.no, 19 December 2008.
MAIB: Report on the investigation of the structural failure of MSC Napoli English Channel on 18 January 2007, Marine Accident Investigation Branch, Southampton, UK, Report No. 9/2008, April 2008.
Met Eireann: Monthly Weather Bulletin, No. 249, https://edepositireland.ie/handle/2262/70096 (last access: 10 January 2023), January 2007.
Monserrat, S., Vilibić, I., and Rabinovich, A. B.: Meteotsunamis: atmospherically induced destructive ocean waves in the tsunami frequency band, Nat. Hazards Earth Syst. Sci., 6, 1035–1051, https://doi.org/10.5194/nhess-6-1035-2006, 2006.
Müller-Westermeier, G.: Beschreibung und klimatologische Bewertung des Orkantiefs “Kyrill”, Deutscher Wetterdienst – Nationale Klimaüberwachung, https://www.dwd.de/DE/leistungen/besondereereignisse/stuerme/20070118_orkan_kyrill.html (last access: 10 January 2023), 26 January 2007.
Neumann, T.: FINO and the mast shadow effect, 52nd IEA Topical Expert Meeting, Wind and wave measurements at offshore locations, Berlin, Germany, organized by TU Berlin and Germanischer Lloyd, International Energy Agency, Implementing Agreement for Co-operation in the Research, Development and Deployment of Wind Turbine Systems, Task 11, February 2007.
Neumann, T. and Nolopp, K.: Three years of operation of far offshore measurements at FINO1, DEWI Magazine, 30, 42–46, 2007.
NLWKN: Sturmflut am 12. Januar 2007: Nordseeküste kam glimpflich davon 12. Januar 2007 (aktualisiert am 15. Januar 2007): Dünenabbrüche auf den ostfriesischen inseln, https://www.nlwkn.niedersachsen.de/startseite/aktuelles/presse_und_offentlichkeitsarbeit/pressemitteilungen/-41838.html (last access: 10 January 2023), 15 January 2007a.
NLWKN: Sturmflut von 19. Januar: Es kam nicht so schlimm wie befürchtet. 19. Januar 2007: keine Dünenabbrüche auf den Inseln/Für das Wochenende wird erhöhtes tidewasser erwartet, https://www.nlwkn.niedersachsen.de/startseite/aktuelles/presse_und_offentlichkeitsarbeit/pressemitteilungen/-41867.html (last access: 10 January 2023), 22 January 2007b.
Pattiaratchi, C. B. and Wijeratne, E. M. S.: Are meteotsunamis an underrated hazard?, Philos. T. R. Soc. A, 373, 2140377, https://doi.org/10.1098/rsta.2014.0377, 2015.
Petroleum Safety Authority Norway: Petroleum Safety Authority Norway Annual Report 2006, Supervision and Facts, Stavanger, 26 April 2007.
Petroliagis, T. I. and Pinson, P.: Early warnings of extreme winds using the ECMWF Extreme Forecast Index, Meteorol. Appl., 21, 171–185, 2014.
Pinto, J. G., Gomara, I., Masato, G., Dacre, H. F., Woolings, T., and Caballero, R.: Large-scale dynamics associated with clustering of extratropical cyclones affecting Western Europe, J. Geophys. Res.-Atmos., 119, 13704–13719, 2014.
Pleskachevsky, A. L., Lehner, S., and Rosenthal, W.: Storm observations by remote sensing and influences of gustiness on ocean waves and on generation of rogue waves, Ocean Dynam., 62, 1335–1351, 2012.
Pugh, D. T.: Tides, Surges and Mean Sea Level, John Wiley and Sons, https://eprints.soton.ac.uk/19157/1/sea-level.pdf (last access: 10 January 2023), 1987.
Roberts, J. F., Champion, A. J., Dawkins, L. C., Hodges, K. I., Shaffrey, L. C., Stephenson, D. B., Stringer, M. A., Thornton, H. E., and Youngman, B. D.: The XWS open access catalogue of extreme European windstorms from 1979 to 2012, Nat. Hazards Earth Syst. Sci., 14, 2487–2501, https://doi.org/10.5194/nhess-14-2487-2014, 2014.
Rose, S., Jaramillo, P., Small, M. J., Grossmann, I., and Apt, J.: Quantifying the hurricane risk to offshore wind turbines, P. Natl. Acad. Sci. USA, 109, 3247–3252, 2012.
Rosenorn, A. S.: Vintervejret 2006–2007, Vejret, 111, 28–31, 2007.
Rosenthal, W., Pleskachevsky, A. L., Lehner, S., and Brusch, S.: Observation and modeling of high individual ocean waves and wave groups caused by a variable wind field, 12th International Workshop on Wave Hindcasting and Forecasting, 30 October–4 November 2011, Kohala Coast, Hawai'i, HI, https://waveworkshop.org/12thWaves/papers/2011_Workshop-Wavehind-and-Forecasting__Rosenthal_Pleskachevsky_Lehner_Brusch.pdf (last access: 10 January 2023), 2011.
RWS: Verslag van de stormvloed van 31 oktober en 1 november 2006 (SR84), Ministerie van Veerkeer en Waterstaat, Rijkswaterstaat, Stormvloedwaarschuwingsdienst/SVSD, Postbus 20907, 2500 EX's-Gravenhage, https://waterberichtgeving.rws.nl/water-en-weer/verwachtingen-water/water-en-weerverwachtingen-waternoordzee/stormvloedrapportages/stormvloedverslagen (last access: 10 January 2023), November 2006.
RWS: Verslag van de stormvloed van 18 en 19 januari 2007 (SR86), Ministerie van Verkeer en Waterstaat, Rijkswaterstaat, Stormvloedwaarschuwingsdienst/SVSD, Postbus 20907, 2500 EX's-Gravenhage, https://waterberichtgeving.rws.nl/water-en-weer/verwachtingen-water/water-en-weerverwachtingen-waternoordzee/stormvloedrapportages/stormvloedverslagen (last access: 10 January 2023), January 2007.
SMHI: Per – Januaristormen 2007, https://www.smhi.se/kunskapsbanken/meteorologi/per-januaristormen-2007-1.5287 (last access: 10 January 2023), 6 August 2009.
Sørensen, C., Ingvardsen, S. M., Andersen, I., and Kloster, B. B.: Højvandsstatistikker 2007, Extreme sea level statistics for Denmark, 2007, Kystdirektoratet, https://kyst.dk/media/80365/00_hojvandsstatistik_2007-1-1-1.pdf (last access: 10 January 2023), December 2007.
Statistica: The costliest winter storms ever to hit Europe, Fatalities and financial losses of Europe's 10 costliest winter storms (source Munich Re), https://www.statista.com/chart/4147/the-costliest-winter-storms-ever-to-hit-europe/ (last access: 10 January 2023), 8 December 2015.
Stull, R. B.: An Introduction to Boundary Layer Meteorology, Kluwer Academic Publishers, Dordrecht, https://link.springer.com/book/10.1007/978-94-009-3027-8 (last access: 10 January 2023), 1988.
Tetzlaff, G.: Der Orkan Kyrill, Info, DKKV Deutsches Komitee Katastrophenvorsorge e.V., 1–2, Februar/März 2007, No. 1+2, https://dkkv.org/uploads/media/InfoBlatt1u.2_07.pdf (last access: 10 January 2023), 2007.
Wikipedia: Cyclone Kyrill, https://en.wikipedia.org/wiki/Cyclone_Kyrill, last access: 22 March 2022.
XWS: Extreme Wind Storms Catalogue, http://www.europeanwindstorms.org/cgi-bin/storms/storms.cgi, last access: 10 January 2023.