 | 05 Oct 2021
Geochemical and reactive transport modelling in R with the RedModRphree package
Michael Kühn
Advances in computing and experimental capabilities in the research of water-rock-interactions require geoscientists to routinely combine laboratory data and models to produce new knowledge. Data science is hence a more and more pervasive instrument for geochemists, which in turn demands flexible and easy to learn software adaptable to their specific needs. The GNU R language and programming environment has established itself as de facto standard language for statistics and machine learning, enjoying increasing diffusion in many applied scientific fields such as bioinformatics, chemometrics and ecological modelling. The availability of excellent third party extensions as well as its advanced graphical and numerical capabilities make R an ideal platform for comprehensive geochemical data analysis, experiment evaluation and modelling.
We introduce the open source RedModRphree extension
package, which leverages the R interface to the established
PHREEQC geochemical simulator. The aim of
RedModRphree is to provide the user with an easy-to-use,
high-level interface to program algorithms involving geochemical
models: parameter calibration, error and sensitivity analysis,
thermodynamical database manipulation, up to CPU-intensive parallel
coupled reactive transport models. Among the out-of-the-box features
included in RedModRphree, we highlight the computation and
visualization of Pourbaix (Eh-pH) diagrams using full speciation as
computed by PHREEQC and the implementation of 1D advective
reactive transport supporting the use of surrogate models replacing
expensive equation-based calculations.
- Article
(2297 KB) - Full-text XML
- BibTeX
- EndNote


GNU R (R Core Team, 2021) is an open source software environment and programming language originally developed for statistical computing and graphics as new implementation of the closed source S language. Its expressive and elegant syntax combines elements of object-oriented and functional languages and is perfectly suited to represent computational problems in an extremely concise way. R's comprehensive numerical capabilities and its collaborative development nature has attracted a large user base over the years, leading to its establishment as de facto standard language in many areas of mathematics, statistics and machine learning, and as one of the most successful open source projects overall. R is more and more extending its ecosystem to different applied sciences, including geosciences, where the language's core strengths and its extremely large toolbox of user contributed extension packages benefit the daily work of students, academics and professionals alike. At the moment of writing, over 17750 user-contributed extension packages have been submitted to the official repository called Comprehensive R Archive Network (CRAN). Indices of these packages, termed “Task Views” (Zeileis, 2005, 2021), are provided by domain experts to offer guidance in navigating such an ample landscape by organizing them under specific topics. For example, the Task View Chemometrics and Computational Physics (Mullen, 2021) lists over 80 packages covering many aspects of data analysis relevant for chemistry and physics experiments, and the simulation of physico-chemico systems; furthermore, it points to other related Task Views of obvious interest such as Differential Equations and Multivariate Analysis.

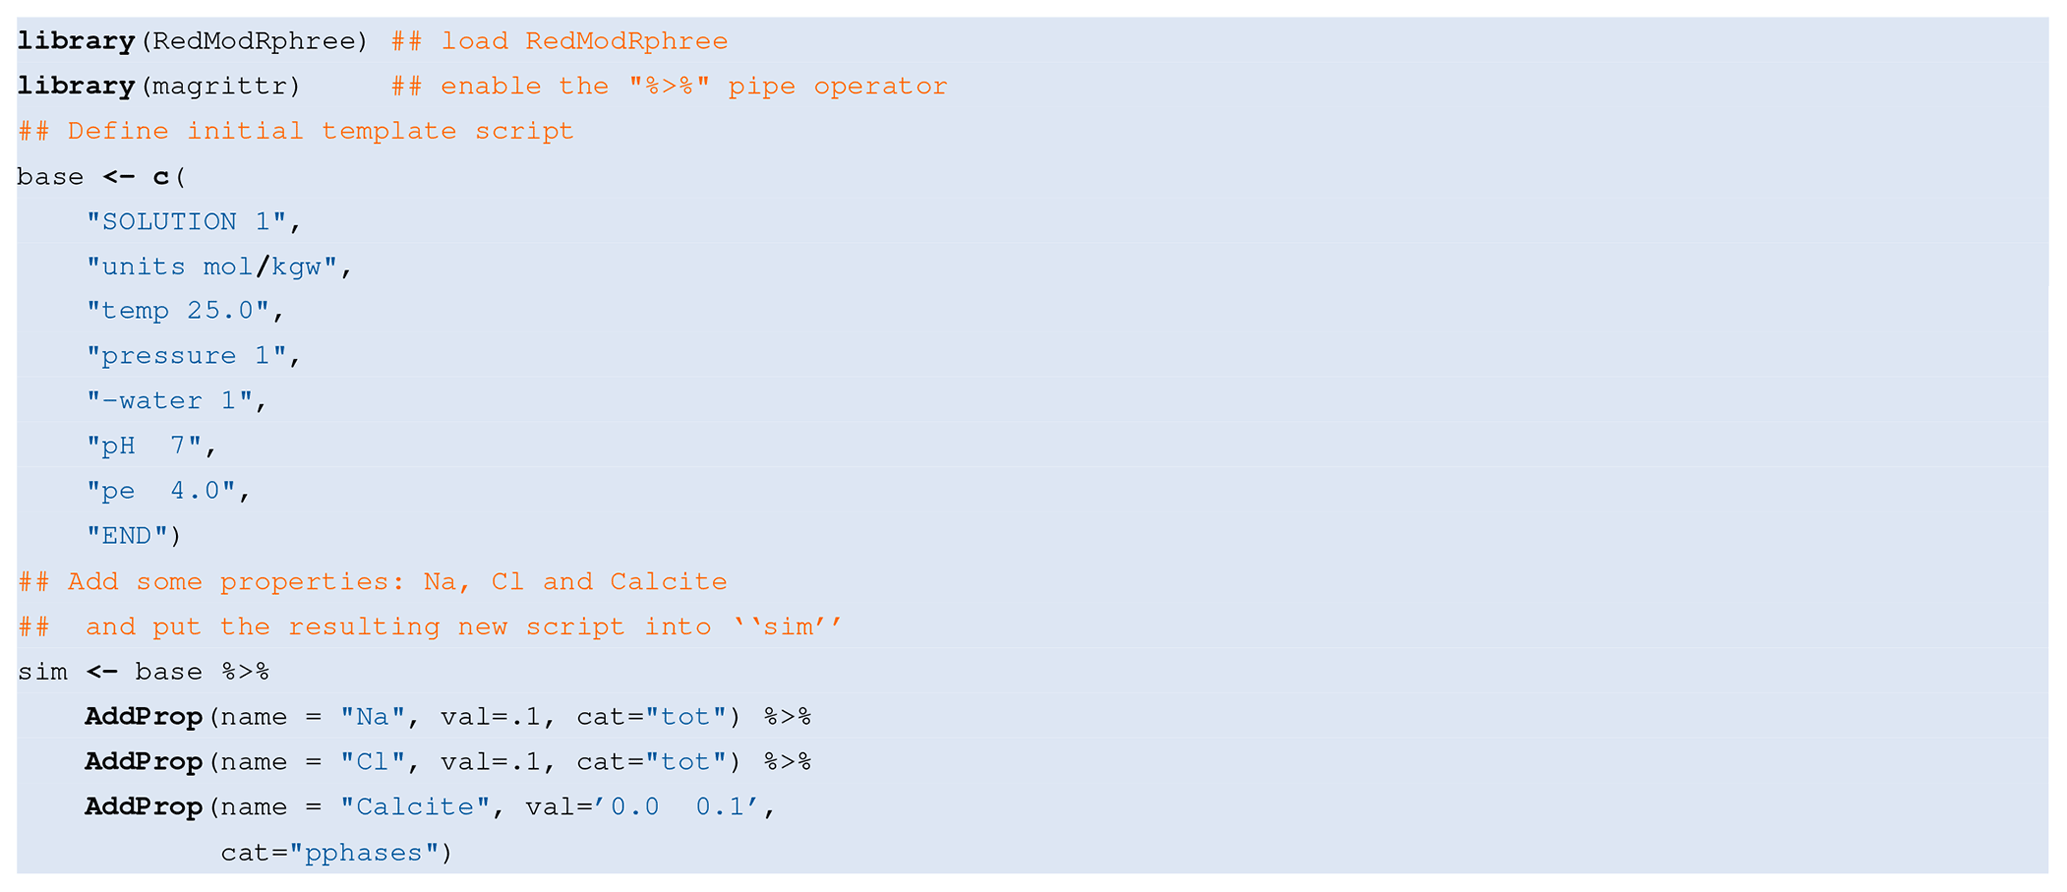
Listing 2Code snippet illustrating the manipulation of an exemplary input script to compute calcite solubility in a 0.1 molal NaCl solution.
Specifically for geochemistry, the CHNOSZ package
(Dick, 2019) allows for thermodynamic calculations in aqueous
geochemistry and geobiochemistry based on the Helgeson-Kirkham-Flowers
(HKF) equations (Johnson et al., 1992), extending the capabilities of the
well known SUPCRT92 software. Furthermore, an interface to the
established geochemical simulator PHREEQC (Appelo et al., 2013; Parkhurst and Appelo, 2013) for the R language is available on CRAN as package
phreeqc (Charlton and Parkhurst, 2011, note the lowercase writing adopted in this
paper to distinguish it from PHREEQC itself).
However, this interface only exposes the Application Programming
Interface (API) of PHREEQC to R, and does not provide utility
functions to quickly setup new models or in general to program
algorithms involving geochemical calculations.
The freely available extension package RedModRphree,
introduced with this contribution, aims at fulfilling this need. Its
goal is to enhance the user experience by streamlining repetitive
tasks connected with the utilization of PHREEQC for
computing-intensive tasks, leveraging at the same time the software
infrastructure offered by the R environment. RedModRphree
supersedes a discontinued package called Rphree
(https://rphree.r-forge.r-project.org/, last access: 30 September 2021 De Lucia and Kühn, 2013),
which involved modifications of PHREEQC's source code at c
level. The availability of the phreeqc extension package
(Charlton and Parkhurst, 2011), on par with each new PHREEQC's release
made this approach superfluous.
New functionalities and applications have been added to
RedModRphree over the years. In particular, the package
version 0.3.6 includes a novel implementation of Pourbaix diagrams
computation following the suggestions of Kölling et al. (2000), which
will be explained and demonstrated in Sect. 3.1.
Advective one-dimensional reactive transport simulations which can use
surrogates to speedup lengthy PHREEQC calculation are
discussed in Sect. 3.2. Before diving into
these applications, however, in the next section we provide a general
overview of RedModRphree, its logic and its fundamentals
illustrated with code examples.
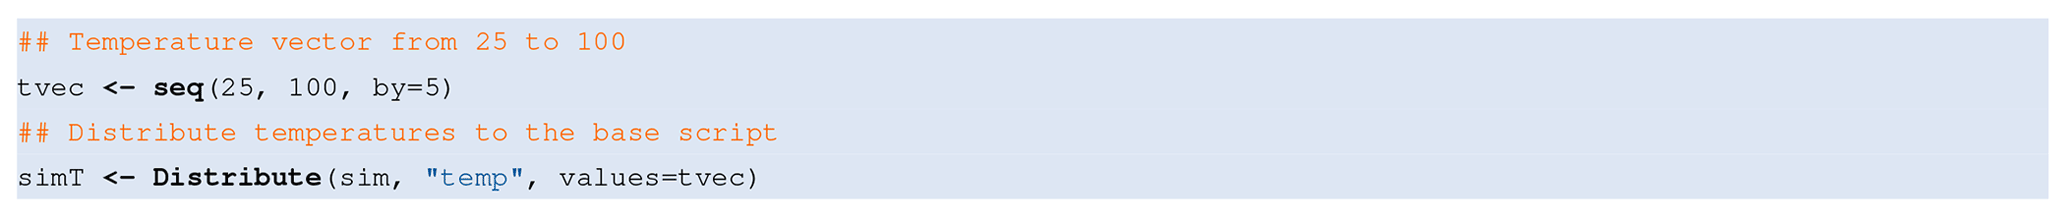
Listing 3Exemplary usage of the
Distribute function to create input scripts “distributing”
varying values of a given property, in this case calcite solubility as
function of temperature in 16 steps from 25 to 100 ∘C.
2.1 Package description
PHREEQC itself operates by interpreting input scripts written
in its own syntax, and outputting the results either as formatted text
or as data tables. Thus, the primary need for a high-level interface
to the chemical engine is offering comfortable mechanisms to create,
manipulate and check the input scripts and to parse the structured
text outputs. Much of RedModRphree code is hence related to
text manipulation.
Several programmatic design choices were made in the development of
RedModRphree:
-
the user is assumed to be familiar with
PHREEQCand its syntax. The package does not hide it under own classes or abstractions, and instead only provides functions to manipulate input scripts and obtain calculations' results back into the R runtime; -
minimal number of external dependencies, meaning that code is in standard R for maximum portability, maintenance and ease of installation;
-
code is platform-independent, however development and testing are mainly focused on POSIX operating systems such as Linux.
The current RedModRphree version 0.3.6 supports
PHREEQC keywords EQUILIBRIUM_PHASES and
KINETICS. Support of further options such as surface
complexation, solid solutions and isotope is planned for future
versions.
2.2 Basic usage demonstration
RedModRphree version 0.3.6, which is the version considered
in this paper, can be downloaded from Zenodo
(https://doi.org/10.5281/zenodo.5046427) or by anonymous download
from the git server of GFZ. The commands given in
Listing 1 install it along with the required
dependencies.
RedModRphree provides utility functions to manipulate input
scripts, which are represented in R as character vectors whose
elements correspond to a line of a PHREEQC input script. The
current RedModRphree version does not support line
continuation (i.e., logical lines splitted across different actual
text lines), so the user must be aware of this convention.
The fundamental input manipulations are provided by the functions
AddProp and RepSol. The first adds to a base script
a property such as a concentration or an equilibrium mineral and
should be called explicitly for each new property added.
Listing 2 illustrates its use leveraging the
pipe operator %>% for code clarity, which must be
enabled explicitly since it is not loaded by the package itself. When
calling AddProp, the user must specify to which logical block
the new property belongs as per standard PHREEQC syntax. This
can be one of tot (a property belonging under the
SOLUTION keyword, e.g. pH, temperature or total element
concentrations), pphases (a mineral or a gas at equilibrium,
from the conventional name “pure phases” used in PHREEQC;
the package always adopts the PURE alternative keyword to
EQUILIBRIUM_PHASES) or kin (for KINETICS
blocks). RepSol repeats a template script a specified amount
of times.


Listing 6Generate a
SELECTED_OUTPUT block from an already calculated simulation
parsed by the ReadOut function.

The next step is to use this basic template script to create
meaningful calculations. The fundamental mechanism provided by
RedModRphree is the function Distribute (and its
variant DistributeKin which deals specifically with kinetic
blocks). In Listing 3 is demonstrated how to create
an input script which computes the solubility of calcite as function
of temperature, varying it between 25 and 100 ∘C.
By inspecting the new simT input buffer, it becomes clear
that the initial template script was repeated 16 times, each with a
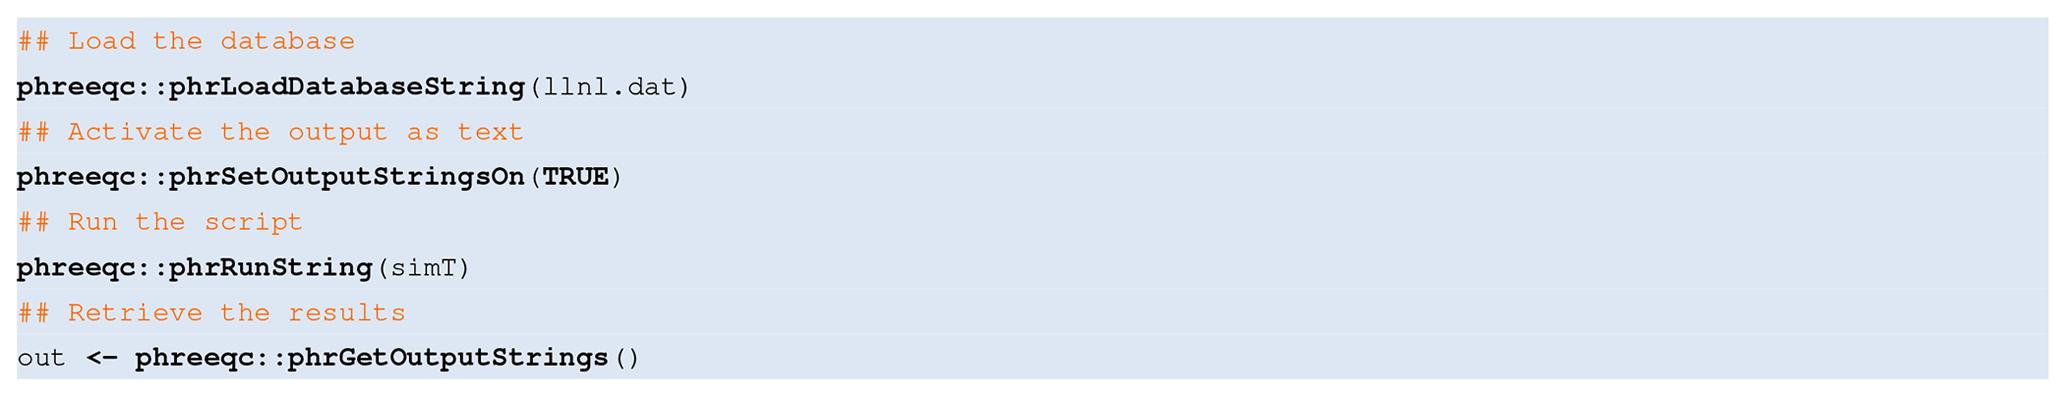
different value of temperature. The new script can then be run with
phreeqc-provided functions.
The results of these PHREEQC calculations are stored as text
buffer in the out variable 4, using its
standard format. RedModRphree provides functions to parse
such output and obtain the numerical values as R objects (function
ReadOut, Listing 5). In particular,
ReadOut returns a list where each element is one simulation
in the output buffer, and each simulation itself is a set of tabular
data (specifically, data.frames in R) corresponding to the
logical blocks in the output file. These logical blocks are named
desc (some descriptive parameters about the calculated
solutions such as pe, pH and ionic strength), tot (total
elements concentrations), SI (saturation indices of
minerals), pphases (equilibrium minerals) and
species (concentration of dissolved species).
It is possible to transform back such a list to a valid
PHREEQC input using the function InputFromList.
Another way to obtain the needed results from PHREEQC is by
specifying a SELECTED_OUTPUT or USER_PUNCH. When
such blocks are specified, a data.frame containing the numerical
values is directly returned to R from phreeqc. A simple
mechanism to generate a SELECTED_OUTPUT block from a parsed
simulation is provided by function FormSelectedOutput
(Listing 6).
res2 is the resulting table containing all the variables
included in the SELECTED_OUTPUT block.
2.3 Parallel computations
R offers an easy way to parallelize computing-intensive tasks. In
RedModRphree this capability is leveraged making use of the
extension packages foreach and doParallel. In
particular the RunPQC function offers the option of parallel
computing, however in this case it expects as input a list of input
scripts which represent the tasks to be parallelized. A simple example
of parallel computation of 320 simulations on 4 CPUs is given in
listing 8.
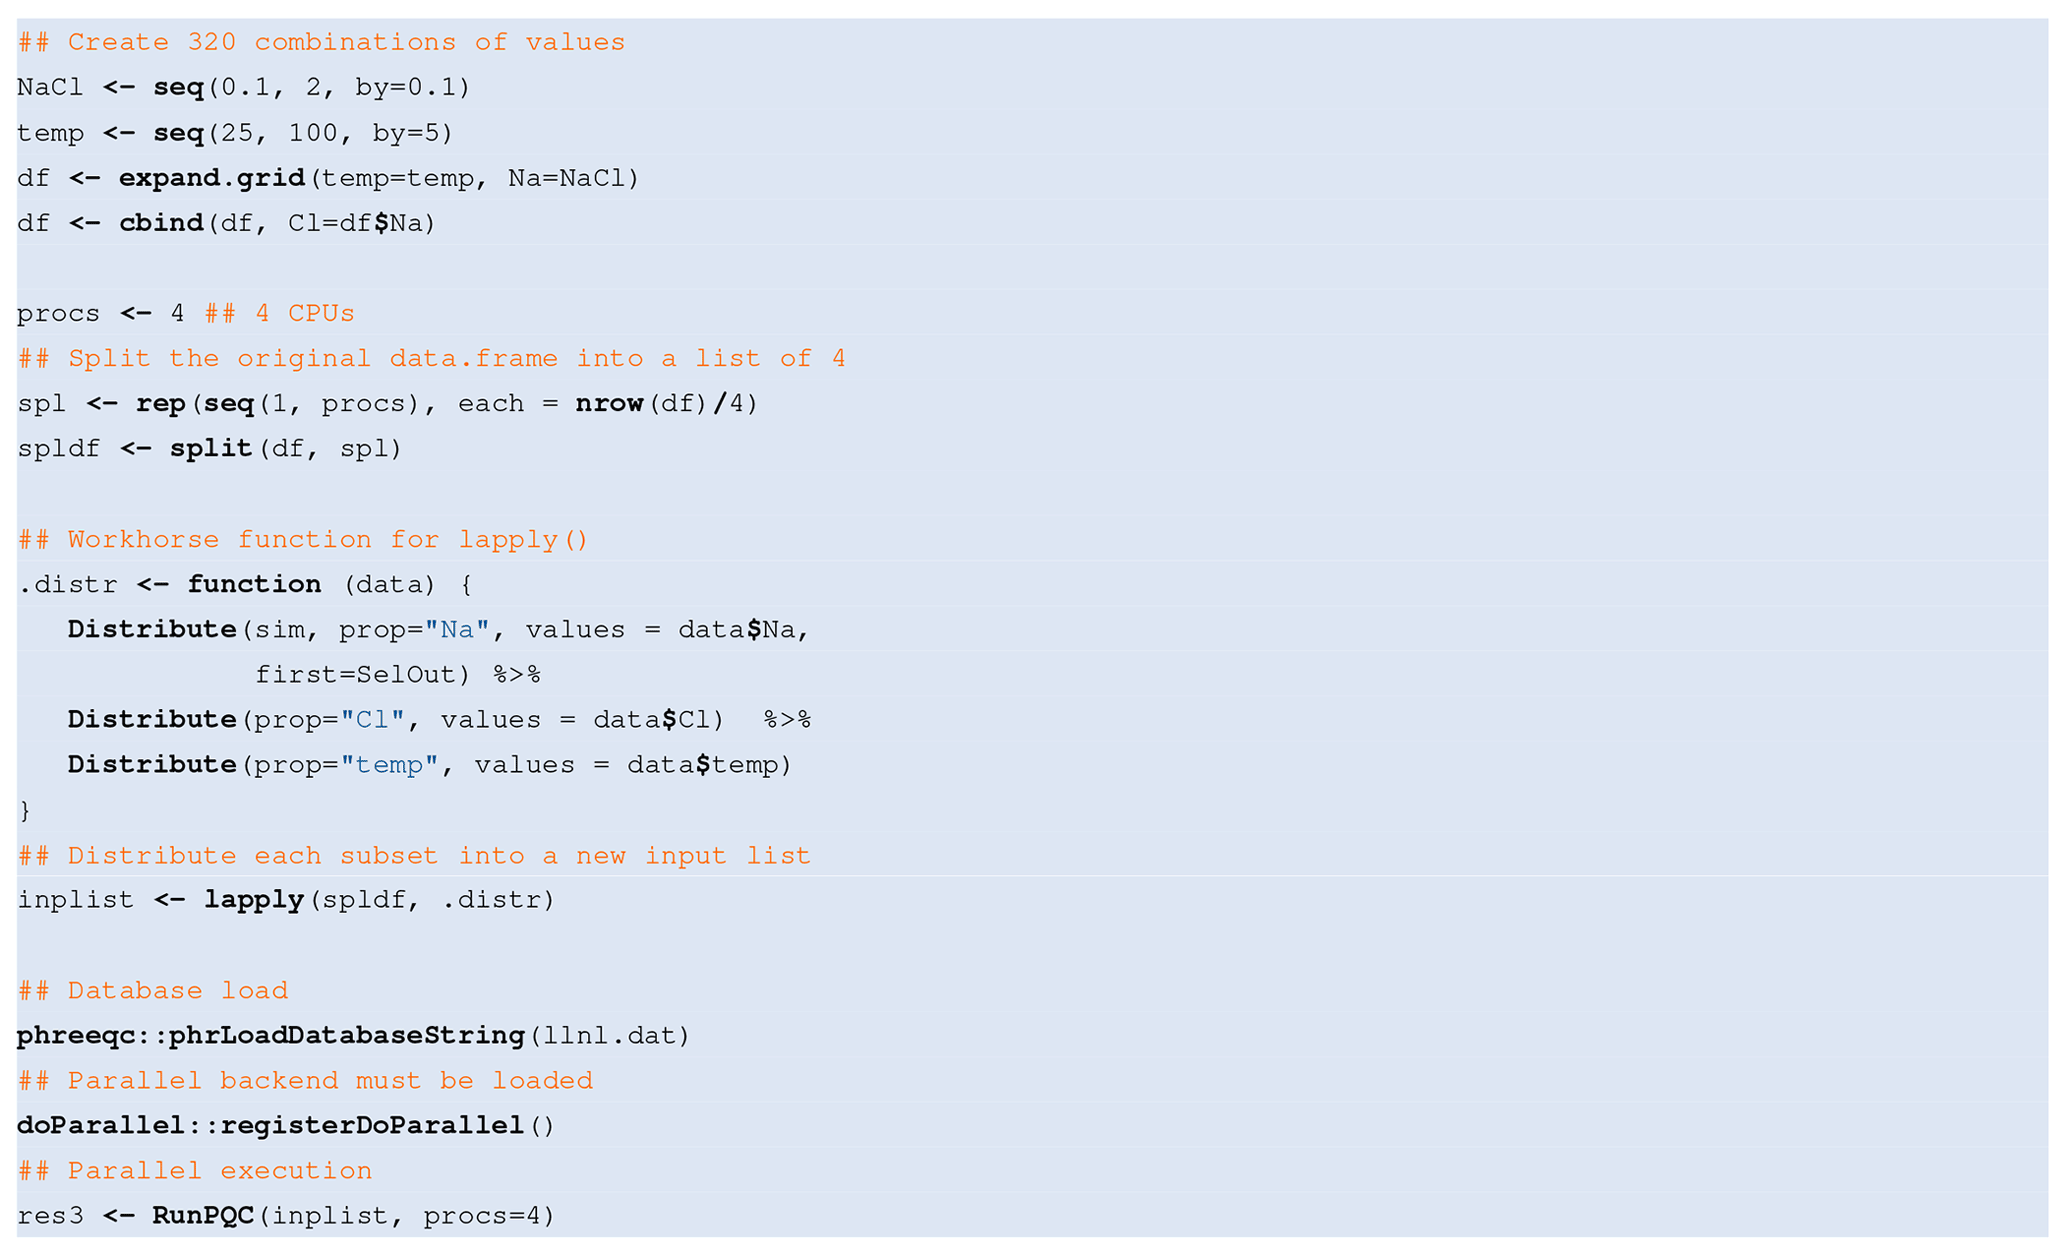
The res3 variable contains the selected output corresponding
to the 320 rows of the df data.frame. R offers many options
to visualize three-dimensional data. Listing 9 gives an
example of interactive visualization using the plotly package
(Plotly Technologies, 2015). The resulting picture is interactive and opens in a
browser. A screenshot is given in Fig. 1.
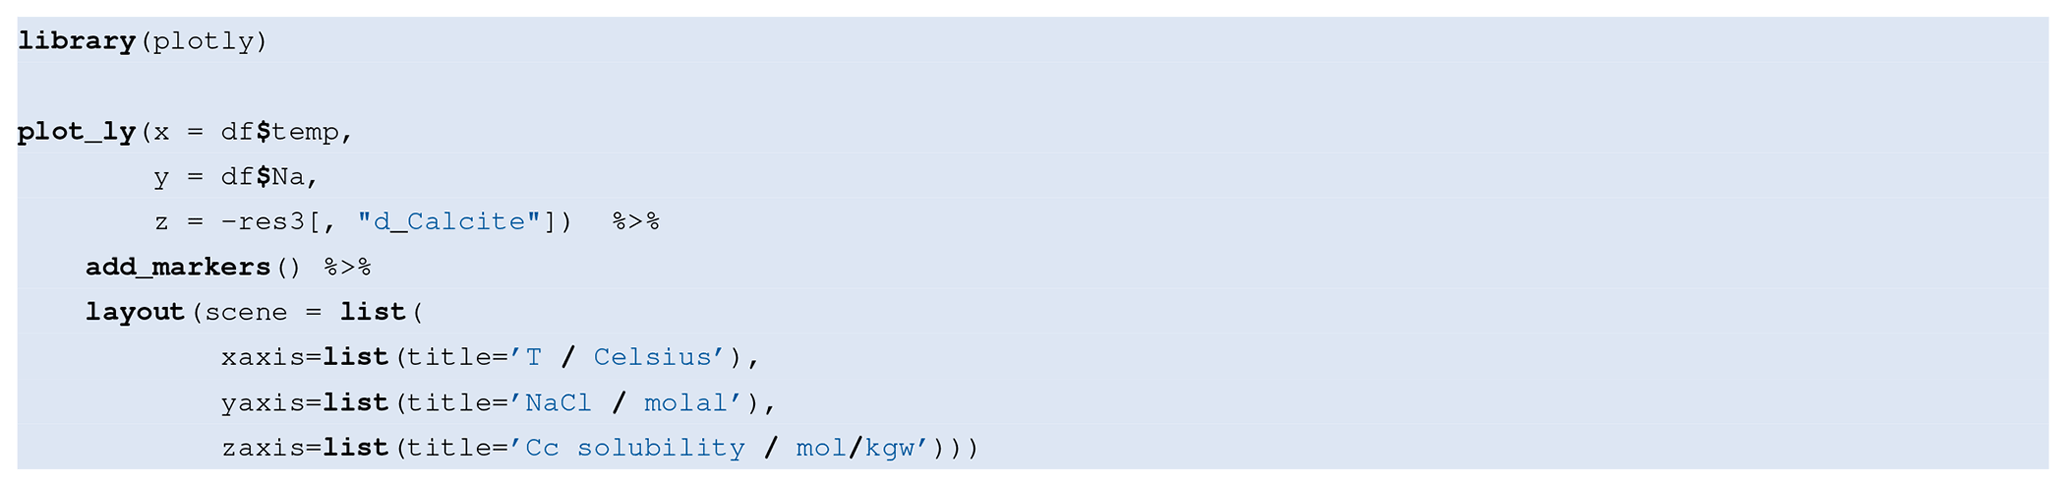
Listing 93D visualization of the
computed solubility of calcite as function of temperature and NaCl
salinity using package plotly.
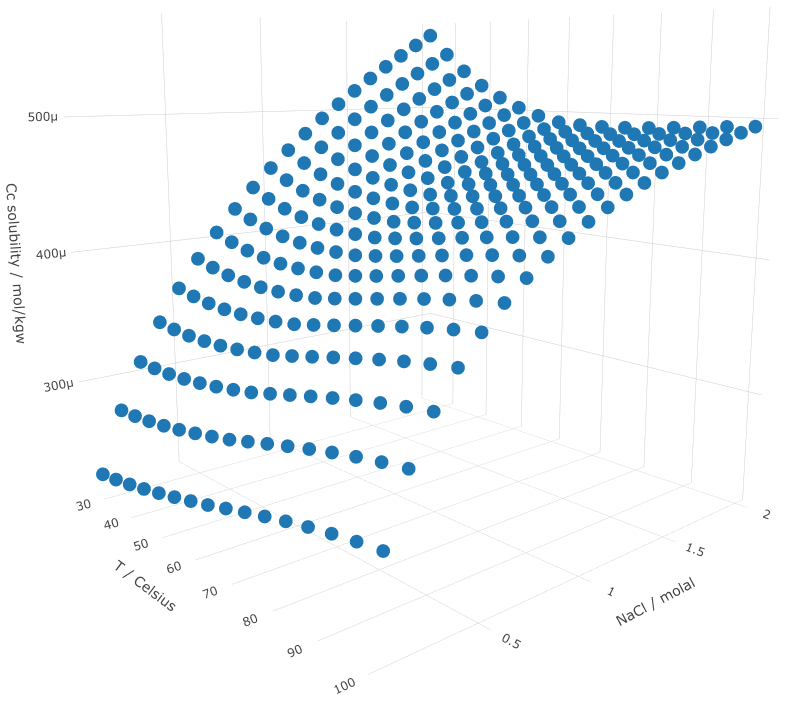
Figure 1Screenshot of the interactive visualization of the results of the calcite solubility as function of T and salinity computed with Listing 8.
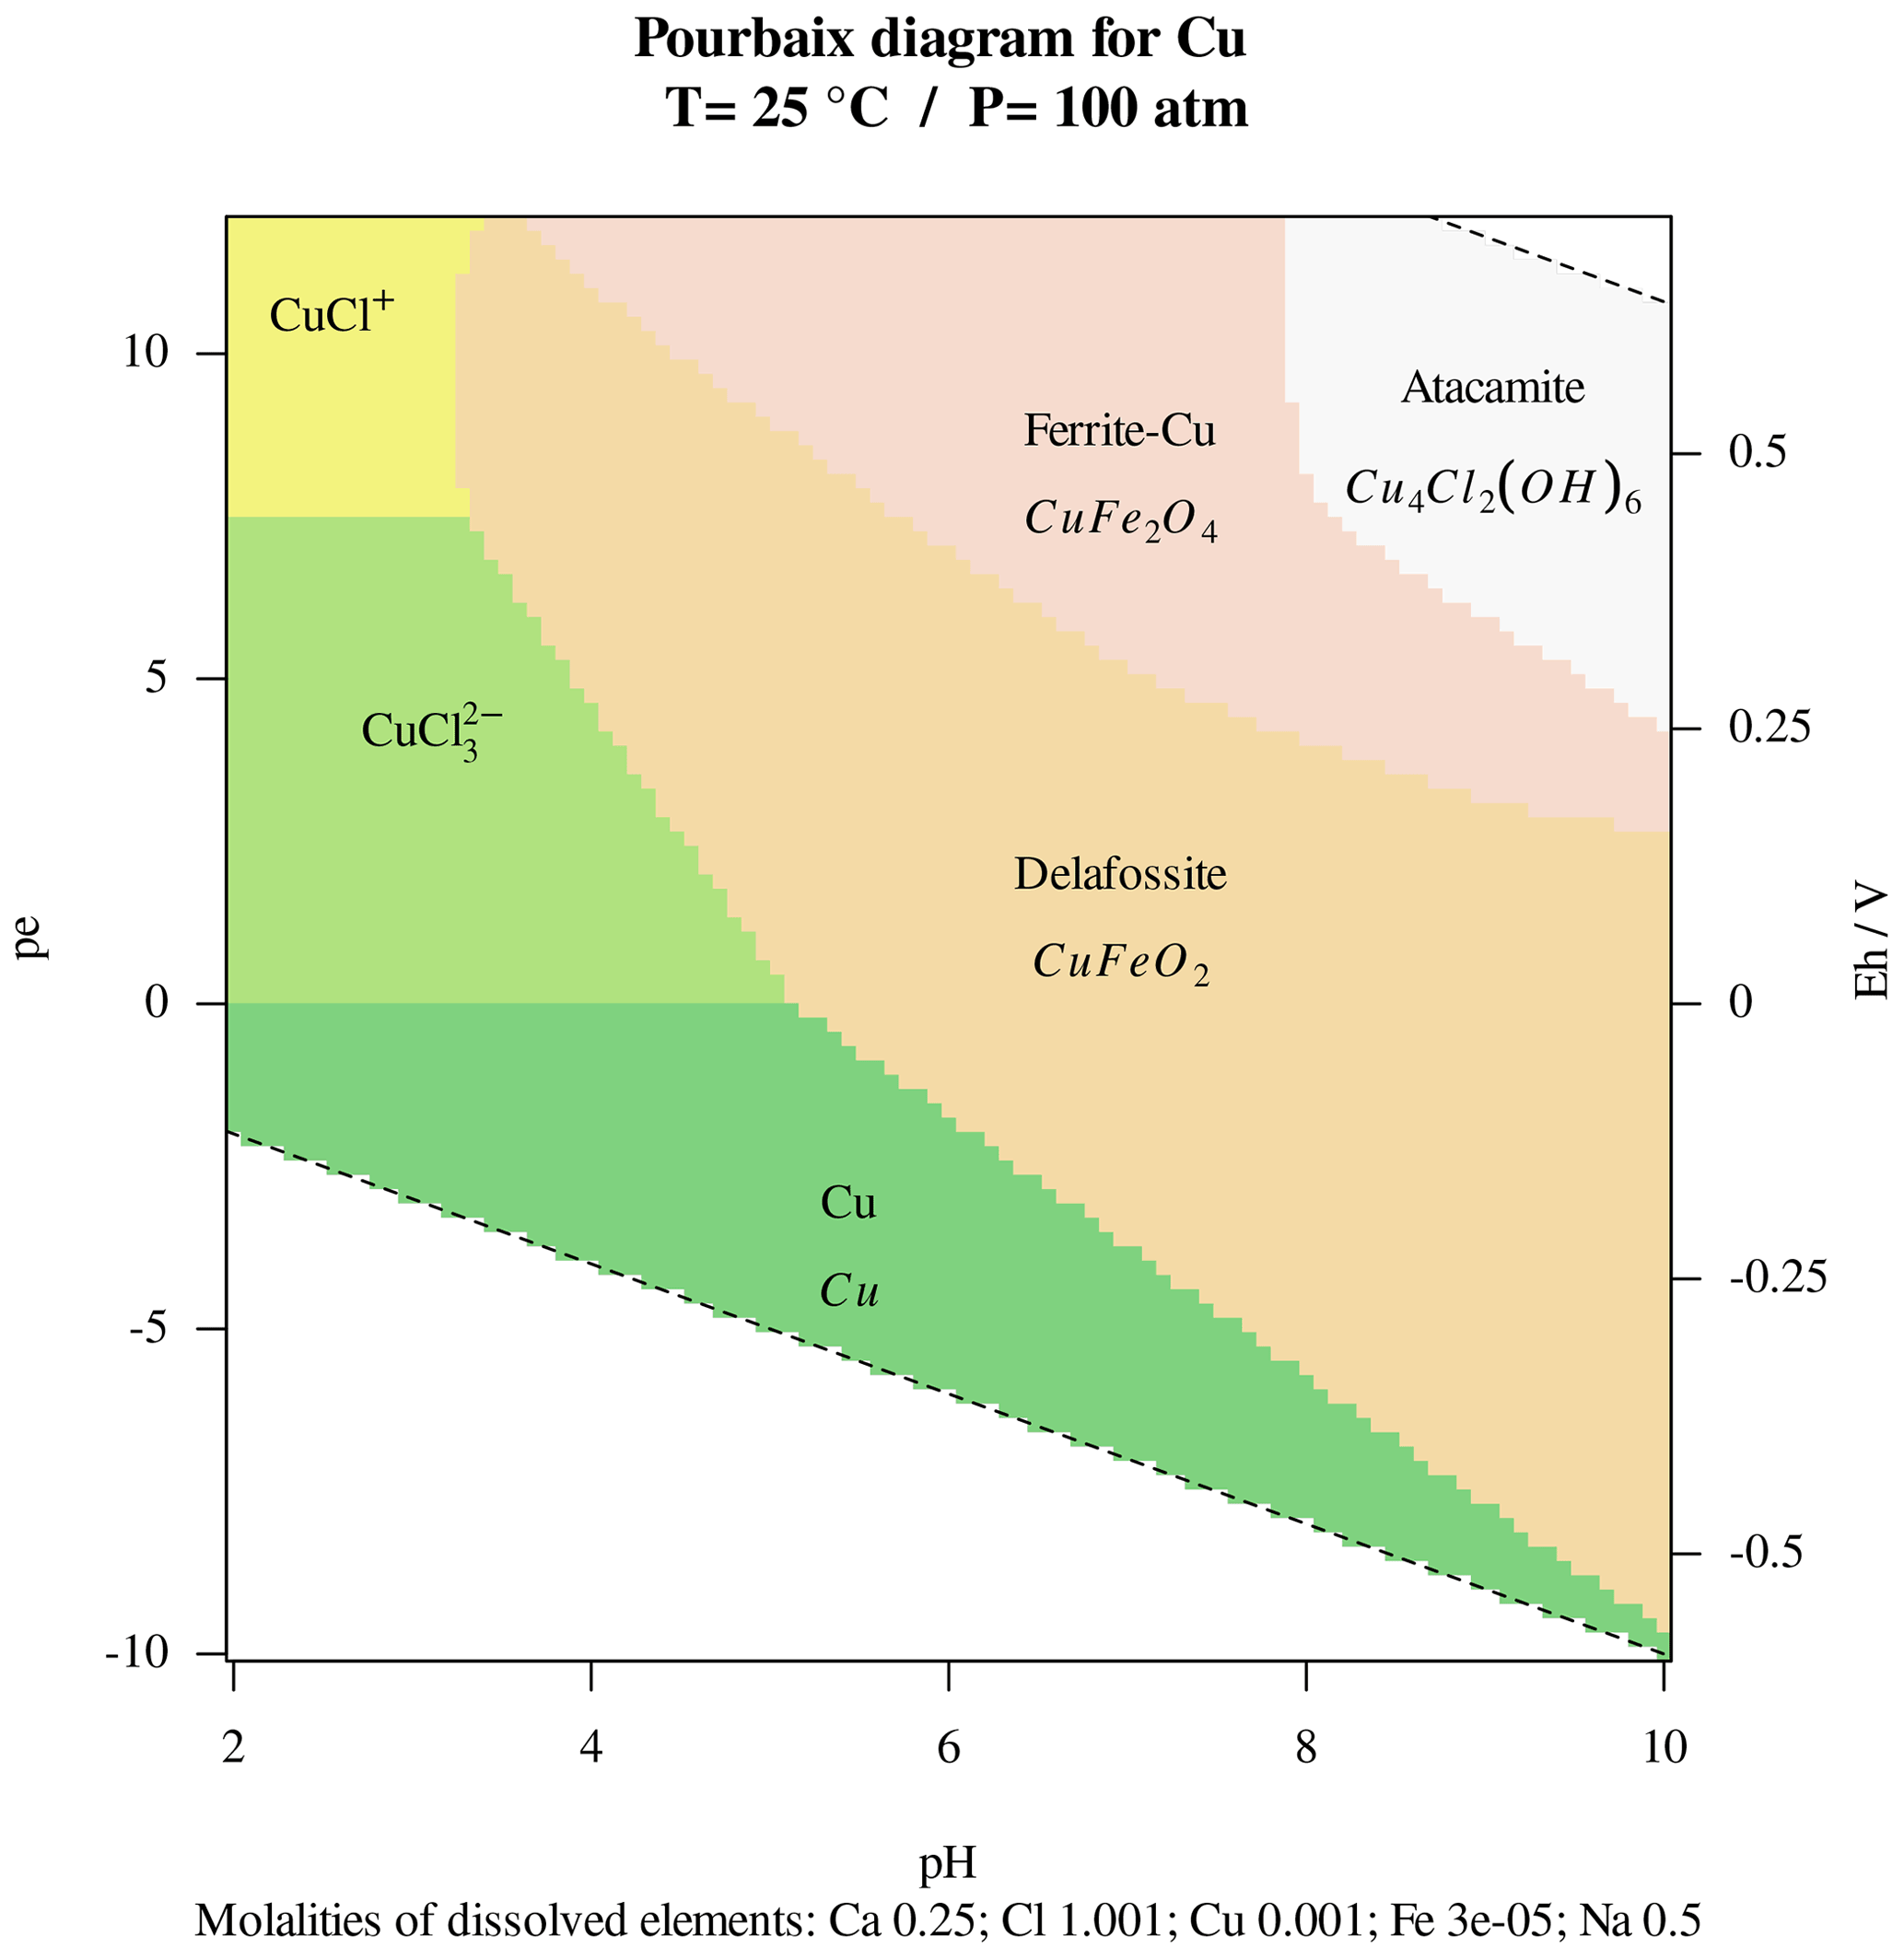
Figure 2Pourbaix diagrams of copper across aqueous and solid
species, using the llnl.dat thermodynamical database.
Since at each point of the diagram all equilibrium activities are
considered, the boundaries between predominance regions are no
longer straight lines but curves. The interpretation of these
diagrams requires expert knowledge. For example, kinetic
limitation would prevent precipitation of delafossite from aqueous
phase at 25 ∘C (John et al., 2016).
2.4 Additional resources: demos and documentation
The previous sections showcase a simple working session with the
package. These functions are the fundamental building blocks needed to
quickly create complex calculations, and can be easily leveraged to
efficiently implement algorithms involving geochemical models, such as
reactive transport simulations. The package includes further utilities
to deal with KINETICS blocks and to parse and manipulate
thermodynamical databases, which are not covered in this manuscript,
and for which the reader is referred to the package documentation and
demo.
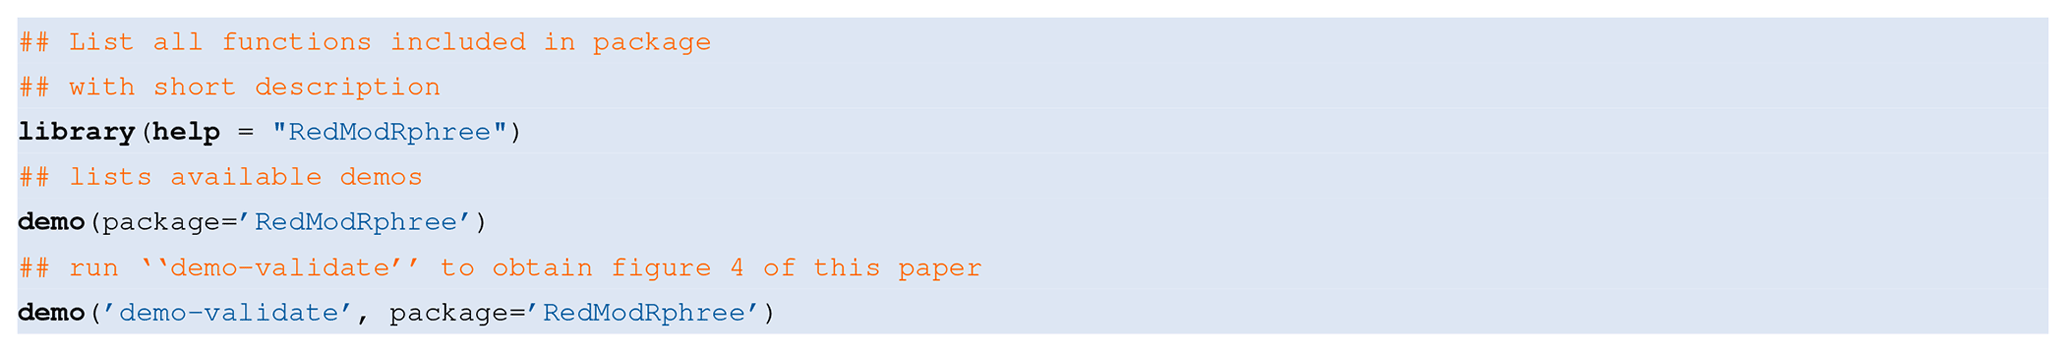
RedModRphree ships with functions' documentation, usage
examples and with a set of demos which illustrate in more detail
different use cases not covered in this manuscript
(Listing 10). The code of the included demos is commented
and intended as additional documentation.
In particular, several demos focus on the use of pre-trained emulators
or surrogates instead of more computationally expensive
PHREEQC calculations in 1D advective reactive transport
simulations (De Lucia and Kühn, 2021). Surrogates are machine learning
regressors able to reproduce a multivariate output as function of
multivariate input. They must be trained in advance on a set of
PHREEQC simulations, and can then be plugged-in in coupled
reactive transport simulations for speedup. More details concerning
the reactive transport capabilities of RedModRphree are given in
Sect. 3.2.
3.1 Pourbaix diagrams
Pourbaix or Eh-pH diagrams were first introduced by the Belgian
chemist Marcel Pourbaix in 1945. They are standard phase diagrams with
electrochemical potential (Eh or pe) and pH as axes, and are a
valuable tool in electrochemistry, material science and in general in
aqueous chemistry and geochemistry (Huang, 2016; Hennig et al., 2020),
since they synthetically summarize the thermodynamically stable phases
(i.e., at chemical equilibrium) of an aqueous electrochemical system.
Since they are based on thermodynamics, like all phase diagrams, they
do not account for reaction rates or kinetic effects. Classically, the
boundaries between predominant chemical species (aqueous ions in
solution or solid phases) are straight lines computed directly by
evaluating Nernst and Law of Mass Action equations and imposing a
condition of equality between two species' activities. Such approach
is for example employed by the CHNOSZ package
(Dick, 2019). However, beside potential and pH, the equilibrium
activities depend also upon temperature, pressure, and, crucially, on
the activities of all other dissolved species in the considered
system. This makes the classical approach illicit from a rigorous
standpoint (Kölling et al., 2000). In particular, the predominance
region for a given species should be defined as the locus of points in
the diagram where its activity is larger than the activities of
all other species. The borders between regions would not result
in straight lines anymore, but curves.
PHREEQC offers the capability to calculate the speciation of
a solution in its entirety; and using RedModRphree it is
simple to achieve a more realistic predominance diagram as suggested
by Kölling et al. (2000). This has been implemented in the
Pourbaix function, which performs the computations and
visualizes the diagram in a convenient way. The user provides a base
script describing the solution and defines at which levels of pe and
pH the speciation must be calculated; the function computes all
combinations of these levels in a dense grid, restricted to the
stability region of water, approximated by the limiting boundaries for
release of molecular hydrogen and oxygen respectively
(Eqs. 1, 2), not considering the effect of temperature.
The corresponding simulations are computed in parallel if the
procs argument is larger than one. Then from the results for
each simulation point, the mineral with largest positive saturation
index is extracted, or, if none has positive SI, the largest activity
of all the dissolved species. Once all the data are collected, the
whole parameter space is displayed assigning a different colour for
each phase. Each region is labelled with the brute formula of the
represented species, written in italic font under their name for the
minerals. Optionally the function restricts the diagram only to phases
or species containing one element, specified by the element
argument. If left unspecified, then all computed saturation indices
and activities are considered in the diagram. The current version of
Pourbaix() does not support the inclusion of pure phases at
equilibrium with the system, such as partial pressure of
CO2(g). Furthermore, no check is performed whether the
resulting equilibrated solutions have a different pH or pe than the
values specified in the input for each simulation point. Frequent
numerical instabilities and non-convergence of simulations happen near
the boundaries of the water stability region, in particular for large
pe values. Since no error control mechanism is implemented in the
current RedModRphree version, the user is recommended to
restrict the range of pe and pH and to try different resolutions of
the calculation grid.
Figure 2 (Listing 11) displays the Pourbaix diagram for copper speciation in a solution containing Na, Cl, Ca and Fe, on a 101×101 grid for a total of 8239 simulations inside the water stability region, which computes in under three seconds employing two CPUs.
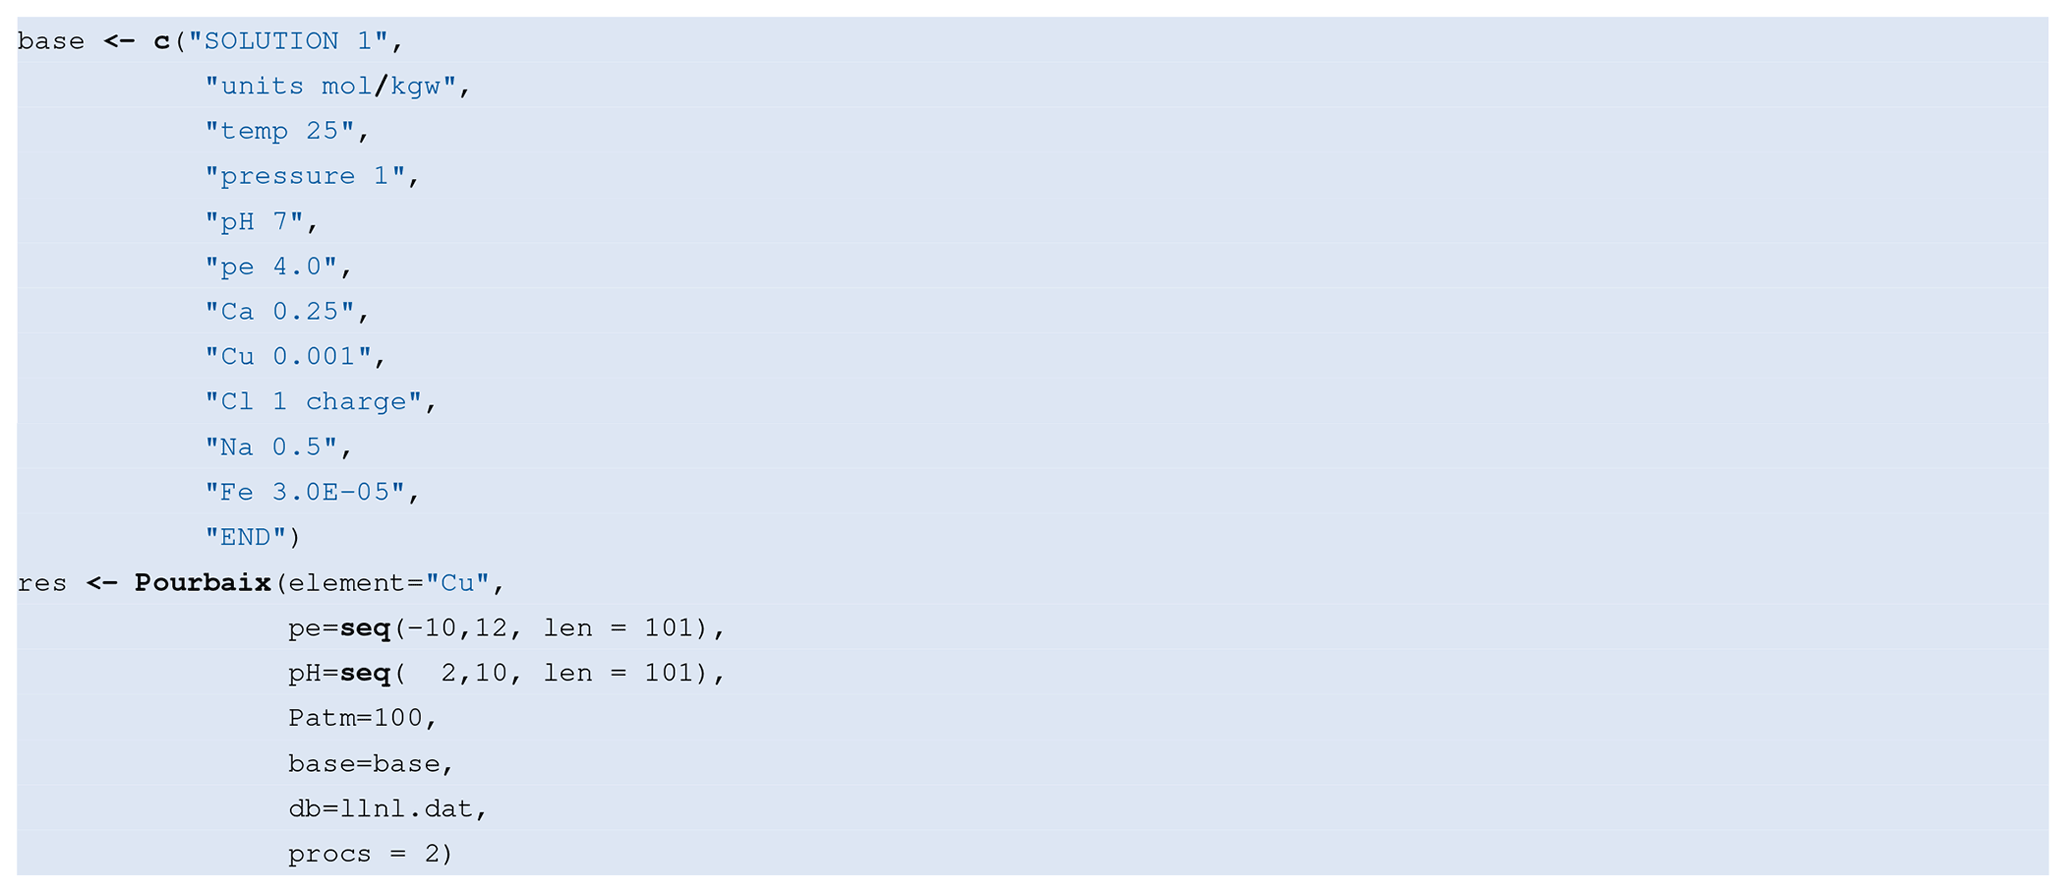
Listing 11R code used to obtain Fig. 2, which represents the equilibrium speciation of 10−3 moles of copper in 1 kg of water in presence of total dissolved Ca, Cl, Na and Fe concentrations as indicated in the picture.
Specifying aqonly=TRUE restricts the diagram to aqueous
species only. In this case, the user can specify a specific valence
state for the element argument, for example with
element='Fe(2)'. This option is only reliable for aqueous
species since the valence state of an element in minerals is not
readily obtainable by parsing the stoichiometric equations in a
PHREEQC database. Finally, the user can specify a list of
species or phases to be excluded from the diagram, enumerating them
using the argument suppress.
A Pourbaix diagram is a synthetic way to highlight discrepancies in
different thermodynamic databases, indicating the need for a closer
inspection of the applied databases and/or more experimental data to
support them. Figure 3
(Listing 12) showcases the aqueous speciation of
iron computed by evaluating the same base solution with the
phreeqc.dat and llnl.dat databases. It is apparent
that the stability region of ferric oxyhydroxide FeIII(OH)3
is quite different following the two databases.
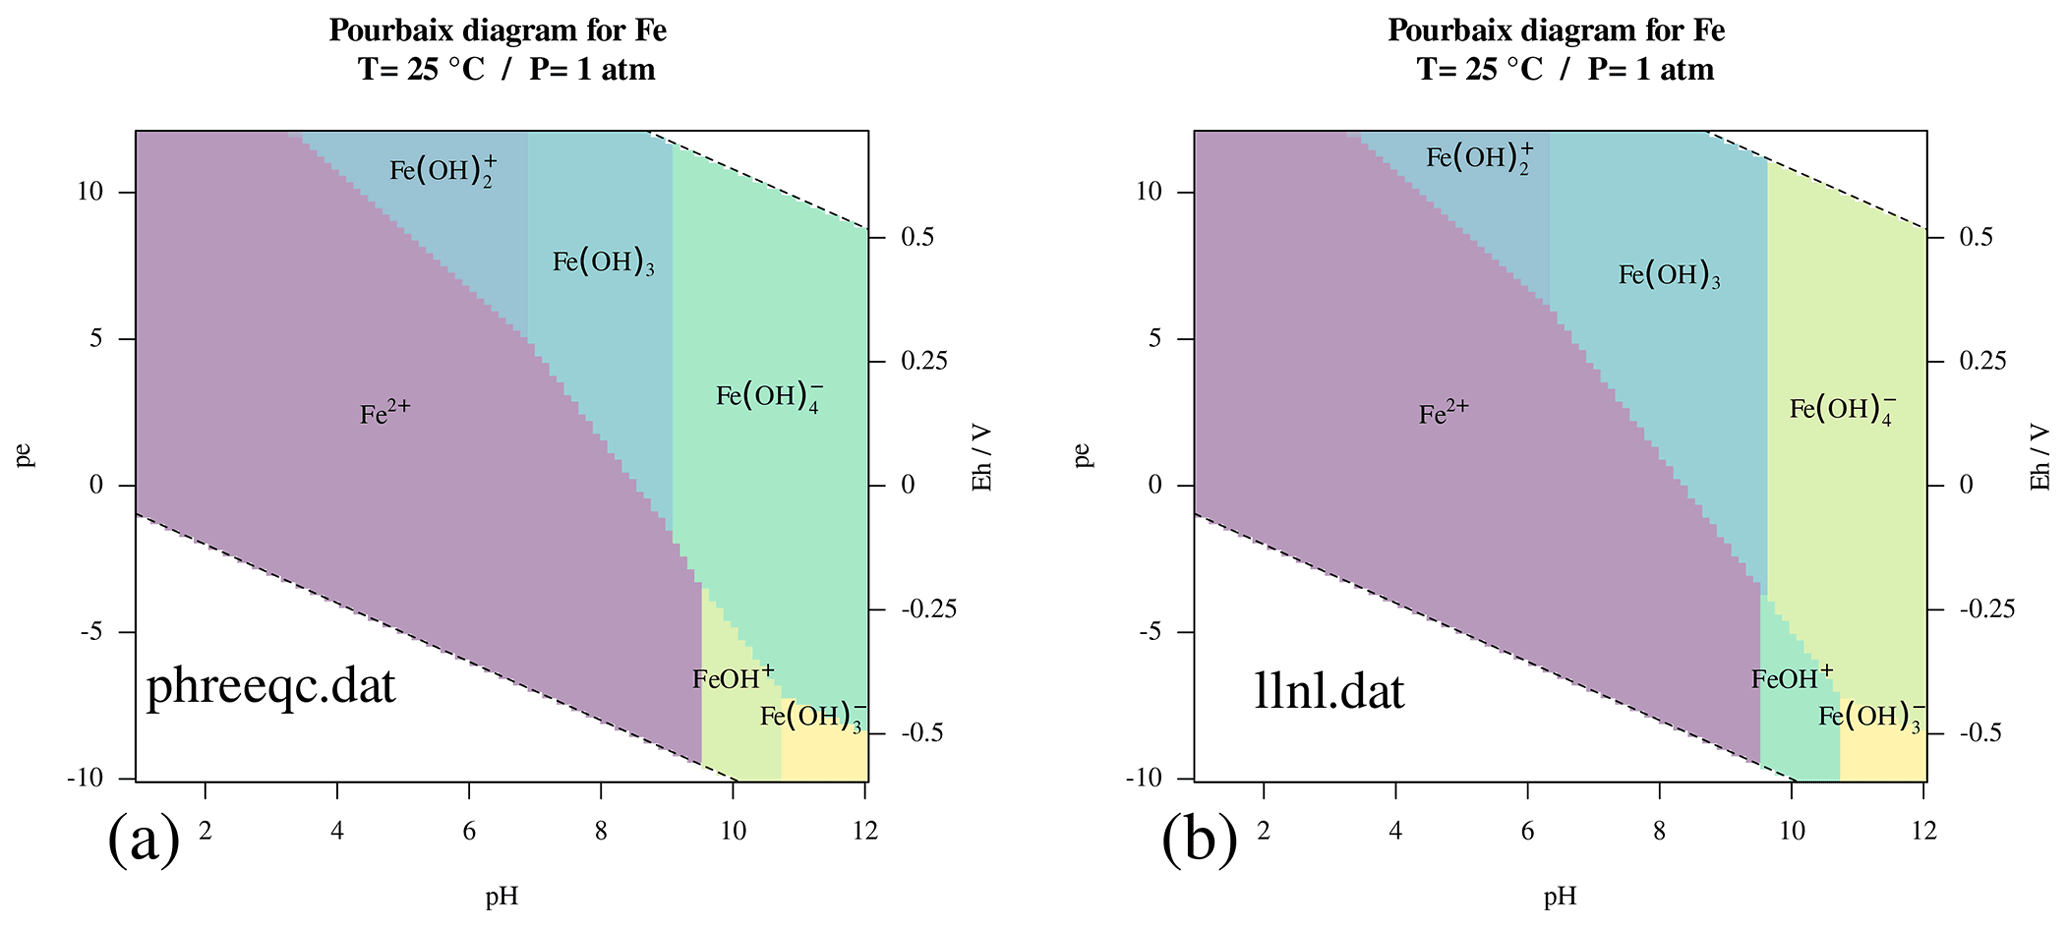
Figure 3Pourbaix diagrams of aqueous iron speciation at 25 ∘C and p=01:00 atm using two different thermodynamic databases: (a) phreeqc.dat and (b) llnl.dat.

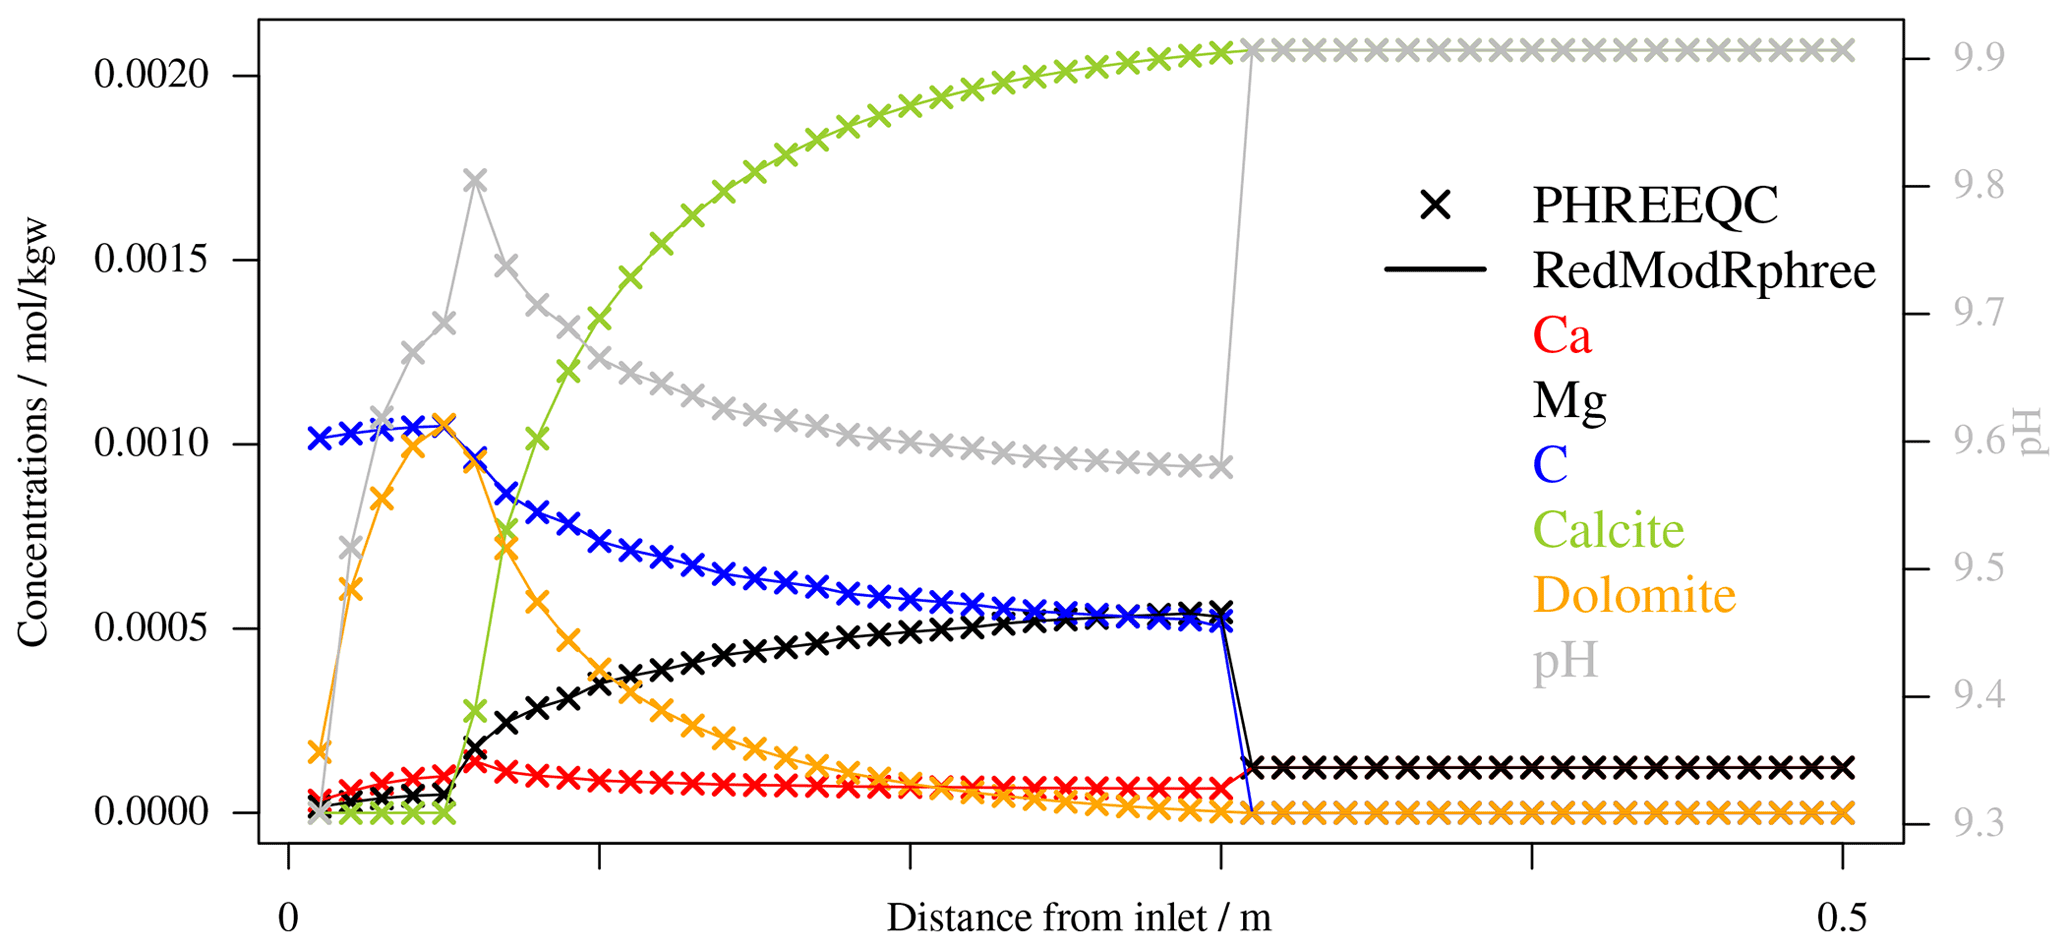
Figure 4Profiles of variables across a 1D domain resulting from
kinetic reactive transport simulations computed with the
ReactTranspBalanceKin function and PHREEQC's
ADVECTION keyword respectively, for validation. A
MgCl2 solution is injected from the left inlet of the
domain which is initially at equilibrium with calcite, triggering
the transient precipitation of Dolomite. Displayed are the
relevant total dissolved concentrations and amounts of minerals
(scale on the left y-axis) and pH (in gray, right y-axis) after 30
coupling iterations. The code used to produce this picture is
included in the package as demo-validate.
A major advantage of a Pourbaix diagram computed in this way is that it can be applied to “real” solutions of any complexity, not being restricted to pure systems of 4 or 5 components as in the classical approach. Furthermore, it is straightforward to implement the same kind of calculations as result of kinetic simulations, thus removing the last limitation shared with the classical diagrams. In facts, in most natural systems even if a mineral is thermodynamically the most favoured in a specific diagram region, other minerals with lower saturation index but faster kinetics may be the phases actually formed (Kölling et al., 2000).
3.2 1D reactive transport using surrogate models
A further application provided by RedModRphree pertains to 1D
reactive transport models. The functions ReactTranspBalanceEq
and ReactTranspBalanceKin implement, for equilibrium minerals
and kinetics respectively, a sequential non-iterative coupling between
transport and chemistry similar to the PHREEQC's
ADVECTION keyword, however disregarding heat transport and
changes in porosity and hence assuming stationary Darcy flow. In
particular, these functions transport total elements concentrations –
a valid assumption in case of pure advection – and the proton and
electron activities instead of total H, total O and charge imbalance,
as done by PHREEQC internally (Parkhurst and Wissmeier, 2015).
Figure 4 shows a visual validation of this
simplified advection approach by comparing the results of a reactive
transport benchmark on a one-dimensional grid with 50 elements
computed once with PHREEQC's ADVECTION and once with
ReactTranspBalanceKin. The whole computation is included in
RedModRphree as demo-validate). In the benchmark, a
MgCl2 solution is injected at the left inlet in a medium
initially at equilibrium with calcite. This reactive solution triggers
the dissolution of calcite and the transient precipitation of
dolomite. All reactions involving minerals are kinetically controlled
with a Lasaga rate law (Palandri and Kharaka, 2004). After 30 iterations with
fixed time step of 999 s, the variables' profiles across the
domain resulting from the two simulations are perfectly superposable,
up to some negligible error imputable to truncation of floating point
numbers occurring when passing from PHREEQC's c domain and
R, which happens through strings.
Furthermore, the above mentioned functions implement an acceleration
technique which at each iteration minimizes the chemical evaluations
by identifying grid elements with nearly equal geochemical problems
(De Lucia and Kühn, 2013). This is achieved by compressing the matrix used
to represent the governing variables for the whole grid (one row per
grid element, one column per concentration). This option is fully
automatic and can be activated by setting argument
reduce=TRUE. It achieves important speedups for initially
homogeneous systems. Moreover, the simulations are again internally
parallelized when argument procs is larger than one. The
users are referred to the specific functions documentation for more
usage details.
The main motivation for the development of these reactive transport
functions was investigating the substitution of equation-based
numerical solution of the chemical sub-process with a pre-trained
statistical surrogate for computational speedup (Jatnieks et al., 2016; De Lucia et al., 2017; De Lucia and Kühn, 2021, which points
to more advanced numerical experiments than those included as demo
into the package). The user
can activate this capability by providing a named list containing the
trained regressors and an R function which uses them to perform the
surrogate geochemistry calculations. This surrogate function is then
called after each advective step, and its predictions are checked for
plausibility by computing mass balances. The predictions trespassing a
user-imposed threshold are rejected and in their place
PHREEQC simulations are run instead. This process is repeated
at each transport-chemistry iteration.
Five of RedModRphree's demos extensively illustrate the usage
of its reactive transport capability. demo-validate,
demo-equilibrium and demo-kinetics are simulations
using only PHREEQC; demo-eq-surr-RF and
demo-kin-surr-RF use Random Forests as surrogates for the
equilibrium and kinetic version of the same reactive transport
problem.
The richness of high-quality third-party applications, the large number of users and the overall maturity and stability of its code base make R an attractive computing platform for geoscientists and in particular for geochemists.
The free and open source RedModRphree package offers
high-level programming utilities and out-of-the-box applications to
enhance users' productivity when working with PHREEQC
geochemical models. The utility functions provided by
RedModRphree help to rapidly perform many parallelized
calculations and collect the corresponding results as required, e.g.,
in sensitivity and uncertainty analyses, thus profiting from the
excellence of the R ecosystem in that area and its graphics
capabilities for visualization.
The RedModRphree version 0.3.6 offers novel applications of
general interest for geochemists, in particular the calculation of
Pourbaix diagrams based on the actual full speciation of complex
aqueous systems. It is a valuable computational tool which overcomes
some limitations of classical stability diagrams. Further development
will aim at including kinetic control of reactions, three-dimensional
stability diagrams, and having different variables as one of the axes,
for example partial pressure of CO2(g).
The package release is meant to attract users and foster collaborative
development in order to increase both the coverage of PHREEQC
functionalities and number and scope of provided applications.
RedModRphree is released under LGPL v2.1 license. A copy of the 0.3.6 version of the package has been stored on Zenodo at https://doi.org/10.5281/zenodo.5046427 (De Lucia, 2021). Until the process of inclusion into the Comprehensive R Archive Network (CRAN) is completed, development versions can be installed from https://git.gfz-potsdam.de/delucia/RedModRphree, last access: 30 September 2021.
MDL shaped the research, performed analyses, programming and wrote the manuscript. MK helped providing funding, shaping the research, and revised the manuscript.
The contact author has declared that neither they nor their co-author has any competing interests.
Publisher’s note: Copernicus Publications remains neutral with regard to jurisdictional claims in published maps and institutional affiliations.
This article is part of the special issue “European Geosciences Union General Assembly 2021, EGU Division Energy, Resources & Environment (ERE)”. It is a result of the EGU General Assembly 2021, 19–30 April 2021.
The authors gratefully acknowledge Helge Moog and an anonymous reviewer for their suggestions which greatily improved the manuscript.
This research has been supported by the Helmholtz Association in the framework of the project “Reduced Complexity Models – Explore advanced data science techniques to create models of reduced complexity” (grant no. ZT-I-0010).
The article processing charges for this open-access publication were covered by the Helmholtz Centre Potsdam – GFZ German Research Centre for Geosciences.
This paper was edited by Sonja Martens and reviewed by Helge Moog and one anonymous referee.
Appelo, C. A. J., Parkhurst, D. L., and Post, V. E. A.: Equations for calculating hydrogeochemical reactions of minerals and gases such as CO2 at high pressures and temperatures, Geochim. Cosmochim. Ac., 125, 49–67, https://doi.org/10.1016/j.gca.2013.10.003, 2013. a
Charlton, S. R. and Parkhurst, D. L.: Modules based on the geochemical model PHREEQC for use in scripting and programming languages, Comput. Geosci., 37, 1653–1663, https://doi.org/10.1016/j.cageo.2011.02.005, 2011. a, b
De Lucia, M.: RedModRphree (0.3.6), Zenodo [code], https://doi.org/10.5281/zenodo.5046427, last access: 30 September 2021. a
De Lucia, M. and Kühn, M.: Coupling R and PHREEQC: Efficient Programming of Geochemical Models, Energy Proced., 40, 464–471, https://doi.org/10.1016/j.egypro.2013.08.053, 2013. a, b
De Lucia, M. and Kühn, M.: DecTree v1.0 – chemistry speedup in reactive transport simulations: purely data-driven and physics-based surrogates, Geosci. Model Dev., 14, 4713–4730, https://doi.org/10.5194/gmd-14-4713-2021, 2021. a, b
De Lucia, M., Kempka, T., Jatnieks, J., and Kühn, M.: Integrating surrogate models into subsurface simulation framework allows computation of complex reactive transport scenarios, Energy Proced., 125, 580–587, https://doi.org/10.1016/j.egypro.2017.08.200, 2017. a
Dick, J. M.: CHNOSZ: Thermodynamic Calculations and Diagrams for Geochemistry, Front. Earth Sci., 7, https://doi.org/10.3389/feart.2019.00180, 2019. a, b
Hennig, T., Stockmann, M., and Kühn, M.: Simulation of diffusive uranium transport and sorption processes in the Opalinus Clay, Appl. Geochem., 123, 104777, https://doi.org/10.1016/j.apgeochem.2020.104777, 2020. a
Huang, H.-H.: The Eh-pH Diagram and Its Advances, Metals, 6, 23, https://doi.org/10.3390/met6010023, 2016. a
Jatnieks, J., De Lucia, M., Dransch, D., and Sips, M.: Data-driven Surrogate Model Approach for Improving the Performance of Reactive Transport Simulations, Energy Proced., 97, 447–453, https://doi.org/10.1016/j.egypro.2016.10.047, 2016. a
John, M., Heuss-Aßbichler, S., and Ullrich, A.: Conditions and mechanisms for the formation of nano-sized Delafossite (CuFeO2) at temperatures ≤90 ∘C in aqueous solution, J. Solid State Chem., 234, 55–62, https://doi.org/10.1016/j.jssc.2015.11.033, 2016. a
Johnson, J. W., Oelkers, E. H., and Helgeson, H. C.: SUPCRT92: A software package for calculating the standard molal thermodynamic properties of minerals, gases, aqueous species, and reactions from 1 to 5000 bar and 0 to 1000 ∘C, Comput. Geosci., 18, 899–947, https://doi.org/10.1016/0098-3004(92)90029-q, 1992. a
Kölling, M., Ebert, M., and Schulz, H. D.: A Novel Approach to the Presentation of pε/pH-Diagrams, in: Redox: Fundamentals, Processes and Applications, edited by: Schüring, J., Schulz, H. D., Fischer, W. R., Böttcher, J., and Duijnisveld, W. H. M., Springer, Berlin, Heidelberg, 55–63, https://doi.org/10.1007/978-3-662-04080-5_5, 2000. a, b, c, d
Mullen, K.: CRAN Task View: Chemometrics and Computational Physics, available at: https://cran.r-project.org/web/views/ChemPhys.html, last access: 30 June 2021. a
Palandri, J. L. and Kharaka, Y. K.: A compilation of rate parameters of water-mineral interaction kinetics for application to geochemical modeling, Tech. Rep., USGS Menlo Park, California, USA, available at: https://pubs.usgs.gov/of/2004/1068/ (last access: 30 September 2021), 2004. a
Parkhurst, D. L. and Appelo, C. A. J.: Description of input and examples for PHREEQC version 3 – A computer program for speciation, batch-reaction, one-dimensional transport, and inverse geochemical calculations, available at: https://pubs.usgs.gov/tm/06/a43 (last access: 30 September 2021), 2013. a
Parkhurst, D. L. and Wissmeier, L.: PhreeqcRM: A reaction module for transport simulators based on the geochemical model PHREEQC, Adv. Water Resour., 83, 176–189, https://doi.org/10.1016/j.advwatres.2015.06.001, 2015. a
Plotly Technologies, I.: Collaborative data science, available at: https://plot.ly (last access: 30 June 2021), 2015. a
R Core Team: R: A Language and Environment for Statistical Computing, R Foundation for Statistical Computing, Vienna, Austria, available at: https://www.R-project.org/, last access: 30 September 2021. a
Zeileis, A.: CRAN Task Views, R News, 5, 39–40, available at: https://CRAN.R-project.org/doc/Rnews/ (last access: 30 June 2021), 2005. a
Zeileis, A.: CRAN Task View, available at: https://cran.r-project.org/web/views/, last access: 30 June 2021. a