 | 27 Jan 2022
Subsurface seismic imaging with a hammer drilling source at an exploration drilling test center in Örebro, Sweden
Monika Ivandic
Ayse Kaslilar
Christopher Juhlin
Seismic imaging while drilling (SWD) technology offers possibilities of imaging ahead of the drill-bit, which could be useful for determining when to go from hammer drilling to core drilling. Also, seismic images of the surrounding rock can improve geological models which could be then used to guide drilling programs.
An SWD field test was carried out in August 2020 at an exploration drilling test site in Örebro, Sweden, with the aim to determine if the signals from hammer drilling can be used for seismic imaging around the drill-bit in a hard-rock environment where the strong drill-rig noise interference is one of the main challenges. The test site had previously been investigated with various geophysical methods, geological mapping and diamond core drilling, and it therefore represented an ideal location to perform this feasibility study.
After data pre-processing and cross-correlation with the trace from the geophone closest to the rig, the shot-gathers were vertically stacked over the length of a drill pipe to achieve further signal improvement. A comparison with the active seismic data shows reasonable agreement, in spite of the fact that the noise level is significant even after careful processing. However, the lack of clear reflections in the active seismic data, indicating no detectable changes in the bedrock lithology in the near surface, hinders the full assessment of the seismic signal generated with hammer drilling at this site.
- Article
(2022 KB) - Full-text XML
- BibTeX
- EndNote


The idea of using the drill-bit as a seismic source has been around since the late 1980s or earlier (Rector and Marion, 1991) and has been advocated by a number of researchers over the years (e.g. Malusa et al., 2002; Poletto and Dordolo, 2002; Poletto et al., 2012; Petronio and Poletto, 2002; Bakulin et al., 2020). The basic principle is that the seismic signal generated by the drill-bit is simultaneously recorded by a pilot sensor mounted on the top of the drill string and by seismometers deployed on the surface at multi-offset positions from the borehole or in a second borehole. The extended signal generated by the drill-bit can then be compressed into an impulsive-like signal by correlating the drill-bit noise with the recordings from the seismometers. A similar procedure is used in seismic acquisition with a vibroseis source where cross-correlation of the geophone traces with the reference signature recorded on the base plate of the vibrator has to be performed in order to extract a more impulsive-like signal. The only difference is that a vibroseis sweep is close to an ideal pilot signal, whereas the drill-bit pilot signal requires further processing to obtain an approximation of the ideal pilot signal. After correlation, the data can be processed as if the source had been impulsive (Zhou et al., 2015).
The benefits of effective SWD are multiple. The main emphasis of the seismic while drilling technique has been related to petroleum exploration, but also on the imaging ahead of the tunnel face in underground construction projects (e.g. Petronio et al., 2007; Giese et al., 2007). The SWD data can provide structural information of the surrounding rock to better locate possible fault zones, and to identify other anomalies in the geological structure around the well (Poletto et al., 2011; Poletto and Miranda, 2004). The SWD technique can also assist in confirming or configuring basin and reservoir models and provide the ability to predict pore pressure ahead of the bit. Using the SWD technology can overcome the drilling problems, such as sticking and loss of drill strings, and improve drilling safety and efficiency (Sun et al., 2015). Compared with the conventional VSP and VSP while drilling (VSP-WD), SWD does not require additional downhole explosives or air gun seismic sources. Moreover, there is no interruption to the drilling operation time, and no risk to wellbore and downhole tools (Poletto and Miranda, 2004; Naville et al., 2004; Hardage, 2009).
Since successful SWD captures seismic data without interrupting drilling operations, saving money and reducing drilling risks, it is of great interest for the mining industry as well, where, compared to the oil industry, the depths of interest are generally less and the hard rock transmits seismic energy with less attenuation than in the sedimentary rocks explored for oil.
The aim of this study was to inspect if the signals from hammer drilling can be used for seismic imaging of the surrounding rock in a hard-rock environment where the strong drill-rig noise interference is one of the main challenges. The hammer is expected to generate stronger seismic signals than normal diamond bit coring. If it is possible to look below the bit, the seismic images could be useful for determining when to go from hammer drilling to core drilling, providing effective exploration drilling possibilities for mineral resources. Also, the improved geological models retrieved from the seismic images can be used to guide ongoing and future exploration and drilling programs. Thus, SWD is a very robust evaluation technique for the mining industry and integrating the data flow and processing scheme of an SWD program in their information interchange system would provide them with near-real-time images of the rock formations ahead of the bit and optimize drilling operations, with reduction of costs and risks associated with drilling.
The test site in Örebro (Fig. 1) in south-central Sweden is an outcome of Innovative Exploration Drilling and Data Acquisition (I-EDDA; http://www.iedda.eu, last access: 24 June 2021), a Network of Infrastructures in the European Institute of Innovation & Technology (EIT) Knowledge and Innovation Community (KIC) “RawMaterials”, whose aim was to bring together drilling engineers and geoscientists in order to develop new on-site measurement technologies and drilling methods. The I-EDDA test center (I-EDDA-TC), developed together with the industry partner Epiroc, offers users in industry, research and academia to test their innovative equipment and in an operational and geological environment similar to many mineral and mining districts.
The active seismic study performed at the site in July 2019 consisted of a small high resolution 3D seismic survey and a deeper 2D survey using a large vibrator source supplied by Technical University of Freiberg (TUBAF). The results of the SWD field test could be therefore compared with the images obtained from the active survey.
The SWD measurements were performed in August 2020 during the air-hammer drilling of a 200 m deep borehole (Figs. 1, 2). The operational frequency of the hammer was about 50 Hz. The data were recorded continuously during the drilling operation along a W–E oriented line consisting of 44 1C geophones with a spacing of about 2 m and the rig located approximately in the middle of the profile, near station 17. Althoughthe line contained 56 channels, only receivers 1–40, 51–53 and 56 were active during the recording. The locations of the active sensors and the rig are shown in Fig. 1. The recording length was 10 s, and the sampling rate 1 ms. The recording would start shortly before the startup of the drilling and end shortly after it ended.
Since a pilot sensor that could be mounted at the top of the drill string was not available for this field test, the passive recordings on the surface were correlated with the trace from the geophone closest to the rig. It has been previously shown that a good-quality seismic signal can be retrieved even without a pilot trace, although with some mono-frequency waveform footprints present in the cross-correlograms (Asgharzadeh et al., 2019).
An example of a raw shot-gather while the bit was drilling at ∼ 50 m depth is displayed in Fig. 2, showing strong rig-generated noise near receiver 17.
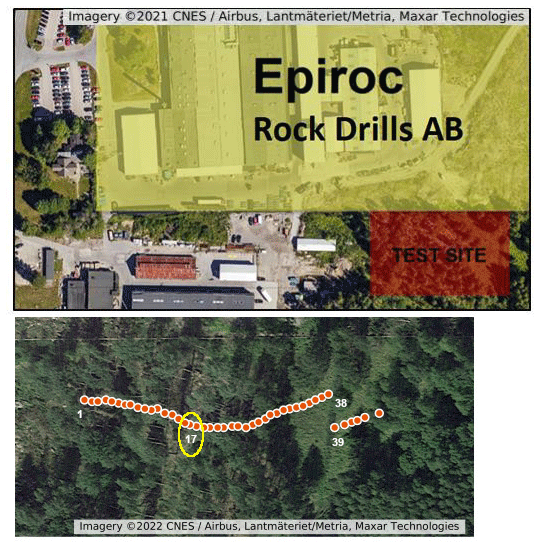
Figure 1The test site next to the Epiroc factory in Örebro, Sweden (upper figure), and the SWD acquisition geometry for the data presented in this study consisting of 44 1C geophones and the rig (marked with DB) located near station 17 (lower figure). The maps were made with © Google My Maps.
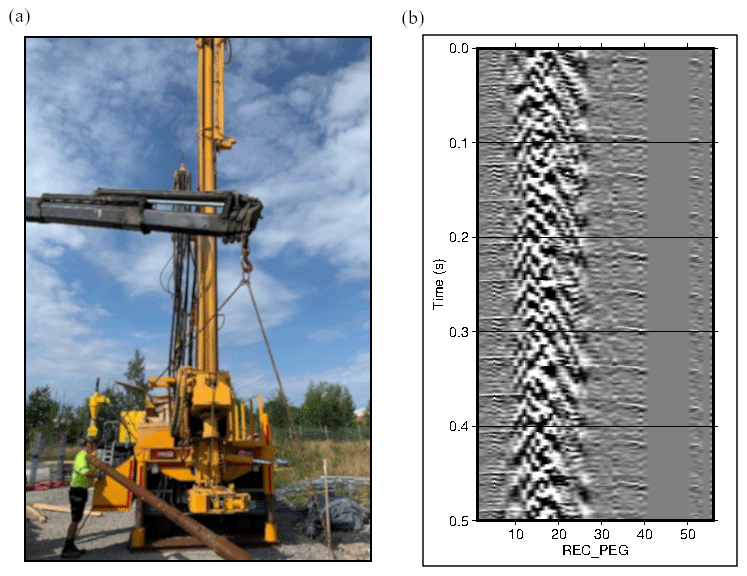
Figure 2Hammer drilling at the I-EDDA test site in Örebro, Sweden (see Fig. 1) in August 2020 (a); Raw shot gather showing strong rig-generated noise near station 17. The seismic line contained 56 channels, but only receivers 1–40, 51–53 and 56 were active during the recording (b).
The virtual shot-gathers were produced and processed to obtain interpretable seismic data. The data processing was performed with the software Globe Claritas (http://www.petrosys.com.au/claritas/globeclaritas-software, last access: 24 January 2022). Different processing steps and parameters have been tested to improve the signal to noise ratio.
The trace from the geophone closest to the rig was correlated with the receiver array to generate the virtual shot gathers (Poletto and Miranda, 2004) using the following equation:
where and represent the measured wavefield at positions xa and xb, respectively, for a source at position xs, and the symbol ⊗ denotes cross-correlation.
The cross-correlograms contained several strong mono-frequency events (Fig. 3), which were attenuated with the application of spectral equalization.
After the data pre-processing (step 1–4 in Table 1), cross-correlation, and spectral equalization, strong linear noise with the velocity range of ∼ 200–300 m s−1 and wide frequency bandwidth, which appears to comprise both the airwave and the noise generated by the drill-rig, was muted along a narrow corridor containing this energy. The attempt to remove it with the application of an FK filter degraded the final image. In Fig. 4 are displayed the FK spectra before and after the velocity filtering, showing that the filtering has effectively removed the airwave and the noise coming from the drill-rig, although the portion of the data containing signal that was superimposed on the muted noise has also been affected in the process.
The shot-gathers were then vertically stacked over approximately 15 min of drilling time for each 6 m long drill pipe to achieve further signal improvement. Stacking over the length of two drill pipes has also been tested but did not result in an enhanced signal-to-noise ratio. The entire processing workflow is given in Table 1, and the resulting shot-gathers are shown in Fig. 5.
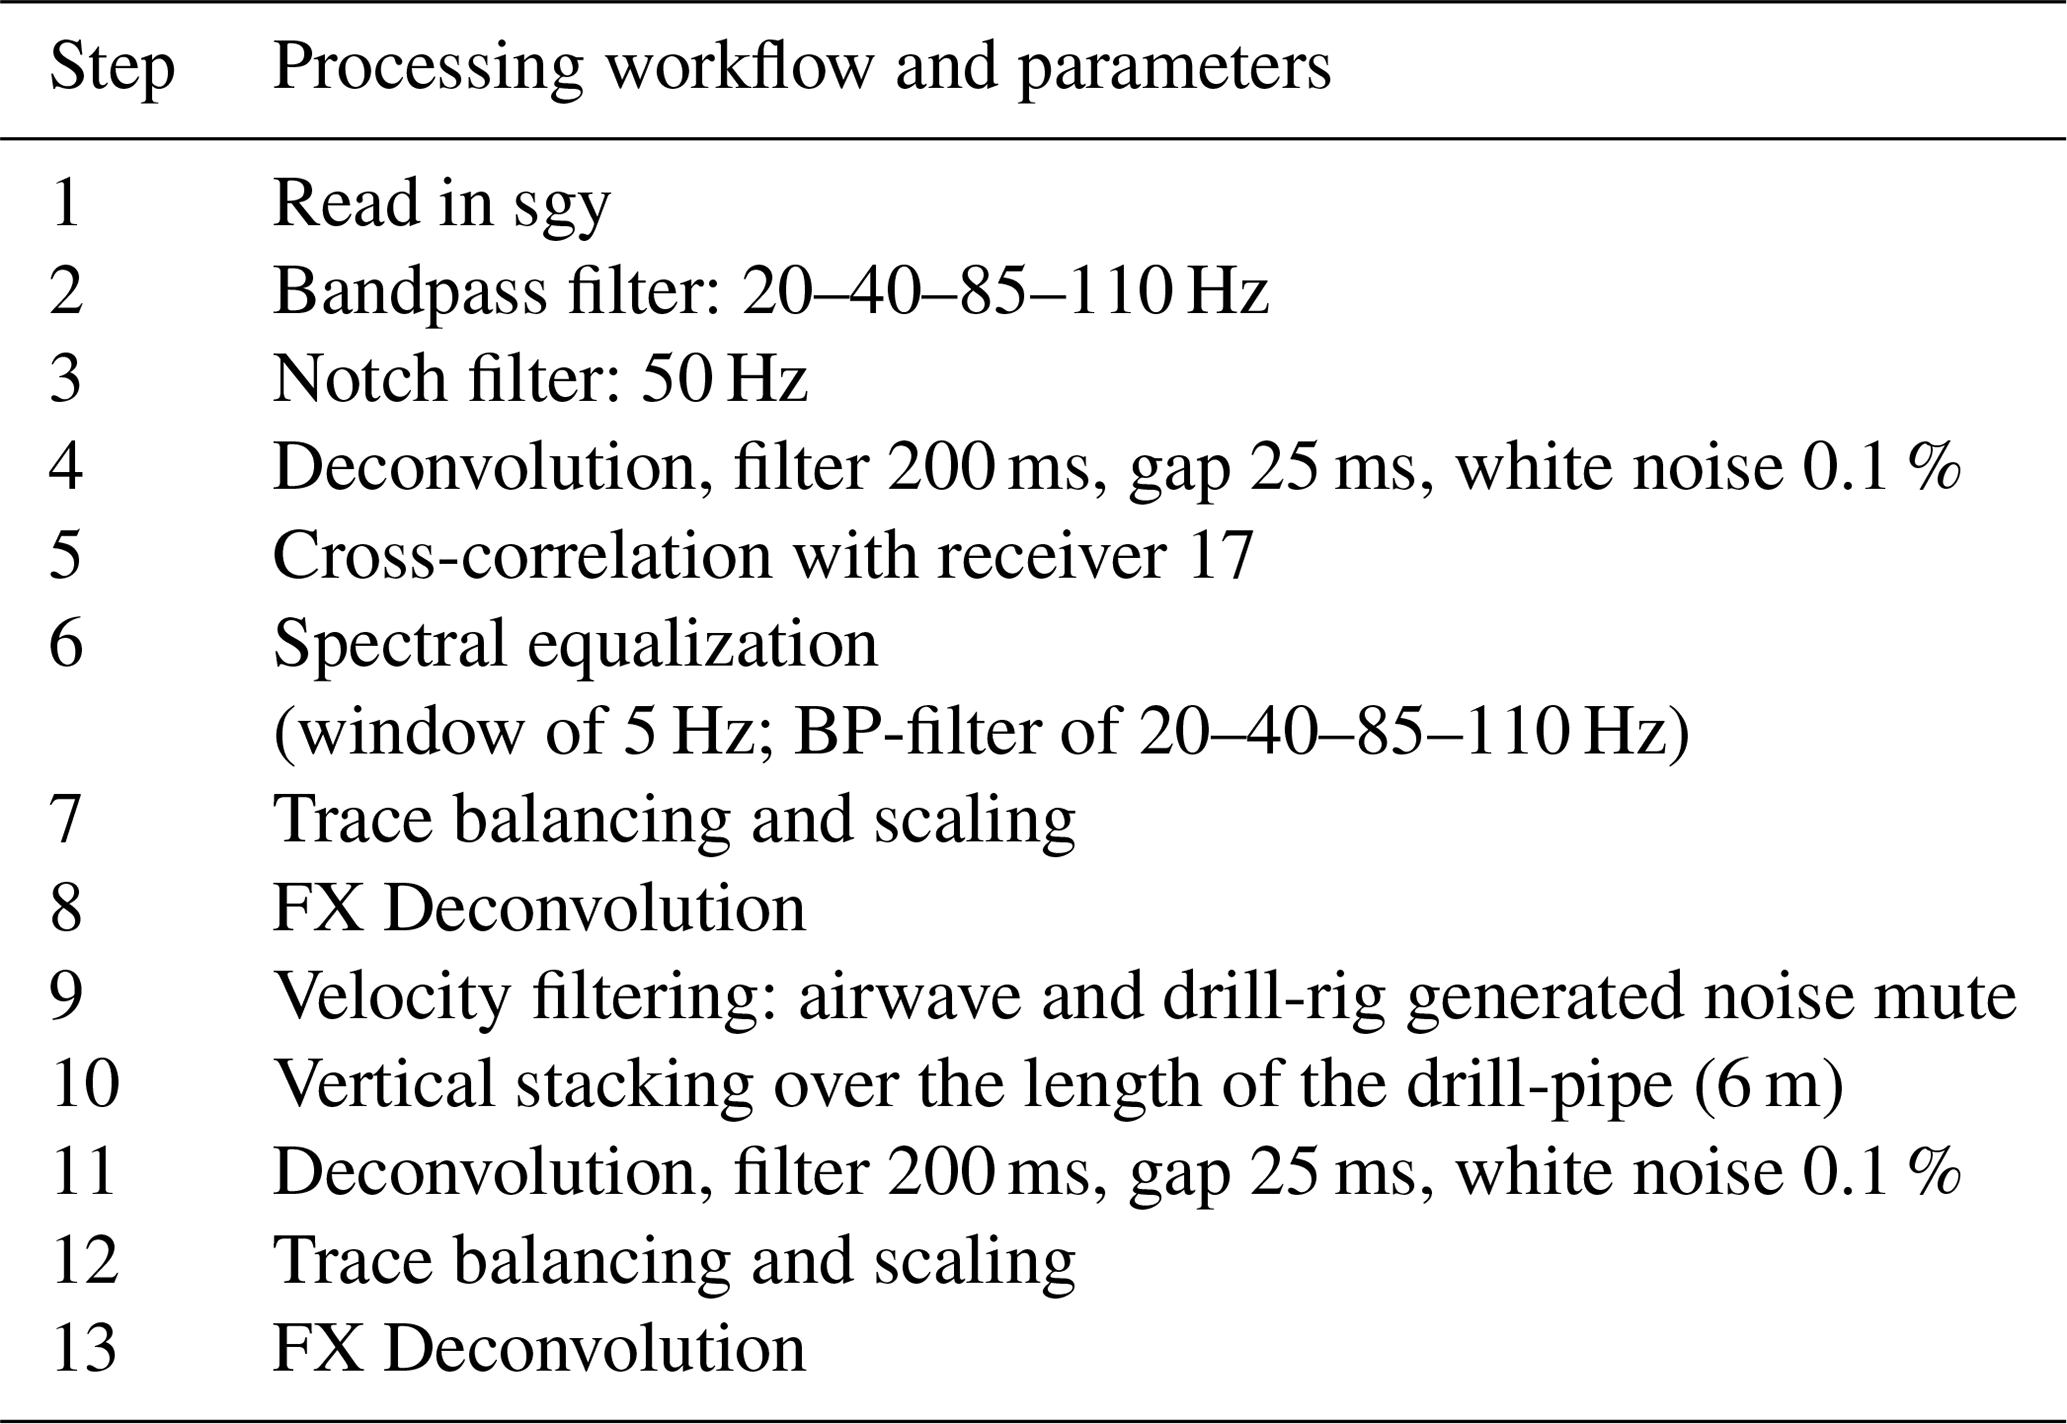
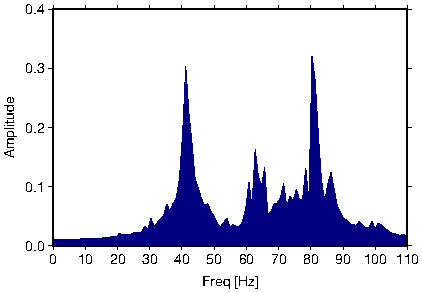
Figure 3Amplitude spectra after cross-correlation and before the application of spectral equalization (see Table 1) showing high-amplitude mono-frequency events.
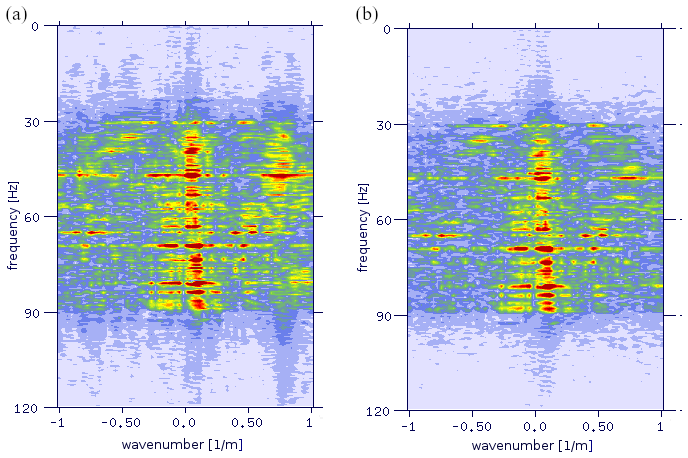
Figure 4The FK spectra before (a) and after (b) the velocity filtering. The FK amplitudes are plotted with the same colour scale.
Synthetic shot-gathers were also generated for a comparison with the processed shot-gathers (Fig. 6). The modelling was conducted using 2D finite-difference modelling (Thorbecke and Draganov, 2011) with the acquisition setup similar to the one in the real-data test and with the drill-bit source represented by 50 sources with random source signatures, starting times and source time durations. The acquisition geometry contained 35 receivers placed at 3 m intervals. The P-wave velocity model is based on that from the active seismic survey (Juhlin et al., 2019) with a velocity of the top layer of 2700 m s−1 and the underlying bedrock of 5500 m s−1. The other parameters were the following ones: Vs and density of the top layer were 1560 m s−1 and 2000 kg m−3, respectively, and of the bedrock 3180 m s−1 and 2800 kg m−3, respectively. The bedrock is placed at 5 m depth based on analysis of the CMP super-gathers of the active seismic data acquired at the site. The model has an extent of 500 m in both the horizontal and vertical direction surrounded by absorbing boundaries at the sides. The boundaries of the synthetic model are 200 m away from the nearest receiver and are tapered to reduce artificial boundary reflections. The borehole is located at the centre of the model. The maximum frequency in the synthetic data set was 100 Hz.
A comparison of the best-fit linear trend to the first-breaks picks in the real-shot gather (Fig. 5a) to the slope trend of the first-arrivals in the synthetic shot-gather generated at the same depth (i.e. at 9 m depth; Fig. 6c), indicates that the SWD images give the correct representation of the subsurface structure.
It should be also noted that the modelling indicated that a cross-coherence method rather than cross-correlation would result in a better quality of the seismic signal. Similar observations were made by Cao and Askari (2019). However, the real data set in this case study did not show significant improvement and, therefore, the cross-correlation method was used for obtaining impulse-like seismograms.
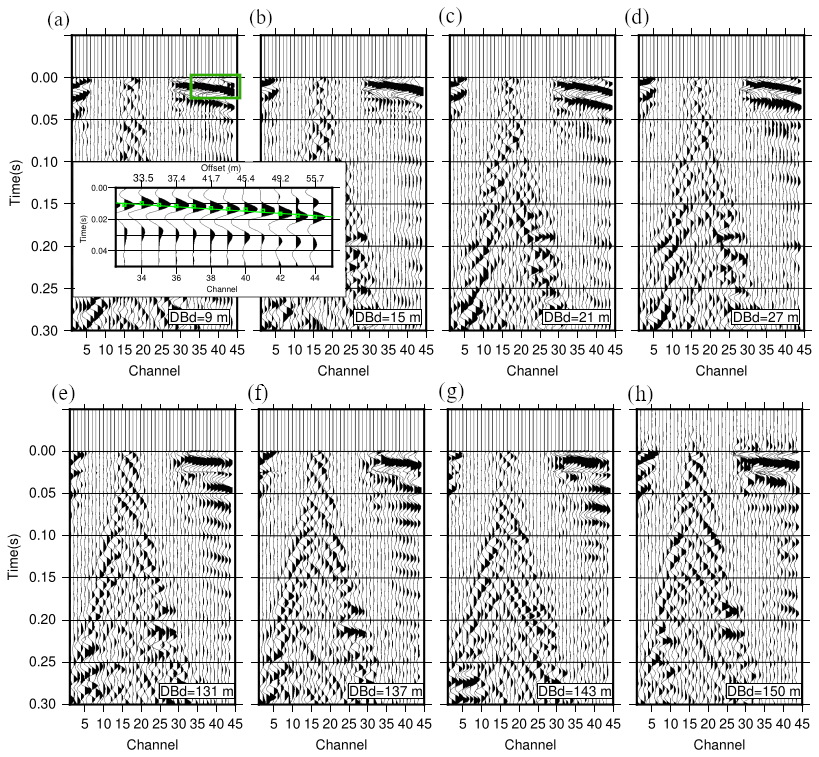
Figure 5Shot-gathers of the processed real data generated with the drill-bit source at different depths (marked as DBd): 9 to 27 m (a–d), and 131 to 150 m depth (e–h). A time-window of 50 ms before zero-time is also displayed for better visualisation of the first arrivals. The inset panel in (a) shows the enlarged version of the traveltimes encompassed by the green rectangle, the first-breaks picks and their best-fit linear trend.
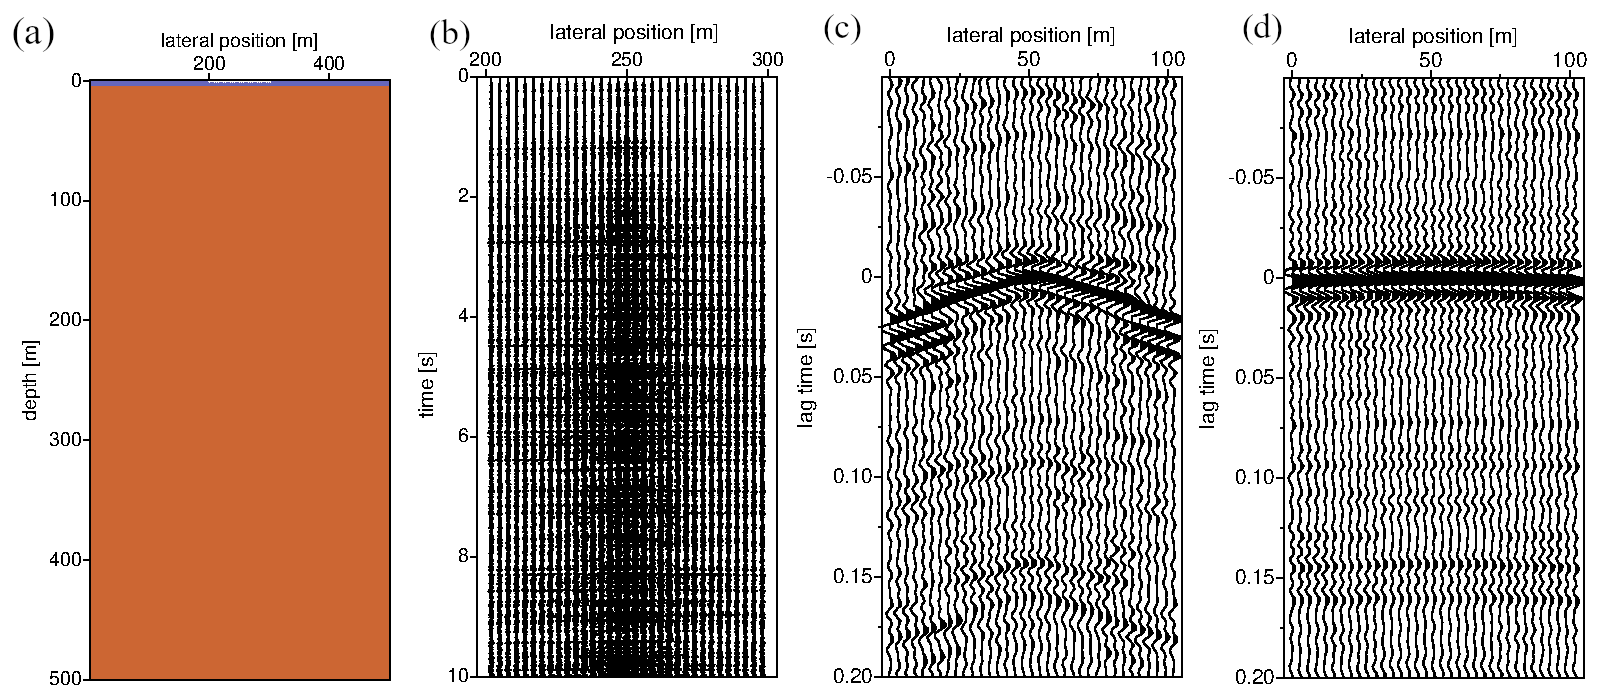
Figure 6The synthetic layered model (see text for parameter values) (a), the synthetic drill-bit signal (b) and the synthetic shot gathers with the source positioned at a depth of 9 m (c), and at a depth of 131 m (d). The drill-bit source is represented by 50 sources with random source signatures, starting times and source time durations.
The interpretation based on the analysis of the active seismic data (Juhlin et al., 2019) shows that the direct arrival has a velocity corresponding to dry glacial sediments, and the first refractor a velocity corresponding to water saturated glacial moraine. Imaged is also a weak refraction at offsets greater than about 25 m, which is interpreted as the bedrock refraction. No clear reflections were detected within the bedrock, which consists mainly of gneisses and metasediments (Juhlin et al., 2019).
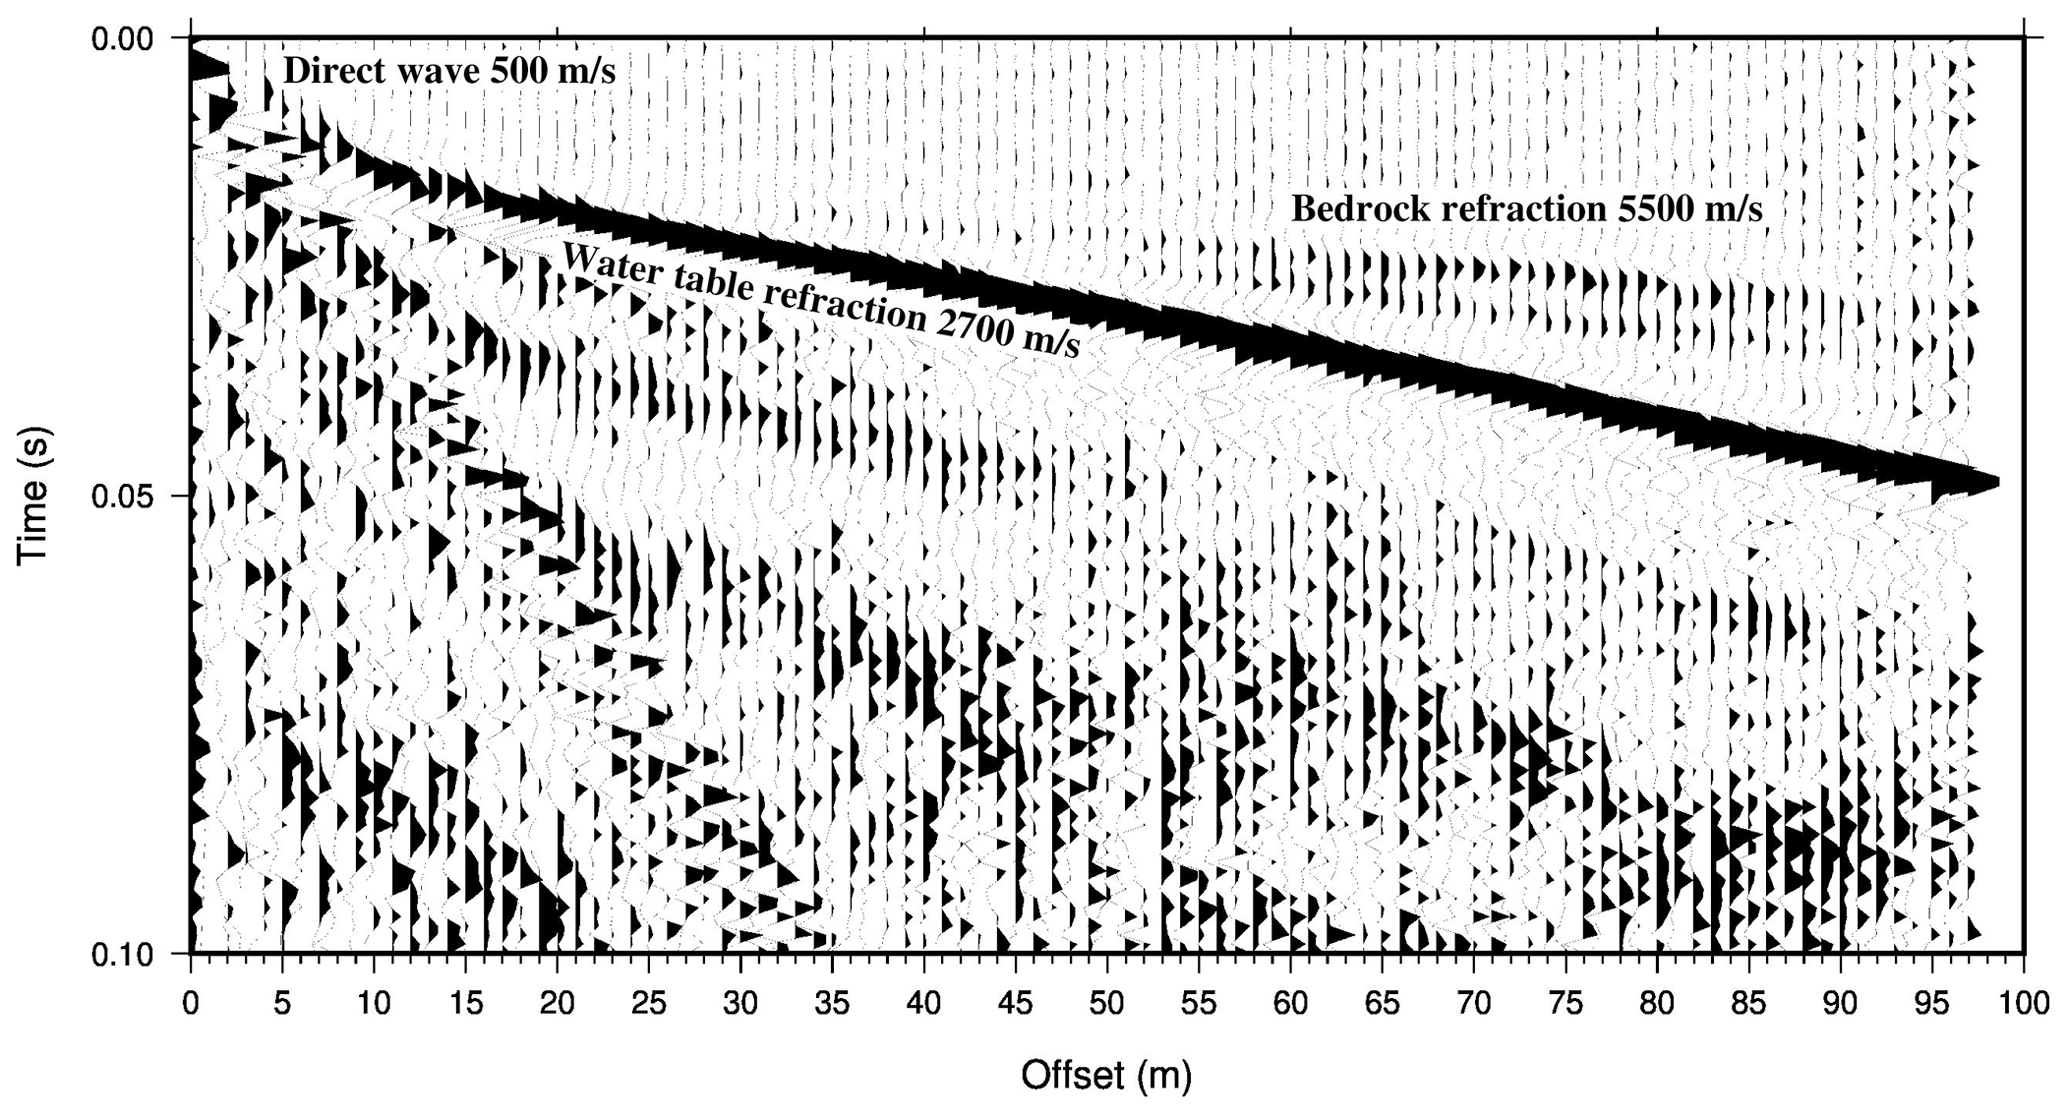
Figure 7Active seismic test at the site: the direct arrival has a velocity corresponding to dry glacial sediments. The first refractor has a velocity corresponding to water saturated glacial moraine. The weak refraction at offsets greater than about 25 m is from the bedrock surface (figure recreated from Juhlin et al., 2019).
A comparison of the data generated with the drill-bit (Fig. 5) with the active seismic source data (Fig. 7) by inspecting the slopes of the first arrival traveltimes shows that the passive recordings can provide a comparable result, in spite of the fact that the noise level generated by the rig remained significant even after careful processing. Moreover, a large portion of the section is contaminated by the rig noise due to the relatively small offsets in the survey. As an example, a few first traces after the muted zone on both sides of the rig (Fig. 5) still exhibit incoherent behaviour in most of the displayed shot-gathers, which is probably due to the interference from the drill rig. Consequently, the apparent velocity of the first arrivals on the west side of the rig (Fig. 1) is difficult to assess due to the short receiver spread.
The lack of a pilot signal may have further impacted the quality of the seismic signal. Asgharzadeh et al. (2019) pointed out that when pilot traces are not available, traces of the geophone nearest to the rig may be used in deconvolution and cross-correlation of data, but extra signal processing efforts are required to reduce the effect of source signature on cross-correlation results.
It should also be noted that a mismatch of about 0.01 s exists between the passive and the active shot-gathers. This could be due to the fact that a true stationary point is not present in the traces recorded at all drill-bit depths as a result of limited receiver and source apertures (Schuster, 2009). However, the synthetic study with a similar geometry indicates that the saturated moraine velocity is extracted from the correlated and stacked data, confirming that the signal correlation provides a reasonable representation of an impulsive source at the bit.
Furthermore, based on the first arrivals observed on the panel, which are clearly identified and can be used for velocity estimation between the bit location and the surface, the entire seismic data set shows an agreement with the velocity structure estimated from the active seismic test. That is, the arrivals in the first shot-gathers generated with the drill-bit at shallow depths have the velocity corresponding to the water saturated glacial moraine (https://apps.sgu.se/kartvisare/kartvisare-jordarter-25-100.html, last access: 24 June 2021), whereas those generated with the drill-bit at greater depths have velocities closer to those of the bedrock (Figs. 5 and 7). However, the lack of any clear reflections within the bedrock hinders the complete assessment of the seismic signal generated with the hammer drilling.
Although the constraints put by the site conditions do not represent an ideal scenario for a feasibility study, the results still do indicate that the SWD method has the potential to generate interpretable seismic images of the surrounding rock in this case study.
For access to the raw data contact the corresponding author.
CJ designed the experiments and CJ and AK carried them out. AK and MI performed the modelling study. MI performed the data processing and interpretation and prepared the manuscript with contributions from all co-authors. All authors read and agreed to the published version of the manuscript.
The contact author has declared that neither they nor their co-authors have any competing interests.
Publisher’s note: Copernicus Publications remains neutral with regard to jurisdictional claims in published maps and institutional affiliations.
This article is part of the special issue “European Geosciences Union General Assembly 2021, EGU Division Energy, Resources & Environment (ERE)”. It is a result of the EGU General Assembly 2021, 19–30 April 2021.
This work was partly supported by VINNOVA with the project 2019-04832 titled Integrated Smart Test environment for the mining industry – SMIG. EIT Raw Materials supported the drilling operations and the 2019 geophysical surveys. We gratefully acknowledge this financial support.
This research has been supported by the Swedish Innovation Agency VINNOVA (grant no. 2019-04832).
This paper was edited by Antonio Pio Rinaldi and reviewed by Mehdi Asgharzadeh and two anonymous referees.
Asgharzadeh, M., Grant, A., Bona, A., and Urosevic, M.: Drill bit noise imaging without pilot trace, a near-surface interferometry example, Solid Earth, 10, 1015–1023, https://doi.org/10.5194/se-10-1015-2019, 2019.
Bakulin, A., Aldawood, A., Silvestrov, I., Hemyari, E., and Poletto, F.: Seismic-while-drilling applications from the first DrillCAM trial with wireless geophones and instrumented top drive, Leading Edge, 39, 370–448, 2020.
Cao, H. and Askari, R.: Comparison of seismic interferometry techniques for the retrieval of seismic body waves in CO2 sequestration monitoring, J. Geophys. Eng., 16, 1094–1115, 2019.
Giese, R., Lüth, S., Krüger, K., Mielitz, S. Otto, P., and Borm, G.: ISIS – Integrated Seismic Imaging System for geological prediction ahead of Hard Rock Tunnels, Proceedings, 7th International workshop on the Application of Geophysics to Rock Engineering, 8 July 2007, Lisbon, 2007.
Hardage, B. A.: Drill-bit seismic still has teeth: AAPG Explorer, Geophysical Corner, 30, 34–35, 2009.
Juhlin, C., Almqvist, B. S. G., Buske, S., Ivandic, M., and Linden, C.: Innovative Exploration Drilling and Data Acquisition Test Center: First Geophysical Site Survey, Abstract [NS23B-0837] presented at 2019 Fall Meeting, AGU, 9–13 December 2019, San Francisco, CA, 2019.
Malusa, M., Poletto, F., and Miranda, F.: Prediction ahead of the bit by using drill-bit pilot signals and reverse vertical seismic profiling (RVSP), Geophysics, 67, 1169–1176, 2002.
Naville, C., Serbutoviez, S., Throo, A., Vincké, O., and Cecconi, F.: Seismic While Drilling (SWD) techniques with downhole measurements, introduced by IFP and its partners in 1990–2000, Oil Gas Sci. Technol., 59, 371–403, 2004.
Petronio, L. and Poletto, F.: Seismic-while-drilling by using tunnel boring machine noise, Geophysics, 67, 1798–1809, 2002.
Petronio, L., Poletto, F., and Schleifer, A. Interface prediction ahead of the excavation front by the tunnel-seismic-while-drilling (TSWD) method, Geophysics, 72, G39–G44, 2007.
Poletto, F. and Dordolo, G.: A new approach to offshore drill-bit reverse vertical seismic profiling (RVSP), Geophysics, 67, 1071–1075, 2002.
Poletto F. and Miranda F.: Seismic while drilling, fundamentals for drill-bit seismic for exploration, in: Handbook of geophysical exploration, edited by: Helbig, K. and Treitel, S., Elsevier, Amsterdam, ISSN 0950-1401, Vol. 35, 2004.
Poletto, F., Corubolo, P., Schleifer, A., Farina, B., Pollard, J. S., and Grozdanich, B.: Seismic while Drilling for Geophysical Exploration in a Geothermal Well, Geothermal Resources Council Transactions Volume 35, Proceedings of the GRC Conference, 23–26 October 2011, San Diego, California, USA, ISBN 978-16-1839-482-8, 2011.
Poletto, F., Rocca, F. L., and Bertelli, L.: Drill-bit signal separation for RVSP using statistical independence, Geophysics, 65, 1654–1659, 2012.
Rector, J. W. and Marion, B. P.: The use of drill-bit energy as a downhole seismic source, Geophysics, 56, 628–634, 1991.
Schuster, G. T.: Seismic interferometry, Cambridge University Press, Cambridge, ISBN 13-978-05-2187-124-2, 2009.
Sun, B., Bóna, A., Zhou, B., King, A., Dupuis, C., and Kepic, A.: Drill-rig noise suppression using the Karhunen-Loéve transform for seismic-while-drilling experiment at Brukunga, South Australia, Explor. Geophys., 47, 44–57, 2015.
Thorbecke, J. W. and Draganov, D.: Finite-difference modeling experiments for seismic interferometry, Geophysics, 76, H1–H18, 2011.
Zhou, B., Mason, I. M., Greenhalgh, S. A., and Subramaniyan, S.: Seeing coal-seam top ahead of the drill bit through seismic-while-drilling, Geophys. Prospect., 63, 166–182, 2015.
- Abstract
- Introduction
- Seismic-while-drilling (SWD) data acquisition
- Data processing and analysis
- Comparison with the active seismic test and conclusions
- Data availability
- Author contributions
- Competing interests
- Disclaimer
- Special issue statement
- Acknowledgements
- Financial support
- Review statement
- References