 | 23 Dec 2021
Storm Anatol over Europe in December 1999: impacts on societal and energy infrastructure
Anthony J. Kettle
Storm Anatol impacted the North Sea and northern Europe on 3–4 December 1999. It brought hurricane force winds to Denmark and northern Germany, and high winds also in Sweden and countries around the Baltic Sea. For many meteorological stations in Denmark, the wind speeds were the highest on record and the storm was ranked as a century event. The storm impacts included extensive forest damage, fatalities, hundreds of injuries, power outages, transportation interruptions, as well as storm surge flooding on the west coast of Denmark. Strongly committed to wind energy, Denmark lost 13 onshore wind turbines destroyed during the storm. An important industry insurer noted that this was a remarkably low number, considering the storm intensity and the large number of turbines (>3500) installed in the country. In 1999, offshore wind energy was just getting started in Europe, and the storm provided an important test of environmental extreme conditions impacting offshore infrastructure. This contribution takes a closer look at the regional met-ocean conditions during the storm. A brief overview is made of the wind field and available wave measurements from the North Sea. An examination is made of water level measurements from around the North Sea to characterize the storm surge and identify possible meteo-tsunamis and infragravity waves. Offshore accidents are briefly discussed to assess if there had been unusual wave strikes on shipping or platforms. At the time of the storm in 1999, there was a growing awareness in the scientific community of possible changes in ambient sea state conditions and the increasing threat of rogue waves. The offshore wind energy community had become aware from the impact of rogue waves from damage at the research platform FINO1 in the southern North Sea during severe storms in 2006, 2007, 2009, and 2013. Storm Anatol may have been another rogue wave storm at an earlier stage of offshore wind energy development.
- Article
(4068 KB) - Full-text XML
-
Supplement
(10430 KB) - BibTeX
- EndNote


In December 1999 Europe was hit by three major storms. Storm Anatol (i.e. the name assigned by the Freie Universität Berlin and most-used in the literature) crossed northern Denmark and southern Sweden on 3–4 December 1999 causing significant damage mainly from the intense wind gusts and coastal surge flooding. Later in the month, Storm Lothar and Storm Martin passed on more southerly trajectories across France, resulting in even greater infrastructure damage in highly populated areas of France, southern Germany and Switzerland (Munich Re, 2002). The focus of this contribution is Storm Anatol, as its impact area was primarily in the North Sea and northern Europe where offshore wind energy was expanding. The storm was important for the damage it caused onshore, but it also had significant offshore impacts in the south-eastern part of the North Sea.
At the time Storm Anatol occurred, wind energy was experiencing rapid growth in Europe. A major driver of wind energy was concern about global warming associated with carbon dioxide emissions of fossil fuel. Modern wind energy development had its roots in the early 1980s as a potential means of overcoming the fuel crises of the 1970s that originated with conflicts in the Middle East. Environmental pollution and acid rain, associated with fossil fuel combustion, were also problems in North America and Europe through the 1980s, and this was another driver of wind energy development (Sahin, 2004; Danish Energy Authority, 2005). The growth of anthropogenic carbon dioxide in the atmosphere was known from time series measurements starting in the late 1950s, but the link to climate change, global warming and sea level rise started appearing in the scientific literature in the 1970s. The start of the IPCC reports in the 1980s highlighted the growing governmental and economic concern about the problem. International agreements were made to attempt to limit carbon dioxide emissions, notably with the Kyoto Protocol in 1997 (Sahin, 2004). To meet the conditions of the agreement required a significant departure from the status quo of existing energy infrastructure (Hansen, 2009). Some governments implemented significant policy changes to develop alternative energy sources and particularly wind energy (IEA, 2001). In Europe, Denmark – a low-lying country particularly susceptible to climate-linked sea level increase – was foremost in the world in implementing a policy that would result in a major restructuring of its energy industry with an increased emphasis on wind energy (IEA, 2001). An important element of the government strategy was the development and export of the new wind energy technology to support job creation in the period of decline of the country's maritime industry (Danish Energy Authority, 2005). To meet the needs of its own energy supply, it was recognized that offshore wind development would have to be an important element of Denmark's energy policy as onshore wind energy sites would be fully utilized in the first decade of the 21st century (IEA, 2005). Plans to build large scale offshore wind farms were started in 1998. Offshore met-ocean monitoring at the Horns Rev site commenced during the summer of 1999 in advance of the installation of the full wind farm starting in the summer of 2002 (Neckelmann and Petersen, 2000; Sommer, 2003).
Part of the challenge of expanding wind energy offshore was uncertainty about the expected environmental conditions. There was ongoing debate in the scientific community if there had been climate-linked worsening of the storm conditions in north-west Europe and particularly of rogue wave strikes. Reports of increased storminess in the North Atlantic regions had started in the early 1980s with observations of apparent trends in a long time series of sea state charts generated by meteorological agencies for forecast purposes (Neu, 1984; but see also Lamb, 1997, p. 214). There was a severe storm sequence in northern Europe in January–March 1990 that was important for the insurance industry for its onshore damage (Münchener Rück, 1993). This led to questions if it was part of a new weather trend, possibly linked to climate change (Schmidt and von Storch, 1993; WASA Group, 1998). Part of the problem in answering the storminess trend question was the lack of long term homogeneous datasets relating to wind speed. Atmospheric pressure measurements are better data to use because of consistent observational routines that extend back to the 19th century. The WASA project was convened to gather and analyze available atmospheric pressure data, focusing on short term pressure changes and geostrophic wind calculations that would reveal storm trends (Alexandersson et al., 1998; Schmith et al., 1998; WASA Group, 1998). The atmospheric pressure datasets supported a recent trend toward storminess starting from the 1960s, but on longer time scales this was just part of inter-decadal variation, with high storminess conditions also in the late 19th century. The debate of climate-linked increases in storminess continued into the 21st century, and Feser et al. (2015) present a recent review of this large body of literature.
A different problem linked with storminess was the apparent increase in rogue wave strikes. This was primarily an issue that affected shipping and the offshore petroleum industry. Rogue waves have always been known, and the issue was highlighted in the 1970s after several high profile cases of ship damage. In Europe, the issue was raised again in the 1990s. In a paper directed to naval architects, Hogben (1994) questioned whether the existing industry guidelines for extreme design waves were representative of the actual sea state encountered by ships during storms. Faulkner (2002) also stated that ships were encountering single waves that were several times larger than what they were designed to withstand in their operational lifetime. For maritime engineers, the understanding of extreme sea state conditions for offshore design was encapsulated in summary maps of the 50 year return period of significant wave height based on state of the art models (Draper, 1980; Williams, 2005, 2008). From the 1970s, the UK Health and Safety Executive produced reports of offshore design guidelines to support North Sea petroleum infrastructure, but these were revoked in 1998 for reasons that are unclear. Later, the section on extreme wave heights was updated and republished, with amendments indicating a possible change of wave climate for certain areas (Williams, 2005, 2008). In the late 1990s, reports began appearing of rogue wave strikes – so-called green water incidents – on the moored petroleum production vessels in the North Sea and Norwegian Sea (Ersdal and Kvitrud, 2000). There were also unusual shipping accidents where large transport ships had bridge windows broken by large wave strikes (Gunson et al., 2001). To address the apparent increasing incidence of ship damage by wave strikes, a European Commission research program called MAXWAVE ran from 2000 to 2003 (Rosenthal, 2005). It attempted to characterize the maximum size, location, and encounter probability of rogue waves using different approaches that included databases of ship accident reports (Toffoli et al., 2003) and synthetic aperture radar images (Lehner et al., 2002; Lehner, 2004). Rogue waves became an issue for offshore wind energy later in the first decade of the 21st century with wave strike damage on the FINO1 offshore meteorological mast in the German Bight during severe winter storms in 2006, 2007, 2009, and 2013 (Neumann and Nolopp, 2007; Outzen et al., 2008; Fischer et al., 2010; Pleskachevsky et al., 2012; FINO1, 2014).
This contribution outlines the damage caused by Storm Anatol with emphasis on energy infrastructure (Sect. 2) and presents a detailed analysis of sea level records for information on short period fluctuations that might indicate unusual wave phenomena of interest for offshore wind energy (Sect. 3). The Supplement presents a full list of literature sources for the storm, with summary tabulations of the different impacts and themes. This storm report follows on earlier reports of Storm Britta in 2006, Storm Tilo in 2007, and Storm Xaver in 2013, which were also noted for their offshore energy infrastructure impacts (Kettle, 2018, 2019, 2020).
Storm Anatol passed on a trajectory across the North Sea from Scotland to the Jutland peninsula in Denmark, and then across southern Sweden, through the Baltic Sea, and into Latvia (see Fig. 1; Roberts et al., 2014; XWS, 2020). The wind and surge damage associated with winter storms in northern Europe depends in part on the section of coastline where they make landfall while travelling eastward. The German scientific literature classified Storm Anatol as a “Jutland” type, to distinguish it from the “Skagerrak” and “Scandinavian” types that follow eastward trajectories further to the north (Kristandt et al., 2014). A consequence of this southern trajectory is that the storm did not have the same cold air outbreak associated with the strong northerly winds behind the moving low pressure centre, as occurred during Storms Britta, Tilo, and Xaver. Driven by mainly west winds, the associated storm surge did not affect all regions of the North Sea but impacted mainly the North Sea coasts of the Netherlands, Germany, and southern Denmark. In the southwest Baltic Sea, the strong west winds caused the lowest water levels on record for some Danish stations as water was forced offshore (Nielsen and Nielsen, 2000; Cappelen et al., 2018a). The striking feature of Storm Anatol was the rapid intensification of its central pressure. The low pressure centre formed in the Atlantic Ocean west of Ireland on 2 December 1999, and the first indications of the storm were registered by stations in northern Ireland late on 2 December 1999 (Voldberg, 2000). The low pressure centre deepened rapidly during its transit across southern Scotland and the North Sea, with a pressure drop of ∼ 37 hPa in the 12 h period up to noon on 3 December (UKMO, 2021). The rapid pressure drop marked the storm as a particularly destructive type, known as a meteorological “bomb” (Sanders and Gyakum, 1980). Ulbrich et al. (2001) present a meteorological investigation of the atmospheric structure to explain the rapid intensification of the storm. The central pressure reached its lowest level of 953 hPa on the eastern side of Jutland at approximately 18:00 UTC on 3 December 1999, and increased as the storm passed across southern Sweden, the Baltic Sea and Latvia on 4 December 1999.
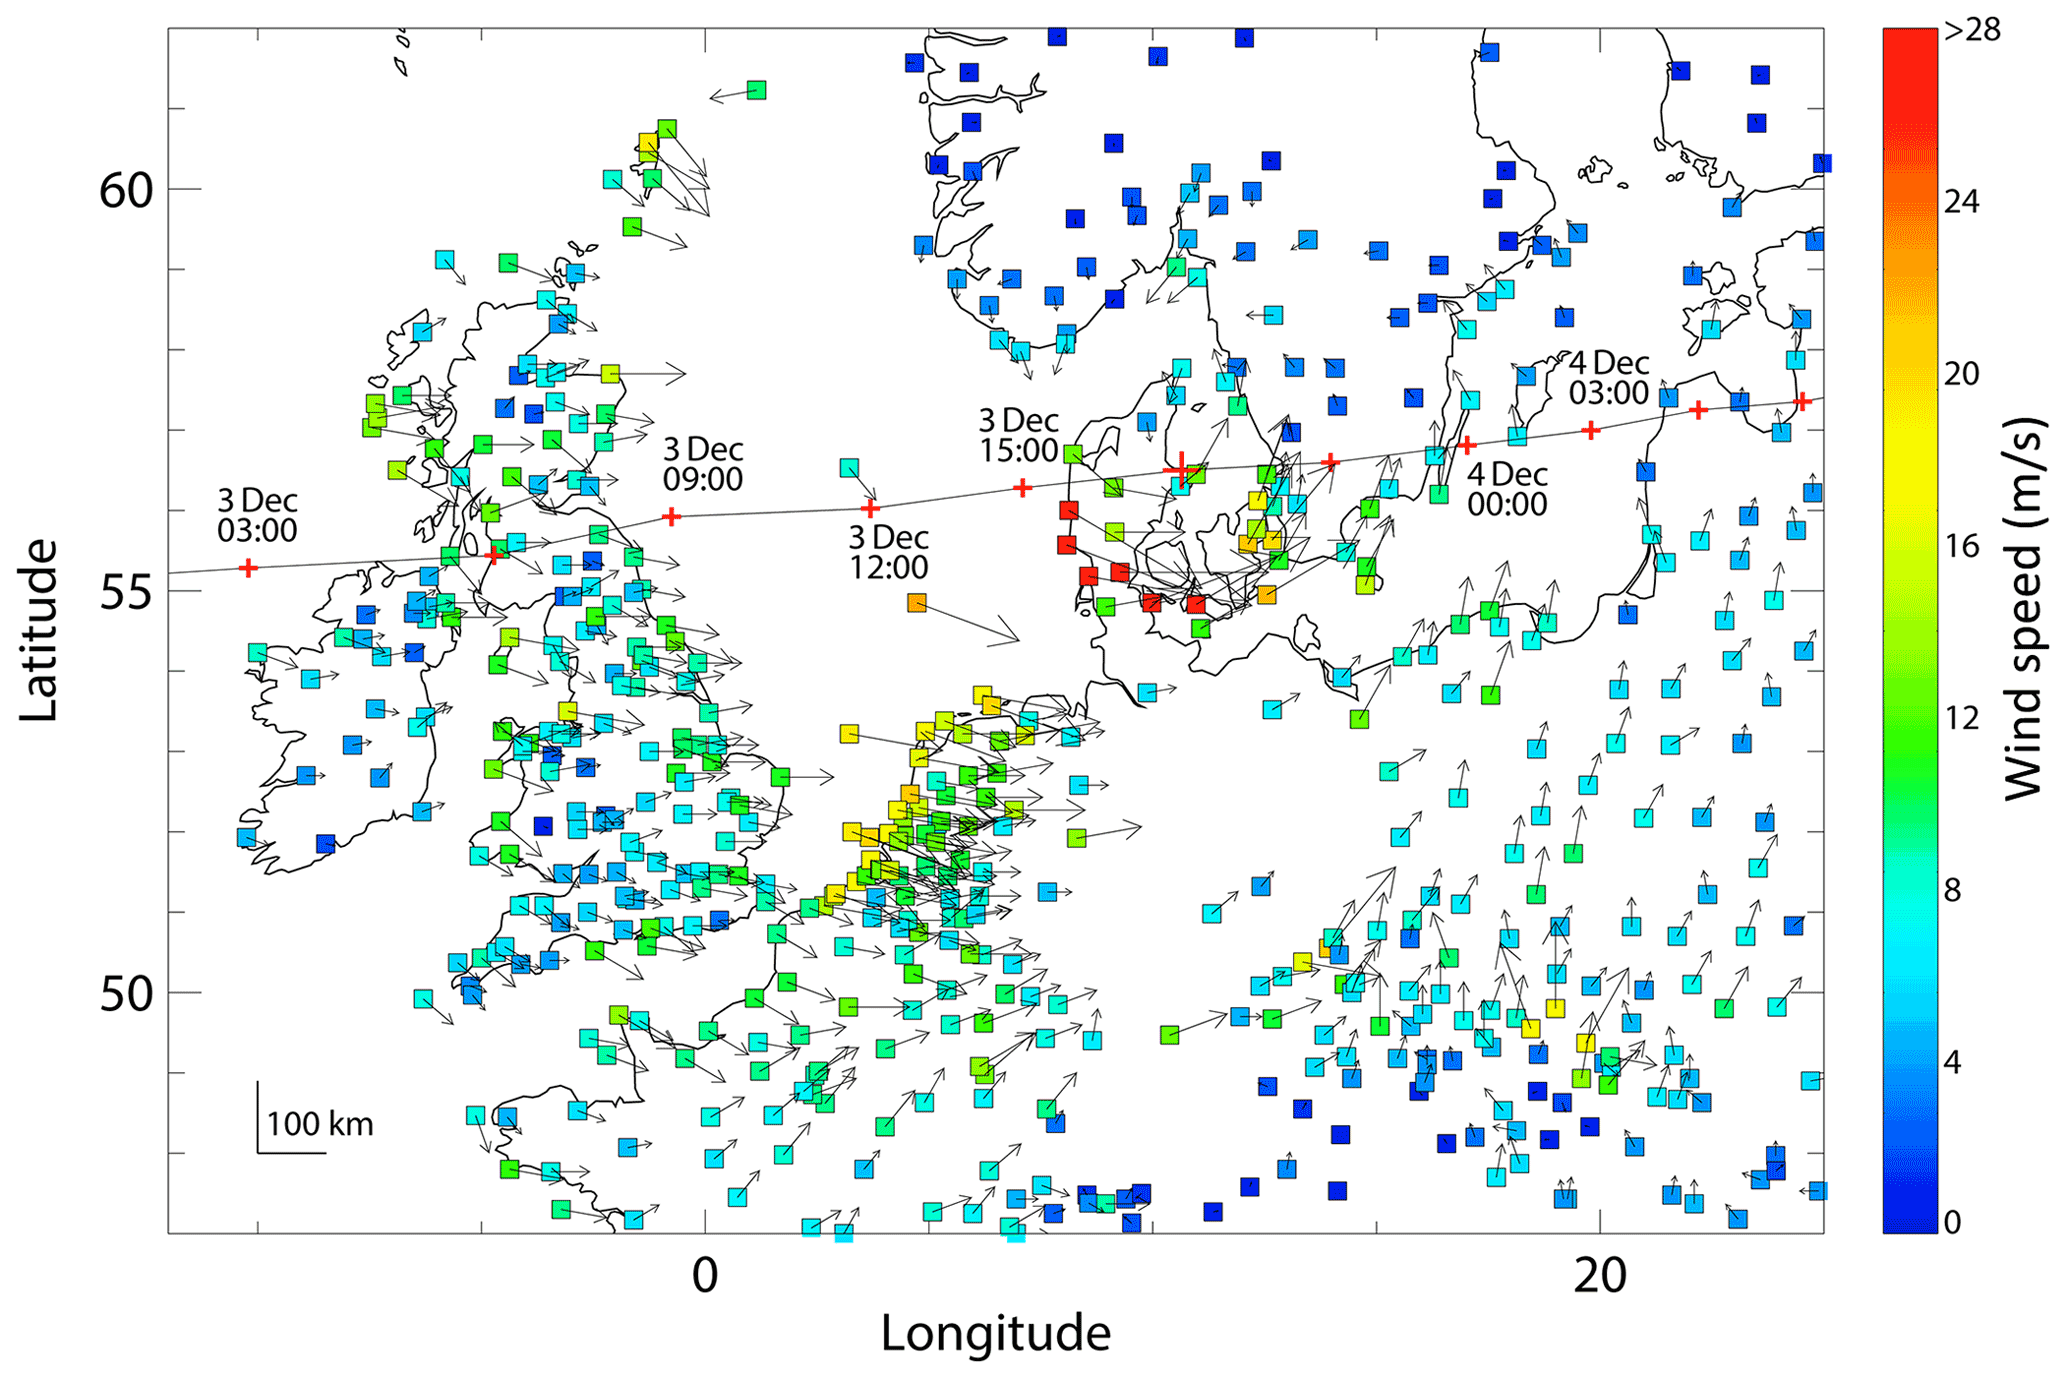
Figure 1Wind speed and direction at 18:00 GMT 3 December 1999 from selected stations of the USAF data set. The trajectory of the low pressure centre is indicated by the black line with red crosses at 3 h intervals (Roberts et al., 2014; XWS, 2020). The location of the pressure centre at the time of wind field is shown by a larger cross.
The temporal and spatial development of the wind field during the storm were remarkable. The winds were at hurricane strength when the storm centre crossed the Danish North Sea coast just north of Esbjerg. Figure 1 shows the measured wind field at regional stations on 3 December 1999 at 18:00 UTC when the winds were near their maximum strength in southern Denmark. (Fig. S1 in the Supplement shows a series of maps of the measured wind field at 3 h intervals across the period of the storm.) An important feature of the storm seen in Fig. 1 was that the strongest winds occurred on the right hand side of the moving low pressure centre. This wind speed feature was noted in literature reports (Voldberg, 2000; Cappelen et al., 2018b) and had implications for the areas of damage in Denmark and also the locations of maritime accidents in the North Sea. Offshore wave measurements had a much sparser spatial coverage (Fig. S2), but the available information indicates that the wave field was also highest south of the storm track (Fig. S3). Maritime winds from the Quikscat scatterometer satellite became available to operational oceanography from the autumn of 1999, and Fig. S4 shows the storm wind field over the North Sea at about 19:10 UTC on 3 December 1999. This image does not appear in the literature, and it would have been among the first such storm overview images to be delivered from this satellite. The image reveals patchiness and streaks that may be associated with travelling convection cells that have been implicated in infragravity wave strikes (Pleskachevsky et al., 2012). DWD (2000) presents an analysis of radiosonde winds in central Europe during the storm and highlights the presence of unusually high wind speed jets in the upper troposphere over northern Germany and Denmark. The phenomenon was significant because the radiosonde time series extended back over two decades, and the high wind speed jets appeared to indicate a change in atmospheric circulation starting from the winter of 1995–1996. In an analysis of a later European winter storm, Fink et al. (2009) comment that the surface gust features may be linked with downward transport of high wind speed features aloft or with convective downdrafts caused by evaporating rain. Figure S5 recapitulates the radiosonde features of DWD (2000) using a larger data base of information from the University of Wyoming website.
The storm caused a lot of societal and infrastructure damage. This is outlined below and summarized in a series of maps in the Supplement for power outages (Fig. S6), damaged wind turbines (Fig. S7), travel and transport interruptions (Fig. S8), maritime incidents and accidents (Fig. S9), infrastructure and dike damage (Fig. S10), fatalities and injuries (Fig. S11), and forest damage and fallen trees (Fig. S12). The location of greatest damage for these types of travelling, intensifying winter storms depends on where they culminate with the minimum pressure (Pelt, 2013; Woetnamm Nielsen and Hansen Sass, 2003; RMS, 2014). Denmark was impacted worst by the storm, and Danish literature refers to it as “Danmarks Århundredets orkan” or “Decemberorkanen” (Vedin and Alexandersson, 1999; Voldberg, 2000; Pelt, 2013). The storm was categorized as a 100 year event in that country. Hurricane-force winds across the southern part of Denmark interrupted transport networks as airports and rail connections were closed. Dozens of transport vehicles were overturned on the roads in the strong gust field, contributing to the general closure of the highway system. There was extensive building damage, and a large crane was toppled at a shipyard at Odense (Lloyd's Casualty Week, 1999). The amount of forest damage was the equivalent of two years' harvest. Seven people were killed, and about 800 people sustained injuries requiring medical aid. As power lines blew down, there were power outages in large parts of the country. Hundreds of fires were caused by fallen power cables (Lloyd's Casualty Week, 1999). Onshore wind energy was impacted with 13 destroyed turbine towers in Jutland (Fehrmann and Fackler, 2010). There was a bad storm surge that affected the Danish North Sea coast from Thyborøn southward (Cappelen et al., 2018c). The surge height for Storm Anatol was actually at the level of the worst historic regional surge in 1634, which caused serious flooding in Ribe and resulted in extensive coastal landform changes (Fruergaard et al., 2013; Cappelen, 2019). However, unlike the 1634 event, the surge peak during Storm Anatol arrived at low tide (DMI, 1999; Nielsen and Nielsen, 2000). If the storm surge had arrived at high tide, static water levels would have been 1–1.5 m higher, and the protection dykes would have been overtopped (Danhostel-Ribe, 2021). Nevertheless, the surge and wave fields caused some dike breaks and flooding in the Danish Wadden Sea area. Juvre dike was breached at a number of locations on the lee side of Rømø island (Nielsen and Nielsen, 2000), indicating possible dynamic wave interactions that sometimes arise in complex coastlines with channels and islands (Murty, 1977).
Reported damage from other European countries was less than Denmark. In the UK, there were gale conditions that primarily affected the road network with fallen debris and toppled transport vehicles (Brugge, 1999; UKMO, 2021). There were three fatalities in Birmingham in England when a tree fell on a car. In Ireland, high winds were also recorded, but no significant damage was registered (Met Eireann, 1999). Northern Germany was impacted by high winds especially at the North Sea coast, and there were some cases of destroyed and damaged onshore wind turbines in the region (Caithness Windfarm, 2018). A storm surge occurred on the North Sea coasts of the Netherlands and Germany (DWD, 1999; RWS, 1999). For many tide gauge stations on the German coast this was the most highly ranked event in the measurement record after the defining storm surges of 16–17 February 1962 and 3 January 1976 (Jensen et al., 2006). The combination of high waves and surge may have caused some coastal cutback of up to 40 m along some shoreline areas of the German island of Sylt (see Figs. S13 and S14). There were some maritime accidents in the south-eastern North Sea that may have been linked to the wave field (Fig. S9), and these are explored further below. In southern Sweden, transport networks were interrupted as ferry services were stopped and airports closed. There were large scale power black-outs from fallen power lines, and also significant forest damage (Vedin and Alexandersson, 1999; UN/ECE, 2000). In Poland, rail services were cut on the route between Warsaw and the Baltic Sea coast. There was also some infrastructure damage with the toppling of a large crane at a Gydnia shipyard. There were storm impacts as far east as Latvia and Lithuania with some power outages as Storm Anatol left the Baltic domain. The largest loss of life in a single incident across the whole storm period occurred when a fishing vessel was capsized by a large wave while entering the Latvian port of Liepaja before dawn on 4 December 1999. There were 6 fatalities. High winds may have contributed to the crash of a transport aircraft from a Moscow airport on 5 December 1999 02:00 UTC (Lloyd's Casualty Week, 1999).
Water level data from tide gauges around the North Sea are analysed to trace the progress of the storm surge and to investigate the short period component of water level variation that may be linked with meteo-tsunamis or infragravity waves. In general, for stations around the North Sea, water level variations are dominated by the tidal component, which propagates counter-clockwise along the coast starting from Scotland. The tide must be modelled and subtracted from the measured water level time series to isolate the surge residual, which may be larger than the tidal range for bad winter storms (Pugh, 1987). The surge residual originates from high winds forcing water onto a leeward coast, from the possible effect of a travelling external surge entering the North Sea over Scotland, and from the rise of water under the storm low pressure area (i.e., inverted barometer effect).
The data to investigate the surge originate from the national water level monitoring agencies of the UK, France, the Netherlands, Germany, Denmark, and Norway. The data have been downloaded from public websites, except for the data from Germany, which were emailed by Wilfried Wiechmann of the Bundesanstalt für Gewässerkunde (BAFG). The water level recorders of most of the national authorities are at locations that show tidal variations. For the Netherlands and Germany, the water level data of the national authorities includes both coastal and inland sites, and the stations for the current project were selected on the basis if they showed a tidal signal. Two additional data sets were obtained from the online Global Extreme Sea Level Analysis (GESLA) data base for France. The source and key characteristics for the data sets are shown in Table S2 in the Supplement. The water level data from the various agencies had different temporal resolutions: UK 15 min, the Netherlands 10 min, France 1 h, Germany 1 min, Denmark 15 min, and Norway 10 min. The 1 min data set from Germany was averaged onto a standard 10 min grid. Data sets with time discretization of 10, 15, or 60 min were used without modification. Preliminary checks were made to ensure that there were no data gaps or data irregularities across the 13 d period (from the start of 24 November 1999 to the start of 7 December 1999) encompassing the storm period. The Danish datasets had some short gaps of mostly 15–30 min duration (but up to 1.5 h for the case of Ballum). These gaps were linearly interpolated so that complete data arrays were available for the spectral analysis, described below. Altogether, 89 stations were included in the analysis after this quality control, and these are shown on the maps in Figs. 2 and 3.
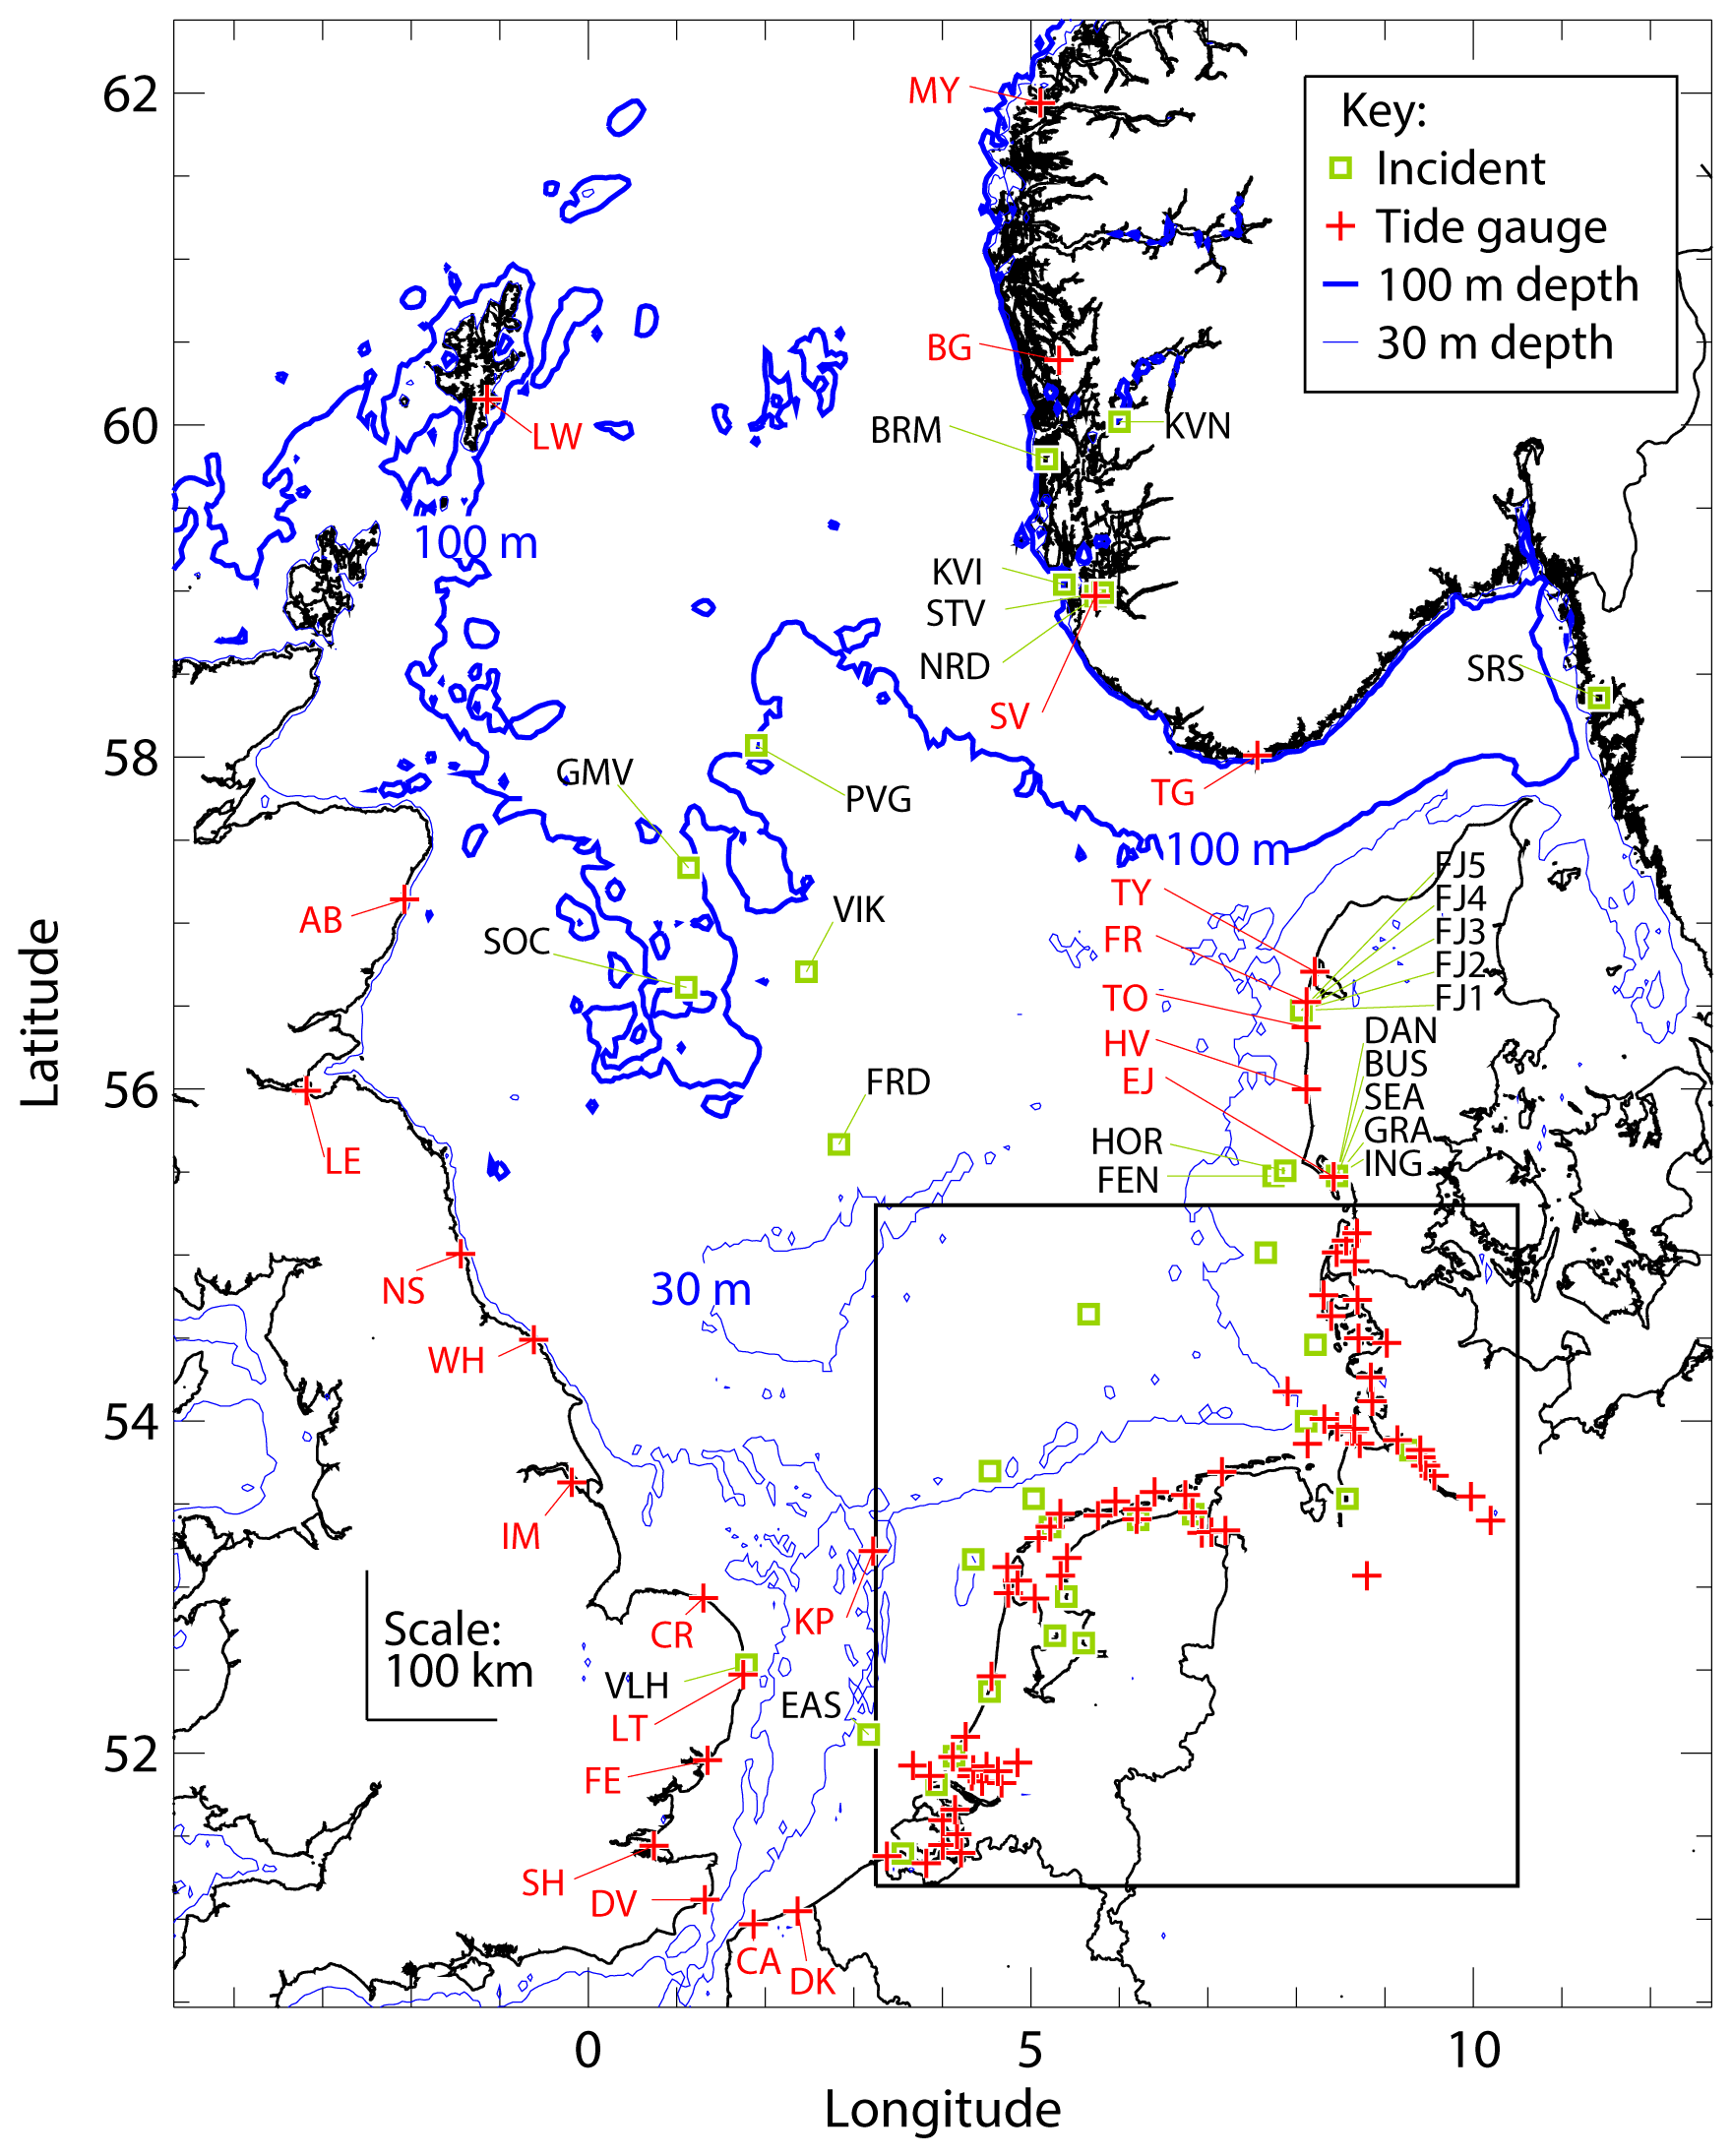
Figure 2Location of tide gauges analyzed in this study and of North Sea maritime incidents that were reported over the period 26 November–5 December 1999. For presentation clarity, the information in the inset box covering the south eastern North Sea is shown in Fig. 3. The abbreviation codes for the tide gauges and maritime incidents are explained in Tables S2 and S3.
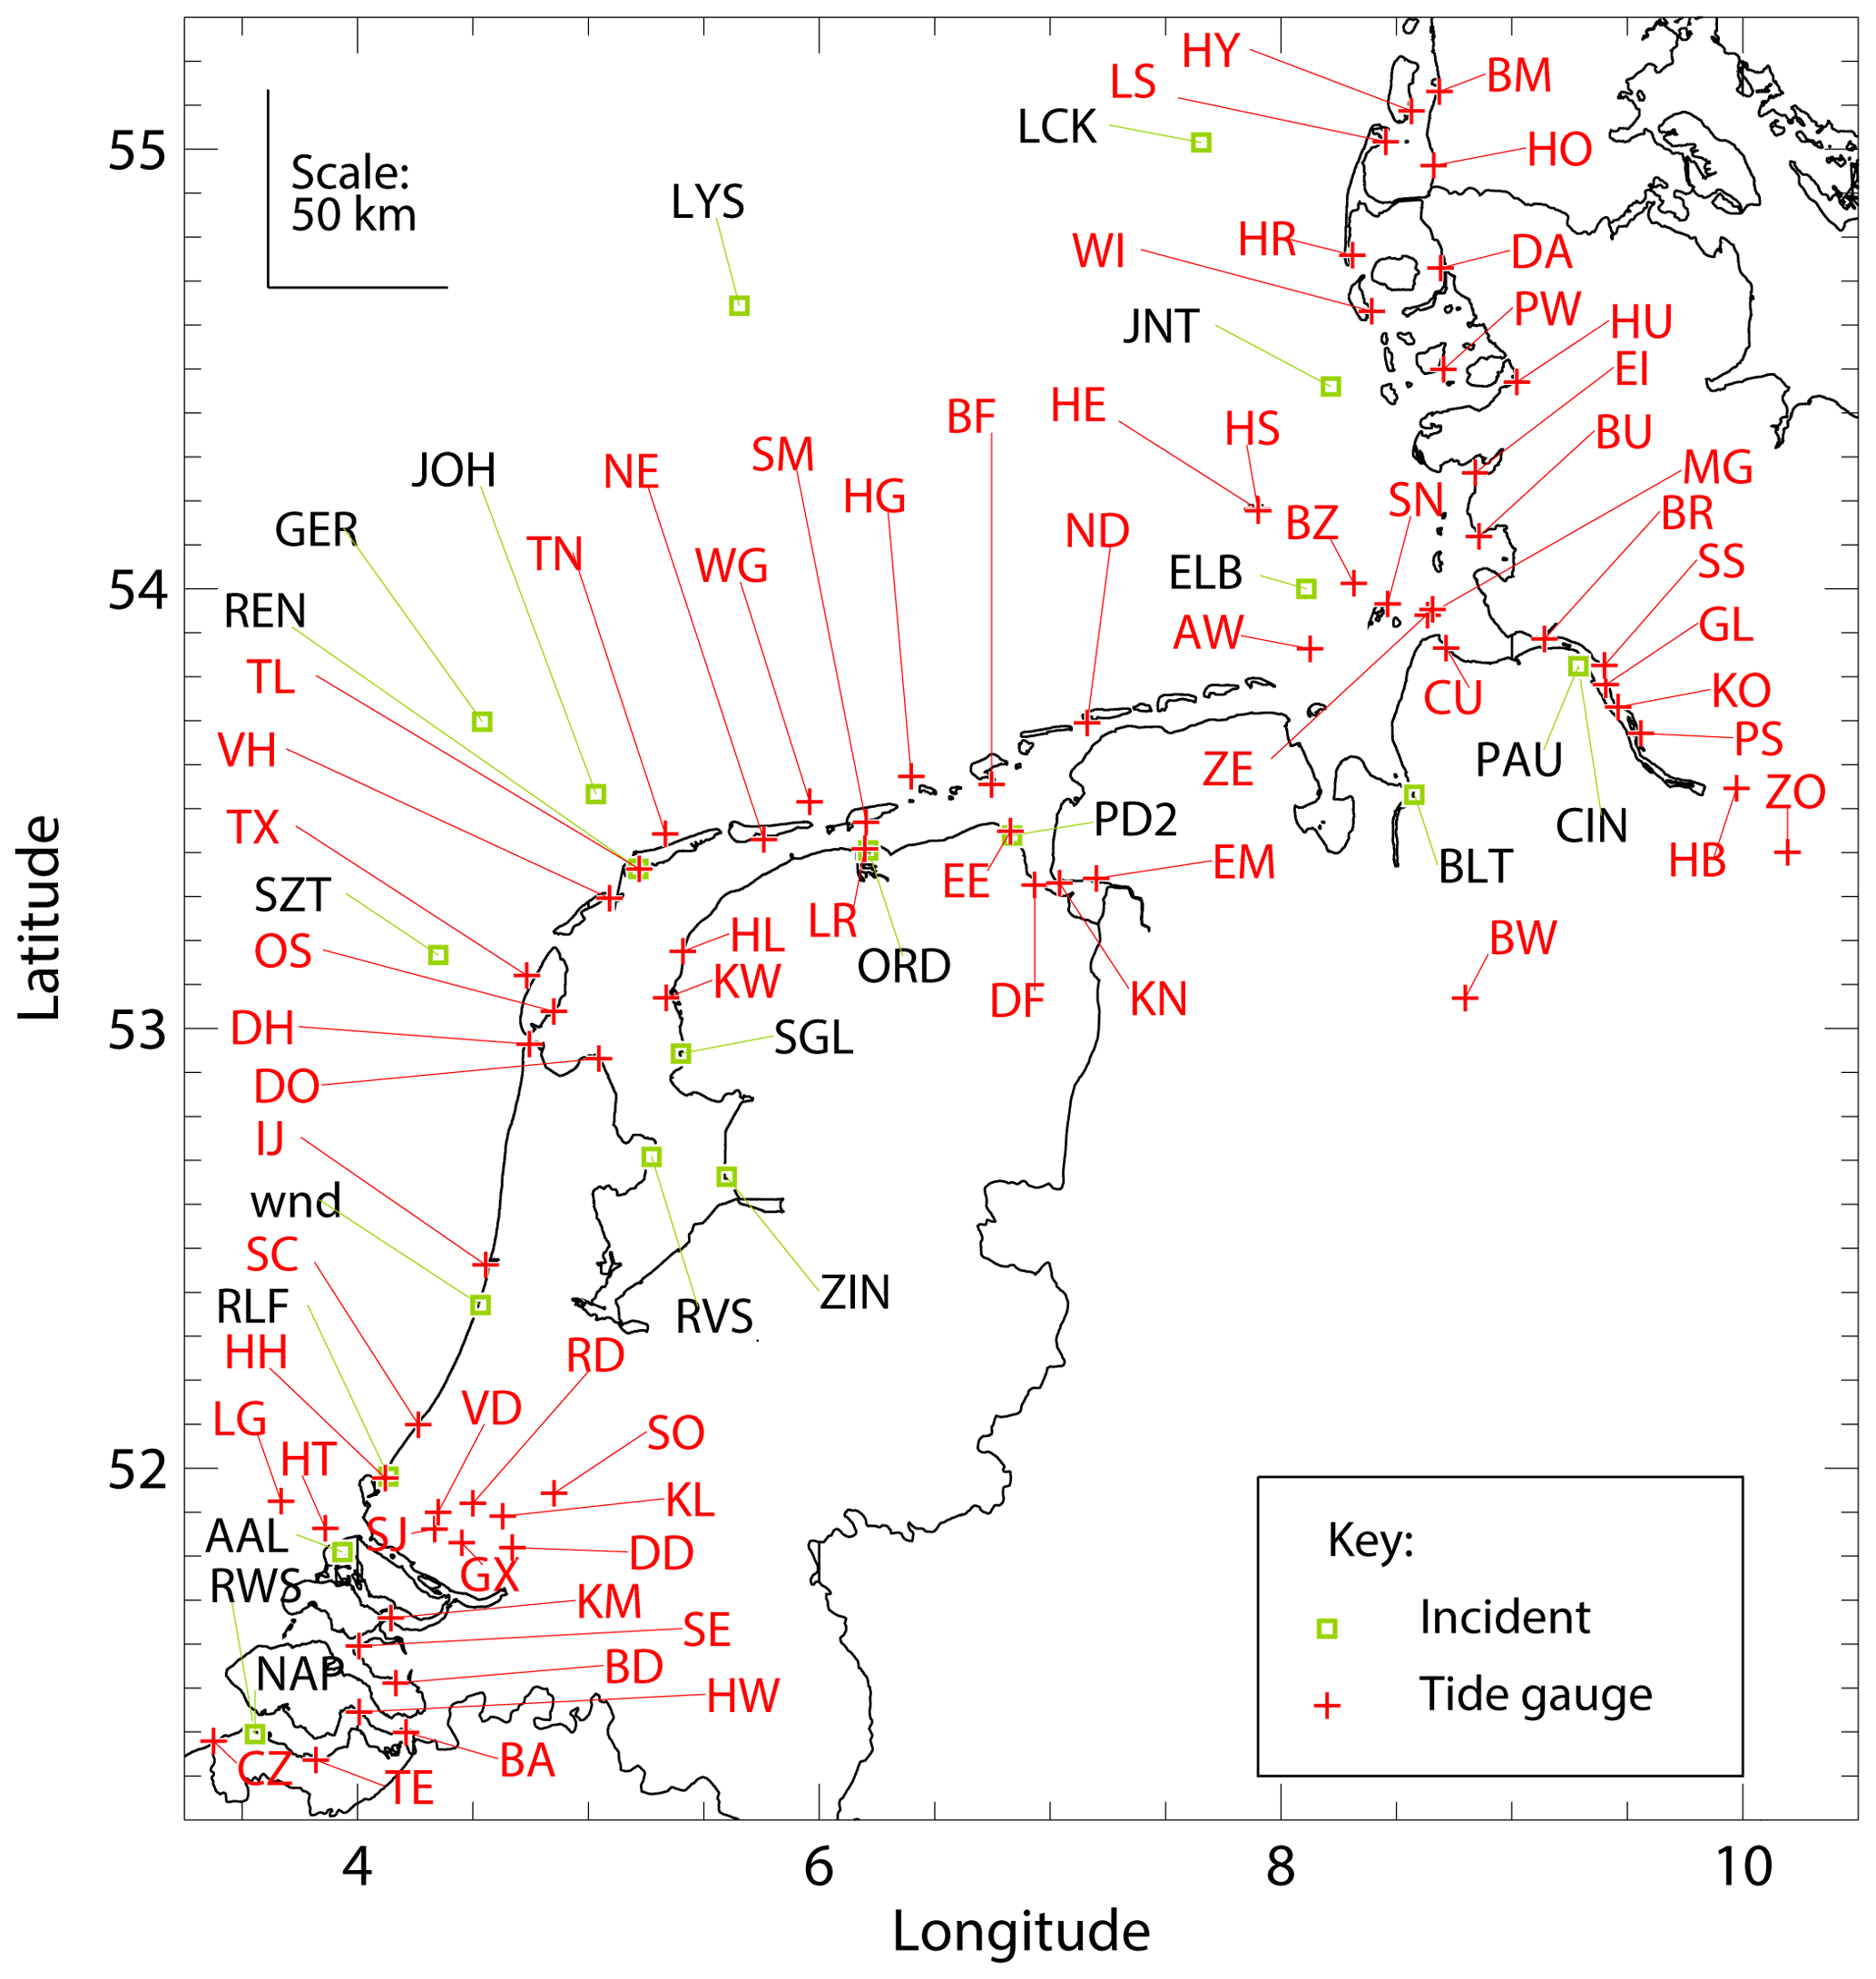
Figure 3Location of tide gauges and maritime incidents along the North Sea coasts of the Netherlands, Germany, and southern Denmark. The abbreviation codes for the tide gauges and maritime incidents are explained in Tables S2 and S3.
A spectral analysis technique was used to separate the water level time series into different components corresponding to the long period (mostly storm surge), short period (mostly harbour seiche or meteo-tsunami), and tidal (diurnal plus semidiurnal, combined) contributions. The analysis follows similar tide gauge studies of Gönnert et al. (2004) and Kettle (2018, 2019, 2020). A discrete Fourier transform was used to convert the detrended time series data into a power spectrum (Stull, 1988), similar to the example for Lerwick in Fig. 4. (Other power spectra for stations along the east coast of the UK are shown in Fig. S15). The spectral plots were used to empirically assess the frequency thresholds for the different water level components. Figure 4 shows the narrow bands that were used to clip out the diurnal (∼ 24 h) and semidiurnal (∼ 12 h) tidal components from the long-period water level reconstruction. The 0.2 d threshold was chosen to separate the long-period and short-period reconstructions. This choice of threshold is similar to previous studies that have aimed to isolate meteo-tsunami signals in water level data showing a strong tidal component (Monserrat et al., 2006; Pattiaratchi and Wijeratne, 2015). For many cases in this North Sea storm analysis, the short period reconstructions showed evidence of large oscillations or noise at certain times with some spatial coherence among stations.
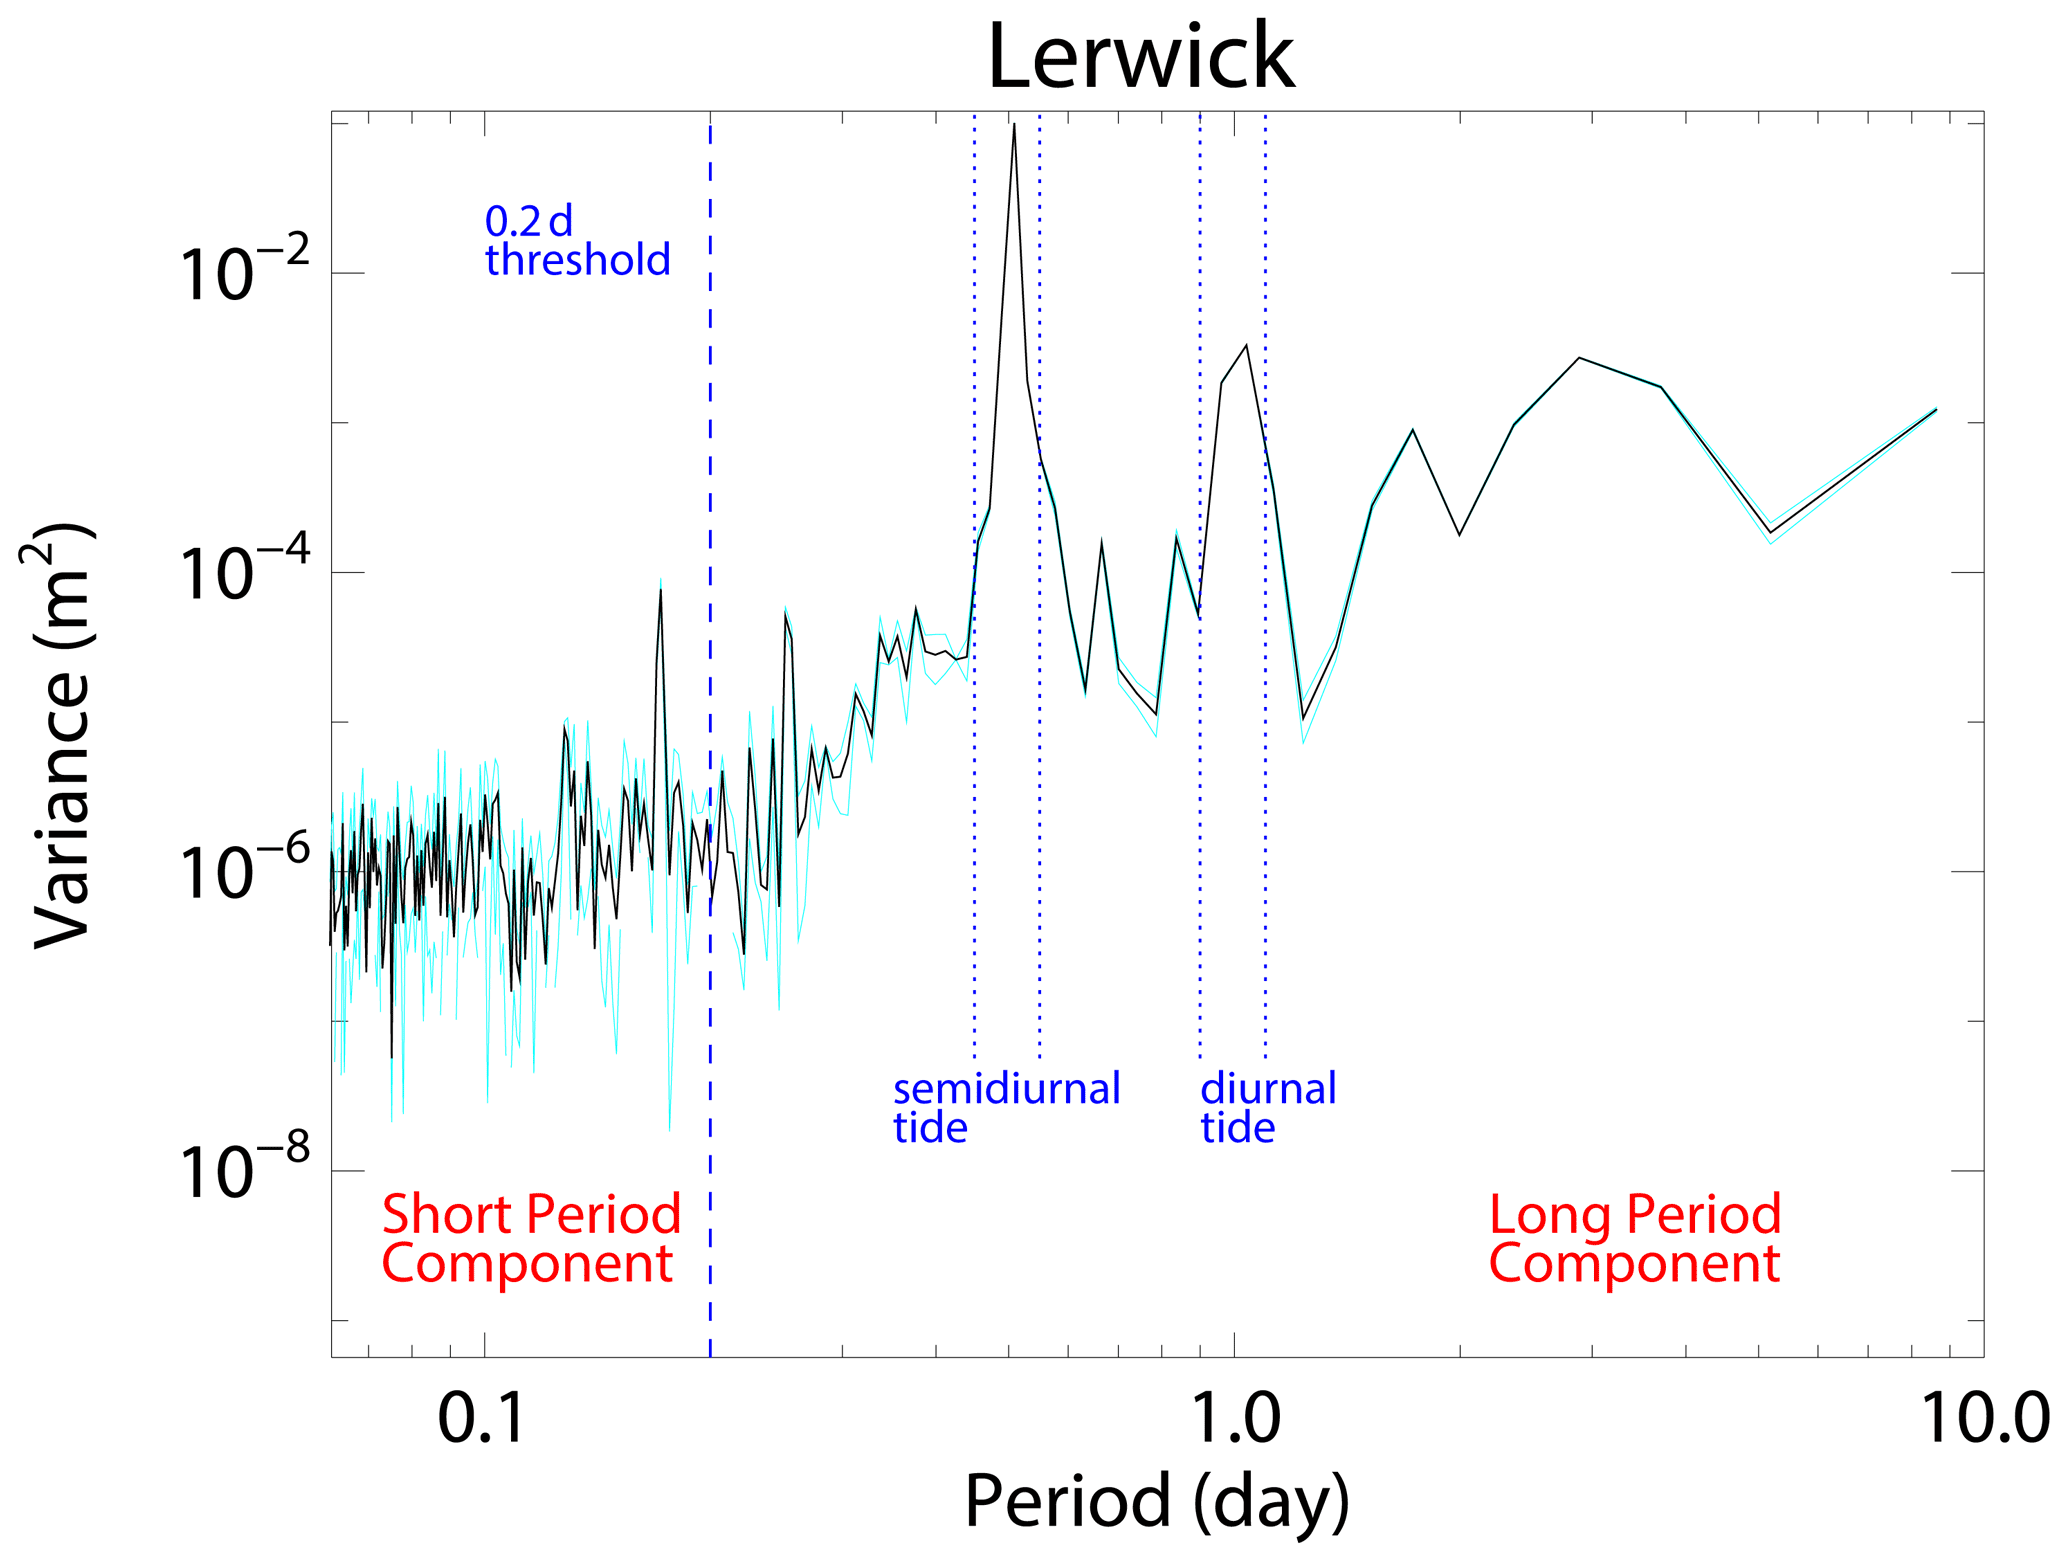
Figure 4Sample spectrum of the 13 day time series of water level for Lerwick. The 0.2 d threshold separating the short period and long period components of the time series reconstructions is shown, as well as the thresholds defining the diurnal and semidiurnal components that were used to de-tide the time series. The uncertainty in the spectrum (light blue line) is calculated as the standard deviation of three spectra derived from re-sampling the time series at every third point.
An unexpected problem arose with the disagreement between surge water levels calculated with the spectral analysis of tide gauge data and literature reports of water levels and skew surge heights. The literature reports were biased higher than the results of the present analysis. The tide gauge data sets are referenced to the long-term mean sea level as the zero level, or for the case of Germany to another reference height that can be linked to sea level. This reported long-term mean sea level is several decimetres to a metre higher than the 13 d mean of the water level calculated as part of the spectral analysis of the data. The bias for the tide gauge datasets is similar within each country collection, so that the levelling procedure for the collection of UK stations appears roughly self-consistent but different from Denmark, etc. (Fig. S16). At an earlier stage of scientific understanding, Rossiter (1958) noted a similar feature in a number of North Sea tide gauge data sets from different national sources. This was expected in the period before the survey inter-comparison of reference benchmark levels across the region. To overcome the problem of tide gauge zero level inconsistencies, Rossiter (1958) performed an ad hoc levelling procedure for a collection of North Sea tide gauge stations by comparing the measured water levels around the North Sea during low wind periods. Kettle (2020) overcame the apparent bias problem by adjusting his modelled water levels upwards by the amount of apparent bias to achieve agreement with the literature reports. For the present analysis of Storm Anatol, the opposite strategy was used, and the literature reports were adjusted downward by the mean bias calculated for each country's tide gauge collection. Most of the German literature reports give the skew surge concept as the height above average high water, and a second correction was applied in these cases to estimate the skew surge as the height above the closest high water level. Figure S17 shows how the literature reports for different sites around the North Sea were adjusted.
A short database of maritime incidents was compiled to compare with the largest events in the short period reconstruction of the water level time series (i.e., with characteristic periods <0.2 d). These were gathered mostly from Lloyd's Casualty Week (1999), and supplemented with the casualty lists presented in Cargolaw (2019) and with information by email contact from the Netherlands KNRM service. One North Sea wave rider buoy operated by the Danish Coastal Authority at Fjaltring indicated remarkable maximum wave heights at different times during the storm (Fig. S3). There were also wave-related incidents resulting in the capsize of the lightship Elbe and a power outage at the offshore meteorological mast at Horns Rev. Most the maritime incidents could be located precisely in latitude and longitude, and fairly precisely in time with a few exceptions where only the day of the incident is given. Altogether, 25 offshore incidents and wave events were identified in the North Sea. The location of these is shown in Figs. 2 and 3 with additional information in Table S3 and Fig. S9.
The results of the water level analysis are shown in Fig. 5 for the complete set of tide gauge stations. The time series are arranged in order of counter-clockwise placement around the North Sea starting from Lerwick in Scotland with vertical offsets for presentation clarity. This arrangement was chosen because the tides and external storm surges travel as coastally trapped Kelvin waves, entering the North Sea across the top of Scotland and then passing along the coasts of England, the Netherlands, Germany, and Denmark in succession. This produces an arrangement of temporal events that is different from what may be expected if met-ocean phenomena were being transported with the wind field. For some phenomena – such as wind waves and surge peak – the wind field may have a dominant influence. This competing influence between the tide/external surge and wind may be important for interpreting some features of the water levels in the southeast corner of the North Sea. The panel in Fig. 5a shows the original time series with the maximum water levels shown by red plus symbols. The long period component of the time series is shown in the second panel (Fig. 5b), also with the maximum levels shown by red plus symbols. This panel reveals the presence of an external surge starting from Scotland and travelling southward. The external surge is not mentioned in the available literature about the storm, but was probably a contributing factor for the closure of the Thames Barrier for this event (Environment Agency, 2018). The tidal component is shown in Fig. 5c, and it reveals that the semi-diurnal tide is prominent in most stations with its peak about every 12 h.
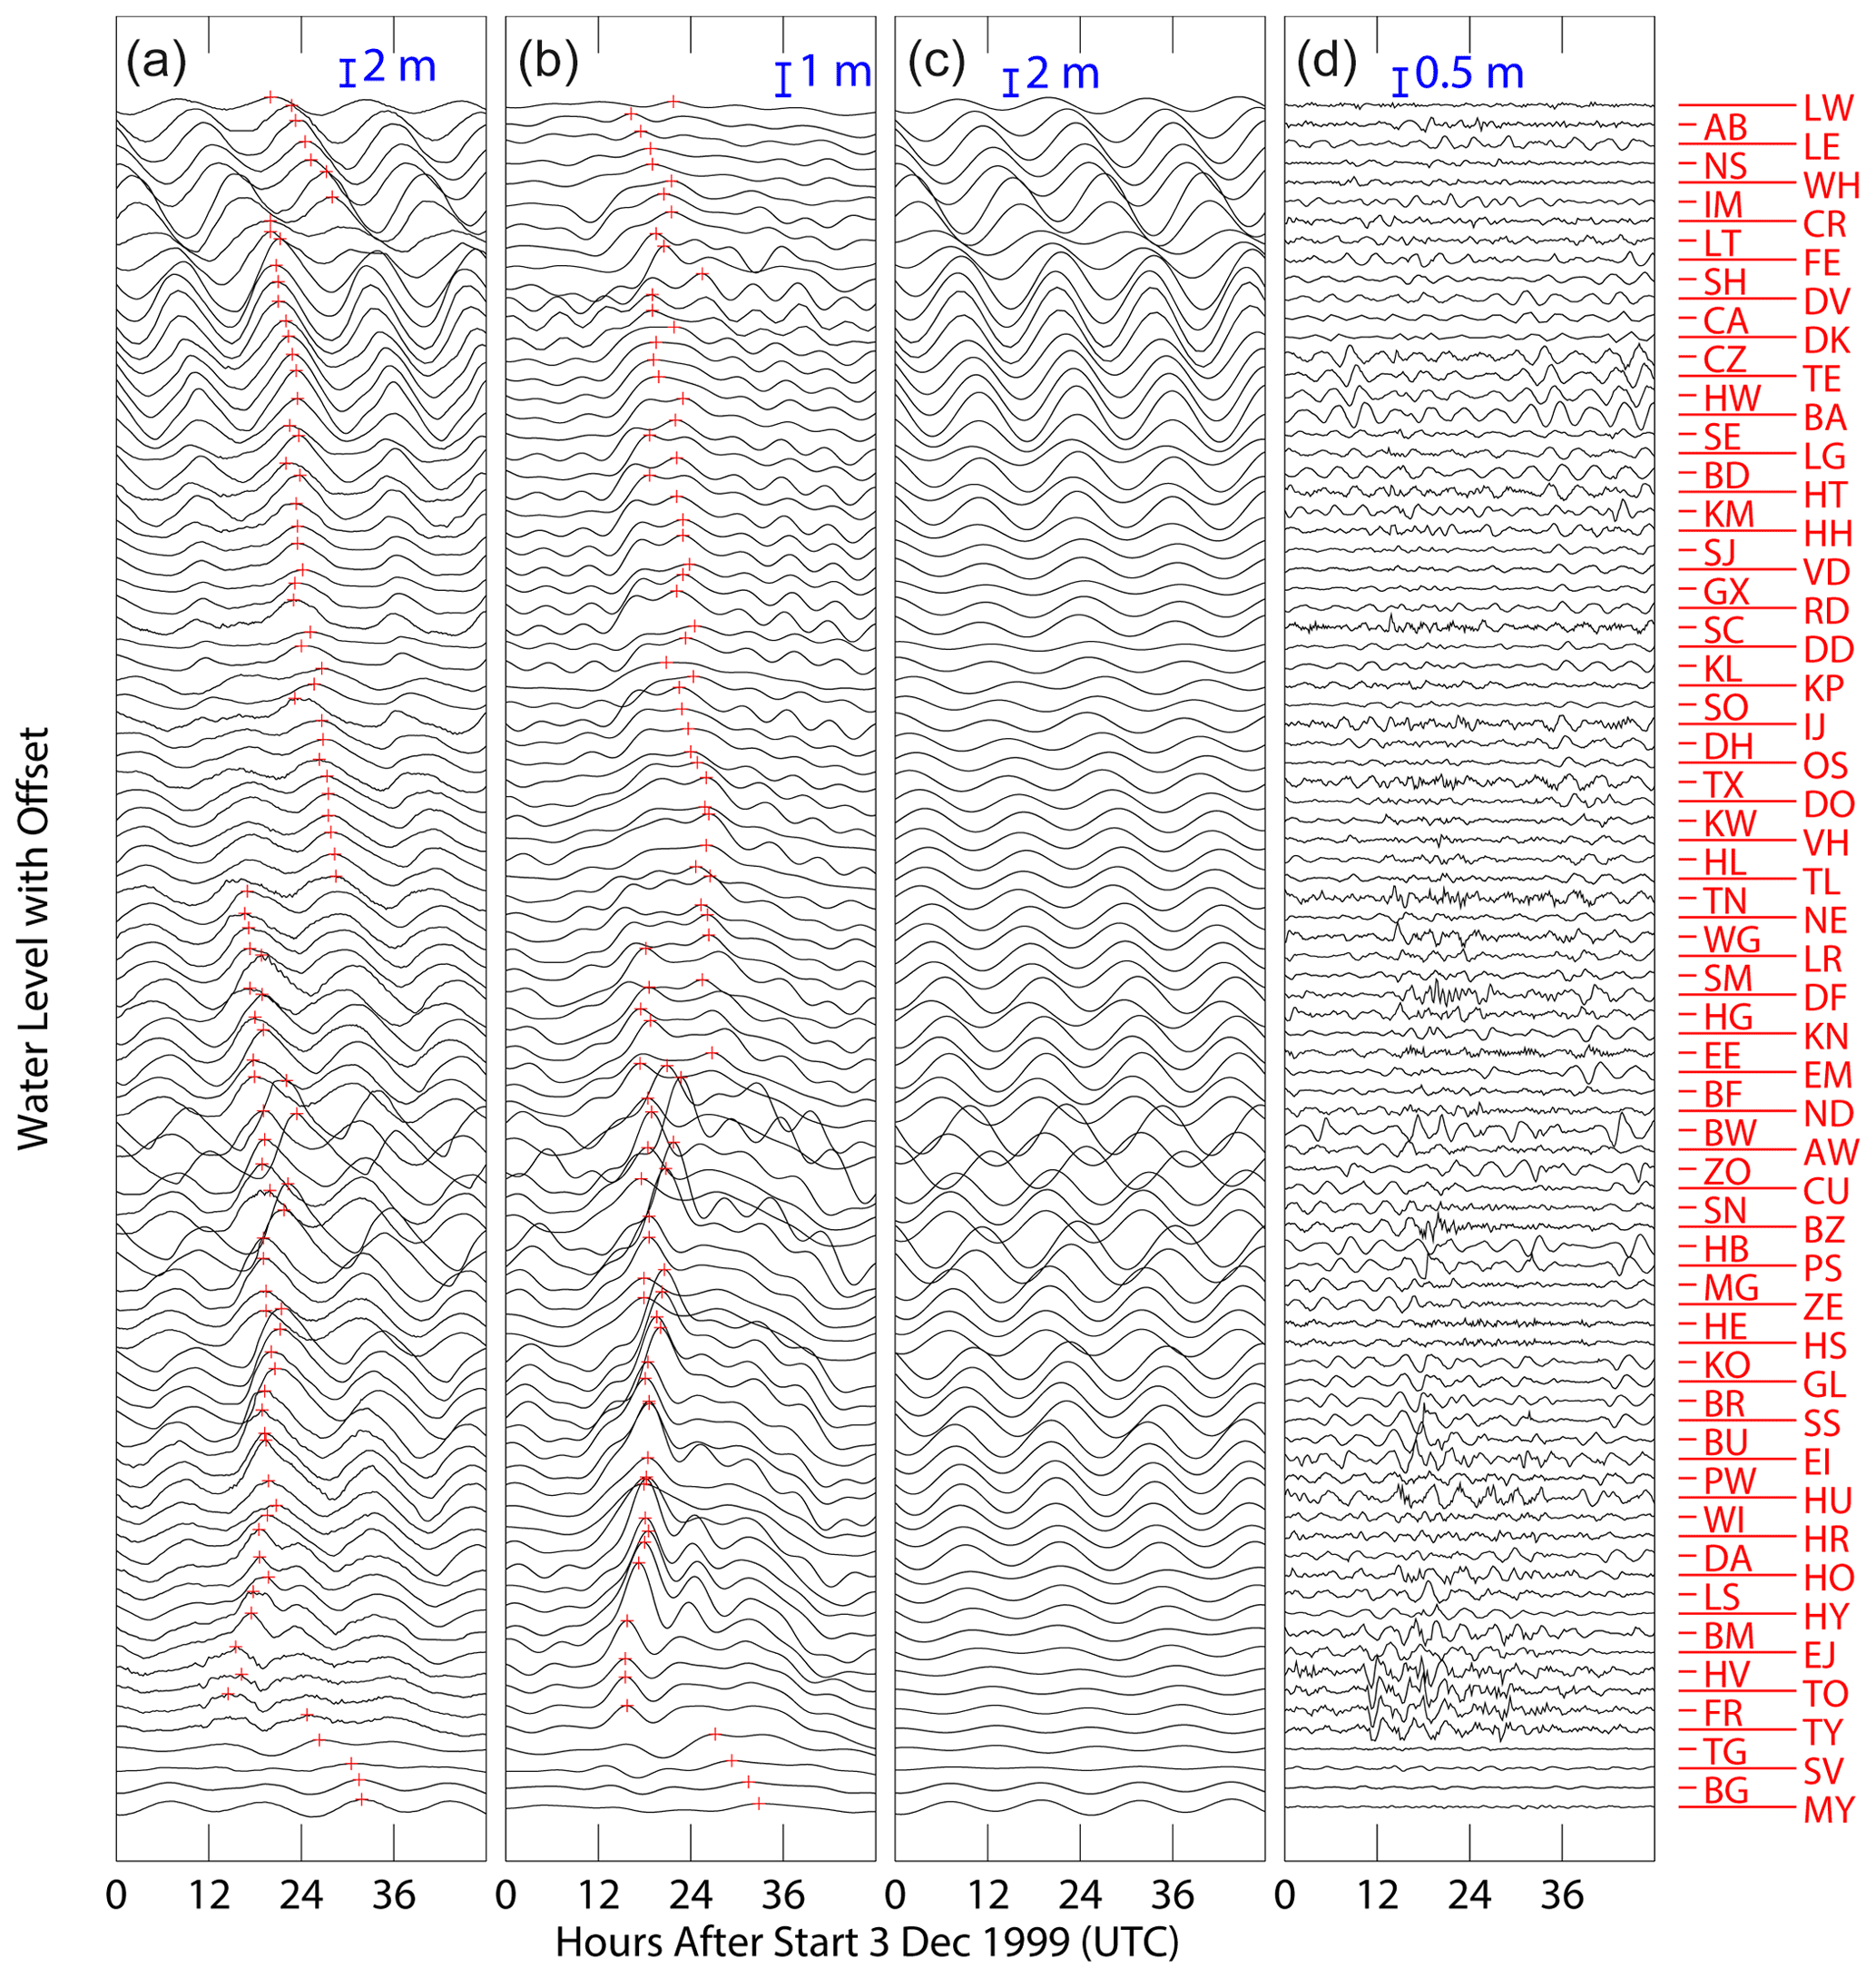
Figure 5Time series of the (a) original water level data, and reconstructions of the (b) long period, (c) diurnal plus semi-diurnal tide, and (d) short period components of the original time series. The station identifications are given by two letter codes along the right hand side of the last panel. The stations have been vertically offset according to their relative arrangement counter-clockwise around the North Sea, starting from Lerwick in Scotland at the top and ending with Maløy in Norway at the bottom.
The short period component of the water level measurements is shown in Fig. 5d. Many stations show oscillations, although the zero crossing periods vary. For some stations, the oscillation period is so short that the time series resembles noise. Short period oscillations are common in coastal water level records where they are known as harbour seiches (Pugh, 1987). The seiche ringing phenomenon may continue for hours or days, and in high amplitude cases, it may be identified as a meteo-tsunami (Pattiaratchi and Wijeratne, 2015). For the present storm, there appears to be a spatial clustering of certain groups of stations based on the short period behaviour. In particular, several neighboring stations on the northwest coast of Denmark show a sudden onset of oscillations, as if the seiche oscillations are initiated suddenly by a single forcing event. For each station, a statistical analysis of the oscillations was conducted following the conventions used for high resolution recordings of wind waves. The sequence of oscillations was separated according to the zero-crossing times and assessment was made of the zero-crossing wave period, minimum/maximum amplitude, and oscillation range. The maximum oscillation range was identified, and the stations were ranked according to this value. The maximum range was about 66 cm for Bremen Grosse Weserbrücke in Germany in the late afternoon of 4 December 1999. Ten stations had maximum ranges greater than 50 cm during the 2 d storm period. These are located along the coast of Germany and Denmark, and the maximum oscillation events occur mostly between noon and early evening on 3 December 1999. Table S4 gives a complete list of maximum oscillations for all stations around the North Sea, and Fig. S18 presents the maximum amplitude versus distance around the North Sea from Lerwick, highlighting its spatial characteristics. Care must be taken in comparing stations around the North Sea as the data discretization conventions differ among countries, and the one hour discretization of the two French stations would not show the sudden onset of a short period event like the other stations.
The highest skew surge for tide gauge stations around the North Sea is shown in Fig. 6 for the results of the present analysis and the corrected literature reports. Skew surge is the most common way that storm water levels are presented in the media, and it denotes the difference between the maximum measured water level and model predictions of the expected high tide. There are large differences in the skew surge values around the North Sea, with stations in the German Bight and southern Denmark approaching about 2.5–3 m in some instances. The original tide gauge data for Germany, which were recorded at one minute intervals, give an indication of shorter period dynamical features that may be masked by the longer sampling intervals of normal tide gauge records. Figures S19 and S20 show that the range of water levels over 10 min intervals exceeded 50 cm for four stations. One station – Bake-Z – registered a 10 min range of water levels that appears to have reached almost 1.7 m over a period of hours. Because the values were significantly higher than neighbouring stations, the registered data might be erroneous (Fig. S21). On the other hand, the digital data are partially supported by an unusual accident nearby where an unmanned light vessel capsized and sank.
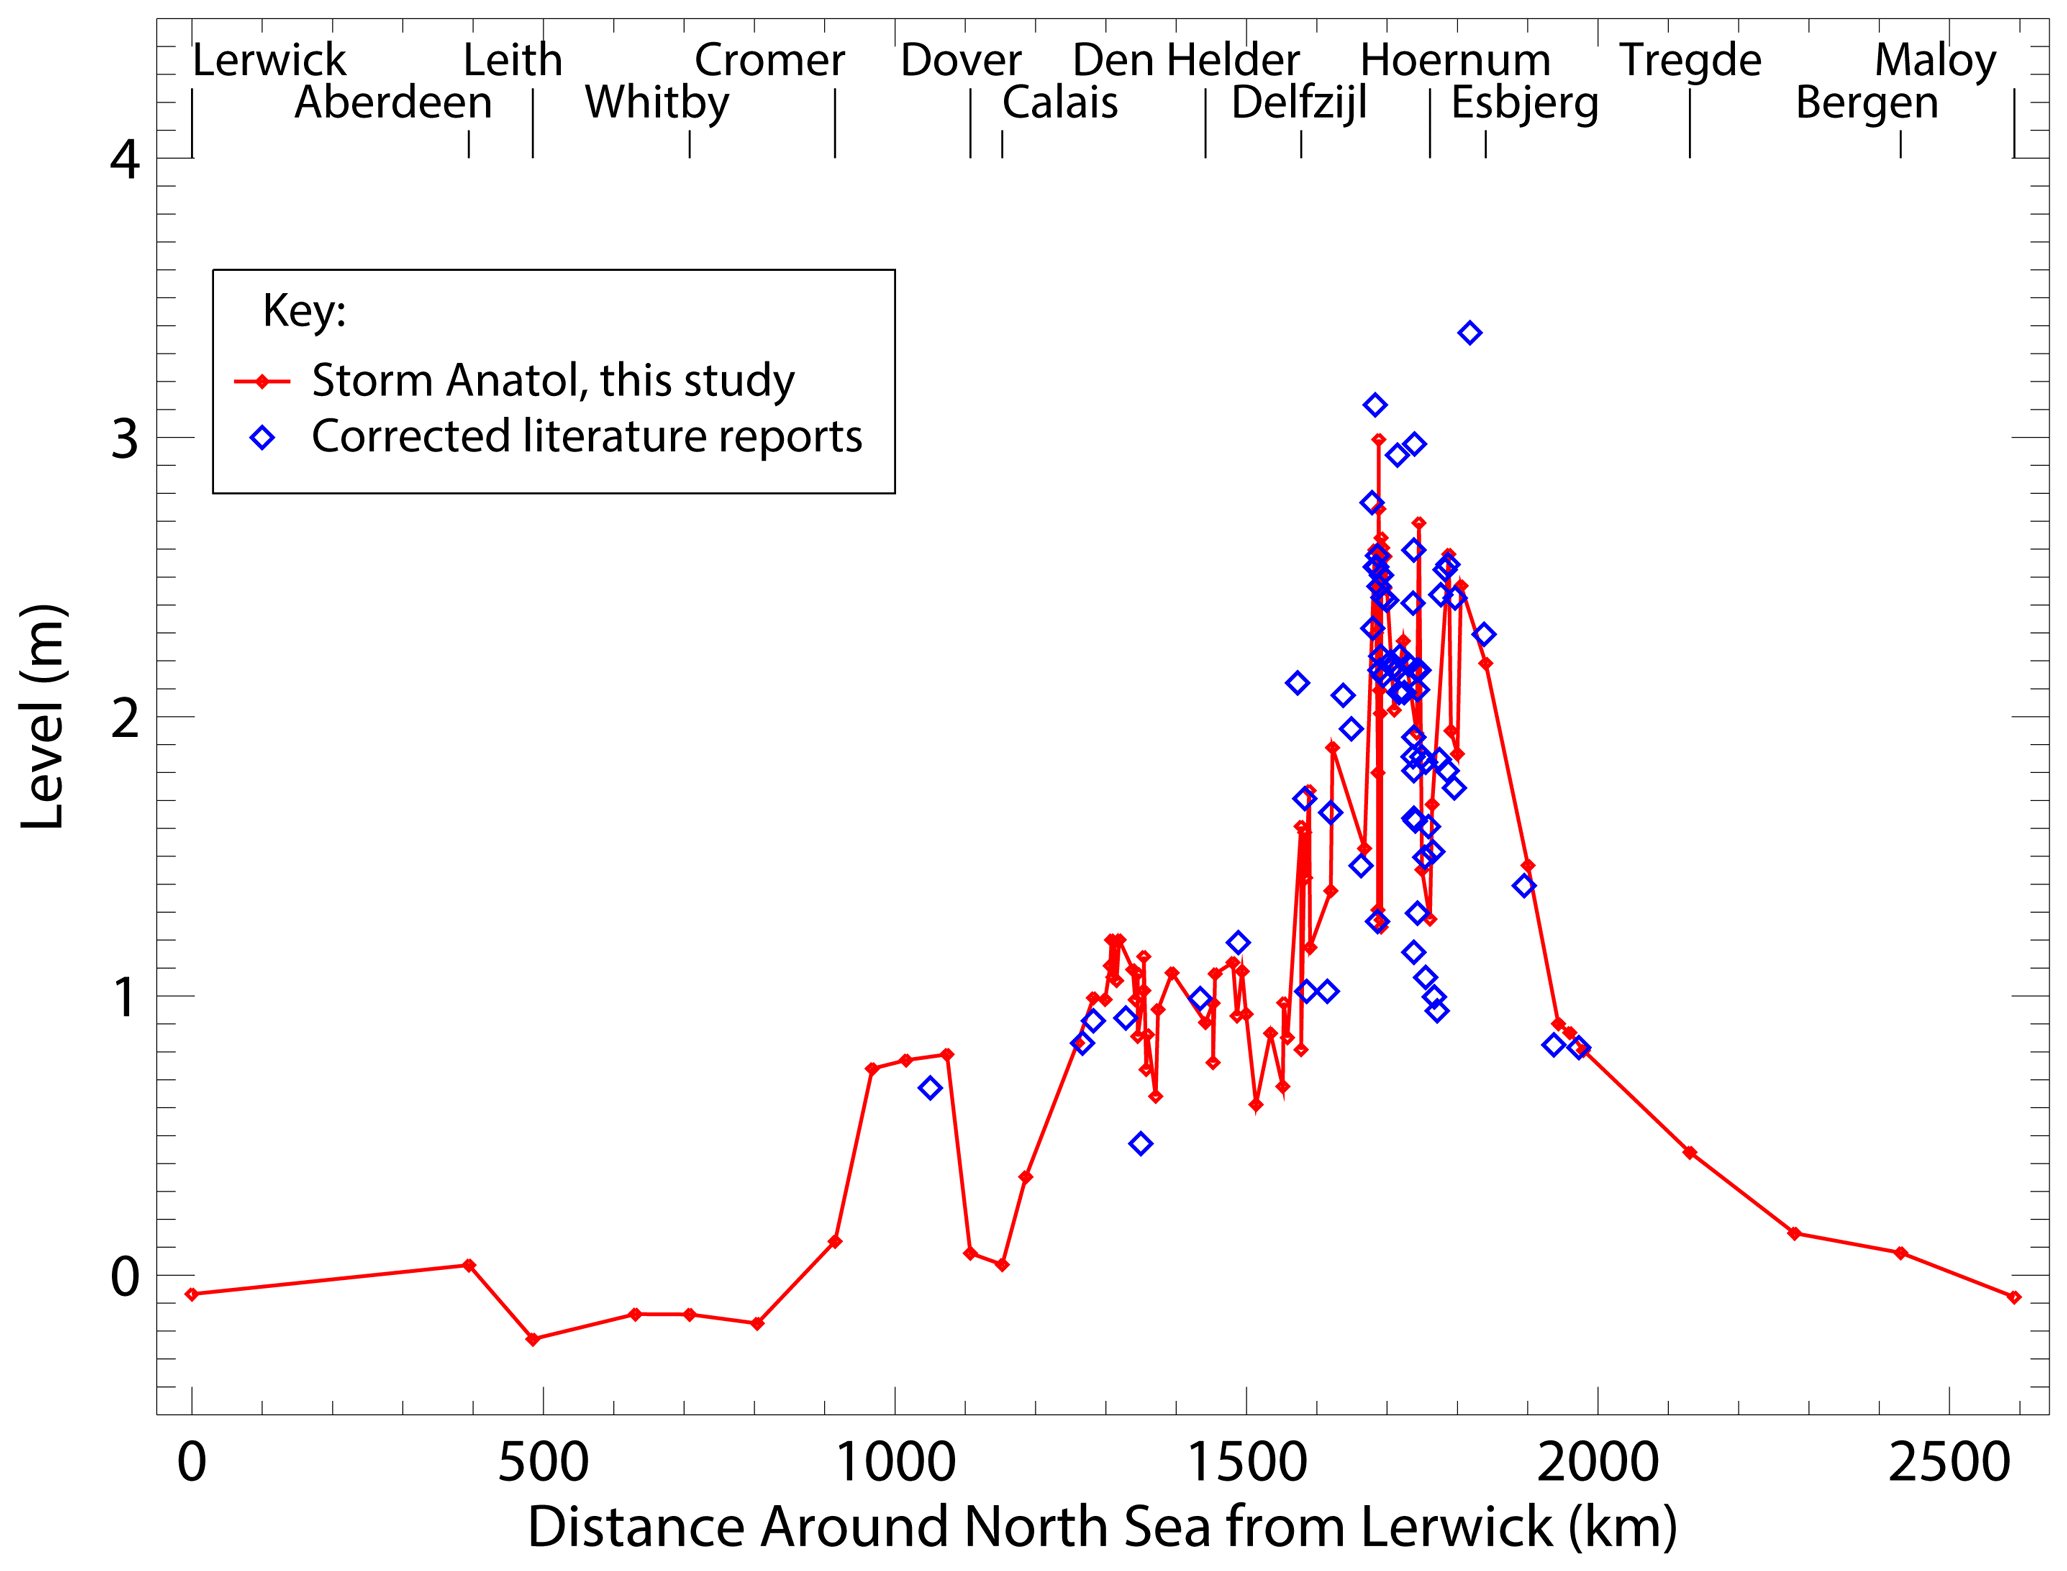
Figure 6Skew surge during Storm Anatol on 3–4 December 1999. The values are calculated from tide gauge records and arranged by counter-clockwise distance around the North Sea starting from Lerwick in Scotland. Literature reports are included for comparison.
The significance of the skew surge levels shown in Fig. 6 is placed in a historical context by expressing absolute water levels in terms of their return period of recurrence. This requires a data base of past storm surges or at least a report of the last time that a given water level was exceeded. For cases where there is no precedent of an extreme measured water level within the measurement record, statistical extrapolation techniques are used to derive a return period. The return periods of water level for Storm Anatol are shown in Fig. 7. This map has been constructed from different sources that are given in Table S5. For Esbjerg in Denmark, water levels during Storm Anatol exceeded the level of a 100-year event with no higher flood in the instrument measurement record at the time of occurrence (Ditlevsen et al., 2018). Coastal defence structures in Denmark are designed to a 100 year return period standard (Gönnert et al., 2012, p. 123), and contemporary accounts indicate that water levels were close to the overtopping thresholds (Danhostel-Ribe, 2021).
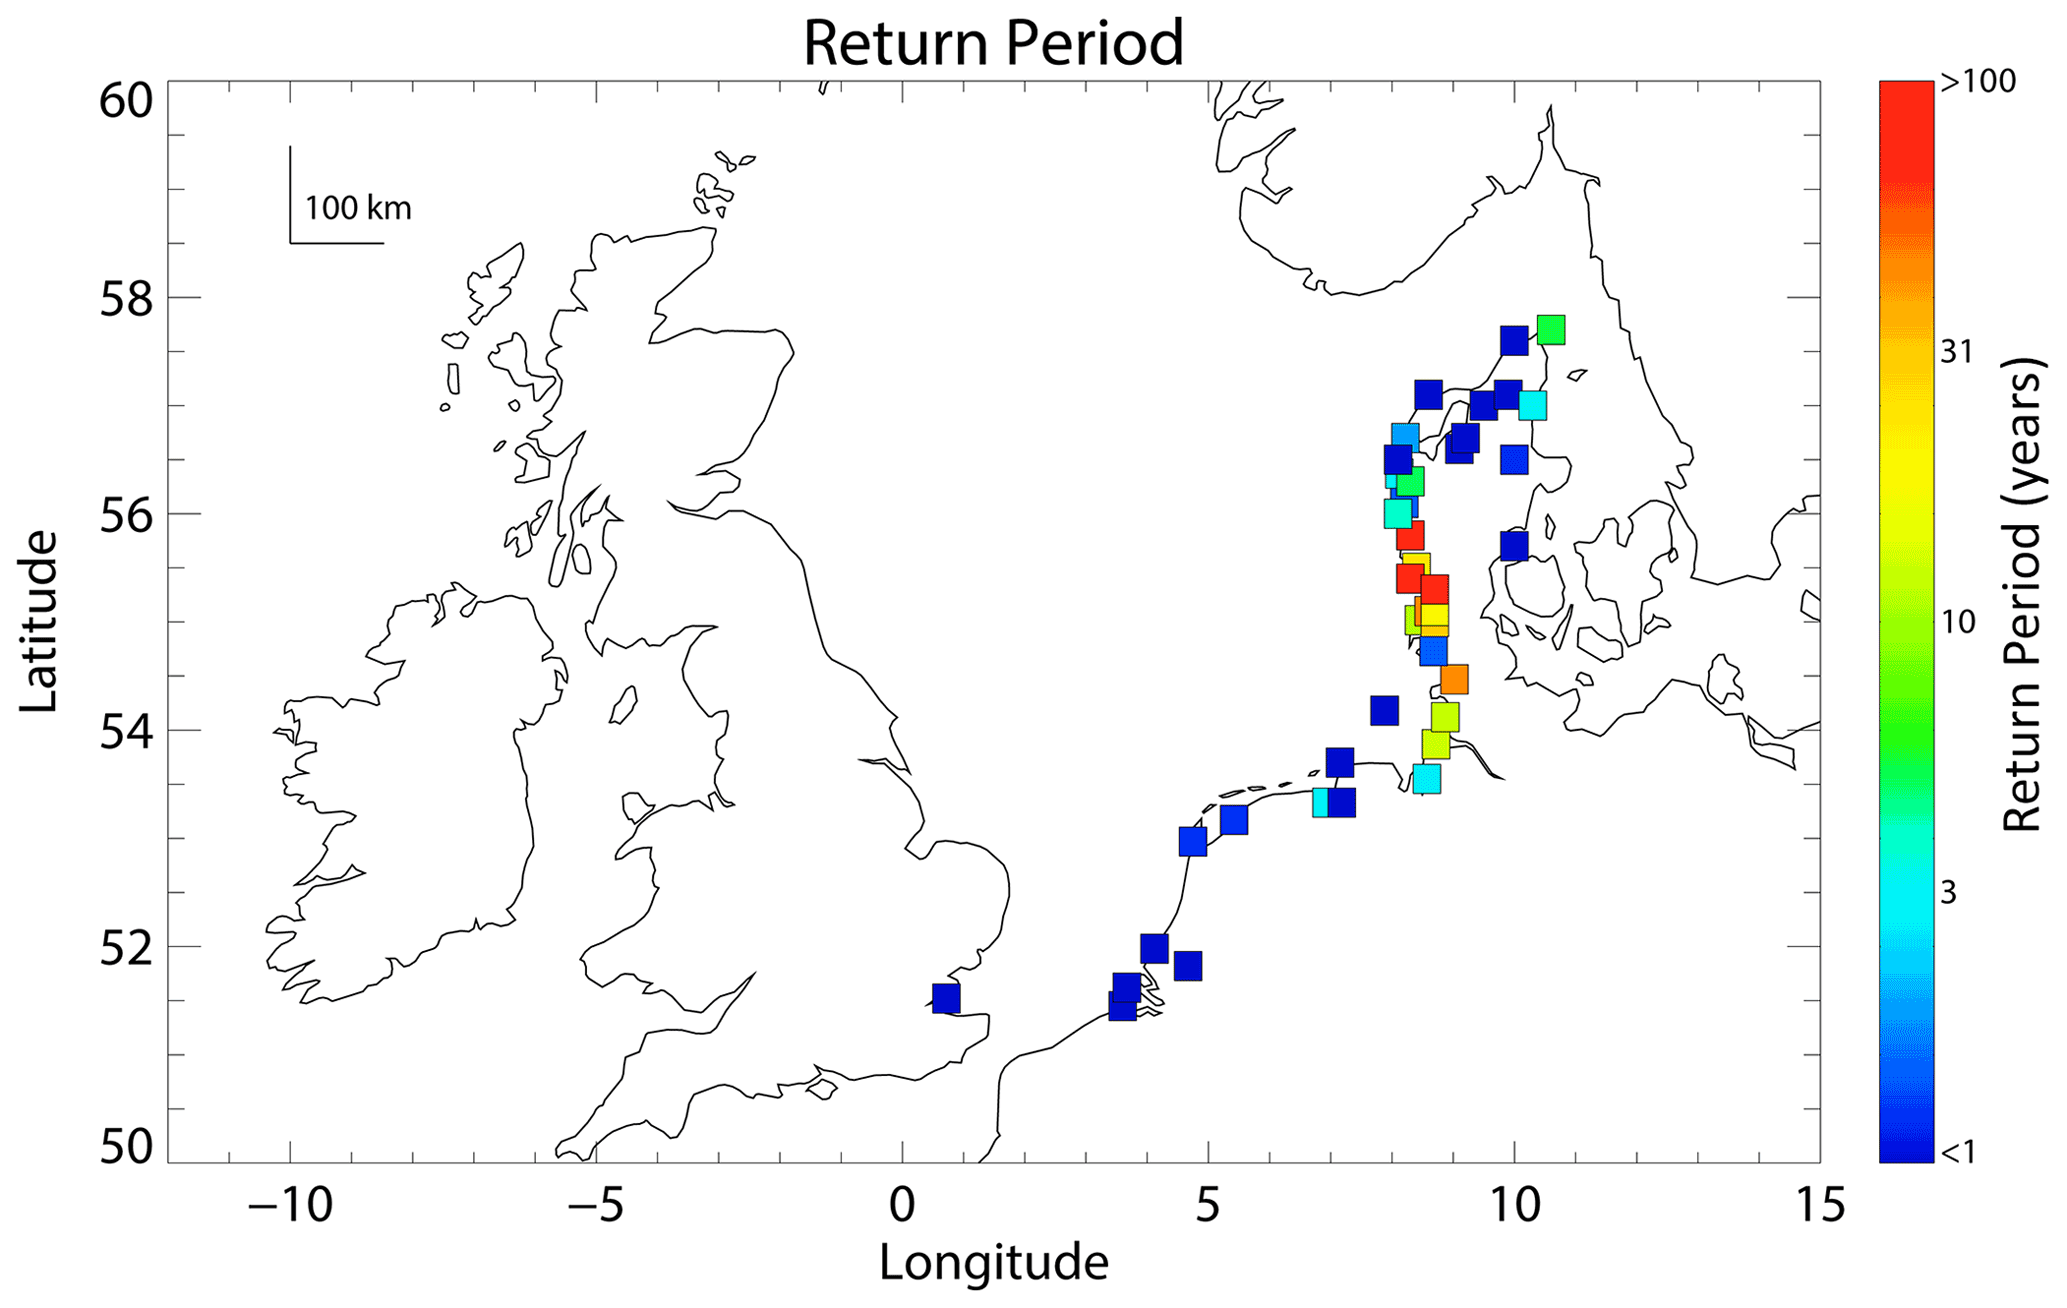
Figure 7Return period of maximum water level during Storm Anatol 3–4 December 1999, as calculated from literature summary results.
Figure 8 shows the crests of the tidal wave and storm surge plotted on axes of time versus counter-clockwise distance around the North Sea (see also Fig. S22 for a simplified graph of this information). This presentation format was used by Pugh (1987) to highlight the relative timing of the surge and tide peaks, and is based on the fact that these Kelvin waves travel counter-clockwise along the coast of the North Sea. For Storm Anatol, Fig. 8 indicates that the storm surge peak was associated with three or four different tidal cycles during its movement around the North Sea. Along the east coast of Scotland and England north of East Anglia, the surge maximum was approximately in phase with the travelling tidal minimum, and it had the characteristics of a travelling external surge. Along the North Sea coasts of southeast England and the southern Netherlands, the timing of the surge maximum appeared to slow that so that it occurred close to the time of high water of the preceding tidal cycle. In the German Bight and southern Denmark, the strong wind forcing appeared to induce a wind-driven surge maximum in the early evening of 3 December 1999, which had an earlier arrival time compared to the external surge propagating from England. In the Danish Wadden Sea area, the timing of the surge maximum occurred during tidal low water in the afternoon of 3 December 1999. The slope of the surge peak in Fig. 8 gives the appearance that the surge may have been travelling westward (opposite to the expected eastward propagation direction of a Kelvin wave) in the German Bight area, although this may be an artefact of the spatial development of the wind field across the region. The apparent travelling characteristics of the surge peak for Storm Anatol are different compared with previous winter storms reviewed by Kettle (2018, 2019, 2020).
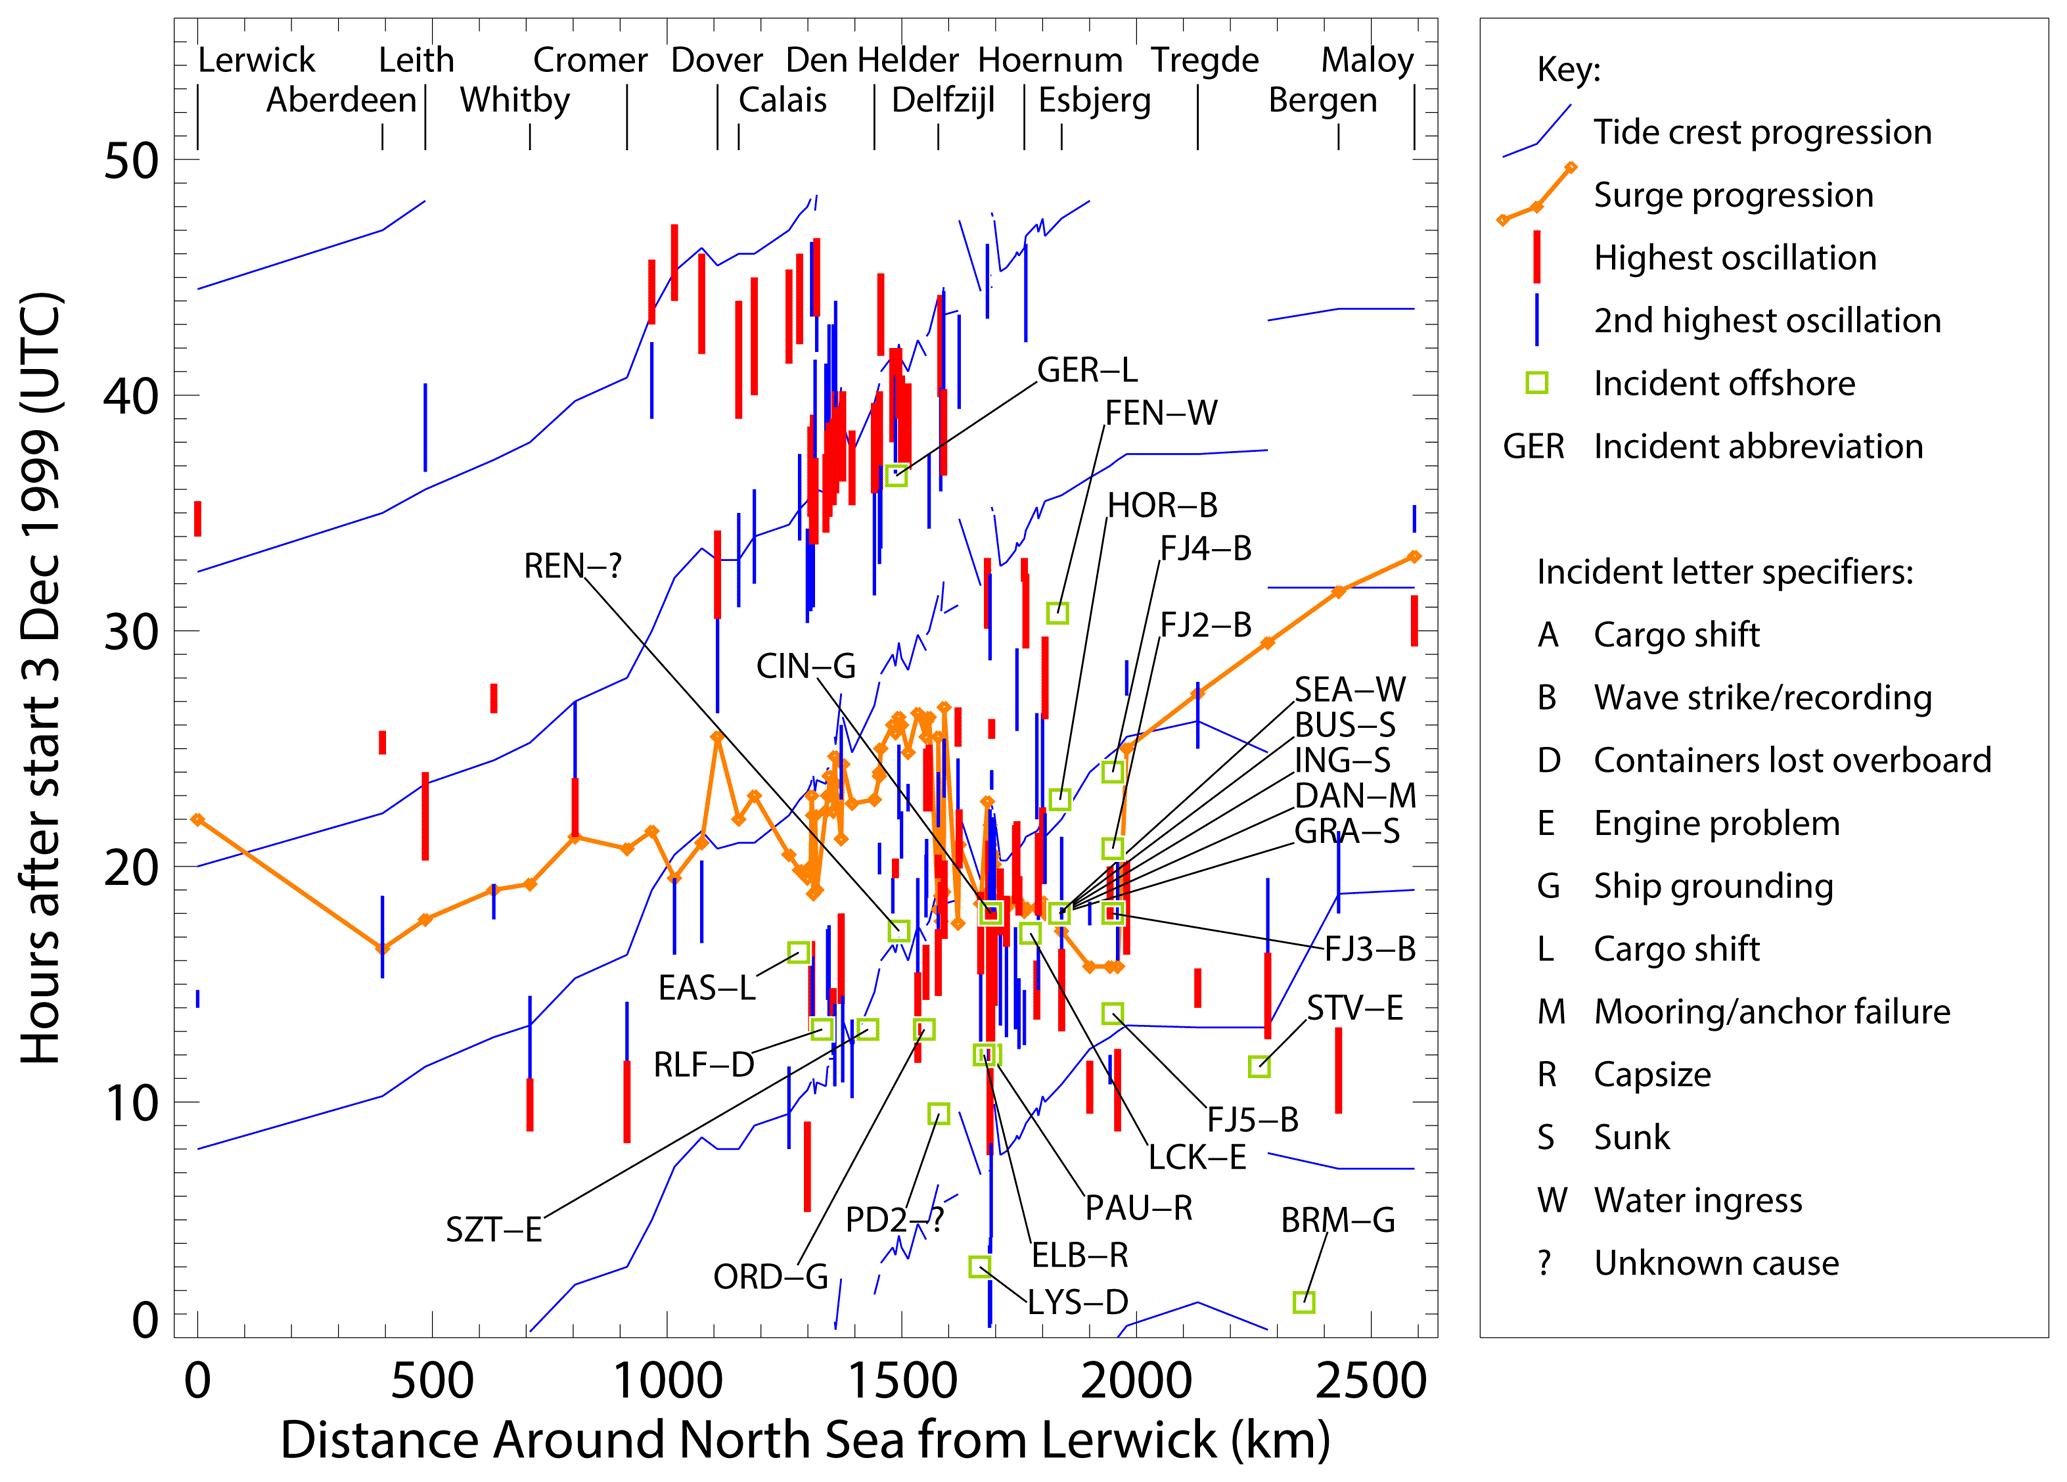
Figure 8Summary of the progression of the tidal crests and storm surge peak around the North Sea on 3–4 December 1999, and spatial-temporal relationship of peak-to-trough range of the highest up-crossing short period oscillations in the tide gauge record and maritime incidents/accidents. The data are plotted on axes of time versus counter-clockwise distance around the North Sea starting from Lerwick in Scotland.
The timing of the extreme short period oscillations and maritime incidents/accidents are plotted on the same axes of time versus counter-clockwise coastal distance around the North Sea also in Fig. 8 (see also Fig. S23 for a simplified graph of this information). The figure shows the timing of short period up-crossing oscillations with the highest and second highest range for each of the 89 stations around the North Sea. In southeast England and most of the Dutch coast, the highest oscillations occurred on 4 December, approximately 12 h after main storm surge had passed through. For the North Sea coasts of Germany and the Danish Wadden Sea, the extreme oscillations are found in close association with the storm surge. Most of the reported shipping accidents took place along a section of the North Sea coast between the Netherlands and Denmark. They occurred mostly in the 36 h period between the start of 3 December to noon on 4 December with a cluster of incidents in the interval 12:00–24:00 on 3 December 1999. The record of the Fjaltring waverider buoy is noteworthy, as it appears to register a series of anomalous maximum wave heights at about the same time that neighbouring tide gauges recorded the maximum surge and highest short period oscillations.
Storm Anatol had serious impacts on societal and energy infrastructure, and there were ramifications to introduce measures to reduce the impact of future storms. Large scale damage to the electrical power line network in Denmark led to power outages that lasted up to a week after the storm for some areas. Electricity transmission infrastructure was modified in the following decade to move power cables underground where they would be less susceptible to wind-related damage. It improved the resilience of the power network, and as a consequence there were no significant power outages in Denmark during the severe storms of 2013 (Danish Energy Agency, 2015).
The storm also forced improvements in weather forecasting procedures by meteorological authorities. The rapid development of the hurricane in just 24 h represented a challenge to forecasters with respect to long-term warning and skill in predicting the storm trajectory for surge prediction (DMI, 1999; Nielsen and Nielsen, 2000; Voldberg, 2000). At the time of the storm, ECMWF was engaged in an ongoing reanalysis project to develop a consistent global meteorological overview for the second half of the 20th century. The activity was important for climate assessments. However, efforts were also made to test the reanalysis scheme with historic storms to assess the ensemble model forecasting skill on longer time scales relevant for storm warning (Jung et al., 2003). Storm Anatol was identified as an important test, and improved ensemble models showed how the storm could be predicted several days in advance (Buizza and Hollingsworth, 2000/01, 2002).
For the wind energy industry, damage from Storm Anatol was not as bad as expected. The total number of onshore turbines damaged and destroyed was only about 20 of the thousands in operation in Denmark and northern Germany. Commenting on the prospects of future offshore wind energy, insurance industry sources were guardedly optimistic. Case studies had revealed that tropical cyclones in India and the Atlantic could cause large damage to coastal wind farms that was far greater than the damage caused by Storm Anatol to onshore wind energy in northern Europe. On the other hand, it was pointed out that the proposed location of wind farms in the North Sea was on the track of the worst historic winter storms so that extreme met-ocean loading would be expected (Fehrmann and Fackler, 2010). Another insurance authority highlighted that there was reluctance of the insurance industry to engage with the offshore sector because of the high uncertainty of how infrastructure responds to extreme met-ocean loading (Berz, 1984). Pointedly, the situation was framed in terms of Murphy's Law rather than the conventional analysis of extreme value theory, leading to the implication that the wind and wave conditions for the worst offshore storms may not be well understood. Except for one brief reference to a wave event on a ship (HSE, 2002), rogue waves were not explicitly mentioned in literature reports for Storm Anatol. However, some of the maritime accidents were consistent with large wave strikes, and a wave buoy off the Danish west coast registered unusually high waves at certain times during the storm period.
Climate change and the link with increasing storminess was brought up in relation to the storm events of December 1999. Storm Anatol represents the largest insured loss ever for Denmark, and the Danish insurance industry experienced solvency problems in dealing with the compensation claims after the event. Although the industry had experienced comparable severe storms in early 1990, the repetition of events only 9 years later was felt unlikely, and insurance rates were assessed optimistically on shorter intervals of a few years. The storm events of 1999 led to significant developments and procedural changes in the insurance sector to protect against future problems (Tatge, 2009). Even though scientists stated that individual storm events could not be linked with climate change (Ulbrich et al., 2001), the insurance industry only needed the second episode of severe storms of December 1999 as a call to action for changing storm patterns (Air Worldwide, 2019).
The water level data for this study were measured by the national tide gauge networks of the UK, France, the Netherlands, Germany, Denmark, and Norway. The data were downloaded from publicly accessible websites maintained by the national authorities, except for France (datasets obtained through the GESLA online archive) and Germany (datasets sent by Wilfried Wiechmann of the Federal Institute of Hydrology in Germany). Further information on the URL internet addresses is given in Table S2 of the Supplement.
The supplement related to this article is available online at: https://doi.org/10.5194/adgeo-56-141-2021-supplement.
The contact author has declared that there are no competing interests.
Publisher’s note: Copernicus Publications remains neutral with regard to jurisdictional claims in published maps and institutional affiliations.
This article is part of the special issue “European Geosciences Union General Assembly 2021, EGU Division Energy, Resources & Environment (ERE)”. It is a result of the EGU General Assembly 2021, 19–30 April 2021.
The author gratefully acknowledges data from the national tide gauge networks of the UK, the Netherlands, Germany, Denmark, and Norway, and also the GESLA archive for French North Sea stations. The tide gauge data for the UK, France, the Netherlands, Denmark, and Norway were downloaded from Internet servers. For Germany, Wilfried Wiechmann of the Bundesanstalt für Gewässerkunde (BAFG) kindly provided tide gauge data by email. Gerda van Vliet provided information on rescues by the Koninklijke Nederlandse Redding Maatschappij (KNRM, the Dutch lifeboat service) along the Dutch coast. The following people provided background reports, data, or other information to support this review: Gerhard Berz (Munich Re, retired), Mark Beswick and Catherine Ross (Met Office National Meteorological Archive, UK), Maria Bluemel and Arfst Hinrichsen (Landesbetrieb für Küstenschutz, Nationalpark, und Meereschutz Schleswig-Holstein, Germany), Gerhard Ersdal (Petroleum Tilsynet, Norway), Bjørn Frederiksen (Kystdirektoratet, Denmark), Edwin Granneman (Kustwacht, the Netherlands), Pamela Machoczek and Larissa Müller (Bundesamt für Seeschifffahrt und Hydrographie, Germany), Bárður Niclasen (University of the Faroe Islands), Antke Reemts (Die Seenotretter, Germany), Reidun Gangstø Skaland (Met.no, Norway), Susanne Tainamo (Swedish Meteorological and Hydrological Institute), and Annette Zijderfeld (Rijkswaterstaat, the Netherlands). The manuscript was improved by the helpful comments of two anonymous referees and the typesetting work of Viola Zierenberg.
This paper was edited by Gregor Giebel and reviewed by two anonymous referees.
Air Worldwide: Three severe storms together were a wake-up call, Air Worldwide, Boston, Massachusetts, available at: https://www.air-worldwide.com/blog/posts/2019/12/three-severe-european-winter-storms-together-were-a-wake-up-call/ (last access: 21 November 2021), 19 December 2019.
Alexandersson, H., Schmith, T., Iden, K., and Tuomenvirta, H.: Long-term variations of the storm climate over NW Europe, The Global Atmosphere and Ocean System, 6, 97–120, 1998.
Berz, G.: Research and statistics on natural disasters in insurance and reinsurance companies, The Geneva Papers on Risk and Insurance, April 1984, Vol. 9, No. 31, From the Proceedings of the First Meeting of the International Working Group on: Natural Disasters and Insurance (II), 135–157, 1984.
Brugge, R.: Weather Diary, available at: http://www.met.reading.ac.uk/~brugge/diary1999.html#1299 (last access: 21 November 2021), December 1999.
Buizza, R. and Hollingsworth, A.: Severe weather prediction using the ECMWF EPS – The European Storms of December 1999, ECMWF Newsletter, No. 89, Winter 2000/01.
Buizza, R. and Hollingsworth, A.: Storm prediction over Europe using the ECMWF ensemble prediction system, Meteorol. Appl., 9, 289–305, 2002.
CaithnessWindfarm: Wind turbine accident compilation, available at: http://www.caithnesswindfarms.co.uk/fullaccidents.pdf, last access: 20 June 2021.
Cappelen, J.: Orkaner på vore breddegrader, available at: https://www.dmi.dk/vejr-og-atmosfare/temaforside-vind/orkaner-paa-vore-breddegrader/ (last access: 12 October 2020), updated 8 January 2019.
Cappelen, J., Olufsen, S., Ribergaard, M. H., Nielsen, J. W., Schmith, T., and Hansen, N.: Stormfloden under decemberorkanen, available at: https://www.dmi.dk/vejr-og-atmosfare/temaforside-decemberorkanen-1999/stormfloden-under-decemberorkanen/ (last access: 19 November 2021), updated 25 June 2018a.
Cappelen, J., Olufsen, S., Ribergaard, M. H., Nielsen, J. W., Schmith, T., and Hansen, N.: Orkan passerer, available at: https://www.dmi.dk/vejr-og-atmosfare/temaforside-decemberorkanen-1999/orkanen-passerer/ (last access: 19 November 2021), updated 25 June 2018b.
Cappelen, J., Olufsen, S., Ribergaard, M. H., Nielsen, J. W., Schmith, T., and Hansen, N.: Stormfloden under decemberorkanen, available at: https://www.dmi.dk/vejr-og-atmosfare/temaforside-decemberorkanen-1999/stormfloden-under-decemberorkanen/ (last access: 25 November 2021), updated 25 June 2018c.
Cargolaw: International Vessel Casualties & Pirates Database – Years 1999 And Before, available at: http://www.cargolaw.com/presentations_casualties_a.html#Dec_99, last access: 24 September 2019.
Danhostel-Ribe: Sturmfluten, available at: https://web.archive.org/web/20131215125955/http://www.danhostel-ribe.dk/de/sturmfluten, last access: 25 April 2021.
Danish Energy Authority: Offshore Wind Power, Danish Experiences and Solutions, Danish Energy Authority, Copenhagen, 2005.
Danish Energy Agency: Security of Electricity Supply in Denmark, Danish Energy Agency, Copenhagen, ISBN 978-87-93180-15-4, 1st Edn., 2015 (translated in 2016).
Ditlevsen, C., Ramos, M. M., Sørensen, C., Ciocan, U. R., and Pionkowitz, T.: Højvandsstatistikker 2017, Miljø- og Fødevareministeriet, Kystdirektoratet, Lemvig, 2018.
DMI: Rapport. Orkanen over Danmark den 3.–4. december 1999, Denmarks Meteorologiske Institut, Københaven, 1999.
Draper, L.: Chapter 10. Wave climatology of the UK Continental Shelf, in: The North-west European shelf seas, the sea bed, and the sea in motion, II. Physical and chemical oceanography, and physical resources, edited by: Banner, F. T., Collins, M. B., and Massie, K. S., Elsevier Oceanography Series 24B, Elsevier Scientific Publishing Company, Amsterdam-Oxford-New York, 353–368, 1980.
DWD: Orkantief “Anatol” von 3./4. Dezember 1999, 5 pp., available at: https://www.dwd.de/DE/leistungen/besondereereignisse/stuerme/19991204_orkantief_anatol.pdf (last access: 3 December 2021), 1999.
DWD: Klimatologische Bewertung der jungsten Starkwindereignisse (ANATOL und LOTHAR) aus der Sicht der Klimatologie der freien Atmosphäre, 8 pp., available at: https://www.dwd.de/DE/leistungen/besondereereignisse/stuerme/20000201_bewertung_lothar-anatol.html (last access: 22 November 2021), 2000.
Environment Agency: Thames Barrier Project Pack 2018, Environment Agency, London, January 2018.
Ersdal, G. and Kvitrud, A.: Green water on Norwegian production ships, Proceedings of the Tenth (2000) International Offshore and Polar Engineering Conference, Seattle, USA, 28 May–2 June 2000, The International Society of Offshore and Polar Engineers, 211–218, 2000.
Faulkner, D.: Shipping safety. A matter of concern, Ingenia, Royal Academy of Engineering, London, 13, 13–20, 2002.
Fehrmann, A. and Fackler, A.: Offshore wind farms: risk and initial loss experience, Temple Insurance, a member of the Munich Re Group, 2010.
Feser, F., Barcikowska, M., Krueger, O., Schenk, F., Weiss, R., and Xia, L.: Review Article: Storminess over the North Atlantic and northwestern Europe – a review, Q. J. Roy. Meteor. Soc., 141, 350–382, 2015.
Fink, A. H., Brücher, T., Ermert, V., Krüger, A., and Pinto, J. G.: The European storm Kyrill in January 2007: synoptic evolution, meteorological impacts and some considerations with respect to climate change, Nat. Hazards Earth Syst. Sci., 9, 405–423, https://doi.org/10.5194/nhess-9-405-2009, 2009.
FINO1: 15-m wave damaged FINO1, available at: https://www.fino1.de/de/aktuelles/meldung/15-meter-welle-beschaedigt-fino1.html (last access: 22 November 2021), 2014.
Fischer, J., Herklotz, K., Senet, C., Outzen, O., and Hahn, R.: Oceanographic observations at FINO1 and the “Alpha Ventus” offshore wind farm, 10th German wind energy conference, DEWEK 2010, Bremen, 2010.
Fruergaard, M., Andersen, T. J., Johannessen, P. N., Nielsen, L. H., and Pejrup, M.: Major coastal impact induced by a 1000-year storm event, Nature, Sci. Rep.-UK, 3, 1051, https://doi.org/10.1038/srep01051, 2013.
Gönnert, G., Isert, K., Giese, H., and Plüss, A.: Charakterisierung der Tidekurve, Die Küste, 68, 99–141, 2004.
Gönnert, G., Gerkensmeier, B., and Müller, J. M.: Ermittlung des Sturmflutbemessungswasserstandes für den öffentlichen Hochwasserschutz in Hamburg, Berichte des Landesbetriebes Strassen, Brücken und Gewässer, No. 12/2012, Freie und Hansestadt Hamburg, Brücken und Gewässer (LSBG), Hamburg, 2012.
Gunson, J., Lehner, S., and Bitner-Gregersen, E.: Extreme wave conditions from wave model hindcasts and from synthetic aperture radar images, Design and operation for abnormal conditions II, November 2001, Proc. Royal Institution of Naval Architects, London, UK, 17 pp., 2001.
Hansen, J.: Storms of my Grandchildren, Bloomsbury, New York, 2009.
Hogben, N.: Increases in wave heights over the North Atlantic: A review of the evidence and some implications for the naval architect, Transactions of The Royal Institution of Naval Architects, W5, 93–101, 1994.
HSE: An investigation of storm incidents in UK waters, Prepared by the Met Office for the Health and Safety Executive, Offshore Technology Report 2001/078, Meteorological Office, Johnson House, Berkshire, HSE Books, 2002.
IEA: Wind Energy Annual Report 2000, International Energy Agency, National Renewable Energy Laboratory, Colorado, USA, 2001.
Jensen, J., Mudersbach, C., Müller-Navarra, S. H., Bork, I., Koziar, C., and Renner, V.: Modellgestützte Untersuchungen zu Sturmfluten mit sehr geringen Eintrittswahrscheinlichkeiten an der deutschen Nordseeküste, Die Küste, 71, 123–167, 2006.
Jung, T., Klinker, E., and Uppala, S.: 10. Reanalysis and reforecast of three major European storms of the 20th century using the ECMWF forecasting system, ERA-40 Project Report Series, European Centre for Medium Range Weather Forecasts, Reading, 33 pp., 2003.
Kettle, A. J.: The North Sea surge of 31 October–1 November 2006 during Storm Britta, Adv. Geosci., 45, 273–279, https://doi.org/10.5194/adgeo-45-273-2018, 2018.
Kettle, A. J.: Storm Tilo over Europe in November 2007: storm surge and impacts on societal and energy infrastructure, Adv. Geosci., 49, 187–196, https://doi.org/10.5194/adgeo-49-187-2019, 2019.
Kettle, A. J.: Storm Xaver over Europe in December 2013: Overview of energy impacts and North Sea events, Adv. Geosci., 54, 137–147, https://doi.org/10.5194/adgeo-54-137-2020, 2020.
Kristandt, J., Brecht, B., Frank, H., and Knaack, H.: Optimization of empirical storm surge forecast – modelling of high resolution wind fields, Die Küste, 18, 301–308, 2014.
Lamb, H.: Through all the changing scenes of life: A meteorologist's tale, Taverner Publications, East Harling, Norfolk, UK, 1997.
Lehner, S., Schulz-Stellenfleth, J., and Niedermeyer, A.: Detection of extreme waves using synthetic aperture radar images, IEEE International Geoscience and Remote Sensing Symposium, IEEE, Toronto, ON, Canada, 1893–1895, https://doi.org/10.1109/IGARSS.2002.1026291, 2002.
Lehner, S. H.: Extreme wave statistics from radar sets, Conference: International Geoscience and Remote Sensing Symposium, 2004, IGARSS '04, October 2004, Proceedings 2004 IEEE International, Vol. 3, available at: http://www.soest.hawaii.edu/PubServices/2005pdfs/Lehner.pdf (last access: 24 November 2021), 2004.
Lloyd's Casualty Week: Vol. 318, No. 12, LLP Ltd, Colchester, Essex, UK, 17 December 1999.
Met Eireann: Monthly Weather Bulletin, no. 164, December 1999.
Monserrat, S., Vilibić, I., and Rabinovich, A. B.: Meteotsunamis: atmospherically induced destructive ocean waves in the tsunami frequency band, Nat. Hazards Earth Syst. Sci., 6, 1035–1051, https://doi.org/10.5194/nhess-6-1035-2006, 2006.
Münchener Rück: Winterstürme in Europa, Schadenanalyse 1990 Schadenpotentiale, Münchener Rückversicherungs-Gesellschaft, Munich, Germany, 1993.
Munich Re: Winter storms in Europe (II). Analysis of 1999 losses and loss potentials, Münchener Rückversicherungs-Gesellschaft, Central Division: Corporate Communications, Munich, Germany, 2002.
Murty, T. S.: Seismic sea waves tsunamis, Bulletin 198, Department of Fisheries and the Environment, Fisheries and Marine Service, Ottawa, 1977.
Neckelmann, S. and Petersen, J.: Evaluation of the stand-alone wind and wave measurement systems for Horns Rev 150 MW offshore wind farm in Denmark, OWEMES 2000, ATENA, Rome, Sicily, 17–27, 2000.
Neu, H. J. A.: Interannual variations and longer-term changes in sea state of the North Atlantic from 1970 to 1982, J. Geophys. Res., 89, 6397–6402, 1984.
Neumann, T. and Nolopp, K.: Three years operation of far offshore measurements at FINO1, DEWI Magazine, 30, 42–46, 2007.
Nielsen, J. W. and Nielsen, M. H.: Stormfloden forårsaget af orkanen den 3. december 1999, Vejret, 82, 8–14, 2000.
Outzen, O., Herklotz, K., Heinrich, H., and Lefebvre, C.: Extreme waves at FINO1 research platform caused by storm “Tilo” on 9 November 2007, DEWI Magazine No. 33, 17–23, 2008.
Pattiaratchi, C. B. and Wijeratne, E. M. S.: Are meteotsunamis an underrated hazard?, Philos. T. R. Soc. A, 373, 2140377, https://doi.org/10.1098/rsta.2014.0377, 2015.
Pelt, S.: Kraftige storme med oprindelse i Nordatlanten, Vejret, 137, 44–47, 2013.
Pleskachevsky, A. L., Lehner, S., and Rosenthal, W.: Storm observations by remote sensing and influences of gustiness on ocean waves and on generation of rogue waves, Ocean Dynam., 62, 1335–1351, https://doi.org/10.1007/s10236-012-0567-z, 2012.
Pugh, D. T.: Tides, Surges and Mean Sea Level, John Wiley and Sons, Chichester, 1987.
RMS: 2013–2014 Winter Storms in Europe. An Insurance and Catastrophe Modeling Perspective, RMS White Paper, 2014.
Roberts, J. F., Champion, A. J., Dawkins, L. C., Hodges, K. I., Shaffrey, L. C., Stephenson, D. B., Stringer, M. A., Thornton, H. E., and Youngman, B. D.: The XWS open access catalogue of extreme European windstorms from 1979 to 2012, Nat. Hazards Earth Syst. Sci., 14, 2487–2501, https://doi.org/10.5194/nhess-14-2487-2014, 2014.
Rosenthal, W.: Results of the Maxwave project, in: Rogue Waves, edited by: Müller, P. and Henderson, D., Proc. 14th “Aha Huliko” Hawaii, Winter workshop, Univ. Hawaii, Manoa, Honolulu, School of Ocean Earth Sci. Technol., Spec. Publ., 193 pp., available at: https://www.soest.hawaii.edu/PubServices/2005pdfs/Rosenthal.pdf (last access: 24 November 2021), 2005.
Rossiter, J. R.: Storm surges in the North Sea, 11 to 30 December 1954, Philos. T. Roy. Soc. Lond. A, 251, 139–160, 1958.
RWS: Verslag van de Stormvloed van 3 en 4 december 1999 (SR79), Ministerie van Verkeer en Waterstaat, Directoraat-Generaal Rijkswaterstaat, Rijksinstituut voor Kust en Zee, Stormvloedwaarschuwingsdienst, Postbus 20907, 2500EX 's-Gravenhage, 's-Gravenhage, 1999.
Sahin, A. D.: Progress and recent trends in wind energy, Prog. Energ. Combust., 30, 501–543, 2004.
Sanders, F. and Gyakum, J. R.: Synoptic-dynamic climatology of the “Bomb”, Mon. Weather Rev., 108, 1589–1606, 1980.
Schmidt, H. and von Storch, H.: German Bight storm analysed, Nature, 343, 791, 1993.
Schmith, T., Kaas, E., and Li, T. S.: Northeast Atlantic winter storminess 1875–1995 re-analyzed, Clim. Dynam., 14, 529–536, 1998.
Sommer, A.: Offshore measurements of wind and waves at Horns Rev & Laeso, Denmark. European Seminar OWEMES, 10–12 April 2003, Naples, Campania, Italy, 2003.
Stull, R. B.: An Introduction to Boundary Layer Meteorology, Kluwer Academic Publishers, Dordrecht, 1988.
Tatge, Y.: Looking back, looking forward: Anatol, Lothar and Martin ten years later, available at: https://www.air-worldwide.com/publications/air-currents/looking-back-looking-forward-anatol-lothar-and-martin-ten-years-later/ (last access: 24 November 2021), 2009.
Toffoli, J. M., Lefevre, J. M., Montbaliu, J., Savina, H., and Bitner-Gregersen, E.: Freak waves: Clues for prediction in ship accidents? Proceedings of the Thirteenth (2003) International Offshore and Polar Engineering Conf. Honolulu, Hawaii, USA, 25–30 May 2003, The International Society of Offshore and Polar Engineers, 2003.
UKMO: Daily Weather Summary, 26 November 1999 to 5 December 1999, available at: https://digital.nmla.metoffice.gov.uk/collection_86058de1-8d55-4bc5-8305-5698d0bd7e13/, last access: 24 November 2021.
Ulbrich, U., Fink, A. H., Klawa, M., and Pinto, J. G.: Three extreme storms over Europe in December 1999, Weather, 56, 70–80, 2001.
UN/ECE Timber Committee: Chapter 3. Effects of the December 1999 storms on European timber markets, ECE/FAO Forest Products Annual Market Review, 1999–2000, 15 pp., Timber Bulletin, Vol. LIII, ECE/TIM/BULL/53/3, available at: https://unece.org/fileadmin/DAM/timber/docs/rev-00/03.pdf (last access: 24 November 2021), 2000.
Vedin, H. and Alexandersson, H.: Århundradets storm? Väder och Vatten, p. 18, SMHI, Norrköping, 1999.
Voldberg, H.: Vredens julemåned, Vejret, 82, 1–7, 2000.
WASA Group: Changing waves and storms in the Northeast Atlantic, B. Am. Meteorol. Soc., 79, 741–760, 1998.
Williams, M. O.: Wave mapping in UK waters, prepared by PhysE for the Health and Safety Executive, Research Report 392, HSE Books, Suffolk, 2005.
Williams, M. O.: Wave mapping in UK waters, Supporting document, Health and Safety Executive HSE, RR621 Research Report, HSE Books, Suffolk, 2008.
Woetnamm Nielsen, N. and Hansen Sass, B.: A numerical, high-resolution study of the life cycle of the severe storm over Denmark on 3 December 1999, Tellus A, 55, 338–351, 2003.
XWS: Extreme Wind Storms Catalogue, available at: http://www.europeanwindstorms.org/cgi-bin/storms/storms.cgi, last access: 6 September 2020.