 | 16 Nov 2021
Evaluating Flow in Fractal-Fracture Networks: Effect of Variable Aperture
Ankur Roy
While fractal models are often employed for describing the geometry of fracture networks, a constant aperture is mostly assigned to all the fractures when such models are flow simulated. In nature however, almost all fracture networks exhibit variable aperture values and it is this fracture aperture that controls the conductivity of individual fractures as described by the well-known cubic-law. It would therefore be of practical interest to investigate flow patterns in a fractal-fracture network where the apertures scale in accordance to their position in the hierarchy of the fractal. A set of synthetic fractal-fracture networks and two well-connected natural fracture maps that belong to the same fractal system are used for this purpose. A set of dominant sub-networks are generated from a given fractal-fracture map by systematically removing the smaller fracture segments with narrow apertures. The connectivity values of the fractal-fracture networks and their respective dominant sub-networks are then computed. Although a large number of fractures with smaller aperture are eliminated, no significant decrease is seen in the connectivity of the dominant sub-networks. A streamline simulator based on Darcy's law is used for flow simulating the fracture networks, which are conceptualized as two-dimensional fracture continuum models. A single high porosity value is assigned to all the fractures. The permeability assigned to fractures within the continuum model is based on their aperture values and there is nearly no matrix porosity and permeability. The recovery profiles and time-of-flight plots for each network and its dominant sub-networks at different time steps are compared. The results from both the synthetic networks and the natural data show that there is no significant decrease in fluid recovery in the dominant sub-networks compared to their respective parent fractal-fracture networks. It may therefore be concluded that in the case of such hierarchical fractal-fracture systems with scaled aperture, the smaller fractures do not significantly contribute to connectivity or fluid flow. In terms of decision making, this result will aid geoscientists and engineers in identifying only those fractures that ultimately matter in evaluating the flow recovery, thus building models that are computationally less expensive while being geologically realistic.
- Article
(5540 KB) - Full-text XML
- BibTeX
- EndNote


Fluid flow and transport characteristics in fractured media are controlled by connectivity and conductivity of fracture networks. The effect of connectivity on flow behavior of fracture networks is well studied by many researchers (Robinson, 1983; Berkowitz and Balberg, 1993; Berkowitz, 1995; de Dreuzy et al., 2002; Sahu and Roy, 2020). However, when it comes to simulating flow in such networks, an average value of aperture is assigned in most cases (Min et al., 2004; Hardebol et al., 2015; Chen, 2020) even though it has been recognized that such assumption of constant fracture aperture is an oversimplification (Odling and Roden, 1997). Aperture is the void space between two surfaces of a fracture. They vary in size from micrometres to centimetres as they result not only from mechanical misfit of fracture walls but also from chemical dissolution, and overburden pressure (Bonnet et al., 2001). Hence, the characterization of aperture distribution is important as it controls the rock mass hydro-mechanical properties of fracture networks (Kaulatilake et al., 2006). Neretnieks et al. (1982) experimentally illustrated that flow channelling occurs in individual fractures and mostly through highly preferential pathways in fracture networks. Cacas et al. (1990a, b) showed that broad distribution of fracture conductivities (apertures) is the main cause of high degree of flow channelling. Berkowitz (2002) pointed out that even a well-connected fracture network can display sparse preferential flow paths if the distribution of fracture aperture is significantly wide. Klepikova et al. (2014) showed that inversion of borehole temperature profiles under predefined pumping conditions can be applied for the detection of main permeable fractures. Although this approach of using temperature tomography does not identify all flowing fractures, it allows the detection of the most transmissive ones. A study on fracture insertion and deletion based on DFN transdimensional inversion using reversible jump Markov Chain Monte Carlo (rjMCMC) algorithm was carried out by Somogyvari et al. (2017). One interesting conclusion of this research is that no breakthrough is observed in fractures with smaller apertures within the simulated time. However, there is limited information in the literature that help researchers in realistically assigning a distribution of apertures in fracture network models.
In many cases, such fracture aperture distribution is observed to follow a power law in naturally fractured reservoirs (Bour and Davy, 1997) and hence, the occurrence of smaller fractures with narrow aperture is more frequent than fractures of longer length with broader aperture (Somogyvari et al., 2017). The fluid flow behavior in each individual fracture element is controlled by the hydraulic aperture and length of the fractures (Bour and Davy, 1997; de Dreuzy et al., 2002; Darcel et al., 2003; Baghbanan and Jing, 2007). Therefore, the characterization of aperture distribution in fracture networks and its effect on flow behaviour is crucial in identifying the dominant fractures that serve as preferential pathways in fracture networks.
This research investigates how aperture distribution affects the connectivity and fluid flow in fractal-fracture networks and whether fractures with smaller apertures contribute significantly in terms of the overall flow recovery. One of the objectives of this study is to aid modellers in their decision-making process on how much of information (data) should be incorporated in building fracture models that are geologically realistic, i.e., the smallest apertures that can be eliminated from models without significantly affecting the flow while being computationally less expensive. In order to meet this objective, dominant sub-networks have been identified that are generated by the elimination of smaller fractures from a parent fractal-fracture network but nonetheless, have very similar fluid recovery to that of the latter. Fractures are assumed to have clean openings, that is, those that have the entire fracture width available for flow. In other words, we consider the hydraulic aperture (Snow, 1969; Neuzil and Tracy, 1981; Barton et al., 1985).
The connectivity and flow behavior of a set of synthetic fractal-fracture networks, both deterministic and random (Roy et al., 2007), and their dominant sub-networks, where apertures scale in accordance to their position in the hierarchy of a fractal model, are studied. A dominant sub-network is obtained by systemically eliminating fractures with smaller aperture from the parent network (Gong and Rossen, 2017). In order to simulate flow, a fracture continuum (FC) model is considered which is similar to those used by Langevin (2003), Neuman (2005), Svensson (2001a, b) and Tsang et al. (1996). Cells in the FC model are assigned porosity and permeability values depending on whether they represent fracture or matrix. A high porosity value is assigned to all the cells that represent fractures. Permeability values of “fracture cells” are computed based on the cubic law (aperture) and there is nearly no matrix porosity or permeability. Trace3D, a Darcy based streamline simulator (Datta-Gupta and King, 2007) is used for modelling fluid flow in the FC models. The concept thus developed, is then applied to a natural fracture map (Odling, 1997) and its dominant sub-network to demonstrate that in case of real data, fractures with smaller apertures may be excluded from the flow model without significantly affecting recovery. The dominant sub-network in this case has been generated from a lower resolution map of original fracture map which captured only the thick and longer fractures.
2.1 Generation of fractal-fracture networks and their dominant sub-networks
Fractal-fracture networks can serve as useful models for quantitative evaluation of heterogeneity and complexity of reservoir rocks. These models can be used to study properties like scaling of fractures, aperture distribution and fracture network geometry that affect the fluid flow behavior in a fracture system (Berkowitz and Hadad, 1997). In this study, fractal-fracture networks are modeled as deterministic and random Sierpinski lattices composed of self-similar segments in two dimensions. These are generated using three parameters: the scale factor, b, the iteration level, i, and the initial number of un-fractured blocks, n (here b=2, i=5 and n=1) as described in Roy et al. (2007). In order to investigate the effect of aperture on fluid flow in such networks, rather than using a constant value, the fracture apertures are assigned a distribution such that they scale in accordance with their hierarchy in the network as described in Eq. (1). It may be noted that there exists a positive correlation between the length of the fractures and their aperture values in this model.
Here, b is the scale factor, wi is the aperture of a fracture segment that was generated at the iteration, i, and, imax is the maximum number of iterations used for generating the entire fractal-fracture network. In this case, b=2 and .
A set of dominant sub-networks (Fig. 1) are generated from a given parent fractal-fracture network by systematically eliminating fractures with smaller apertures from the latter (Gong and Rossen, 2017). This is done in order to test whether fractures with such smaller apertures significantly contribute to the connectivity and flow in such networks. It helps in understanding whether the sub-networks (left after removing the smaller apertures) carry most of the injected fluids. Further, it also addresses the importance of these sub-networks in characterization of flow in fractured reservoirs.

Figure 1(a–c) Deterministic fractal-fracture network (a) and its dominant sub-network-I (b) and dominant sub-network-II (c). (d–f) Random fractal-fracture network (d) and its dominant sub-network-I (e) and dominant sub-network-II (f).
As the dominant sub-networks are obtained by removing fractures with smaller aperture, it is important to keep count of the numbers of fractures eliminated at each step. A MATLAB toolbox, FracPaQ (Healy et al., 2017) is used for this and the results are shown in Fig. 2. Compared to that of the parent fractal-fracture network, the number of fractures decreases by 75 % in dominant sub-network-I and by 85 % in dominant sub-network-II.

Figure 2Number of fracture segments vs. aperture for a fractal-fracture network and its dominant sub-networks-I and -II.
In Fig. 2, it is seen that the parent fractal-fracture network (red bars) consists of apertures of all values, i.e., 100 to 3200 µm. Dominant sub-network-I (green bars) is generated by removing the 100 µm apertures from the parent network and has apertures ranging from 200 to 3200 µm. Dominant sub-network-II (purple bars) is generated by removing both the 100 and 200 µm apertures. It therefore, has apertures ranging from 400 to 3200 µm. Figure 2 is applicable to both deterministic and random fractal-fracture networks as they have the same length and aperture distributions but differ only in the spatial distribution of the fracture segments.
2.2 Connectivity of fractal-fracture networks and their dominant sub-networks
The connectivity of a fracture network is an important factor in determining flow and transport characteristics (Robinson, 1983; Berkowitz and Balberg, 1993; Berkowitz, 1995; de Dreuzy et al., 2002; Sahu and Roy, 2020). Topological graph theory uses the relative abundance of three types of nodes in a fracture network to define the connectivity (Sanderson and Nixon, 2015; Sanderson et al., 2019). These nodes are: X (cross-cutting), Y (abutting) and I (isolated) as shown in Fig. 3. The relative abundance of these different types of nodes in fractal-fracture networks and their respective dominant sub-networks are estimated by FracPaQ, a MATLAB tool box for quantification of fracture patterns from 2D images (Healy et al., 2017).
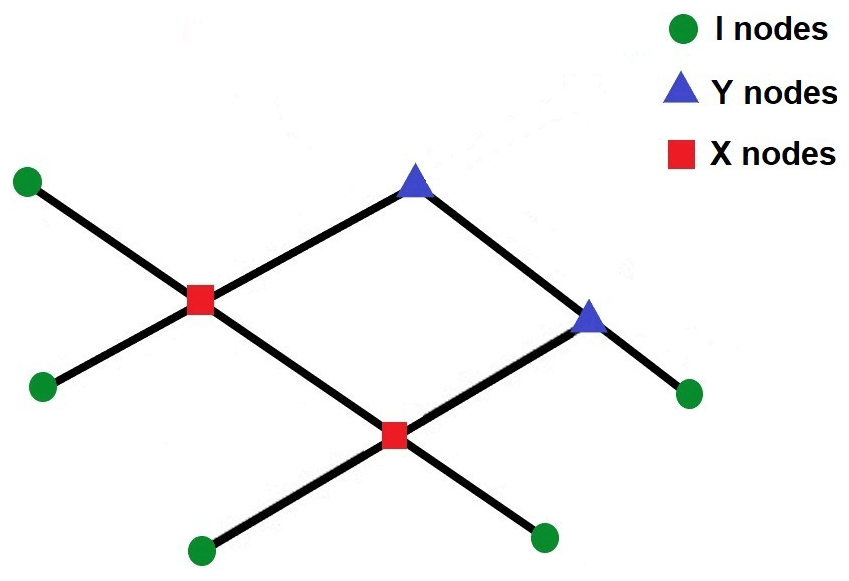
Manzocchi (2002) defines the topological connectivity of fracture networks in terms of a single parameter, n as in Eq. (2):
Here, PI, PY and PX are the proportions of I (isolated) nodes, Y (abutting) nodes and X (crosscutting) nodes respectively. The sum of PI, PY and PX is always equal to 1.
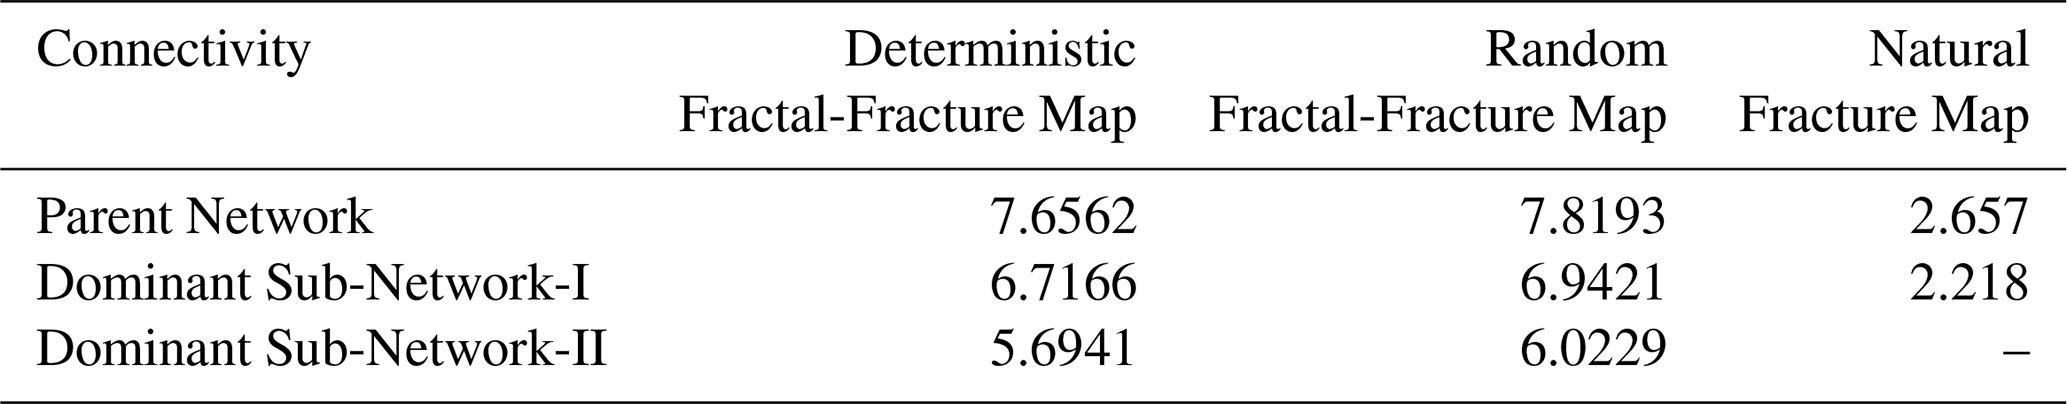
The connectivity values of the deterministic and random fractal-fracture networks and, their respective dominant sub-networks, are shown in Table 1. It is no surprise that the connectivity of the dominant sub-networks decreases because these are generated by eliminating a large number of smaller aperture fractures from the parent network. However, in the case of deterministic network, this decrease is only about 12 % in dominant sub-network-I and 25 % in dominant sub-network-II. For the random fractal-fracture network, it is decreased by 10 % in dominant sub-network-I and 23 % in dominant sub-network-II. It may be noted that the connectivity does not decrease by more than 25 %, even after elimination of a large number of smaller fractures. This is because, elimination of the smaller fractures from a parent fractal-fracture network results in a decrease in all three types of nodes by a similar proportion to what is present in the parent network, thus keeping the proportion of nodes almost same in the resultant, dominant sub-network.
Table 1Connectivity values of different fracture networks and their dominant sub-networks.
2.3 Flow simulation in fractal-fracture networks and their dominant sub-networks
Simulating flow through fracture networks with variable aperture is computationally demanding, especially when it comes to using DFN models (Schwartz and Smith, 1988; Parney and Smith, 1995; Benke and Painter, 2003; Painter and Cvetkovic, 2005; Leung et al., 2012). Fracture continuum (FC) models on the other hand, are computationally efficient while preserving the network details and fracture properties. FC models have been widely used for numerical flow simulations in fractured rocks (Langevin, 2003; Neuman, 2005; Svensson, 2001b; Tsang et al., 1996; McKenna and Reeves, 2006; Botros et al., 2008; Reeves et al., 2008).
In FC models, discrete fractures are modelled as permeability structures on a grid as shown in Fig. 4. In this study, the synthetic fractal-fracture patterns and their dominant sub-networks are modelled as grids of cells, such that each pixel of the network's image (raster data) is represented by a cell. The details of the fracture network are preserved by the use of a very small cell size, while a high permeability contrast between fractures and matrix can restrict the flow only within the former.

Figure 4Illustration of finite difference representation of a hypothetical rock fracture network (modified from Reeves et al., 2008).
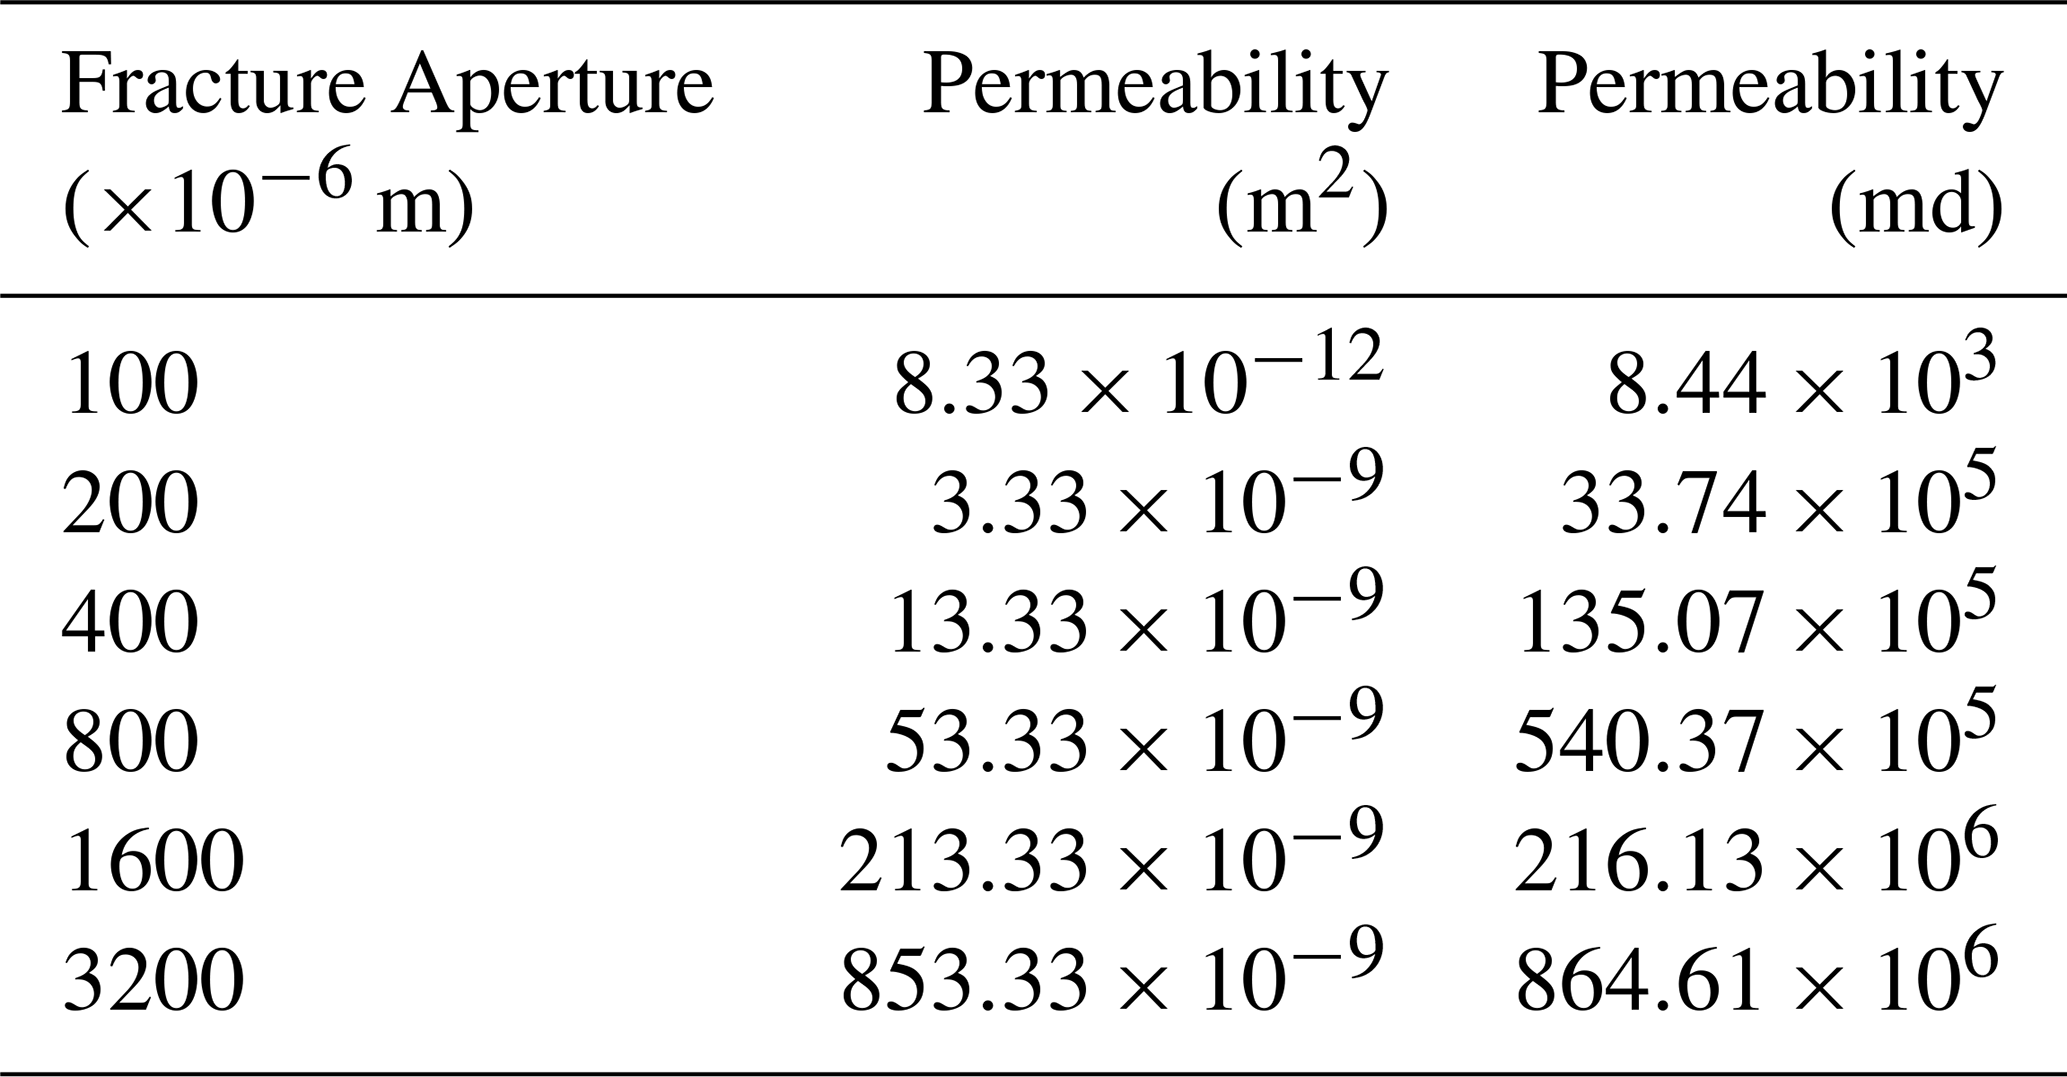
Following the footsteps of Sarkar et al. (2004) the permeability, Kf, of cells representing fractures, is assigned based on the well-known “cubic law” (Snow, 1969) as in Eq. (3):
Here, w is the hydraulic aperture. The values of fracture permeability calculated for given fracture apertures are shown in Table 2. Cells that represent matrix (white cells in Fig. 4) are assigned negligible permeability and porosity such that the flow mainly occurs in the fractures.
The fractal-fracture networks and their respective dominant sub-networks are flow simulated using Trace3D (Dutta-Gupta and King, 2007). It is a streamline simulator which represents fluid flow in a reservoir by implementing Darcy's law and mass conservation equations. In this simulator, approximate changes in pressure and saturation distribution with time are obtained by solving pressure and saturation/conservation equations (Al-Najem et al., 2012). Such an approach is well-suited for the analysis of fluid flow characteristics with recovery curves and time of flights (TOFs) as outputs. The IMPES (implicit pressure explicit saturation) method allows the pressure equations to be solved implicitly, i.e., pressures at all grid nodes are computed simultaneously by solving a system of linear equations at every time step. On the other hand, IMPES computes saturations explicitly, i.e., one grid block at a time without any matrix solution. The solution of the pressure and saturation generates the fluid recovery values and also maps the advancement of fluid front at different time steps represented by TOFs. The details of all the governing equations used in Trace3D can be found in Datta-Gupta and King (2007).
An injection and a production well are placed at diagonally opposite corners of the model grid (i.e., 1×1 and 500×500) to obtain a total areal sweep of the fractured rock volume. Flow simulation is performed at a reservoir pressure of 2480 psia with the assumption of constant boundary reservoir conditions. The fluid injection rate is maintained at 500 bbl/day for a simulation time period of 700 d. The entire fluid volume is considered to be stored in the fractures and therefore, a porosity value of 95 % is assigned to cells that represent fractures. The permeability of “fracture cells” is assigned depending on their apertures as discussed earlier and shown in Table 2. The porosity and permeability of “matrix cells” are assigned as 0.05 % and m2 respectively, such that flow through the matrix is negligible.
Fluid recovery can serve as a parametric estimation of flow characteristics in any fracture network. Figure 5 shows the recovery curves for the deterministic and random fractal-fracture networks and their respective dominant sub-networks. For the deterministic network (solid lines in Fig. 5) it can be seen that the dominant sub-networks are almost indistinguishable from their parent network in terms of recovery. A similar behavior is seen for the random network (dashed lines in Fig. 5), although some differences exist in the dominant sub-networks in this case. This indicates that even though the parent fractal-fracture networks and their dominant sub-networks have very different number of fractures (Fig. 2), they have almost similar fluid flow characteristics. It is also seen from the figure that the response from dominant sub-network-I of the deterministic pattern actually coincides with that of the parent network of the random pattern. As because the random and deterministic patterns have the same length distribution it may be conjectured that the parent fractal-fracture network is very similar to the sub-networks in terms of recovery.
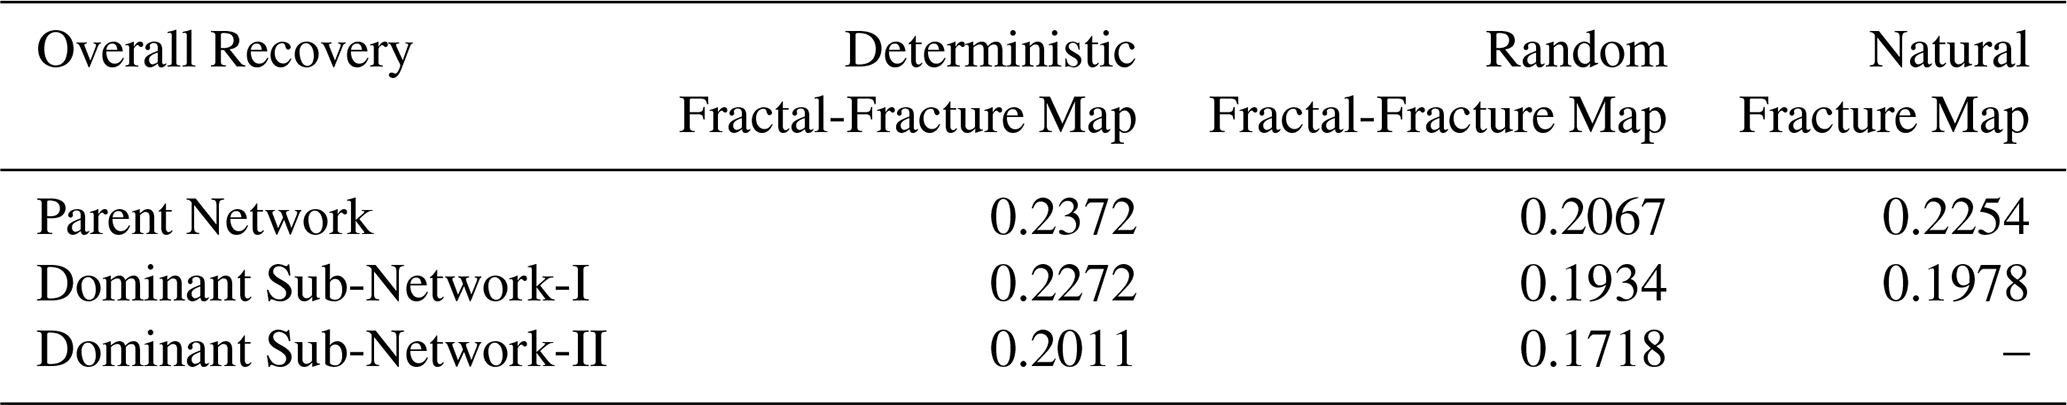
The overall recovery values thus obtained for all fracture networks studied are shown in Table 3. Fluid recovery for dominant sub-network-I is about 96 % and 93 % to that of the parent network for the deterministic and random patterns respectively. In case of dominant sub-network-II, these values are about 85 % and 83 %. Hence, it may be hypothesized that while modelling such fracture networks, eliminating a large number fractures with smaller apertures will not significantly affect the fluid flow.
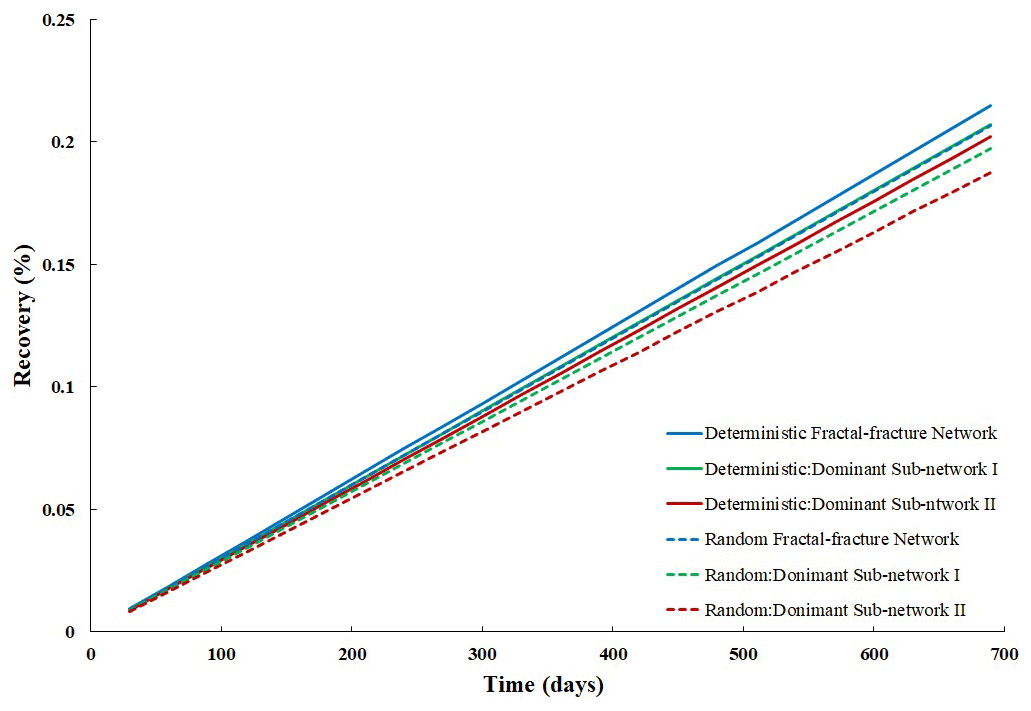
Figure 5Recovery curves of deterministic and random fractal-fracture networks along with their respective dominant sub-networks.
Table 3Overall fluid recovery values of different fracture networks and their dominant sub-networks.
Time of flight (TOF) is an important parameter for visualizing the fluid velocity at a given location within the flow domain. The TOF can be defined as a spatial coordinate representing the distance along streamline to where the reservoir will be contacted at that instance of time. It is worth mentioning that along preferential flow paths, the TOFs show higher resolution as the streamline's tends to cluster along the high permeability streaks. The TOF's depicting fluid-front through the deterministic and random fractal-fracture network along with their dominant sub-networks at different time steps (500, 1500 and 3000) are shown in Fig. 6. It is observed that flow patterns are almost similar for the parent fractal-fracture network and their dominant sub-networks. The TOFs clearly show flow channelling through fractures with larger apertures of the dominant sub-networks in both deterministic and random fractal-fracture networks. It can be visually seen from Fig. 6 that these fractures serve as preferential pathways for conduit of major amount of fluid in the reservoir and is in agreement with the experimental analysis of Neretnieks et al. (1982). The time of flight for fractures with larger apertures are much smaller than those with smaller apertures hence, fluid movements are faster in the former. This results in almost similar recovery in the original fractal-fracture network and its dominant sub-networks which contain only the larger fractures.

Figure 6(a) TOFs at different time periods of deterministic fractal-fracture network (top), its dominant sub-network-I (centre) and -II (bottom). (b) TOFs at different time periods of random fractal-fracture network (top), its dominant sub-network-I (centre) and -II (bottom).
A subset of natural fracture networks is chosen from a set of seven nested fractal-fracture maps gathered from the Devonian Sandstones of Hornelen basin, Norway (Odling, 1997). These maps have been studied by many researchers in relation to the characterization of various statistical and geometrical properties of fracture networks in the last three decades (Bonnet et al., 2001; Bour et al., 2002; Odling and Roden, 1997; Roy et al., 2007, 2010). Hence, they may serve as good outcrop analogs for fractured reservoirs. They cover areas from 18 to 720 m across at a range of resolutions forming a nested series. Each map represents a “window” or sub-sample of the fracture trace population with a lower bound controlled by the resolution and an upper bound controlled by the size of the region observed (Bour et al., 2002; Odling, 1997; Roy et al., 2007). The scale, resolution and the height of observation of these maps along with the mapping technique are described in Odling (1997). We chose map 1 and map 2 from the set such that the latter contains the former but, at a lower resolution as shown in Fig. 7. The aperture of the natural fracture map is scaled considering the trace-length distribution of individual maps which follows a power law (Odling, 1997).

Figure 7Illustration of mapping technique of natural fracture map and its dominant sub-network map (modified from Odling, 1997).
A dominant sub-network of map-1 is generated by considering a smaller section from map-2 that represents map-1 (at a lower resolution) and rotating it to match its orientation with the latter. Thus, the dominant sub-network of map-1 retains only the longer fractures (with large apertures) as the shorter fractures (with smaller apertures) are “lost” due to decrease in resolution. The count of fractures in both the maps is estimated using FracPaQ and the dominant sub-network contains only about 15 % of the fracture segments from the original parent fracture network. The natural fracture network (map-1) and its sub-dominant network are shown in Fig. 8.
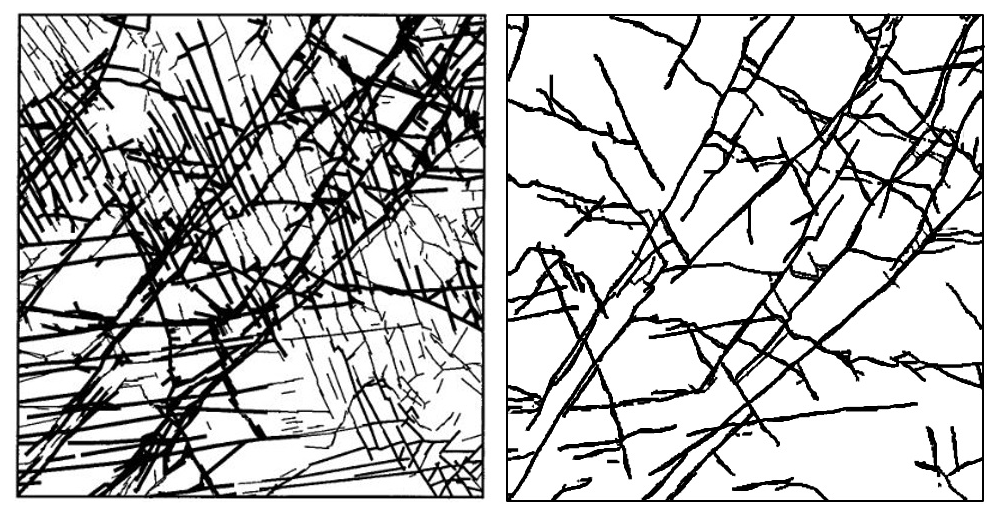
Figure 8Natural fracture map (left) and its dominant sub-network (right) (modified from Odling, 1997).
The proportion of X, Y and I nodes present in the natural fracture map and its dominant sub-network are estimated using FracPaQ and their connectivity values are calculated from Eq. (2). The connectivity of the dominant sub-network is observed to decrease by 15 % of that of its parent fracture map as shown in Table 2. The natural fracture map and its dominant sub-network are modeled as grids of cells invoking the fracture continuum (FC) concept as before. Similar to our approach in Sect. 2.3, the permeability of cells that represent fractures are calculated from the cubic law, and a single high porosity of 95 % is assigned to all cells representing fractures. As with the models, matrix porosity and permeability values are assigned as 0.05 % and m2 respectively, such that flow through the matrix is negligible. The other inputs used in the simulator are also kept the same as mentioned in Sect. 2.3. The fracture maps are flow simulated using Trace3D, with an injection and a production well placed at diagonally opposite corners of the model grid (i.e., 1×1 and 1042×1042). The recovery plots of the natural fracture map and its dominant sub-network are shown in Fig. 9. Their TOFs that represent fluid movement at different time steps (500, 1500 and 3000) are shown in Fig. 10.
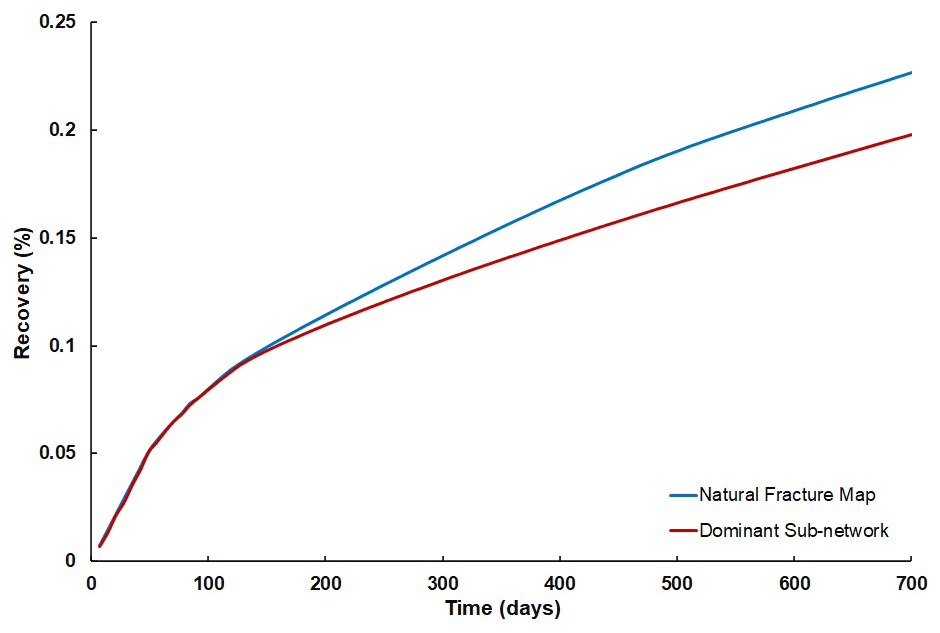
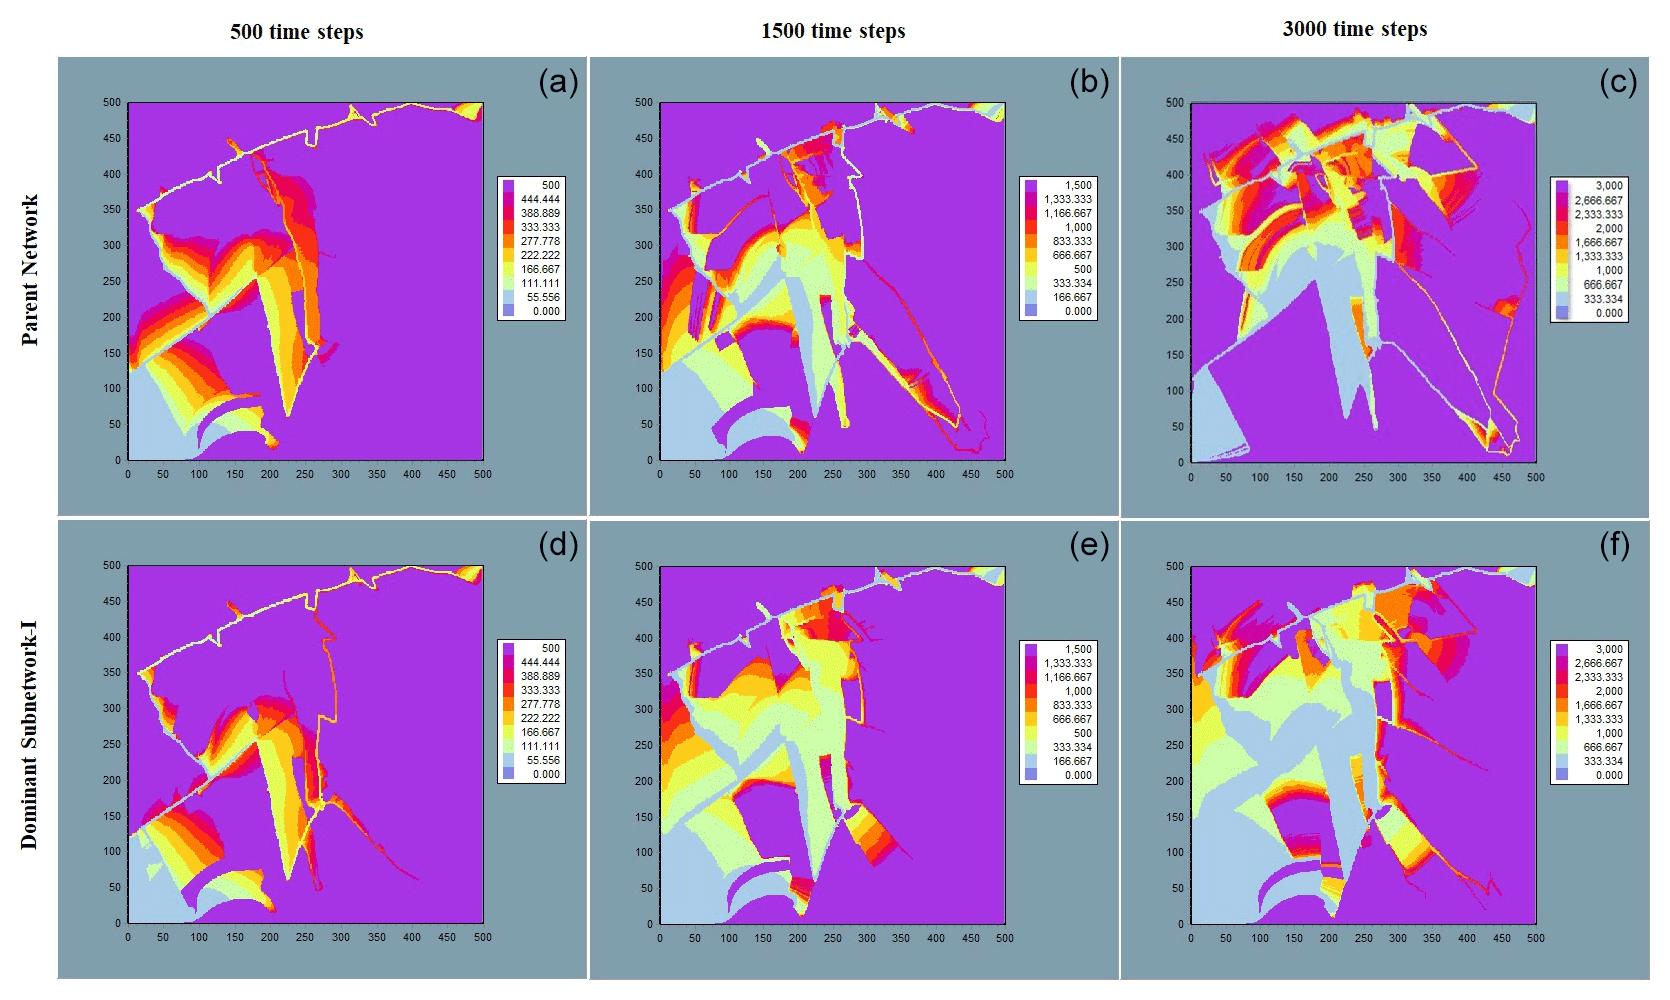
Figure 10TOFs at different time steps (500, 1500 and 3000) of natural fracture map (a–c) and its dominant sub-network (d–f).
The overall recovery values of each of the two maps are shown in Table 3. The fluid recovery value for the dominant sub-network is almost 88 % of that of the original map although the former retains only 15 % of the fractures from that of the latter. This clearly indicates that fractures with smaller aperture have a rather negligible contribution to the overall fluid flow. The TOFs for the natural fracture map and its dominant sub-network show almost no difference at least up to 1500 time steps. Some minor differences are observed between the two networks at 3000 time steps. This shows that the smaller fractures present in the original map (and those that are captured only in high resolution data) actually do not significantly contribute to the flow. From a modelling perspective, this observation is very helpful because geoscientists need not include data on smaller fractures in their models as they do not significantly affect the connectivity and overall fluid recovery.
The influence of aperture distribution on connectivity and fluid flow in fractal-fracture networks has been explored by studying a set of model networks, a natural map and their respective dominant sub-networks. Although the dominant sub-networks were generated by removing a large number of smaller aperture fractures from the parent networks, the connectivity was observed to decrease only by about 10 %–25 %. The networks were then flow simulated in Trace3D invoking the FC model. It was seen that in networks with a broad distribution of aperture, most of the fractures with smaller apertures can be eliminated without any significant reduction of overall fluid recovery. This is because dominant subnetworks containing only about 15 % of the total fracture segments from their respective parent networks yielded recovery values nearly 85 % of that of the latter.
The same strategy was applied to a natural fracture map where smaller fractures were removed by comparing it to its lower-resolution version such that only the long and wide fractures that appeared in the latter were retained. Here, the connectivity and fluid recovery of the dominant sub-network map was found to be around 84 % and 88 % of the parent network respectively. Thus, the results from this experiment proved to be very similar to what was obtained from the study of model fractal-fracture networks. It may therefore be concluded that even in a well-connected fracture network, fluid flow may be unequally distributed based on the aperture distribution and most of the network can be excluded, 85% in this particular case, without significantly affecting its fluid recovery.
In terms of decision making, this result will aid geoscientists in eliminating smaller fractures from the data that do not contribute significantly to the flow thus, building fracture models that are computationally less expensive. The implications of this finding for characterization of fractured rock mass can prove useful in primary as well as enhanced methods of fluid recovery, where the dominant sub-network fractures are the one that carry most of the produced and injected fluids as the larger aperture fractures provide preferential pathways for fluid flow.
The two open-source softwares used in this research can be downloaded, TRACE3D: https://mceri.engr.tamu.edu/software.html (Department of Petroleum Engineering et al., 2021), FracPaQ: https://www.fracpaq.com/download.html (Healy and Rizzo, 2021).
The fractal-fracture maps and natural maps analysed in this research can be directly downloaded from the figures enclosed with the article.
AKS implemented the workflow and carried out the simulation cases. AR provided ideas for the case design and all critical suggestions also reviewed the final work. All authors contributed to writing the paper.
The contact author has declared that neither they nor their co-author has any competing interests.
Publisher’s note: Copernicus Publications remains neutral with regard to jurisdictional claims in published maps and institutional affiliations.
This article is part of the special issue “European Geosciences Union General Assembly 2021, EGU Division Energy, Resources & Environment (ERE)”. It is a result of the EGU General Assembly 2021, 19–30 April 2021.
The authors would like to acknowledge IIT Kharagpur for funding the Quantitative Fractured Reservoir Research Initiative Lab (QFRRI), a facility that was used for carrying out the entire research work. We express our heartfelt thanks to Akhil Datta Gupta who personally helped us learn Trace3D in our lab during his visit to IIT Kharagpur. In addition, Dave Healy is also thanked for developing and providing FracPaQ as an open-source MATLAB toolbox that was also used in this research. Ankur Roy would like to acknowledge Noelle Odling for kindly providing the original encapsulated postscript files of the Hornelen fracture maps which have been used in our analysis in Sect. 4. We also acknowledge contributions from Mauro Cacace and one anonymous reviewer in terms of evaluating the manuscript whose suggestions helped us in focusing on our most substantive results.
This paper was edited by Michael Kühn and reviewed by Mauro Cacace and one anonymous referee.
Al-Najem, A. A., Siddiqui, S., Soliman, M., and Yuen, B.: Streamline Simulation Technology: Evolution and Recent Trends, Society Petrol. Eng. J., SPE-160894-MS, https://doi.org/10.2118/160894-MS, 2012.
Baghbanan, A. and Jing, L.: Hydraulic properties of fractured rock masses with correlated fracture length and aperture, Int. J. Rock Mech. Min., 44, 704–719, https://doi.org/10.1016/j.ijrmms.2006.11.001, 2007.
Barton, N., Bandis, S., and Bakhtar K.: Strength, Deformation and Conductivity Coupling of Rock Joints, Int. J. Rock Mech. Min., 22, 121–140, https://doi.org/10.1016/0148-9062(85)93227-9, 1985.
Benke, R. and Painter, S.: Modeling conservative tracer transport in fracture networks with a hybrid approach based on the Boltzmann transport equation, Water Resour. Res., 39, 1324, https://doi.org/10.1029/2003WR001966, 2003.
Berkowitz, B.: Analysis of fracture network connectivity using percolation theory, Math Geol., 27, 467–483, https://doi.org/10.1007/BF02084422, 1995.
Berkowitz, B.: Characterizing flow and transport in fractured geological media: a review, Adv Water Res., 25, 861–884, https://doi.org/10.1016/S0309-1708(02)00042-8, 2002.
Berkowitz, B. and Balberg, I.: Percolation theory and its application to groundwater hydrology, Water Resour. Res., 29, 775–794, https://doi.org/10.1029/92WR02707, 1993.
Berkowitz, B. and Hadad, A.: Fractal and multifractal measures of natural and synthetic fracture networks, J. Geophys. Res., 102, 12205–12218, https://doi.org/10.1029/97JB00304, 1997.
Bonnet, E., Bour, O., Odling, N. E., Davy, P., Main, I., Cowie, P., and Berkowitz, B.: Scaling of fracture system in geological media, Rev. Geophys., 39, 347–383, https://doi.org/10.1029/1999RG000074, 2001.
Botros, F., Hassan, A., Reeves, D., and Pohll, G.: On mapping fracture networks onto continuum, Water Resour. Res., 44, W08435, https://doi.org/10.1029/2007WR006092, 2008.
Bour, O. and Davy, P.: Connectivity of random fault networks following a power law fault length distribution, Water Resour. Res., 33, 1567–1583, https://doi.org/10.1029/96WR00433, 1997.
Bour, O., Davy, P., Darcel, C., and Odling, N. E: A statistical scaling model for fracture network geometry, with validation on a multiscale mapping of a joint network (Hornelen Basin, Norway), J. Geophys. Res., 107, ETG 4-1–ETG 4-12, https://doi.org/10.1029/2001JB000176, 2002.
Cacas, M. C., Ledoux, E., de Marsily, Tillie, G. B., Barbreau, A., Durand, E., Feuga, B., and Peaudecerf, P.: Modeling fracture flow with a stochastic discrete fracture network: calibration and validation: 1. The flow model, Water Resour. Res., 26, 479–489, https://doi.org/10.1029/WR026i003p00479, 1990a.
Cacas, M. C., Ledoux, E., de Marsily, G., Barbreau, A., Calmels, P., Gaillard, B., and Margritta, R.: Modeling fracture flow with a stochastic discrete fracture network: calibration and validation: 2. The Transport Model, Water Resour. Res., 26, 491–500, https://doi.org/10.1029/WR026i003p00491, 1990b.
Chen, T.: Equivalent Permeability Distribution for Fractured Porous Rocks: The Influence of Fracture Network Properties, Geofluids, 2020, 6751349, https://doi.org/10.1155/2020/6751349, 2020.
Darcel, C., Bour, O., Davy, P., and de Dreuzy, J. R.: Connectivity properties of two-dimensional fracture networks with stochastic fractal correlation, Water Resour. Res., 39, 1272, https://doi.org/10.1029/2002WR001628, 2003.
Datta-Gupta, A. and King, M. J.: Streamline Simulation: Theory and Practice, Textbook Series 11, ISBN 978-1-55563-111-6, Society of Petroleum Engineers, Richardson, TX, 2007.
de Dreuzy, J. R., Davy, P., and Bour, O.: Hydraulic properties of two-dimensional random fracture networks following power law distributions of length and aperture, Water Resour. Res., 38, 1–9, https://doi.org/10.1029/2001WR001009, 2002.
Department of Petroleum Engineering, Dwight Look College of Engineering, and Texas A&M University: Model Calibration and Efficient Reservoir Imaging (MCERI), TRACE3D, available at: https://mceri.engr.tamu.edu/software.html, last access: 11 November 2021.
Gong, J. and Rossen, W. R.: Modeling flow in naturally fractured reservoirs: effect of fracture aperture distribution on dominant sub-network for flow, Pet. Sci., 14, 138–154, https://doi.org/10.1007/s12182-016-0132-3, 2017.
Hardebol, N. J., Maier, C., Nick, H., Geiger, S., Bertotti, G., and Boro, H.: Multiscale fracture network characterization and impact on flow: A case study on the Latemar carbonate platform, J. Geophys. Res.-Sol. Ea., 120, 12, 8197–8222, https://doi.org/10.1002/2015JB011879, 2015.
Healy, D. and Rizzo, R.: FracPaQ – Fracture Pattern Quantification, available at: https://www.fracpaq.com/download.html, last access: 11 November 2021.
Healy, D., Rizzo, R. E., Cornwell, D. G., Farrell, N. J. C., Watkins, H., Timms, N. E., Gomez-Rivas, E., and Smith, M.: FracPaQ: A MATLAB™ toolbox for the quantification of fracture patterns, J. Struct. Geol., 95, 1–16, https://doi.org/10.1016/j.jsg.2016.12.003, 2017.
Kaulatilake, P. H. S. W., Park, J., Balasingam, P., and Morgan, R.: Natural rock joint roughness quantification through fractal techniques, Geotechnical and Geological Engineering, 24, 1181–1202, https://doi.org/10.1007/s10706-005-1219-6, 2006.
Klepikova, M. V., Borgne, L. T., Boura, O., Gallagher, K., Hochreutener, R., and Lavenant, N.: Passive temperature tomography experiments to characterize transmissivity and connectivity of preferential flow paths in fractured media, J. Hydrol., 512, 549–562, https://doi.org/10.1016/j.jhydrol.2014.03.018, 2014.
Langevin, C. D.: Stochastic ground water flow simulation with a fracture zone continuum model, Ground Water, 41, 587–601, https://doi.org/10.1111/j.1745-6584.2003.tb02397.x, 2003.
Leung, C. T. O., Hoch, A. R., and Zimmerman, R. W.: Comparison of discrete fracture network and equivalent continuum simulations of fluid flow through two-dimensional fracture networks for the DECOVALEX2011 project, Mineral. Mag., 76, 3179–3190, https://doi.org/10.1180/minmag.2012.076.8.31, 2012.
Manzocchi, T.: The connectivity of two-dimensional networks of spatially correlated fractures, Water Resour. Res., 38, 1162, https://doi.org/10.1029/2000WR000180, 2002.
McKenna, S. A. and Reeves, P. C.: Fractured continuum approach to stochastic permeability modelling, in: Stochastic modelling and geo-statistics: principles, methods and case studies, edited by: Coburn, T. C., Yarus, J. M., and Chambers, R. L., Vol. II, AAPG Comput. Appl. Geol. 5. AAPG, Tulsa, Okla, 173–186, 2006.
Min, K. B., Jing, L., and Stephansson, O.: Determining the equivalent permeability tensor for fractured rock masses using a stochastic REV approach: method and application to the field data from Sellafield, UK, Hydrogeol. J., 12, 497–510, https://doi.org/10.1007/s10040-004-0331-7, 2004.
Neretnieks, I., Eriksen, T., and Tahtinen, P.: Tracer movement in a single fissure in granitic rock – some experimental results and their interpretation, Water Resour. Res., 18, 849–858, https://doi.org/10.1029/WR018i004p00849, 1982.
Neuman, S. P.: Trends, prospects and challenges in quantifying flow and transport through fractured rocks, Hydrogeol. J., 13, 124–147, https://doi.org/10.1007/s10040-004-0397-2, 2005.
Neuzil, C. E. and Tracy, J. V.: Flow Through Fractures, Water Resour. Res., 17, 192–199, https://doi.org/10.1029/WR017i001p00191, 1981.
Odling, N. E.: Scaling and connectivity of joint systems in sandstones from western Norway, J. Struct. Geol., 19, 1257–1271, https://doi.org/10.1016/S0191-8141(97)00041-2, 1997.
Odling, N. E. and Roden, J. E.: Contaminant transport in fractured rocks with significant matrix permeability, using natural fracture geometries, J. Contam. Hydrol., 27, 263–283, https://doi.org/10.1016/S0169-7722(96)00096-4, 1997.
Painter, S. and Cvetkovic, V.: Upscaling discrete fracture network simulations: An alternative to continuum transport models, Water Resour. Res., 41, W02002, https://doi.org/10.1029/2004WR003682, 2005.
Parney, R. W. and Smith, L.: Fluid velocity and path length in fractured media, Geophys. Res. Lett., 22, 1437–1440, https://doi.org/10.1029/95gl01494, 1995.
Reeves, D. M., Benson, D. A., and Meerschaert, M. M.: Transport of conservative solutes in simulated fracture networks: 1. Synthetic data generation, Water Resour. Res., 44, W05404, https://doi.org/10.1029/2007WR006069, 2008.
Robinson, P.: Connectivity of fracture systems: a percolation theory approach, J. Phys. A, 16, 605, https://doi.org/10.1088/0305-4470/16/3/020, 1983.
Roy, A., Perfect, E., Dunne, W. M., and McKay, L. D.: Fractal characterization of fracture networks: An improved box-counting technique, J. Geophys. Res., 112, B12201, https://doi.org/10.1029/2006JB004582, 2007.
Roy, A., Perfect, E., Dunne, W. M., Odling, N., and Kim, J. W.: Lacunarity analysis of fracture networks: Evidence for scale-dependent clustering, J. Struct. Geol., 32, 1444–1449, https://doi.org/10.1142/S0218348X14400039, 2010.
Sahu, A. K. and Roy, A.: Clustering, Connectivity and Flow Responses of Deterministic Fractal-Fracture Networks, Adv. Geosci., 54, 149–156, https://doi.org/10.5194/adgeo-54-149-2020, 2020.
Sanderson, J. D. and Nixon, W. C.: Topology, connectivity and percolation in fracture networks, J. Struct. Geol., 115, 167–177, https://doi.org/10.1016/j.jsg.2018.07.011, 2015.
Sanderson, D. J., Peacock, D. C., Nixon, C. W., and Rotevatn, A.: Graph theory and the analysis of fracture networks, J. Struct. Geol., 125, 155–165., https://doi.org/10.1016/j.jsg.2018.04.011, 2019.
Sarkar, S., Toksoz, M. N., and Burns, D. R.: Fluid flow modeling in fractures, Massachusetts Institute of Technology, Earth Resources Laboratory, Cambridge, MA, USA, Corpus ID: 14317982, 2004.
Snow, D. T.: Anisotropic Permeability of Fractured Media, Water Resour. Res., 5, 1273–1289, https://doi.org/10.1029/WR005i006p01273, 1969.
Somogyvári, M., Jalali, M., Parras, S. J., and Bayer, P.: Synthetic fracture network characterization with transdimensional inversion, Water Resour. Res., 53.3, 5104–5123, https://doi.org/10.1002/2016WR020293, 2017.
Svensson, U.: A continuum representation of fracture networks. Part I: method and basic test cases, J. Hydrol., 250, 170–186, https://doi.org/10.1016/S0022-1694(01)00435-8, 2001a.
Svensson, U.: A continuum representation of fracture networks. Part II: application to the Äspö Hard Rock laboratory, J. Hydrol., 250, 187–205, https://doi.org/10.1016/S0022-1694(01)00436-X, 2001b.
Schwartz, F. W. and Smith, L.: A continuum approach for modeling mass transport in fractured media, Water Resour. Res., 24, 1360–1372, https://doi.org/10.1029/WR024i008p01360, 1988.
Tsang, Y. W., Tsang, C. F., Hale, F. V., and Dverstorp, B.: Tracer transport in a stochastic continuum model of fractured media, Water Resour. Res., 32, 3077–3092, https://doi.org/10.1029/96WR01397, 1996.
- Abstract
- Introduction
- Method Development
- Results and Discussion: Synthetic Fractal-Fracture Networks
- Application to Natural Fracture Networks
- Concluding Remarks
- Code availability
- Data availability
- Author contributions
- Competing interests
- Disclaimer
- Special issue statement
- Acknowledgements
- Review statement
- References