 | 31 Mar 2021
Interactions between the calcium scaling inhibitor NC47.1 B, geothermal fluids, and microorganisms – results of in situ monitoring in the Bavarian Molasse Basin (Germany) and accompanying laboratory experiments
Christoph Otten
Beate Dassler
Sebastian Teitz
Joy Iannotta
Florian Eichinger
Andrea Seibt
Dietmar Kuhn
Hilke Würdemann
Application of the environmentally friendly scaling inhibitor NC47.1 B in geothermal systems was studied in laboratory and field-scale experiments. Biodegradation was investigated under anaerobic, in situ-like conditions and a mass balance confirmed the almost complete conversion of the polycarboxylate to e.g. acetate, formate, methane and CO2. Much higher concentrations of inhibitor were chosen than applied in situ and rapid degradation was observed in biofilm-inoculated setups: A concentration of 100 mg/L of the inhibitor was degraded below detection limit within 8 d of incubation. Furthermore, the inhibitor was applied at the geothermal plant in Unterhaching, Germany. Monitoring of the microbial community in situ showed an increase in the abundance of Bacteria. Particularly, relatives of the fermenting Caldicellulosiruptor dominated the biocenosis after about six months of continuous inhibitor dosage (5–10 mg/L). However, in long-term laboratory experiments representatives of Caldicellulosiruptor were only detected in traces and the microbial community comprised a broader spectrum of fermentative bacteria. The different composition of the biocenosis in situ and in laboratory experiments is probably caused by the different inhibitor concentrations, temperatures as well as nutrient availability in situ compared to the closed system of the batch experiments.
- Article
(669 KB) - Full-text XML
- BibTeX
- EndNote


The sustainable development of the renewable energy sector is a key challenge of our time. While new legislation and regulations are intended to encourage energy savings, profound changes in energy generation take place as well. The energy mix in the Federal Republic of Germany is expected to change in favor of renewable energy sources over the next few decades (Henning and Palzer, 2014). This also applies to thermal energy generation and energy-storage systems for power and district heat production and may play a key role as a significant source of base-load energy (Moeck and Kuceklkorn, 2015). Geothermal energy generation as well as thermal energy storage are already successfully implemented in geothermal active regions such as the southern German Molasse Basin, The Upper Rhine Valley or the North German Basin. Depending on the characteristics of the utilized deep aquifer, the operators of those plants are confronted with a number of challenges.
Corrosion on plant installations as well as mineral precipitation in the underground and surface closed-loop installations, including the electric submersible pump, rising pipes, filters and heat exchangers can impair the operation of geothermal plants (Würdemann et al., 2016), which lowers the operational availability and e.g. the heat transfer capacity and therefore cause expensive losses of efficiency and triggers downtimes. In the geothermal plant in Unterhaching (Molasse Basin), calcite scaling is particularly challenging, impeding a regular operation, similar to what was observed in neighboring plants (Wanner et al., 2017). As a counteraction the scaling inhibitor NC47.1 B (produced by Niederrhein Chemie) has been applied to prevent those scaling. Many of the commonly used scaling inhibitors are difficult to biodegrade (Hasson et al., 2011; Harris, 2011). Polycarboxylates in particular tend to be extremely stable and degrade very slowly in a natural environment. Even if acute toxicity is estimated to be relatively low, environmental accumulation may have undesirable consequences. A prerequisite for the magisterial approval of the use of scaling inhibitors in the Bavarian Molasse Basin is their limited environmental impact. As part of a research project, the scaling inhibitor NC47.1 B was therefore developed, which, thanks to its biodegradability, meets the strict environmental requirements (Lerm et al., 2015).
The scaling inhibitor NC47.1 B is a comb polymer with polycarboxylate side chains. It prevents the formation of crystal nuclei mainly via a threshold effect (Sieben and Niederrhein Chemie GmbH, 2016). The spine structure consists of a polysaccharide, which makes the molecule accessible for biodegradation.
In the absence of oxygen and other terminal electron acceptors, complex organic molecules are degraded by fermentative bacteria to short-chain organic acids, alcohols as well as carbon dioxide and hydrogen. Sulfate-reducing bacteria (SRB) oxidize fermentation products such as lactate and acetate to gain energy, thereby reducing sulfate to sulfide. In addition, sulfate reducers can also use hydrogen to reduce sulfate (Cypionka, 2010). If sulfate availability is limited, methanogenic archaea utilize products of fermentation such as acetate to produce methane and carbon dioxide (acetoclastic methanogenesis) or form methane from hydrogen and carbon dioxide (Schink, 1997). Methanogenesis and the relative abundance of methanogenic archaea were observed to sharply increase once sulfate is depleted below a threshold of 3 mg/L (Winfrey and Ward, 1983; Flynn et al., 2013).
Degradation experiments were carried out to study the effects of inhibitor addition on the microbial behavior under in situ-like conditions. However, to enhance the effect of inhibitor addition on the microbial biocenosis and to stimulate degradation, significantly higher inhibitor concentrations were used for the laboratory studies (100–1200 mg/L) than in the field application (5–10 mg/L). The decrease of the inhibitor concentration as well as the degradation products were observed over time and changes in the microbial biocenosis were characterized with microbiome profiling and qPCR at the end of the experiment. Long-term fluid monitoring at the geothermal plant was conducted to investigate the effects on fluid chemistry and to observe changes in the abundance and composition of the microbial community due to the addition of the inhibitor in situ. These investigations are important to understand the degradation of the added inhibitor in situ and this knowledge is a prerequisite to model inhibitor distribution in the aquifer.
2.1 Description of the Geothermal plant Unterhaching
The geothermal plant Unterhaching is located south of Munich (Germany, Molasse Basin). The plant has been in operation since 2007 and consists of one production well and one injection well. Fluid is produced with an average flow rate of 100–120 L/s and a temperature of 122 ∘C from 3350 m depth and used for district heating. Depending on the heat demand the temperature is reduced in the heat exchanger to about 50–122 ∘C. The fluid is then transferred in 3.6 km of pipes to the injection well. To minimize degassing of CO2 from the thermal water circuit, the pressure is maintained at 9 to 10 bar. However, calcite scaling deposits in the thermal water circuit were evident during power plant operation. For this reason, the inhibitor NC47.1 B has been injected into the thermal water circuit since 2017 at the wellhead (production well). The thermal water can be characterized as intermediate mineralized Na-HCO3-Cl type water with average concentrations of 3.6 mg/L DOC. The fluid had a pH of 6.3–6.4 at the well head and the plant exit at the beginning of inhibitor addition. The sulfate concentration in fluids was about 27 mg/L and showed no significant difference between the production well and plant exit.
2.2 Laboratory Experiments
2.2.1 Long-term degradation experiment
After 401 d of inhibitor dosage fluid from the geothermal plant Unterhaching was sampled at the plant exit (after the heat exchanger) and filled into sterilized 1 L glass flasks (800 mL each) under anaerobic conditions. A mild steel coupon (100 mm × 25 mm × 3 mm, mounting hole of 9 mm diameter) was added. For the degradation tests, batches with different inhibitor concentrations were prepared (120–1200 mg/L). The carbon content of the inhibitor was determined at 11.1 % by DOC. In addition, 280 g analogue rock (Frankendolomit) was added to each of the degradation tests. Batches without rock and non-inoculated batches were carried out as references as follows: One batch with reservoir fluid (inhibitor concentration of 600 mg/L) was not additionally inoculated to study the effect of biofilm and coupon addition. In another reference batch a non-inoculated mild steel coupon was installed. Two more batches without rock and inhibitor were conducted to survey microbial activity of the fluid. One of these two batches contained a non-inoculated mild steel coupon.
The batches were inoculated with biofilm precultured on steel coupons in preliminary experiments. The precultures were incubated for 154 d in reservoir fluids with different concentrations of inhibitor (120 and 1200 mg/L) at 40 ∘C and N2-atmosphere. The preculture was inoculated with organic precipitations collected with an endoscope from a pipe section of the heat exchanger in the Unterhaching plant and stored in reservoir fluids at 4 ∘C for 4 d before inoculation. Until sampling the heat exchanger was exposed to reservoir fluids with inhibitor for 251 d. The precipitations were of rubbery texture and characterized with Scanning Electron Microscopy and Energy Dispersion Spectroscopy as organic material (C-Ca dominated). About 1 cm2 of the biofilm from the preculture was smeared on steel coupons. The batches were flushed with 5 L of nitrogen and incubated at 40 ∘C for 12 months (355 d).
2.2.2 Short-term degradation experiment
400 mL fluid from the geothermal plant Unterhaching sampled at day 707 at the plant exit (after the heat exchanger) was filled into sterilized 500 mL glass flasks under anaerobic conditions. 100 g of rock were added (see above). The inhibitor was adjusted to final concentrations of 100 mg/L (8 batches) or 500 mg/L (4 batches). Mild steel coupons were added (see above). The coupons were inoculated with biofilm from the long-term experiment (1200 mg/L-batch). Four batches with 100 mg/L were left without coupon. The batches were flushed with 3 L of nitrogen and incubated at 40 ∘C for 87 d.
As a negative control a sterilized batch with 500 mg/L inhibitor, fluid (both sterile-filtered), mild steel coupon (dry heat sterilization), and rocks (autoclaved and dried) was conducted under the same conditions.
2.2.3 Gaseous phase analysis
500 µL of gas was taken from the headspace of the test setups and analysed with a gas chromatograph 8610C (SRI Instruments) with a silica gel column coupled to a molsieve column (5A, 1.8 m). Argon was used as carrier gas with a flow rate of 12 mL/min. After 8.5 min at 40 ∘C the sequence of the columns was switched and the temperature risen with 20 ∘C/min to 160 ∘C. He, H2, O2, N2 CH4, and CO2 were detected with a thermal conductivity detector. Concentrations (vol.%) were calculated as relative values of the sum of all measured gases with the help of calibration gases. Concentrations were converted to amounts using the ideal gas equation.
2.2.4 Organic acids analysis
500 µL of fluid was taken from the flask and diluted (1:10) in pure water. The analysis was carried out by ion chromatography on a Metrohm 930 Compact IC Flex device with an electrical conductivity detector. The Metrosep A Supp 7-150/4.0 column was used with the standard eluent for this column at 45 ∘C and a flow of 0.7 mL/min.
2.2.5 Inhibitor concentration
50 µL of fluid was placed in 850 µL of phosphate buffer (pH 7, 100 mmol/L). 30 µL of a 1 mmol/L dye solution (pinacyanol chloride) was added. The measurement was carried out by UV/VIS spectroscopy at 550 nm. The UV/VIS method uses the metachromatic properties of certain dyes, which change color while interacting with charged polymer chains. This way, the inhibitor can be quantified on the basis of its active component and fragments from an incomplete degradation of the polymer are also determined. However, the low accuracy at low analyte concentrations (<10 mg/L) is disadvantageous. This method is therefore not suitable for trace analyses. For inhibitor monitoring under application conditions an HPLC (high-performance liquid chromatography) method was established. The sample to be analyzed is evaporated and acetic acid (catalyst), acetonitrile as solvent and the derivatizing reagent FMOC-hydrazine (fluorescent marker) are added to a defined volume and the inhibitor is quantified by means of HPLC with FLD (fluorescence detector). Due to the separation on the column, complete molecules and molecular fragments from the degradation are recorded separately.
2.2.6 DNA Extraction and Quantification
The DNA was isolated from the fluid or the biofilm of the coupon surface with the FastDNA® Spin Kit for Soil (MP Biomedicals) according to the manufacturer protocol with slight modifications (30 min shaking before fast prep step) and subsequent purification with the GeneJet PCR Purification Kit (Thermo Scientific). Blanc controls were extracted to calculate sample specific detection limits. DNA was amplified by qPCR for absolute quantification with StepOnePlus™ Real Time PCR System (Applied Biosystems) and qTower 2.0 (Analytik Jena). As standard for absolute quantification of Bacteria a plasmid with the 27F/1492R-PCR fragment cloned into E.coli JM109 was used. As standards for absolute quantification of sulfate-reducing bacteria and methanogenic archaea PCR fragments with primers 1F/4R (Wagner et al., 1998) of the DSMZ strain 3669 (Desulfallas geothermicus) and 340F/1000R (Øvreås et al., 1997; Gantner et al., 2011) of the DSMZ strain 800 (Methanosarcina barkeri), respectively, were used. The 16S rRNA gene of Bacteria was amplified with the primers 331F and 797R (Nadkarni et al., 2002), the 16S rRNA gene of methanogenic archaea was amplified with the primers 348F and 786R (Sawayama et al., 2006) and the dsrA gene with dsr-1F and dsr-500r (Wilms et al., 2007) and SensiFast™ SYBR No-ROX Kit (Bioline). Analyses were performed in triplicates. The following temperature profiles were used: 2 min 95 ∘C, 5 s 95 ∘C, 10 s 57 ∘C (Bacteria) or 61 ∘C (Archaea) or 60 ∘C (dsrA) and 20 s 72 ∘C (Bacteria and Archaea) or 25 s 72 ∘C (dsrA). The melting curve was also analysed and the efficiency of the reaction was determined.
2.2.7 Microbiome analysis
The microbiome analyses were carried out by Eurofins Genomics Germany GmbH (Microbiome profiling INVIEW 3.0). The 16S rRNA gene of Bacteria was amplified with forward and reverse primers for the V3V5 region (5'-CCTACGGGNGGCWGCAG-3' and 5'-GGGTTGCGCTCGTTGCGGG-3' or 5'-CCGYCAATTYMTTTRAGTTT-3' (Klindworth et al., 2013; Quince et al., 2011; Sacchi et al., 2002). Archaea were amplified with forward and reverse primers for the 16S rRNA gene (5'-CCCTAYGGGGYGCASCAG-3' and 5'-GAGARGWRGTGCATGGCC-3' or 5'-GGACTACNVGGGTWTCTAAT-3' (Gantner et al., 2011, Apprill et al., 2015) Bacteria which could not be assigned to the genus level are summarized as unclassified. Bacteria with a relative abundance of less than 1.5 % in a sample were assigned to low abundant.
2.2.8 Dissolved organic carbon (DOC)
The DOC (as a sum parameter for the dissolved organic compounds) was measured by Hydroisotop GmbH on a TOC-VCSH device (Shimadzu, Duisburg, Germany). The procedure was performed according to DIN EN 1484-H3 (1997).
3.1 Anaerobic degradation of the scaling inhibitor in batch experiments – long-term experiment
Several experiments were performed to test the biodegradability of the inhibitor in an anaerobic environment. The long-term experiment was started with various concentrations of inhibitor (120–1200 mg/L). The inhibitor concentrations were up to 240 times higher than the 5 to 10 mg/L value used in situ. Much higher concentrations for the batches were chosen to enhance the biological degradation as well as to set up long-term experiments and to avoid reaching the detection limit of the UV/Vis inhibitor analysis. The experimental batches were inoculated with biofilm from two different precultures (see Sect. 2) to better simulate the in situ degradation within the plant biofilms.
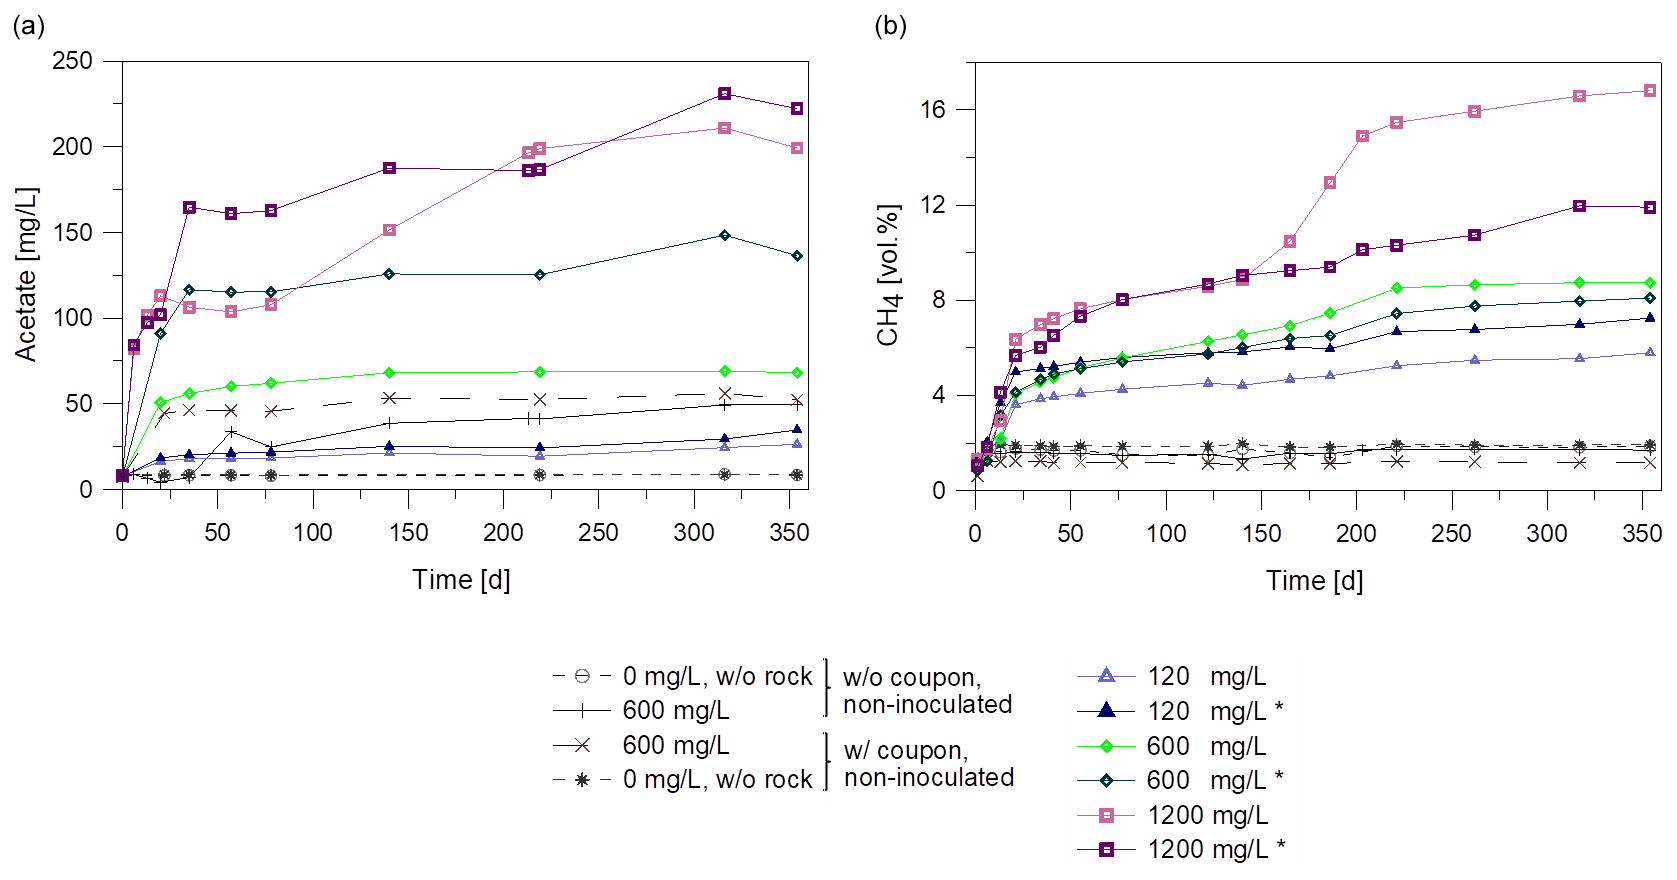
Figure 1(a) Formation of acetate and (b) of methane over time during microbial degradation of the inhibitor with different initial concentrations (120 to 1200 mg/L) in batch experiments. All batches contained rocks and were inoculated with biofilm except two batches without (w/o) rock and four non-inoculated batches. Batches marked with asterisk (*) were inoculated with the 120 mg/L inhibitor preculture. Others were inoculated with 1200 mg/L preculture. Two of the non-inoculated control batches contained a coupon (w/ = with) to observe steel-dependent changes.
Metabolic products were monitored over the duration of the experiment. Gas and fluid were sampled for analysis of the mass balance. Figure 1 shows the course of acetate and methane formation. For the non-inoculated batches without inhibitor, the acetate concentration remained constant over the entire incubation time at the initial concentration of about 8 mg/L (Fig. 1a). Non-inoculated batches with rock and 600 mg/L inhibitor and inoculated batches with 120 mg/L inhibitor showed a 3 to 7-fold increase in acetate concentration (up to 53 mg/L) within 140 days compared to the initial values. A higher initial inhibitor concentration of 1200 mg/L led to a higher concentration of acetate after 140 d (up to 190 mg/L). Interestingly, the acetate concentration rose significantly between day 93 and 140 in one of the batches with 1200 mg/L inhibitor. So the metabolite generation was monitored further. While in batches with 1200 mg/L inhibitor the acetate concentration rose (up to 230 mg/L, Fig. 1a) it remained at the same level in most batches until termination of the experiment.
Due to outgassing of dissolved gases from the fluid, methane in the gas phase (headspace) increased up to 1.2 vol.%–1.9 vol.% within one day, but remained constant during further incubation in all non-inoculated batches. (Fig. 1b). However, in the inoculated batches with 120 and 1200 mg/L the methane concentration increased up to 7.2 vol.% and 16.8 vol.%, respectively (Fig. 1b). In one batch with 1200 mg/L inhibitor the methane concentration rose with a higher rate after 140 d, correlating with the rising acetate concentration. This indicates an increase in microbiological activity.
The CO2 content in the gas phase increased initially in all batches to a maximum of 5.9 vol.% within the first 6 d. Subsequently CO2 was consumed in all batches with coupons and the concentration decreased to less than 0.7 vol.% after 355 d of incubation (data not shown) and the pH ranged between 7.1 and 7.7.
A comparison of the non-inoculated to inoculated batches indicates that acetate and methane formation were enhanced by inoculation, which results in higher microbial metabolic activity. Furthermore, the amount of acetate and methane formed during the incubation period correlates with the initial inhibitor concentration.
Table 1Carbon equivalents of the degradation experiment after 140 d.
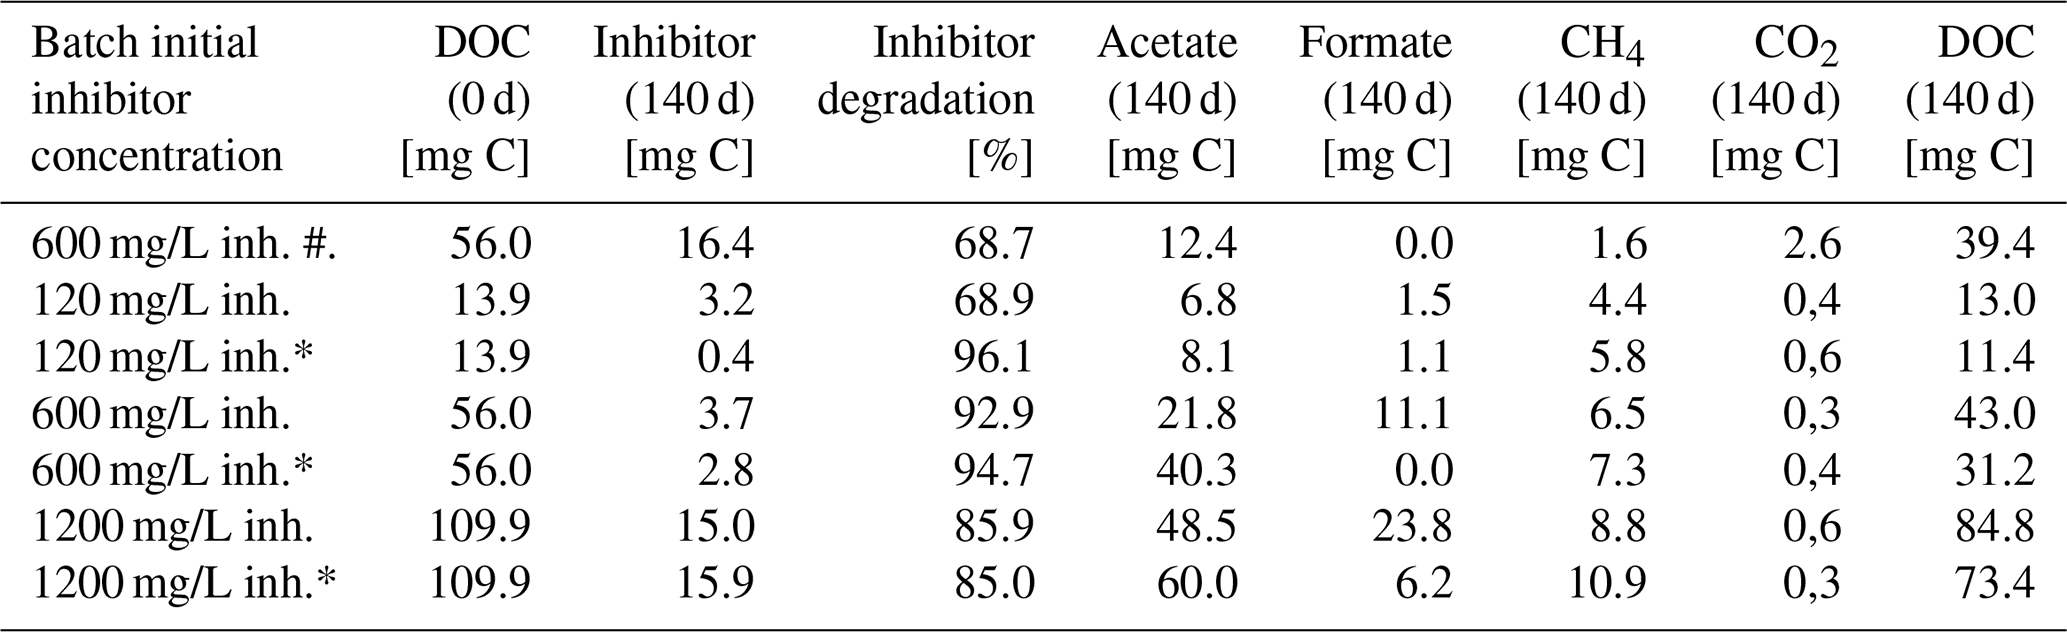
Samples marked with asterisk (*) were inoculated with the 120 mg/L inhibitor preculture. Others were inoculated with 1200 mg/L preculture. Sample marked with (#) was without a coupon and not inoculated. Natural DOC of the fluid was included in the calculation of mg C at day 0.
After 140 d of incubation the concentration of the inhibitor as well as the degradation products and the DOC were determined and a carbon balance was calculated (Fig. 2, Table 1). The initial carbon concentration and the carbon fraction of the remaining inhibitor was calculated based on the carbon content (11.1 % C). According to the UV/Vis method, 68.7 % to 96.1 % of the initial inhibitor concentration have been converted. Carbon amounts were calculated from GC measurements with the atmospheric pressure at this day (1.028 bar) and 40 ∘C within the headspace. The inhibitor was largely degraded to acetate (6.8–60.0 mg C) and formate (0.0–23.8 mg C) after 140 d of incubation. Samples inoculated with the 120 mg/L inhibitor preculture showed lower formate concentrations. In addition, 1.6 to 10.9 mg C of the carbon was converted to methane and 0.3 to 2.6 mg C to CO2. The sample without inoculated steel coupon (marked with #) showed the smallest rate of inhibitor degradation (68.7 %) and the largest gap of undetected carbon. The carbon balance demonstrates that the most important metabolites were quantified. Differences in total carbon before and after degradation might be attributed to biomass formation, because the gap is increasing with the amount of inhibitor degradation. And in addition, the formation of CH4 caused a slight overpressure in the vessels that was not quantified. This loss of carbon was neglected in the mass balance.
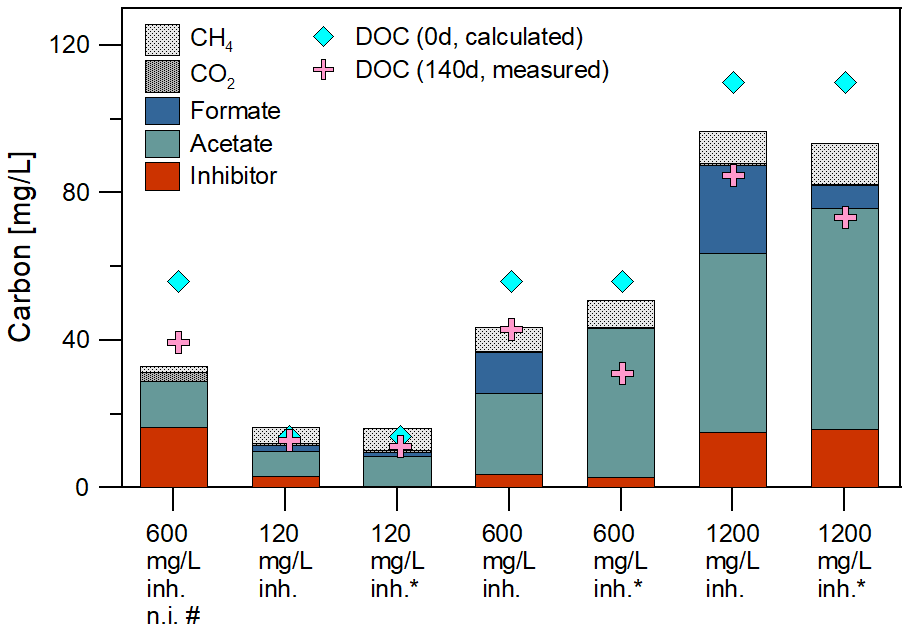
Figure 2Initial DOC concentration and carbon balance after 140 d of degradation: The initial DOC concentration was calculated with the carbon content of the fluid and the inhibitor. The main degradation products identified were acetate, formate, methane and CO2. The mass balance confirmed the almost complete conversion of the polycarboxylate inhibitor in inoculated batches. Samples marked with asterisk (*) were inoculated with the 120 mg/L inhibitor preculture. Others were inoculated with 1200 mg/L preculture. The sample marked with (#) was without an inoculated steel coupon.
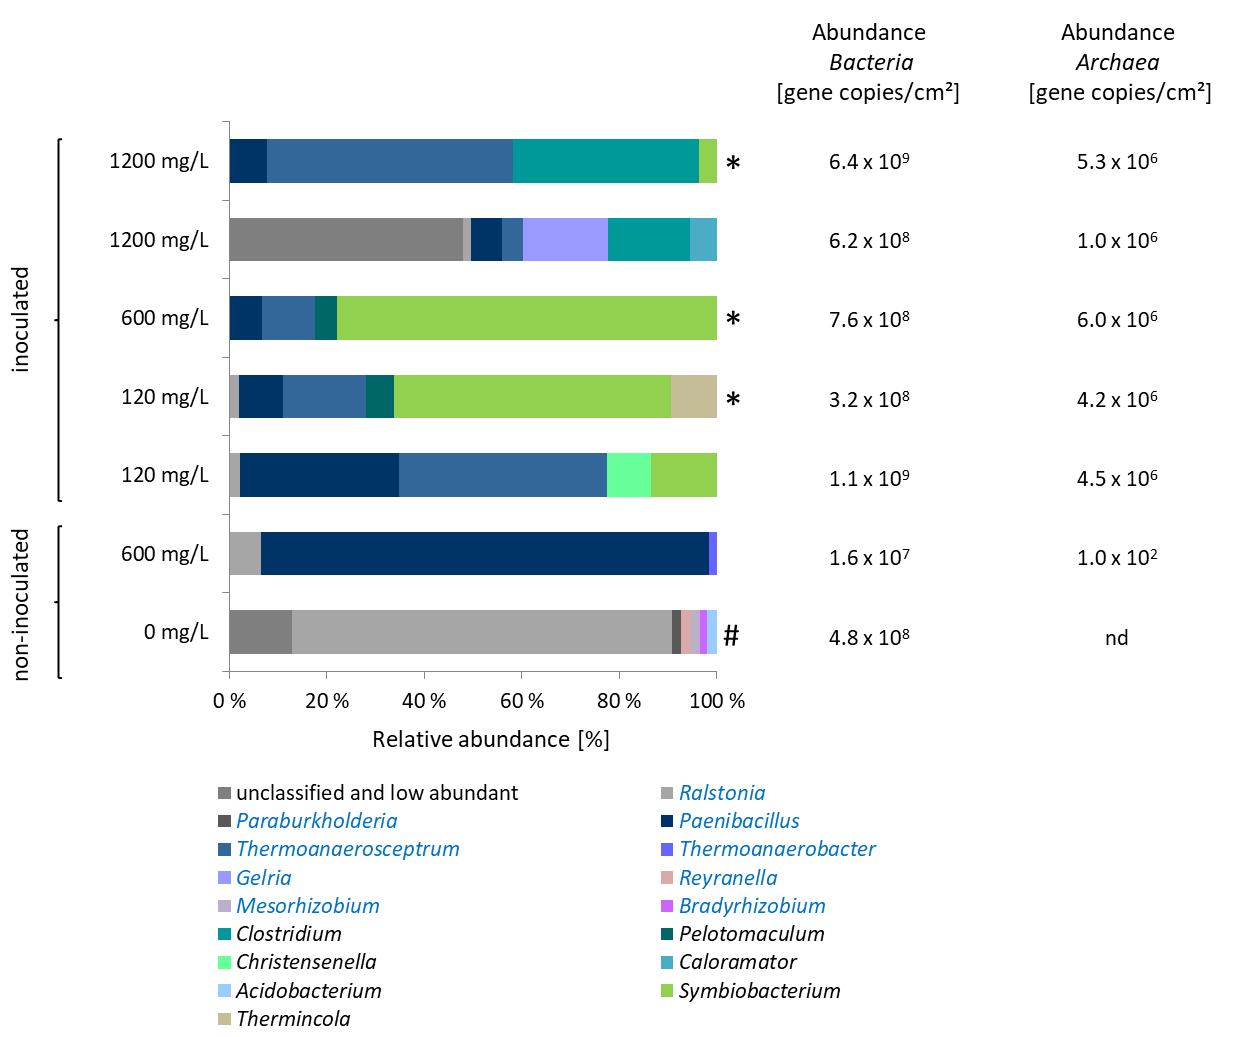
Figure 3Left: Characterization of the microbial community on coupons in experiments on inhibitor degradation after 355 d of incubation. Blue bars: fermentative bacteria. Samples marked with asterisk (*) were inoculated with the 120 mg/L inhibitor preculture. Others were inoculated with 1200 mg/L preculture. Sample marked with (#) contains no rock. Sequences classified to the genera written in blue letters had an identity to the best database hits of 98 %–100 %. Genera written in black letters had a sequence identity to the best database hits of 85 %–96 %. Right: Copy numbers of the 16S rRNA gene of Bacteria and the 16S rRNA gene of methanogenic archaea. nd = not detectable.
Microbiome analyses were performed to characterize the bacterial and archaeal biocenosis (Fig. 3). The high abundance of fermentative bacteria corresponded to the formation of organic acids and CO2. There was a clear difference in the composition of the bacterial biocenosis between experiments with 120 and 1200 mg/L initial inhibitor concentration (Fig. 3). In the 120 mg/L batches genera related to Paenibacillus (8 %–32 % relative abundance), Symbiobacterium (13 %–56 % relative abundance) and Thermoanaerosceptrum (16 %–42 % relative abundance) dominated the microbial community. Several Paenibacillus representatives produce extracellular enzymes for degradation of polysaccharides (Grady et al., 2016). Thermoanaerosceptrum (T. fracticalcis) utilizes fumarate as carbon source and electron donor (Hamilton-Brehm et al., 2019). An isomer of fumaric acid is maleic acid, which is copolymerized with acrylic acid to form the side chains of the inhibitor. Representatives of Symbiobacterium reduce nitrate (Shiratori-Takano et al., 2014), however the genus identified in the batch experiments is only distantly related to Symbiobacterium (identity 85 %–87 %). Relatives of Thermincola were represented by up to 10 %. Some species of the genera Paenibacillus and Thermincola are known to interact with iron (Fe III) by either reducing it (Zavarzina et al., 2007) or producing iron chelators (Grady et al., 2016; Ahmed et al., 2012). In contrast, in the 1200 mg/L batches in addition to Thermoanaerosceptrum (4 %–49 % relative abundance) fermentative bacteria of the genus Clostridium (17 %–38 % relative abundance) dominated the biocenosis. In one of the parallel 1200 mg/L-batches a large part of the population (53 % relative abundance) could not be assigned up to the genus level. The same batch showed an increased formate concentration with 37.6 mg/L compared to 7.1 mg/L in the parallel batch (Fig. 2). However, fermentative bacteria were also abundant in the identified biocenosis of this batch. The batch with reservoir fluid and 600 mg/L inhibitor (not inoculated with biofilm) contained almost exclusively relatives of Paenibacillus (91 %). This indicates that the other species identified in the inoculated batches originated from the biofilm that was sampled from the heat exchanger of the geothermal plant Unterhaching. Obviously, the biofilms used for inoculation of the preculture contained a much more diverse biocenosis than the geothermal fluid, and of course also higher cell numbers.
In all batches almost exclusively hydrogenotrophic Methanobacteriaceae were detected (data not shown) that typically form methane by reducing carbon dioxide and/or formate with hydrogen (Oren et al., 2014). Only traces of the hydrogenotrophic Methanothermobacter were found. The presence of methanogenic archaea corresponds to the formation of methane.
Representatives of various possible anaerobic metabolic pathways were identified using microbiome analysis. These are fermentative and non-fermentative bacteria, iron (Fe III) and nitrate reducing bacteria and methanogenic archaea.
3.2 Anaerobic degradation of the scaling inhibitor in batch experiments – short-term experiment
To further narrow the time frame of inhibitor degradation, in a second degradation experiment the inhibitor was quantified in intervals of two to four days via UV/VIS. This experiment showed that the inhibitor is degraded rapidly, if exposed to an inoculated batch in anaerobic conditions at 40 ∘C (Fig. 4). After 8 d the inhibitor in the setup with 100 mg/L initial concentration was below detection limit (<10 mg/L). Within 22 d only 60 mg/L remained in the setup with 500 mg/L initial concentration. The inhibitor concentration in the non-inoculated batch decreased with a lower rate than in inoculated samples. The sterilized control batch showed no significant decrease of the inhibitor concentration and no formation of methane, CO2, acetate or formate after 87 d of incubation (data not shown).
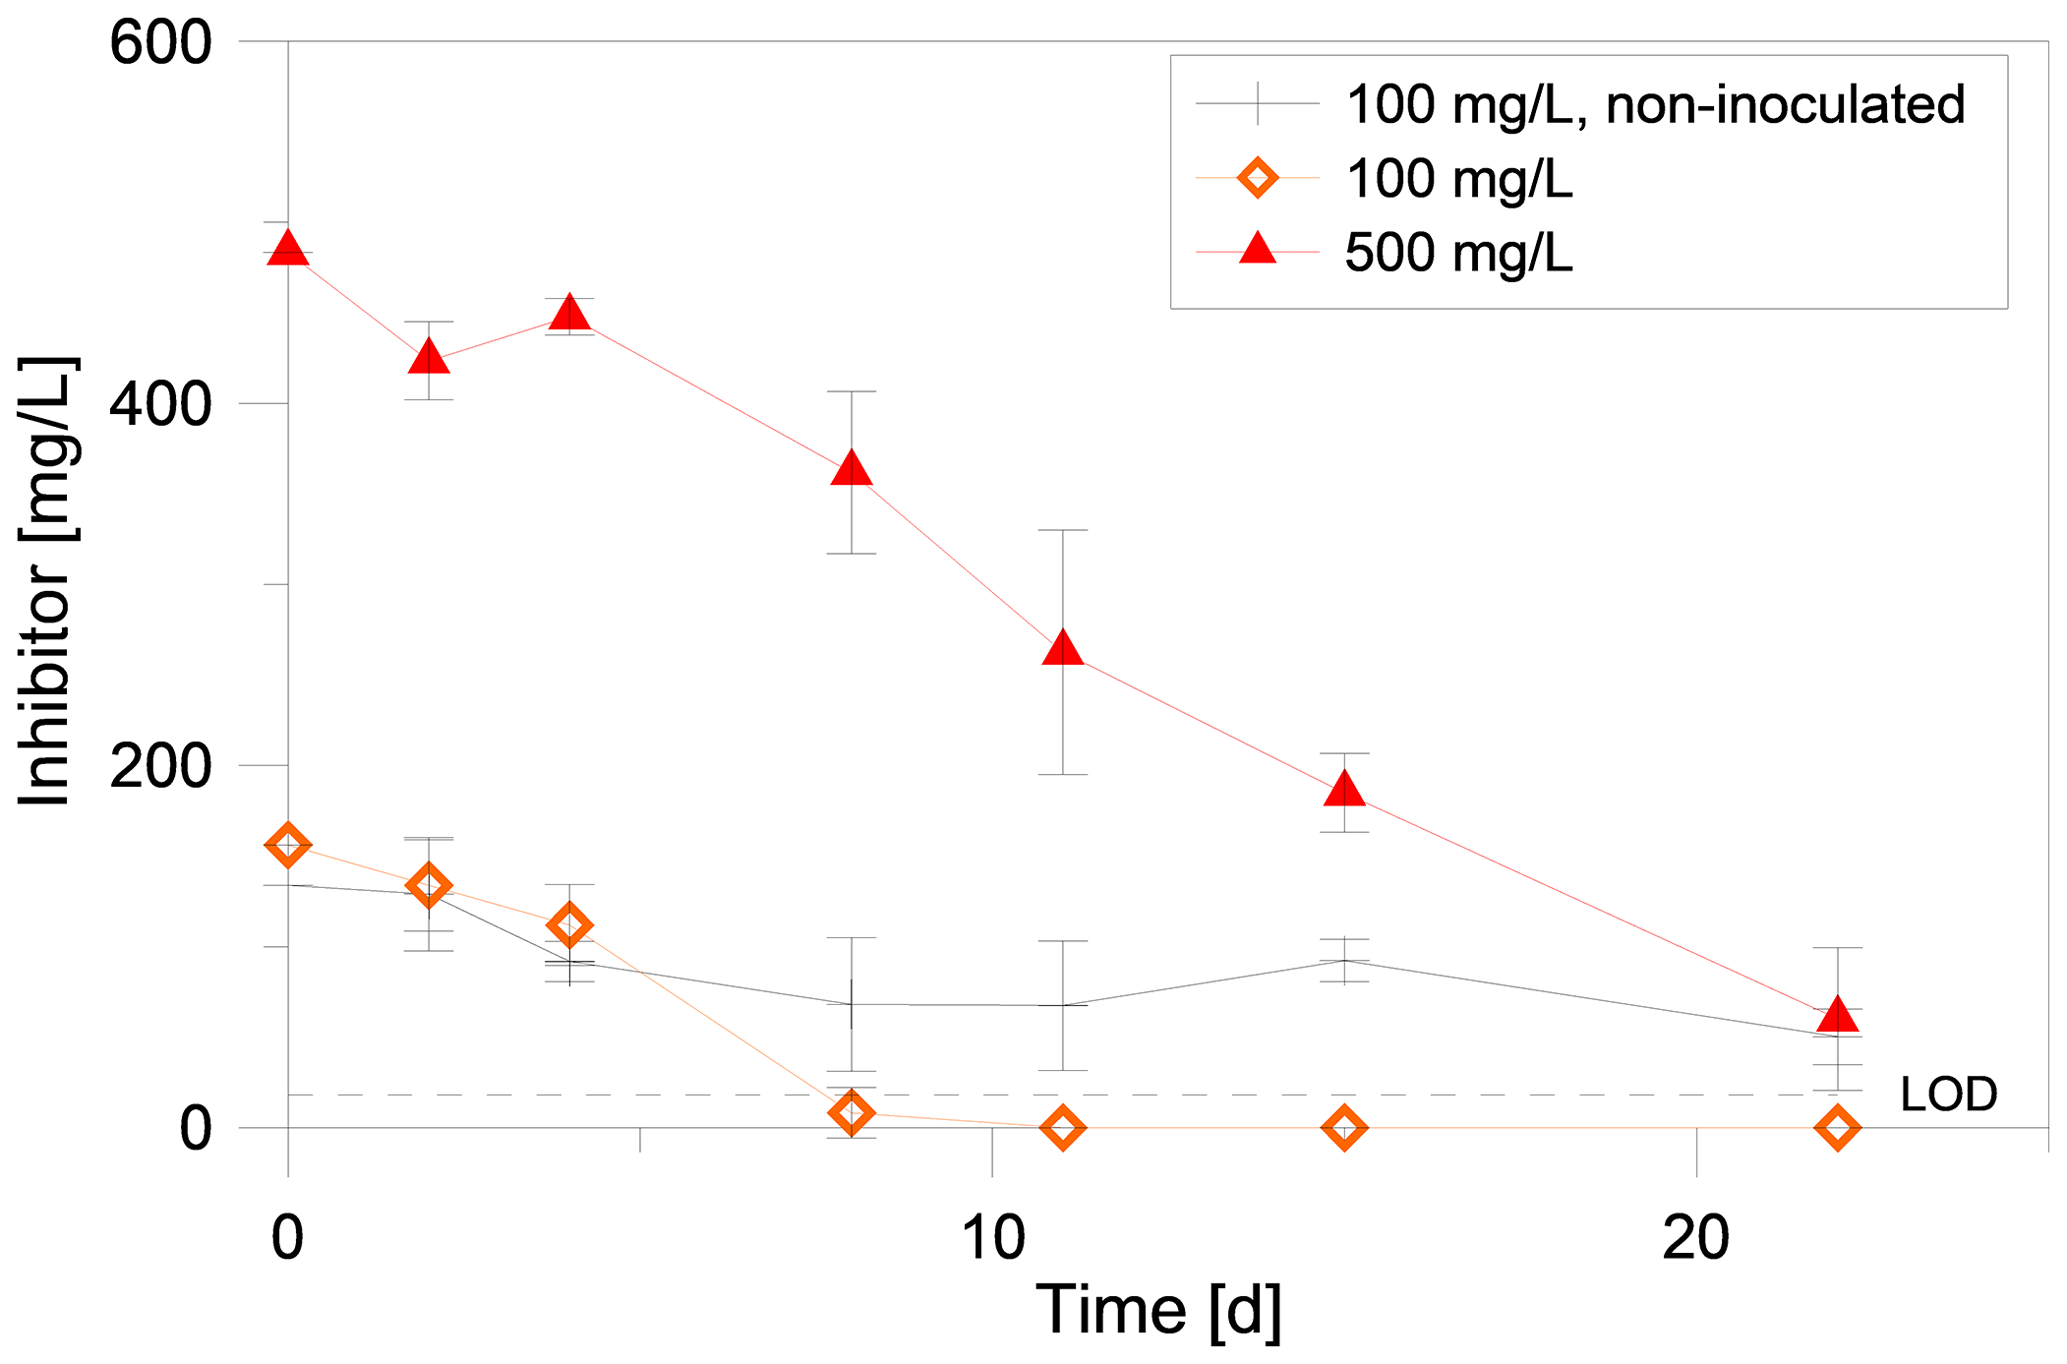
Figure 4Quantification of the inhibitor in degradation experiments with different initial concentrations via UV/VIS. One set of experiments (black line) had not been inoculated. Each data point was obtained from four independent samples. LOD (limit of detection): 10 mg/L.
3.3 Monitoring at the geothermal plant Unterhaching
The scaling inhibitor NC 47.1 B has been added at the wellhead of the production well since August 2017 and fluid samples for chemical and microbiological monitoring were taken at the production well, after the heat exchanger (power plant exit) and before fluid injection (injection well) over a period of 23 months. The inhibitor concentration ranged in this period from a set value of 5–10 mg/L. The inhibitor NC47.1 B showed a good performance to avoid carbonate precipitations in the surface installations of the thermal water system. Since the beginning of the injection in August 2017 accumulations of carbonate precipitations mainly in the filters and first part of the heat exchangers, as detected before, were not observed. An acidification of these plant parts, as done frequently before, was not necessary anymore.
Table 2Characterization of the geothermal Fluid at the plant in Unterhaching from 2017 to 2019.
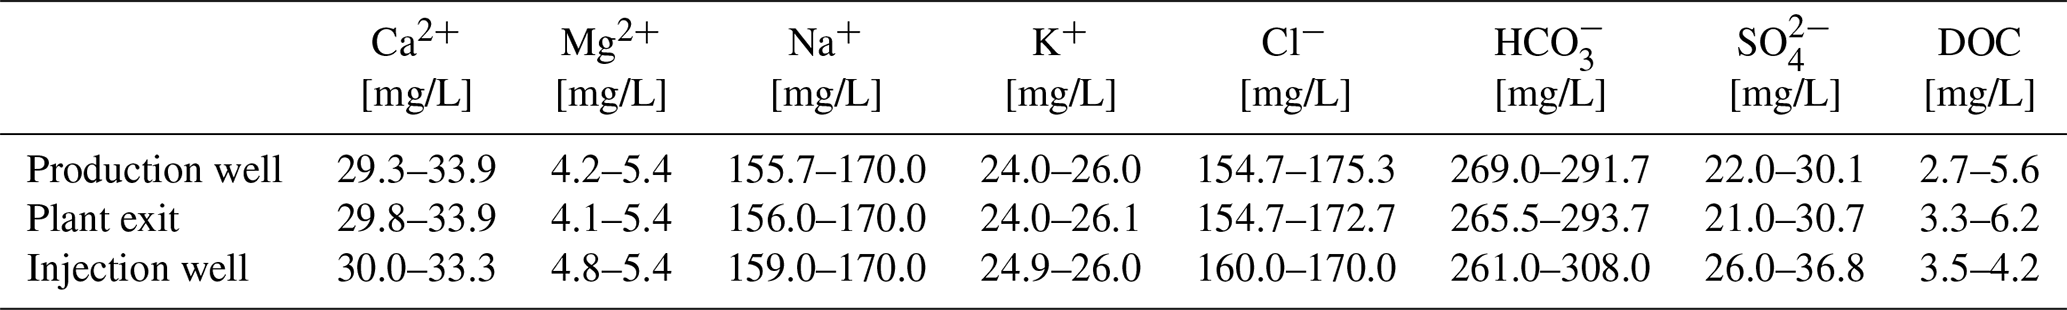
During the monitoring period, the main fluid chemistry was almost constant with respect to the time, but also with respect to the sampling point (before and after heat exchanger, Fig. 5, Table 2). The concentrations of the natural organic matter, determined on thermal water samples before the addition of inhibitor (production well), varied in the monitoring period (2017–2019) between 2.7 and 5.6 mg/L DOC. Such variations in the DOC, which are mainly determined by dissolved organic acids, hydrocarbons, PAHs and BTEX are common in deep thermal waters and observed in several other plants. The addition of 5 mg/L inhibitor to the geothermal fluid increased the DOC by a mean value of 0.45 mg/L at the plant exit. The pH of the fluid ranged from 6.4 to 6.8 at the well head and the plant exit. At the injection well the pH was between 6.6 and 6.7. At standard temperature and pressure 1 m3 of the production well fluid contained 0.167 m3 of gas with 10 vol.% N2 42 vol.%–46 vol.% CH4 and 41 vol.%–45 vol.% CO2 including the dissolved CO2. Dissolved sulfide concentrations varied between 12.9 and 17.2 mg/L and showed no significant increase along the surface installations of the plant.
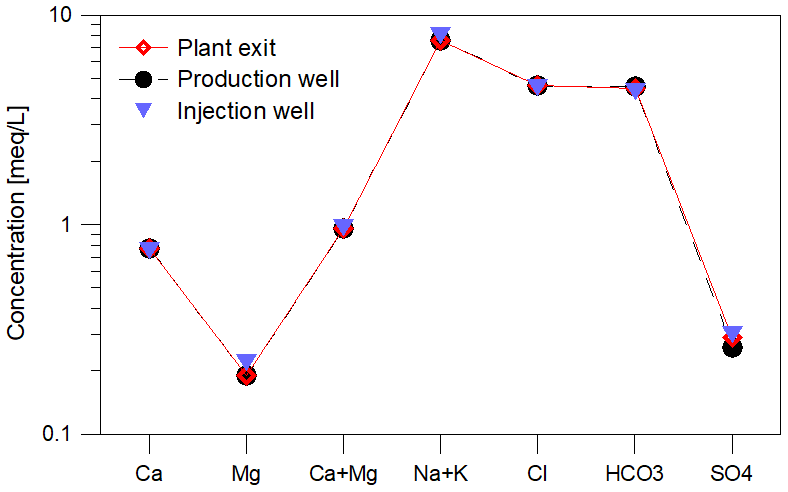
Figure 5Mineralization of the geothermal fluid at the plant in Unterhaching as Schoeller diagram (average 2017–2019). Samples were procured at all sampling sites (red: plant exit, black: production well, blue: injection well) and were found to be nearly identical. The composition was observed throughout the monitoring period. There were no significant changes in composition since the beginning of the monitoring.
As shown in Fig. 6, the abundance of Bacteria increased at all sampling sites over the period of 700 d inhibitor dosage. In particular, after heat extraction there was an increase from 105 gene copies/L at the beginning of the observation period to 1010 gene copies/L at the plant exit and also at the injection well after about 700 d. In contrast, the abundance at the production well increased only slightly from 105 to 107 gene copies/L. The strong increase after heat extraction indicates that the dosage of the inhibitor, that serves as an organic energy source for microbial metabolism, has a significant influence on the abundance of bacteria in the fluid and probably the formation of biofilms. However, not all changes can be attributed to the inhibitor addition, since fluid taken from the production well also shows a slight increase in bacterial abundance before inhibitor injection. A shift in temperature or other production parameters such as flow rate or less acidifications to remove precipitations might have contributed to the increase of abundance.
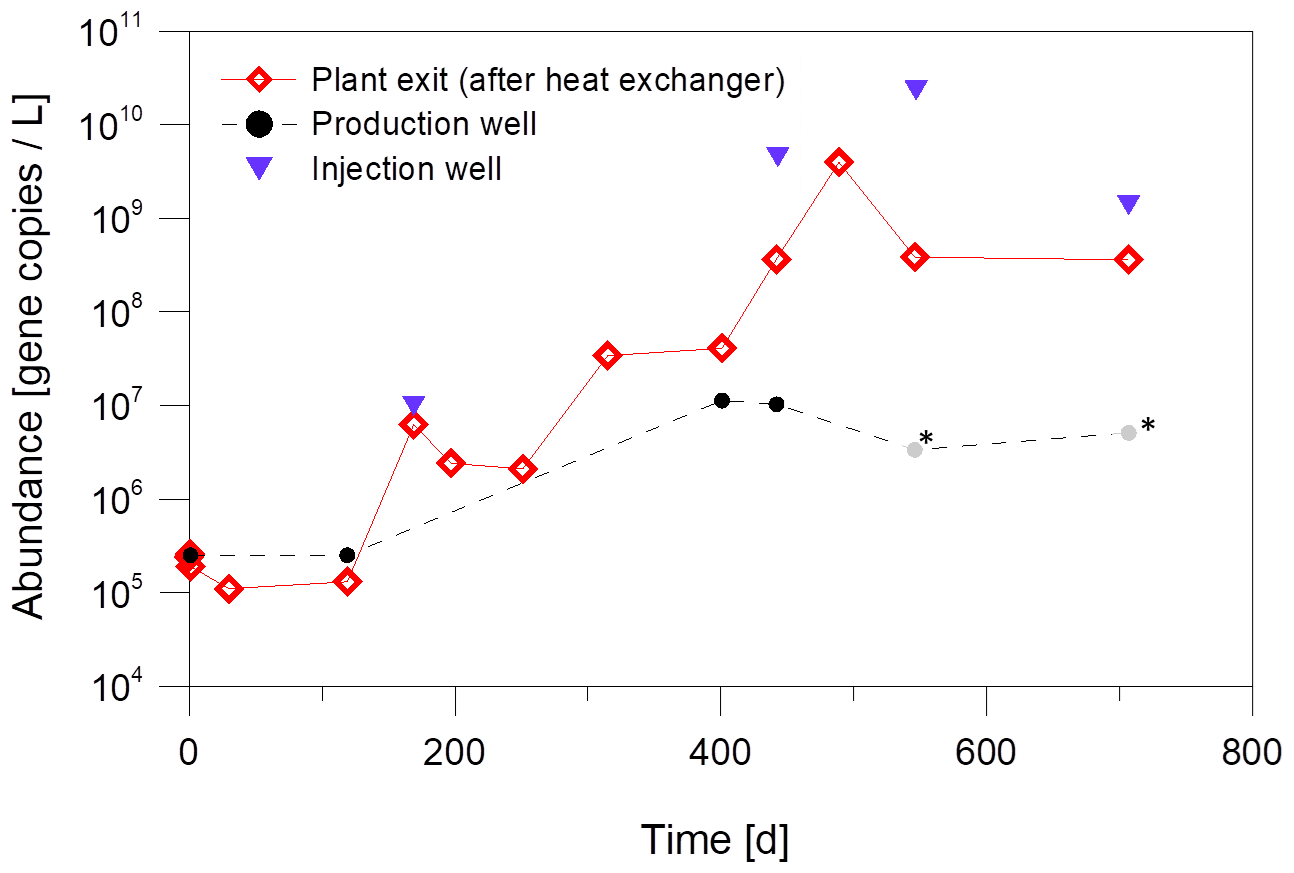
Figure 6Increase of the abundance of Bacteria due to inhibitor dosage in fluid samples from different sampling sites at the geothermal plant Unterhaching over a monitoring period of about 700 d of inhibitor dosage. Grey values marked with an asterisk were below the sample specific detection limit. Quantification with qPCR with primers for the 16S rRNA gene.
The quantification shows that the abundance of Bacteria increases significantly, while the abundance of SRB and methanogenic archaea remained almost constant at the plant exit at 102 gene copies/L and 104 gene copies/L, respectively (Fig. 7). This is an indication that only certain microorganisms, in this case the fermentative bacteria, benefit from the dosage of the inhibitor.
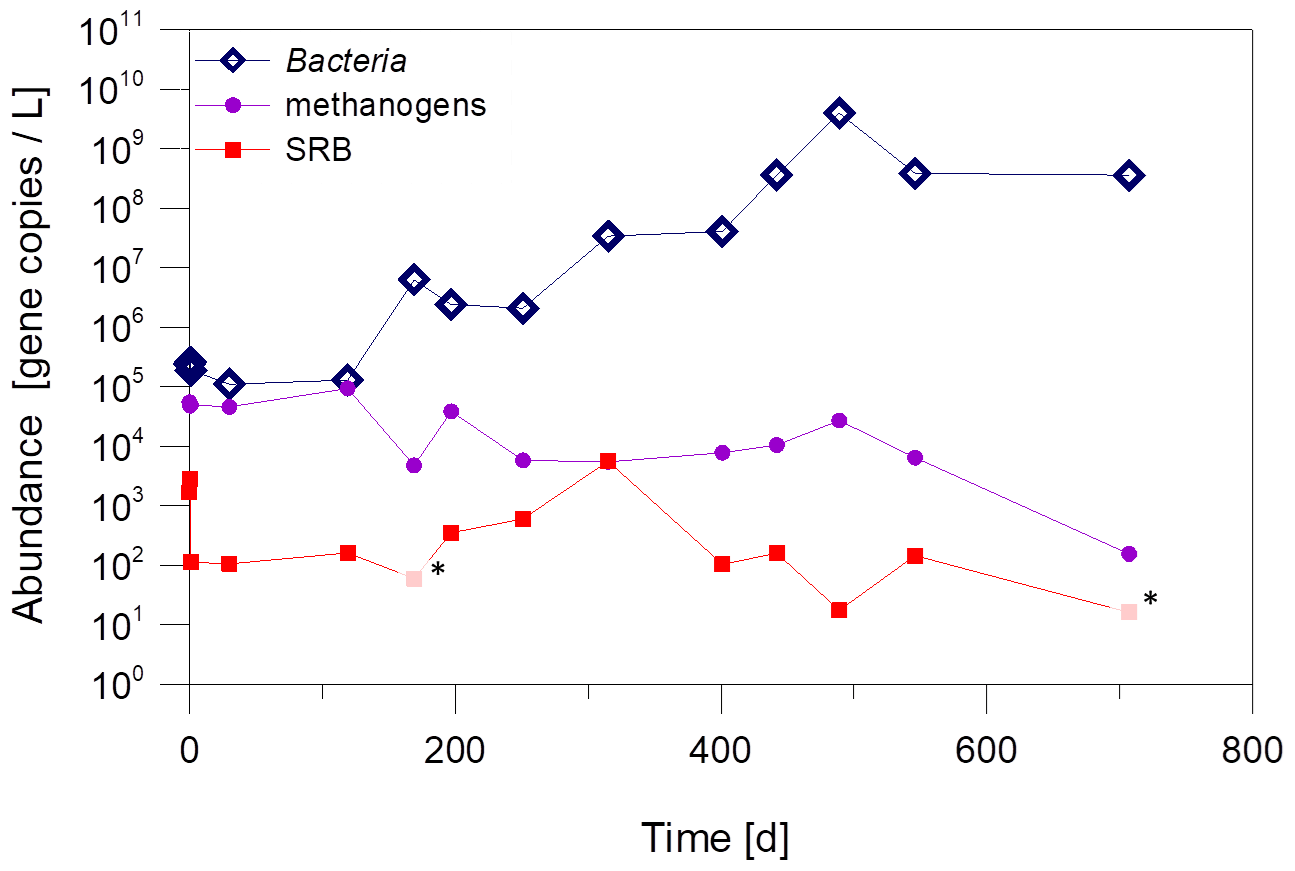
Figure 7Abundance of Bacteria, methanogenic archaea and SRB in fluid samples from the plant exit at the geothermal plant Unterhaching since beginning of inhibitor dosage in August 2017. Pale values marked with an asterisk were below the sample specific detection limit. Quantification with qPCR with primers for the 16S rRNA gene (Bacteria and methanogenic archaea) and the dsrA-gene for sulfate-reducing bacteria.
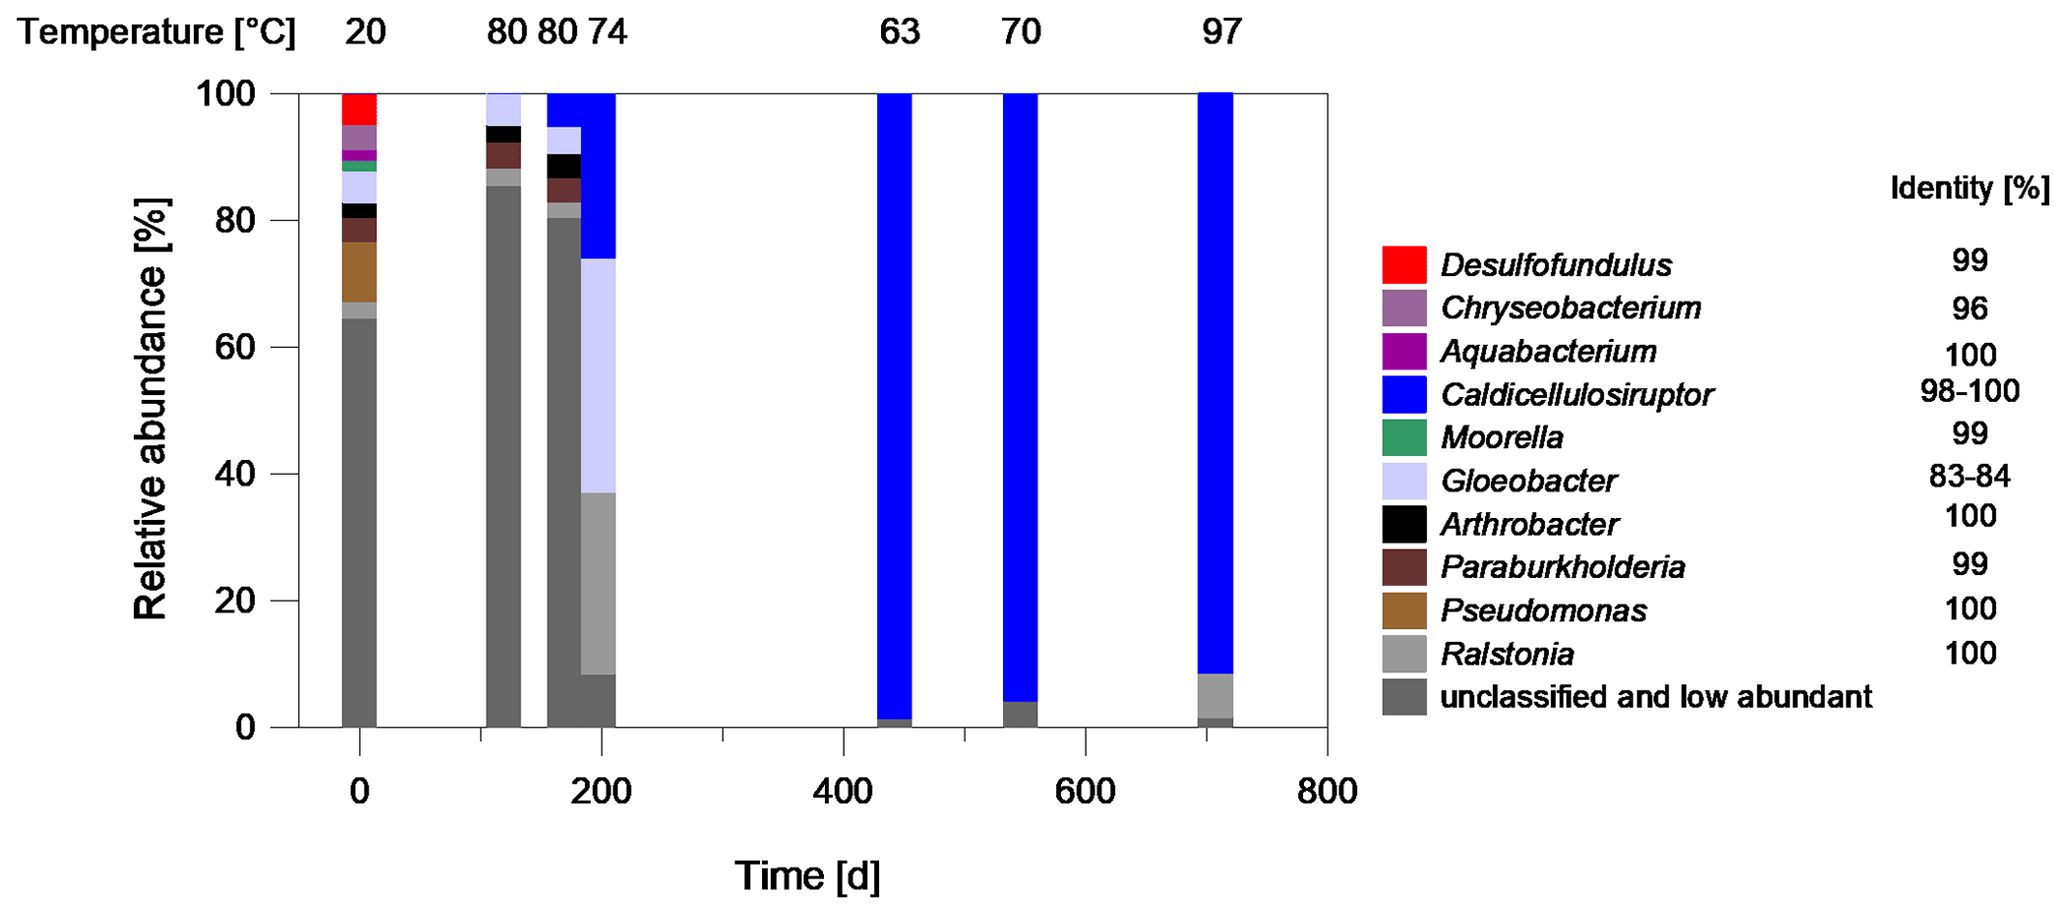
Figure 8Characterization of the bacterial biocenosis of fluid samples from the plant exit at the geothermal plant Unterhaching since August 2017. The samples have been taken over a period of about 700 d since inhibitor dosage. Blue: fermentative bacteria, Red sulfate-reducing bacteria. The temperature at the time of sampling is denoted. The sequence identity of the best database hits is given on the right of the genus name (Microbiome analysis).
The strong increase of bacterial abundance is related to an increasing dominance of species assigned to Caldicellulosiruptor as shown by microbiome analyses (Fig. 8). After 200 d of continuous inhibitor dosage, the genus dominated the bacterial biocenosis with 26 % relative abundance and after 440 d with 98 % relative abundance. Representatives belonging to the genus Caldicellulosiruptor were isolated from hot springs and pond sediments on several continents (Lee et al., 2020). They are able to ferment a variety of simple and complex carbohydrates to acetate, lactate, CO2, and H2 with a temperature optimum at 65–78 ∘C (Rainey et al., 1994; Bredholt et al., 1999; Blumer-Schuette et al., 2014).
With Caldicellulosiruptor, a thermophilic organism is identified, that can benefit from the addition of polycarboxylates and that has an optimal growth temperature, which lies within the range of the average temperature of 65 ∘C after heat extraction.
In contrast, in laboratory experiments Caldicellulosiruptor was only present marginally (non-inoculated control, 0.2 %). The biofilm isolated from mild steel coupons was dominated by fermentative bacteria and putative nitrate reducing bacteria that have an optimal growth temperature lower than that of Caldicellulosiruptor. Thermoanaerosceptrum has an optimum growth temperature of 55 ∘C and Symbiobacterium needs 55–60 ∘C for optimal growth (Hamilton-Brehm et al., 2019; Shiratori-Takano et al., 2014). The different composition of the biocenosis probably reflects the adaption of bacteria to the environmental conditions in the laboratory batch experiments at 40 ∘C versus biofilms at the exit of the geothermal plant exposed to continuous flow of geothermal water with a varying temperature between 50 and 122 ∘C as well as the different availability of organic carbon from the natural organic matter, the different inhibitor concentrations and degradation products as well as gases as CH4, CO2 and H2S.
The laboratory experiments showed that the scaling inhibitor NC47.1 B is rapidly degraded within several days (8 to 20 d) under anaerobic conditions at moderate temperatures when exposed to biofilm-inoculated batches. According to the mass balance the inhibitor was nearly completely degraded in inoculated batches. Metabolites were methane, acetate, formate and CO2. Microbiological studies showed that a complex microbial community developed. An increased proportion of fermentative bacteria implies their major role in the degradation process. This corresponds to the limited availability of terminal electron acceptors like sulfate (mean value 27 mg/L) in the reservoir fluids. While an increased population of Clostridium and Thermoanaerosceptrum was found in the laboratory experiments with higher inhibitor concentrations, in situ monitoring at the geothermal plant Unterhaching showed an increase of bacterial abundance and a strong dominance of a species related to Caldicellulosiruptor about 200 d since the inhibitor addition. The increase in bacterial abundance was especially notable after heat extraction and therefore a significant increase at the plant exit and at the injection well was observed.
The difference between laboratory experiments and in situ observations is probably due to varying temperatures and other environmental influences, which cannot be easily reproduced in laboratory experiments. The fluid flow and steady supply of nutrients are likely factors to influence the biocenosis. Translation of the results from laboratory experiments to in situ conditions is difficult. However, both the monitoring and the laboratory tests showed that fermenting bacteria were favored by the addition of the inhibitor and dominate the anaerobic degradation in both systems. Therefore, the degradation of the inhibitor after the heat extraction within the biofilms of a geothermal plant is likely, although a significant decrease of inhibitor concentration was not observed, probably due to the short hydraulic retention time of the fluid in the above surface installations.
All relevant data is included in this publication.
Experiments were designed, executed and evaluated by BD, CO and HW. Characterization of the fluid, HPLC measurements as well as method development were performed by JI and FE. Sampling on site, sample preparation and characterization of the fluid were performed by AS, DK and ST.
The authors declare that they have no conflict of interest.
This article is part of the special issue “European Geosciences Union General Assembly 2020, EGU Division Energy, Resources & Environment (ERE)”. It is a result of the EGU General Assembly 2020, 4–8 May 2020.
The authors acknowledge Geothermie Unterhaching GmbH & Co KG, Erdwärme Grünwald GmbH and Stadtwerke München GmbH and wish to thank the plant operator Bosch GmbH for assisting during sampling at the plant.
We also like to share our gratitude with Monika Kasina from the Institute of Geological Sciences University Krakow for her support with REM-EDX analysis, as well as Yasemin Civrilli for her support with IC and GC measurements at the HS Merseburg. We also thank the anonymous reviewers for helpful critical comments.
Data for this article were generated within the frame of the joint research project “Einsatz von Ausfällungsinhibitoren im Molassebecken – Begleitendes Monitoring und Experimente in unterschiedlichen Skalen” funded by Bundesministerium für Wirtschaft und Energie (BMWi) via the project executing organization PTJ (support code 0324215C).
This paper was edited by Maren Brehme and reviewed by two anonymous referees.
Ahmed, B., Cao, B., McLean, J. S., Ica, T., Dohnalkova, A., Istanbullu, O., Paksoy, A., Fredrickson, J. K., and Beyenal, H.: Fe(III) reduction and U(VI) immobilization by Paenibacillus sp. strain 300A, isolated from Hanford 300A subsurface sediments, Appl. Environ. Microb., 78, 8001–8009, https://doi.org/10.1128/AEM.01844-12, 2012.
Apprill, A., McNally, S., Parsons, R., and Weber, L.: Minor revision to V4 region SSU rRNA 806R gene primer greatly increases detection of SAR11 bacterioplankton, Aquat. Microb. Ecol., 75, 129–137, https://doi.org/10.3354/ame01753, 2015.
Blumer-Schuette, S. E., Brown, S. D., Sander, K. B., Bayer, E. A., Kataeva, I., Zurawski, J. V., Conway, J. M., Adams, M. W. W., and Kelly, R. M.: Thermophilic lignocellulose deconstruction, FEMS Microbiol. Rev., 38, 393–448, https://doi.org/10.1111/1574-6976.12044, 2014.
Bredholt, S., Sonne-Hansen, J., Nielsen, P., Mathrani, I. M., and Ahring, B. K.: Caldicellulosiruptor kristjanssonii sp. nov., a cellulolytic, extremely thermophilic, anaerobic bacterium, Int. J. Syst. Bacteriol., 49, 991–996, https://doi.org/10.1099/00207713-49-3-991, 1999.
Cypionka, H.: Grundlagen der Mikrobiologie, Edn. 4, überarb. und aktualisierte Aufl., Springer-Lehrbuch, Springer, Berlin, Germany, 339 pp., 2010 (in German).
Flynn, T. M., Sanford, R. A., Ryu, H., Bethke, C. M., Levine, A. D., Ashbolt, N. J., and Santo Domingo, J. W.: Functional microbial diversity explains groundwater chemistry in a pristine aquifer, BMC Microbiol., 13, 146, https://doi.org/10.1186/1471-2180-13-146, 2013.
Gantner, S., Andersson, A. F., Alonso-Sáez, L., and Bertilsson, S.: Novel primers for 16S rRNA-based archaeal community analyses in environmental samples, J. Microbiol. Meth., 84, 12–18, https://doi.org/10.1016/j.mimet.2010.10.001, 2011.
Grady, E. N., MacDonald, J., Liu, L., Richman, A., and Yuan, Z.-C.: Current knowledge and perspectives of Paenibacillus: a review, Microb. Cell Fact., 15, 203, https://doi.org/10.1186/s12934-016-0603-7, 2016.
Hamilton-Brehm, S. D., Stewart, L. E., Zavarin, M., Caldwell, M., Lawson, P. A., Onstott, T. C., Grzymski, J., Neveux, I., Lollar, B. S., Russell, C. E., and Moser, D. P.: Thermoanaerosceptrum fracticalcis gen. nov. sp. nov., a Novel Fumarate-Fermenting Microorganism From a Deep Fractured Carbonate Aquifer of the US Great Basin, Front. Microbiol., 10, 2224, https://doi.org/10.3389/fmicb.2019.02224, 2019.
Harris, K.: Biodegradation and testing of scale inhibitors, Chem. Eng.-New York, 4, 49–53, 2011.
Hasson, D., Shemer, H., and Sher, A.: State of the Art of Friendly “Green” Scale Control Inhibitors: A Review Article, Ind. Eng. Chem. Res., 50, 7601–7607, https://doi.org/10.1021/ie200370v, 2011.
Henning, H.-M. and Palzer, A.: A comprehensive model for the German electricity and heat sector in a future energy system with a dominant contribution from renewable energy technologies – Part I: Methodology, Renew. Sust. Energ. Rev., 30, 1003–1018, https://doi.org/10.1016/j.rser.2013.09.012, 2014.
Klindworth, A., Pruesse, E., Schweer, T., Peplies, J., Quast, C., Horn, M., and Glöckner, F. O.: Evaluation of general 16S ribosomal RNA gene PCR primers for classical and next-generation sequencing-based diversity studies, Nucleic Acids Res., 41, e1, https://doi.org/10.1093/nar/gks808, 2013.
Lee, L. L., Crosby, J. R., Rubinstein, G. M., Laemthong, T., Bing, R. G., Straub, C. T., Adams, M. W. W., and Kelly, R. M.: The biology and biotechnology of the genus Caldicellulosiruptor: recent developments in “Caldi World”, Extremophiles, 24, 1–15, https://doi.org/10.1007/s00792-019-01116-5, 2020.
Lerm, S., Kleyböcker, A., and Würdemann, H.: GFZ Endbericht zum Verbundvorhaben Thermo-Inhibitor (Anwendung von verschiedenen Inhibitoren zur Vermeidung von Ausfällungen und Korrosion in Tiefengrundwassersystemen im Molassebecken und Norddeutschen Becken) Teilprojekt II Einfluss von Inhibitoren auf Mikroorganismen, unter besonderer Berücksichtigung von Scaling und Korrosion verursachender Organismen, GFZ Helmholtz Zentrum Potsdam, Potsdam, Germany, https://doi.org/10.2314/GBV:861905024, 2015 (in German).
Moeck, I. and Kuckelkorn, J.: Tiefengeothermie als Grundlastwärmequelle in der Metropolregion München, Forsch. Wärmewende, Beiträge FVEE-Jahrestagung, 3–4 November 2015, Berlin, Germany, 91–93, 2015.
Nadkarni, M. A., Martin, F. E., Jacques, N. A., and Hunter, N.: Determination of bacterial load by real-time PCR using a broad-range (universal) probe and primers set, Microbiology+, 148, 257–266, https://doi.org/10.1099/00221287-148-1-257, 2002.
Oren, A.: The Family Methanobacteriaceae, in: The Prokaryotes – Other major lineages of Bacteria and the Archaea, a handbook on the biology of bacteria, edited by: Rosenberg, E., DeLong, E. F., Lory, S., Stackebrandt, E., and Thompson, F., Springer, Berlin, Heidelberg, Germany, 165–193, https://doi.org/10.1007/978-3-642-38954-2_411, 2014.
Øvreås, L., Forney, L., Daae, F. L., and Torsvik, V.: Distribution of bacterioplankton in meromictic Lake Saelenvannet, as determined by denaturing gradient gel electrophoresis of PCR-amplified gene fragments coding for 16S rRNA, Appl. Environ. Microb., 63, 3367–3373, https://doi.org/10.1128/AEM.63.9.3367-3373.1997, 1997.
Quince, C., Lanzen, A., Davenport, R. J., and Turnbaugh, P. J.: Removing Noise From Pyrosequenced Amplicons, BMC Bioinformatics, 12, 38, https://doi.org/10.1186/1471-2105-12-38, 2011.
Rainey, F. A., Donnison, A. M., Janssen, P. H., Saul, D., Rodrigo, A., Bergquist, P. L., Daniel, R. M., Stackebrandt, E., and Morgan, H. W.: Description of Caldicellulosiruptor saccharolyticus gen. nov., sp. nov: An obligately anaerobic, extremely thermophilic, cellulolytic bacterium, FEMS Microbiol. Lett., 120, 263–266, 1994.
Sacchi, C. T., Whitney, A. M., Mayer, L. W., Morey, R., Steigerwalt, A., Boras, A., Weyant, R. S., and Popovic, T.: Sequencing of 16S rRNA gene: a rapid tool for identification of Bacillus anthracis, Emerg. Infect. Dis., 8, 1117–1123, https://doi.org/10.3201/eid0810.020391, 2002.
Sawayama, S., Tsukahara, K., and Yagishita, T.: Phylogenetic description of immobilized methanogenic community using real-time PCR in a fixed-bed anaerobic digester, Bioresource Technol., 97, 69–76, https://doi.org/10.1016/j.biortech.2005.02.011, 2006.
Schink, B.: Energetics of syntrophic cooperation in methanogenic degradation, Microbiol. Mol. Biol. R., 61, 262–280, 1997.
Shiratori-Takano, H., Akita, K., Yamada, K., Itoh, T., Sugihara, T., Beppu, T., and Ueda, K.: Description of Symbiobacterium ostreiconchae sp. nov., Symbiobacterium turbinis sp. nov. and Symbiobacterium terraclitae sp. nov., isolated from shellfish, emended description of the genus Symbiobacterium and proposal of Symbiobacteriaceae fam. nov, Int. J. Syst. Evol. Micr., 64, 3375–3383, https://doi.org/10.1099/ijs.0.063750-0, 2014.
Sieben, M. and Niederrhein Chemie GmbH: Informationen zu dem Kalkinhibitor NC47.1B, Personal Communication, Kevelaer, Germany, 2016.
Wagner, M., Roger, A. J., Flax, J. L., Brusseau, G. A., and Stahl, D. A.: Phylogeny of dissimilatory sulfite reductases supports an early origin of sulfate respiration, J. Bacteriol., 180, 2975–2982, https://doi.org/10.1128/JB.180.11.2975-2982.1998, 1998.
Wanner, C., Eichinger, F., Jahrfeld, T., and Diamond, L. W.: Causes of abundant calcite scaling in geothermal wells in the Bavarian Molasse Basin, Southern Germany, Geothermics, 70, 324–338, https://doi.org/10.1016/j.geothermics.2017.05.001, 2017.
Wilms, R., Sass, H., Köpke, B., Cypionka, H., and Engelen, B.: Methane and sulfate profiles within the subsurface of a tidal flat are reflected by the distribution of sulfate-reducing bacteria and methanogenic archaea, FEMS Microbiol. Ecol., 59, 611–621, https://doi.org/10.1111/j.1574-6941.2006.00225.x, 2007.
Winfrey, M. R. and Ward, D. M.: Substrates for Sulfate Reduction and Methane Production in Intertidal Sediments, Appl. Environ. Microb., 45, 193–199, https://doi.org/10.1128/AEM.45.1.193-199.1983, 1983.
Würdemann, H., Westphal, A., Kleyböcker, A., Miethling-Graff, R., Teitz, S., Kasina, M., Seibt, A., Wolfgramm, M., Eichinger, F., and Lerm, S.: Störungen des Betriebs geothermischer Anlagen durch mikrobielle Stoffwechselprozesse und Erfolg von Gegenmaßnahmen, Grundwasser, 21, 93–106, https://doi.org/10.1007/s00767-016-0324-1, 2016.
Zavarzina, D. G., Sokolova, T. G., Tourova, T. P., Chernyh, N. A., Kostrikina, N. A., and Bonch-Osmolovskaya, E. A.: Thermincola ferriacetica sp. nov., a new anaerobic, thermophilic, facultatively chemolithoautotrophic bacterium capable of dissimilatory Fe(III) reduction, Extremophiles, 11, 1–7, https://doi.org/10.1007/s00792-006-0004-7, 2007.