 | 22 Dec 2020
Wettability of organic-rich source rocks: case study on Bazhenov Formation (Abalak-Bazhenov group)
Aliya Mukhametdinova
Tagir Karamov
Natalia Bogdanovich
Sergey Borisenko
Svetlana Rudakovskaya
Alexey Cheremisin
In this work, we have investigated the wettability of Bazhenov Formation rock samples using a nuclear magnetic resonance (NMR), the methods of vapor adsorption, and wetting contact angle. We have conducted the petrographic description of rocks using ultra-thin sections and scanning electron microscopy (SEM). In addition, we used data on the organic content (TOC) obtained by the Rock-Eval method and the results of lithological typing on thin sections for detailed analysis of NMR and contact angle methods results. Thus, for target rock, the groups with a similar rock wettability were highlighted by the lithological description of thin sections. The calculation of the wetting angle provided an initial assessment of the surface wettability of the rock and made it possible to establish the relationship between the wetting angle and the TOC, which is relevant for rocks of the Abalak-Bazhenov group. The NMR method described the core plug wettability proved to be less sensitive to the rock lithotype and organic matter (OM) texture in the rock and, therefore, used for the integral characterization of core plugs. Correlations of calculated wetting angle and adsorption wettability index vs. TOC and OM texture illustrated the dependence of rock wettability behavior on both the lithological specifics and the OM properties.
- Article
(1906 KB) - Full-text XML
- BibTeX
- EndNote


In recent years, the share of unconventional reserves in global oil production has grown significantly (Ahmed and Meehan, 2016; Prishchepa et al., 2014). Exploration and development of unconventional resources require novel effective laboratory methods for characterizing the reservoir properties. The wettability of reservoir rock is one of the most critical factors affecting the residual saturation and flow properties in the formation. However, as multiple petrophysical studies showed, traditional laboratory methods for characterizing the wettability are not applicable for low-permeable source rocks.
Wettability is an ability of a rock surface to interact with a reservoir fluid molecularly, and it is one of the essential characteristics associated with the development of oil and gas fields and reserves estimation (Morrow, 1990; Ogunberu and Ayub, 2005). The nature of the rock surface wettability in the reservoir significantly affects the residual saturation, total recovery factor, etc. The preliminary recovery of fully or partially hydrophobic reservoirs leads to an artificial overestimation of the residual water saturation when estimated by indirect methods.
According to the literature data, wettability in shales is characterized by mixed wet properties, controlled by numerous factors such as total organic carbon content, organic matter maturity, mineralogical composition, porosity, pressure, temperature, and brine salinity. Rui Yang (Yang et al., 2018) reports that samples of marine Longmaxi shales with higher TOC and quartz content are characterized as predominantly oil-wet. Xuan Liu (Liu et al., 2018) emphasizes that the main factors controlling the wettability of Longmaxi shales are migrating organic matter and clay minerals: increasing migrating organic matter leads to oil-wet behavior of the rock; the same is true for illite and smectite components. Moreover, they mentioned that if TOC content is less than 1.5 %, then the main controlling factor is clay mineral content, and if TOC content is higher 1.5 % TOC and organic matter uniformly developed and distributed – content TOC plays key role in wettability behavior. At the same time Eric J. Guiltinan (Guiltinan et al., 2017) showed that TOC and OM thermal maturity have no significant effect on Barnet Formation shale samples wettability, which may be a demonstration of mineral heterogeneity. Archana Jagadisan and Zoya Heidari (Jagadisan and Heidari, 2019) experimentally found that the wettability of the kerogen is a function of OM maturity: at high thermal maturities, kerogen is strongly oil-wet when at low thermal maturity, kerogen is predominantly water-wet. Bin Pan (Pan et al., 2020), with coauthors, quite categorically states that increasing TOC content leads to the evolution of oil-wet behavior of shale samples when increasing temperature causes water-wet, but increasing TOC content reduces the influence of temperature on shales. Salinity is a different factor that influences the wettability behavior of shales; it is shown in Safari et al. (2020) and Liu et al. (2020): with decreasing NaCl brine salinity contact angle reduces, when decreasing of MgCl2 concentration leads to the opposite effect.
There are multiple conventional methods for assessing the wetting properties of shale rocks in laboratory conditions, but obtained results are often contradictory and difficult to reproduce. Mainly they are based on the phenomenon of the capillary imbibition (Amott, 1959), capillary displacement (USBM, Donaldson et al., 1969), microscopic techniques, and a combination of mentioned methods (Abdallah et al., 2007). The abovementioned experimental methods are widely known for characterizing the wettability of sandstone and carbonate formations (Thyne, 2015; Ivanova et al., 2019).
Determination of wettability for shale rocks is complicated due to the low rock permeability (<1 mD), low porosity (<3 %–5 %), and a high content of clay minerals and highly viscous components. To increase the accuracy of wettability evaluation, shale rock assessment requires an integrated approach composed of different laboratory methods. Nuclear magnetic relaxometry (NMR) has gained high interest in the last 20–30 years due to the non-invasiveness and prompt testing and characterizing the primary reservoir properties, including wettability of the source rocks (Odusina et al., 2011; Valori and Nicot, 2019).
In the framework of this paper, the fluid saturation and wettability of Abalak and Bazhenov rocks were analyzed employing the adsorption method, nuclear magnetic resonance (NMR), as well as by determining the wetting contact angle of the rock surface. Microstructural lithological study of rocks was carried out using thin (10–20 microns) petrographic sections.
2.1 Materials
Abalak-Bazhenov group is represented by the Abalak Formation (AF) and Bazhenov Formation (BF). Abalak-Bazhenov group (ABG) is one of the most prominent oil shale clusters in the world, located in the Russian Federation with a total area > 1 mln km2. BF and AF are Upper Jurassic – Lower Cretaceous clay-siliceous-carbonate organic-rich shale rocks, which occupy most of the West Siberian Petroleum Basin with a thickness of 15–60 and 20–90 m, respectively. The investigated object is characterized by low values of porosity and permeability, high content of organic matter up to 25 % w.t. represented by viscous and solid components, including kerogen (Balushkina et al., 2014; Ryzhkova et al., 2018). Main rock types are composed of siliceous, carbonate, clay minerals, and organic matter, with the dominance of siliceous minerals (Kontorovich et al., 1997). The AB group is characterized by high heterogeneity caused by the interlaying of silica and mudstone with kerogen-enriched laminas.
2.2 Methods
To study the wettability of the ABG rocks, we have proposed a combination of three laboratory methods: water vapor adsorption, contact angle estimation, and nuclear magnetic relaxometry (NMR).
2.2.1 Rock characterization
Rock typing was performed according to the classification proposed by Lazar et al. (2015). Special ultra-thin sections (10 μm) were prepared for analysis on ZEISS Axio 2 m polarizing microscope. For high-resolution 2D imaging and micromorphological characterization, we used the Thermo Fisher Scientific Quattro S scanning electron microscope (SEM), which analyzed small (2–5 mm) rock specimens chipped from each sample. Mineralogy analysis on core powder was performed using the benchtop Rigaku Smartlab X-Ray diffractometer unit. Gas porosity and permeability were analyzed by an automated gas permeameter-porosimeter Geologika PIK-PP (Russia) based on the pressure decay technique. Additionally, data on the organic carbon content (TOC) was obtained by the Rock-Eval method on the HAWK RW instrument (Wildcat Technologies). Interpretation of results was based on the principles of pyrolytic data analysis for source rock (Espitalie and Bordenave, 1993).
2.2.2 NMR relaxometry
We have used NMR relaxometry for measurements on extracted core samples (cylinders) in oil (kerosene) and water (brine) saturated states. The tests were performed using a low-field (0.05T) benchtop NMR relaxometer Geospec 2-53 (Oxford Instruments Inc) operating at 2.28 MHz frequency. T2 relaxation curves were measured by the Carr–Purcell–Meybum–Gill method (CPMG), the time-echo (TE=2τ) was set to 0.1 ms. The number of accumulations of the pulse sequence was at least equal to 128 scans, with the maximum signal-to-noise ratio achieved. Interpretation of results was based on the main principles of NMR in petrophysical research (Abragam, 1961; Bloembergen et al., 1948; Callaghan, 1991; Straley et al., 1997). Wettability characterization was based on the calculation of the logarithm of the ratio of the average logarithmic times T2 for water- and kerosene-saturated samples after extraction (Borisenko et al., 2017):
Values of Wnmr index vary from −1 to +1; negative values indicate the oil-wet, near-zero, and positive values correspond to a neutral and water-wet character. For the convenience of comparison with the WI by the adsorption method, Wnmr can be recalculated in the range from 0 to 1 so that zero value corresponds to water-wet, 0.5 to neutral wettability, and values about 1 to oil-wet.
where W and WI are wettability indexes and T2l m oil and T2l m water – logarithmic mean T2 times for oil and water-saturated samples, accordingly. The current approach is based on the alteration of the T2 relaxation time spectra under the influence of saturation fluid (Foley et al., 1996).
2.2.3 Contact angle measurement
A measure of wettability is considered to be the wetting angle, depending on the size of which the surfaces are divided into hydrophilic and hydrophobic. For water-oil shown in the figure below, surface energies are distributed according to the Dupre–Young equation extensions:
where Eo is the surface binding energy between oil and rock surface (dyne per cm); Ew is the binding energy between water and a solid surface (dyne per cm); Eow is the binding energy between water and oil (dyne per cm); θ is the contact angle at the oil-water-solid surfaces, measured from the waterside (degree). There are no methods for the direct determination of Eo and Ew. Still, the equivalent value of Eo−Ew, i.e., Eow⋅cos θ can be obtained by independent measurement of Eo and, thus, characterize the rock wettability. Contact angles of less than 90∘ determine the predominant water-wet surface, whereas the limiting case (θ=0∘) shows that the movement of oil by water from the surface will be spontaneous and will not require external forces. On the contrary, the condition Eo<Ew leads to variation of θ angle from 90 to 180∘. Therefore, contact angles greater than 90∘ determine the predominant wettability of the surface with oil; otherwise, it indicates hydrophobicity of the surface.
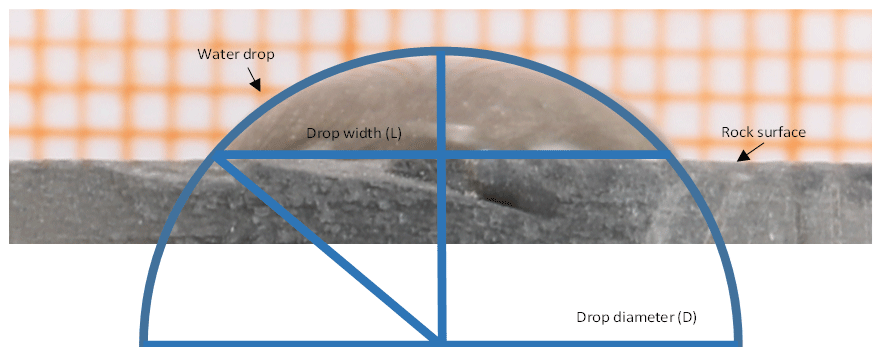
For the contact angle measurement, core plugs were probed, and fresh-cut plug faces were polished for a smooth surface. The contact angle was defined in an air-water-flat surface system for dry core samples. Measurements were conducted in the “native” state of the rock saturation and after cleaning with chloroform in the Soxhlet unit. A drop of distilled water is dripped from a pipette onto a flat surface of the cylindrical core sample (flat and homogeneous). The photo recording of the droplet shape on the cylinder face is performed 10 s after application (Fig. 1). Using ImageJ Java software package, the diameter and length of the drop are determined, and the wetting contact angle is calculated by the following equation for the idealized rock surface:
where α is the wetting angle, L is the drop width, and D is the diameter of the drop.
2.2.4 Adsorption method
The vapor adsorption method is convenient for the simultaneous study of a large number of crushed core samples of rock. The sample of 20–30 g is crushed to pieces with a 3–5 mm mesh size and divided into two equal probes (Gudok and Bogdanovich, 2007a). Samples are dried to constant weight at 75 ∘C in the vacuum; the first probe is extracted in a Soxhlet apparatus with the chloroform to remove the soluble part of OM, while the second probe remains in the same state. Thus, we observe simultaneous vapor adsorption on two probes of the same origin: the first probe is “native” or as-received state, whereas the mobile hydrocarbons and soluble components are removed from the second probe during extraction. For vapor adsorption, both probes are located into desiccators containing salt solutions that maintain a precise relative humidity at a constant temperature of 25.0 ∘C ± 0.2. Monitoring in changing the mass of samples during the experiment is conducted 1–2 times a week until the weight of the sample is stabilized; recalculation of the adsorbed vapor is carried out according to the formula:
where md is the weight of dry rock sample; mad is the weight of the sample with adsorbed water at a given value of relative humidity. Based on the obtained values, adsorption isotherms are constructed for each sample. The wettability coefficient of the rock surface is determined by the ratio:
where aex and anex are the adsorption values on extracted and non-extracted surfaces, respectively.
2.2.5 Rock pretreatment
The goal of the core extraction is to remove the soluble part of OM in the rock by solvent cleaning. In the current study, core extraction was conducted for core plugs and core chips using chloroform in the Soxhlet apparatus. The average solvent extraction time was equal to 72 h (for core chips) and 150 h (for core plugs). The core saturation procedure consisted of vacuuming the samples, capillary imbibition, and injection of the fluid (kerosene and brine model) for a 72 h period.
3.1 Rock characterization
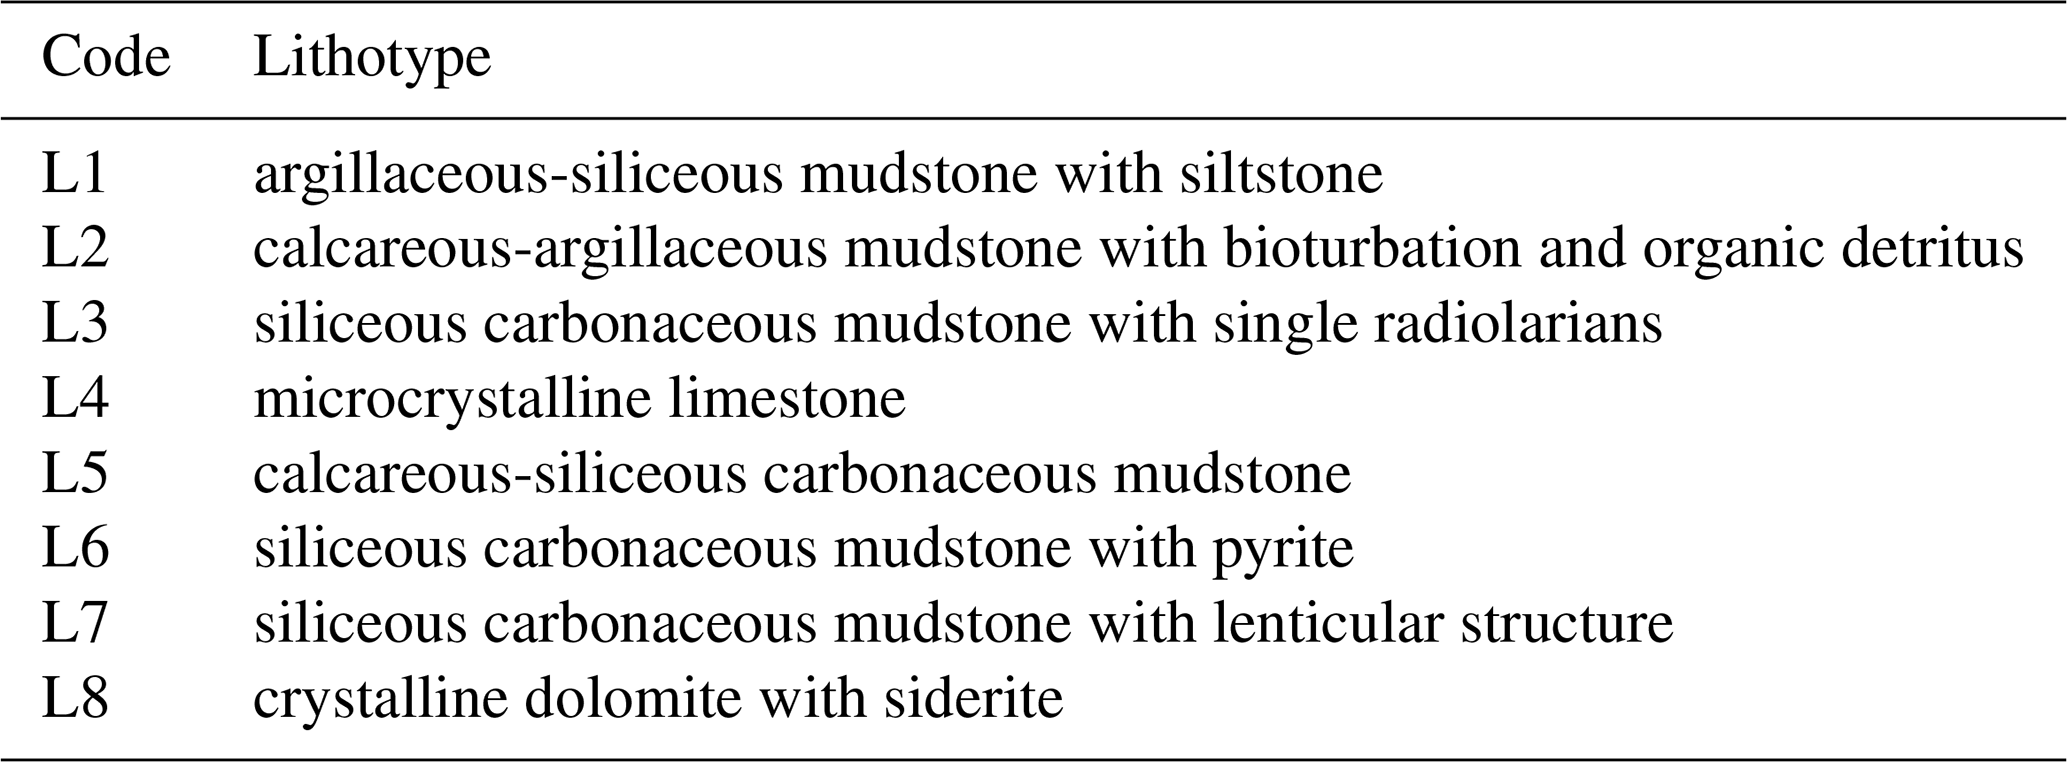
By standard gas porosity and permeability measurement, we observed that the open porosity of target collection falls into the 0.5 %–7.1 % range, and permeability varies from 0.01 to 0.7 mD. Petrographical characterization of thin sections and XRD showed that according to the classification proposed by Lazar et al. (2015), the target collection of ABG rock samples are composed of different types of siliceous mudstones, which are enriched with OM. Samples are mostly homogenous in mineral composition; therefore, lithotyping was performed on the basis of specific peculiarities such as TOC, texture, pyrite fraction, bioturbation, and presence of carbonates. The main component of the rock is clay minerals ranging in 40 %–58 % diapason with 51 % on average; the second rock-forming mineral is quartz – 25 %–45 % with an average value of 31 %. Other components are carbonate minerals (<5 %) and pyrite (<5 %). We have differentiated the sample collection into eight main lithotypes (Table 1). Rock-Eval analysis has shown that the content of organic carbon (TOC) is moderately high and varies between 1.4 % w.t.–11 % w.t., with an average of 5.75 % w.t. in organic-rich layers.
The dominant difference along the section is the texture of the organic matter in the rock. We have identified three primary morphologies of OM present in the investigated set: dispersed, laminated, and in the form of inclusions. To illustrate the microtextural details of OM in the rock, we have selected three thin sections and SEM images corresponding to the same category of OM appearance (Fig. 2). Category A is characterized by OM distributed by layers in the form of frequent extended thin veins and lenses (Fig. 2a); their size reaches a width of up to 0.05 mm, a length of up to 1–2 mm. Type B corresponds to samples in which the OM is distributed unevenly in the form of inclusions of 0.05–0.1 mm in size (Fig. 2b) and rarely in the form of single veins. Finally, type C is a group of samples with a uniform finely dispersed OM distributed over the rock (Fig. 2c). It is essential that OM may be present in all distinct forms in one sample, but we have observed that almost in all cases, one of the mentioned textures significantly dominates.
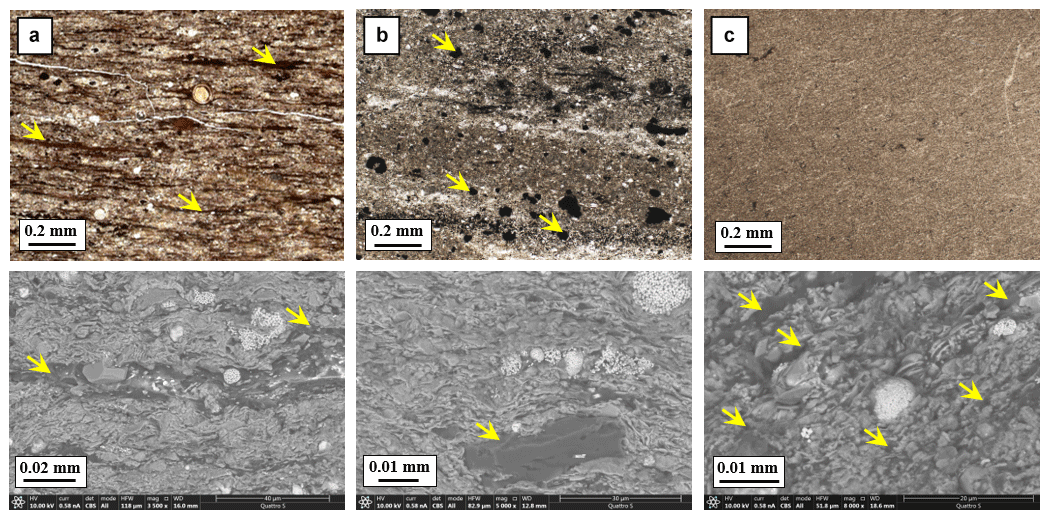
Figure 2Primary shapes of OM in rock samples by results of thin section microscopy and SEM (arrows indicate the OM inclusions, C – dispersed OM promotes brown color).
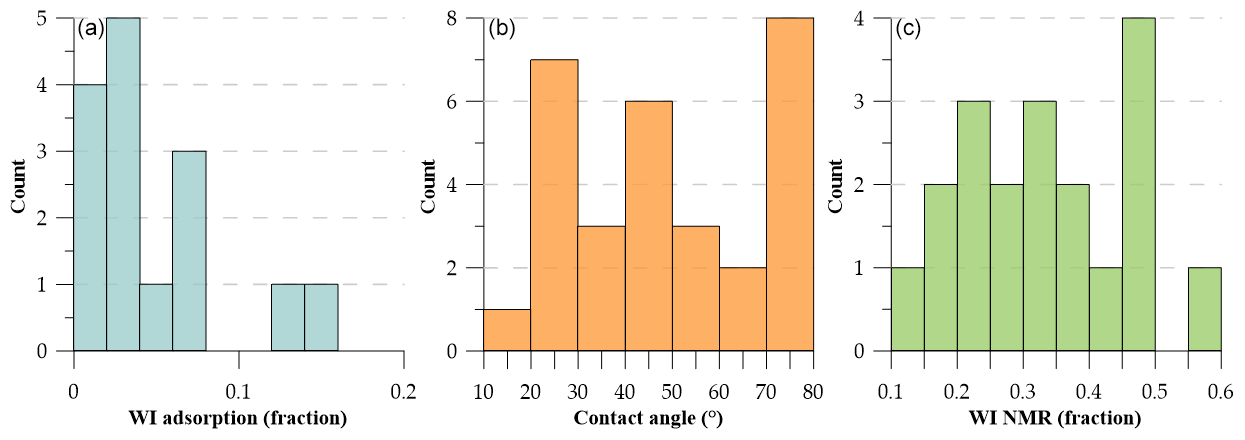
Figure 3Results of wettability determination by (a) vapor adsorption, (b) contact angle method and (c) NMR.
3.2 Wettability determination
In the framework of the current case study, we have applied three laboratory techniques selected on the basis of the literature review and our previous experience (Bogdanovich et al., 2017; Borisenko et al., 2017).
In this experiment, 20 samples of ABG rocks before and after extraction were examined by vapor adsorption isotherms. The wettability index was estimated according to Eq. (1) and illustrated the predominantly hydrophilic surface of the rock (Fig. 3a) with a WI ranging from 0.003 to 0.144. Results of wettability estimation by vapor adsorption significantly depend on the cleaning of the rock: duration, solvent, and overall quality of OM extraction. Therefore, the solvent cleaning removes only the soluble part of OM, which leads to the similarity of the adsorption isotherms for cleaned probes, i.e., result in low values of wettability index and cause uncertainty in wettability estimation.
The wetting contact angle was estimated for the set of 30 core plugs (Fig. 3b). Measurements were conducted before and after the core solvent extraction. Results show that the wettability angle of the core in the as-received state varies in the range of 19–79∘, which indicates the hydrophilic rock surface. The angle cut-offs of 0 and 90∘ were established for idealized rock surface; therefore, new criteria were set to describe the hydrophilicity of the rock surface (Fanchi, 2002). We implement the differentiation for strong water-wet (SWW if ∘), moderate water-wet (MWW if ), and weak water-wet or neutral-wet (NW if ) characterization of the surface.
In the framework of NMR analysis, the T2 relaxation curve was derived for 25 measured core plugs. Due to high-pressure manipulations, few samples (6 plugs) disintegrated during solvent extraction and the following saturation. Thus, NMR wettability was estimated for 19 core plugs in total (Fig. 3c). Wettability index (WI) estimated, according to Eq. (2), varied from 0.15 to 0.58, with an average of 0.33, indicating the prevailing water-wet rock behavior. Comparable to contact angle interpretation, we have subcategorized the SWW (0–0.25), MWW (0.25–0.5), and WWW or neutral-wet (NW > 0.5) groups.
All utilized methods characterized the target core collection as dominantly water-wet rock, varying from SWW to NW for various samples. Published works on Bazhenov Formation noticed mixed or mosaic behavior of the rock wettability (Bogdanovich et al., 2017). It occurs because of the complicated lithological structure and geochemical properties of the OM, mainly due to the high amount of kerogen. For high-porous media, it can be related to the minerals that make up the rock, for instance, quartz, clay, and carbonate minerals (Song et al., 2018). For shale rock, the wettability depends on both the rock matrix and OM properties, including lithological characteristics (mineral composition, structure, and texture), amount of kerogen, its maturity, and type. Target shale samples are characterized with low-to-moderate maturity OM with Tmax values from 429 to 442 ∘C with an average of 437 ∘C, which corresponds to 0.5 %–0.85 % Ro.
Within the scope of the current communication, we research the correlations between the experimental results and OM content (TOC), rock type, and OM morphology. The main rock-forming components of the investigated samples are clay minerals, quartz, and OM. In our case, the amount of clay minerals and quartz is quite stable from sample to sample (Sect. 3.1). Relative homogeneity in mineral composition means that clays and quartz should not significantly influence wettability. In most cases, OM is characterized as hydrophobic, which means that its variations may cause significant differences in wettability coefficient (Iglauer, 2017). OM has variable morphologies in different samples, which leads to serious inconsistency between measurement techniques. For example, the horizontal lenticular texture of the OM is the reason for anisotropy of shales (Yan and Han, 2013; Sayers, 2013), which appears in many petrophysical properties (permeability, acoustic properties, etc.), and wettability is not an exception.
Firstly, we have examined the influence of TOC and rock lithotype on obtained wettability indices. Results of water vapor adsorption on the target rock samples showed a robust water-wet surface. The cross-plots illustrate no clear correlation between the adsorption wettability index and TOC (Fig. 4a). It may be reasoned by a moderate amount of OM (including insoluble kerogen), which does not allow the full removal of OM during solvent extraction. Nevertheless, Fig. 4a demonstrates that sample lithotype is a significant factor in the current discussion. For instance, increasing wettability index with growing value for TOC is clearly shown for L2 lithotype – calcareous-argillaceous mudstone with bioturbation and organic detritus. Other lithotypes, namely L6, L1, and L3–L5, show similar (for a certain lithotype) behavior, but the number of measured points is not enough to highlight and confirm the trend. In summary, only microcrystalline limestone (L4) has relatively high WI, which may be explained by the influence of its calcareous composition. It is important to note that the most kerogen-enriched lithotypes L6 and L3 show the opposite trend that is reasoned by the presence of non-removed solid OM in the rock (kerogen), which remains after solvent cleaning.
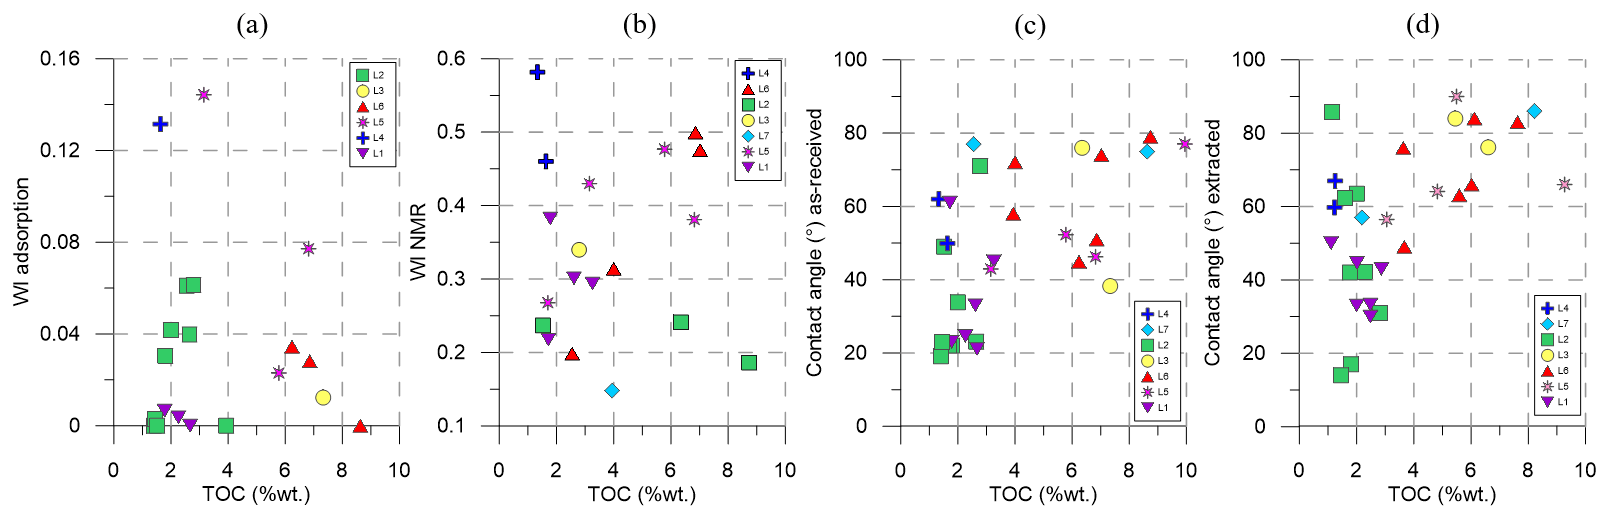
Figure 4Crossplots showing correlations of TOC vs. (a) WI adsorption, (b) WI NMR, (c) contact angle in as-received state and (d) contact angle for extracted rock with indication of the lithotype.
According to the published data, the contact angle for shale rock may vary from 11 to 103∘ (Sheng, 2018; Siddiqui et al., 2018). For example, Lower Silurian Longmaxi shale samples are characterized by an 11–39∘ contact angle (strongly water-wet). The authors explain the reason behind WW behavior by mineral composition and porosity. In contrast, Duvemay shale samples have a much higher value of contact angle: 65–103∘. The authors conclude that such values might be conditioned by a high amount of OM and the presence of the hydrophobic pores in OM. Our case encompasses these to extremes due to significant variations in OM content and diversity of OM distribution. Results of contact angle measurements (Fig. 4c and d) show that in the majority of cases, increasing TOC leads to a higher wettability angle for the target collection. Based on the lithotypes of the rock samples, we can differentiate the groups with similar behavior – distinct clusters for L1, L2, L5, and L6. After extraction (Fig. 4d), we observe the visible effect of OM removal on L1, L3, L5, and L6 samples, which initially contained a moderate amount of OM. Hence, the general linear trend after solvent extraction does not change significantly and is characteristic mainly for L5 and L6 – both carbonaceous mudstone – the slope sharpens after the extraction and therefore confirms the importance of mineral composition as one of the wettability forming factors. L1–L3 clusters show low sensitivity for TOC values with the values of contact angle in the range of 10–80∘.
We attempted to highlight the clusters for NMR measurements (Fig. 4b) by the same lithotyping classification. Similar to the contact angle results, L5 and L6 show a linear dependence of TOC and WI. The distinct groups are formed by L1, L2, and L4; L4 (limestone) again tends to have the most hydrophobic character. The strongest hydrophilicity or strong water-wet rocks include L2 and L7 – argillaceous and siliceous mudstones.
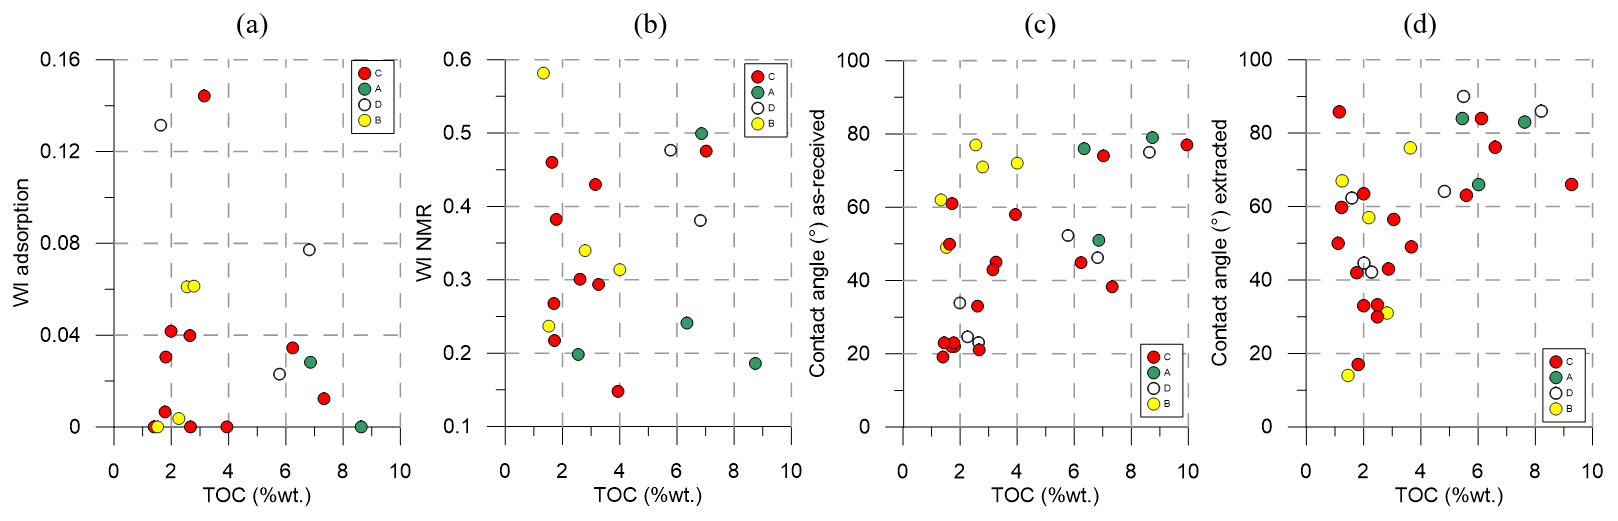
Figure 5Crossplots showing correlations of TOC vs. (a) WI adsorption, (b) WI NMR, and vs. contact angle for rock in (c) as-received state and (d) extracted state with indication of the OM type.
In Fig. 4d, we can see that the increasing value of the TOC content (>3.5 % w.t.) results in a higher contact angle. We suggest this happens due to the increasing role of TOC content in wettability behavior with its increasing. At the low TOC, wettability is primarily controlled by rock lithotype and OM morphology (texture). Xuan Liu (Liu et al., 2018) reported that TOC content is one of the most significant factors in shale hydrophilic properties. They concluded that if TOC is less than 1.5 % w.t., then the main controlling factor is clay mineral content, and at higher TOC (>1.5 % w.t.) OM is uniformly developed and distributed. In our research, we have noted that wettability depends not only on the amount of TOC but its morphology in the shales.
Secondly, in addition to the rock type and mineral composition, we have distinguished three distinct categories of OM occurrence by means of optical and electron microscopy (Fig. 2a–c). The samples where two categories prevail uniformly were marked as category D. To analyze the possible impact of OM morphology on wettability results, we have plotted the TOC vs. WI adsorption/WI NMR/Contact angle correlations indicating the predominant type of OM occurrence for each measured point (Figs. 5 and 6). For adsorption (Fig. 5a) and NMR results (Fig. 5b), we observe the poor differentiation for all three categories; the most distinct ones are samples, which belong to A cluster (layered distribution) – with an inherently high value of TOC and low sensitivity of the WI to the TOC value. The mixed occurrence of categories B (large inclusions) and C (dispersed distribution) may be reasoned by the technique specifics. In the case of water adsorption, we deal with the core matrix in the form of the crushed core, where the influence of OM texture is minimized. For NMR analysis, we utilize the standard core plugs and provide an estimation of the wettability index as an integral characteristic.
The influence of OM distribution form is demonstrated on measured contact angles. For the rock in the as-received state, we can distinguish the separate clusters for A–C categories with a slight overlapping of the OM forms in the zone of high TOC values (Fig. 5c). After the solvent cleaning, a certain amount of OM is removed, and it results in a more homogeneous distribution of point (Fig. 5d). Primarily, the OM is extracted out of the thick layers (A) and relatedly large inclusions (B), which affect the previous correlation and remove the focus to rock matrix as a rock wettability forming factor. The sensitivity of results to the core extraction may also be caused by the physical principles of the technique, which is based on the surface wettability measurement. Despite the routine procedure of solvent extraction, core plug faces are most exposed to the solvent.

The results of evaluating the ABG rock wettability by the combination of laboratory techniques are illustrated in Fig. 6. The wettability indices obtained by the water adsorption method correspond to a strongly water-wet surface over the entire section, which does not contradict previous studies of similar rock types (Bogdanovich et al., 2017). Hence, the adsorption isotherms and close-to-zero values of the wettability index confirm that the application of this technique is limited due to the remaining kerogen in rock. Contact angle and NMR wettability techniques exhibit the same water-wet characteristic, but their results (wettability indices) describe the rock surface in a broader range of wetting behavior. Due to the complexity of the rock matrix, OM properties, and high anisotropy of shales, labeling the rock as fully water-wet or hydrophilic leads to high inaccuracy in rock characterization. This classification is used to detail the wettability of the rock surface by results of contact angle measurement and NMR. In wettability determination, the contact angle may vary on the different core planes with respect to the bedding of OM. In our case, the contact angle was measured on the plane parallel to the bedding. OM inclusion on that plane occupies more area in comparison to the plane perpendicular to bedding. As a result, rock wettability is biased toward hydrophobic behavior. We suggest that this effect is illustrated for the rocks with lenticular OM and characterized with the highest contact angle, whereas in contrast, according to the NMR technique (where the result does not depend on the sample orientation), these samples are characterized with the lowest WI.
In this study, the experimental results of the Abalak-Bazhenov rocks wettability characterization by a number of techniques (contact angle, adsorption, and NMR) are presented. In summary, we can highlight the main findings of the conducted research:
-
All methods provided an initial assessment of the shale rock wettability. The results showed mainly a water-wet and neutral wettability of the section. For target rock samples, the surface wettability turned out to be significantly sensitive to the rock lithology and OM morphology in the rock.
-
The vapor adsorption technique involves core extraction and depends on the quality of OM removal. Standard protocols of solvent cleaning on the crushed core do not allow removal of the kerogen and result in distorted data on measured points for organic-rich rocks. Therefore, the application of this technique for shales is limited, given the current cleaning procedure and requires the acidation-based kerogen isolation from the shale sample.
-
The calculation of the wetting angle enabled the detailed characterization of the rock wettability before and after the extraction. We observed the near-linear correlations between the wetting angle and the content of organic carbon (TOC), which is relevant for Abalak-Bazhenov Formation rocks of certain lithotypes (L5 and L6 – calcareous-siliceous carbonaceous mudstone and siliceous carbonaceous mudstone with pyrite). The lithological description of thin sections and OM morphological categories were applied to highlight the clusters with similar behavior.
-
NMR obtained index provides the integral wettability characteristic for the entire core plug. This technique showed low sensitivity for clusters of rock lithotypes and OM categories and mostly characterized the rock as a medium to strong water-wet.
-
OM morphology mostly influences the results obtained by the contact angle technique: the dominance of lenticular OM in the sample may be a reason for hydrophobicity overestimation due to rock anisotropy. In the case of inclusions and dispersed OM, good conformity was observed for results obtained with different methods.
Data is available upon request.
AM, TK, and SB performed experimental investigations. NB and AC supervised the project. NB and SR helped to organize the experimental workflow. AM, TK, NB, AC and SB contributed to the analysis of experimental results. AM and TK took the lead in writing the manuscript in consultation with AC, NB, and SR. All authors reviewed the manuscript.
The authors declare that they have no conflict of interest.
This article is part of the special issue “European Geosciences Union General Assembly 2020, EGU Division Energy, Resources & Environment (ERE)”. It is a result of the EGU General Assembly 2020, 4–8 May 2020.
The authors would like to express gratitude to their colleagues Elena Kozlova and Philipp Denisenko for help in performing experiments and fruitful discussions. The authors also thank Mikhail Spasennykh for his support in the conduct of this research. Finally, the authors owe to anonymous peer reviewers for their time and effort to make this paper better.
This paper was edited by Johannes Miocic and reviewed by Bin Pan and one anonymous referee.
Abdallah, W., Buckley, J. S., Carnegie, J., Edwards, J., Fordham, B. H. E., Graue, A., Habashy, T., Seleznev, N., Signe, C., Hussain, H., Montaron, B., and Ziauddin, M.: Fundamentals of wettability, Oilfield Rev., 19, 44–61, 2007.
Abragam, A.: The principles of nuclear magnetism, The International series of monographs on physics, Clarendon Press, Oxford, 599 pp., 1961.
Ahmed, U. and Meehan, D. N.: Unconventional oil and gas resources: exploitation and development, CRC Press, Boca Raton, 2016.
Amott, E.: Observations relating to the wettability of porous rock, Society of Petroleum Engineers, T. AIME, 216, 156–162, 1959.
Balushkina, N. S., Kalmykov, G. A., Belokhin, V. S., Khamidullin, R. A., and Korost, D. V.: Siliceous reservoirs of the Bazhenov formation, the Sredny Nazym Oil Field, and the structure of their pore space, Moscow Univers. Geol. Bull., 69, 91–100, https://doi.org/10.3103/S0145875214020033, 2014.
Bloembergen, N., Purcell, E. M., and Pound, R. V.: Relaxation effects in nuclear magnetic resonance absorption, Phys. Rev., 73, 679–712, https://doi.org/10.1103/PhysRev.73.679, 1948.
Bogdanovich, N. N., Borisenko, S. A., Kozlova, E. V., Spasennykh, M. Y., and Rudakovskaya, S. Y.: Mosaic Hydrophobization of the Surface of Organic-Mineral Matrix from Rocks of Bazhenov Formation (Russian), in: SPE Russian Petroleum Technology Conference, 16 October 2017, Moscow, Russia, 2017.
Borisenko, S., Bogdanovich, N. N., Kozlova, E., Spasennykh, M., and Zagranovskaya, D. E.: Estimating lyophilic properties of the Bazhenov formation rocks by adsorption and NMR methods, Neftyanoe khozyaystvo – Oil Industry, Moscow, Russia, 12–16, https://doi.org/10.24887/0028-2448-2017-3-12-16, 2017.
Callaghan, P.: Principles of Nuclear Magnetic Resonance Microscopy, Clarendon Press, Oxford, 1991.
Donaldson, E. C., Thomas, R. D., and Lorenz, P. B.: Wettability Determination and Its Effect on Recovery Efficiency, SPE-2338-PA, Society of Petroleum Engineers, Richardson, TX, USA, 9, 13–20, https://doi.org/10.2118/2338-PA, 1969.
Espitalie, J. and Bordenave, M.: Rock-Eval Pyrolysis, Editions Technip, Paris, France, 237–261, 1993.
Fanchi, J. R.: Chapter 7 – Measures of Rock-Fluid Interactions, in: Shared Earth Modeling, edited by: Fanchi, J. R., Butterworth-Heinemann, Woburn, 108–132, 2002.
Foley, I., Farooqui, S. A., and Kleinberg, R. L.: Effect of Paramagnetic Ions on NMR Relaxation of Fluids at Solid Surfaces, J. Magnet. Reson. Ser. A, 123, 95–104, https://doi.org/10.1006/jmra.1996.0218, 1996.
Gudok, N. S. and Bogdanovich, N. N.: Experimental methods of reservoir physics, Sputnik, Moscow, 592 pp., 2007a.
Guiltinan, E. J., Cardenas, M. B., Bennett, P. C., Zhang, T., and Espinoza, D. N.: The effect of organic matter and thermal maturity on the wettability of supercritical CO2 on organic shales, Int. J. Greenhouse Gas Control, 65, 15–22, https://doi.org/10.1016/j.ijggc.2017.08.006, 2017.
Iglauer, S.: CO2–Water–Rock Wettability: Variability, Influencing Factors, and Implications for CO2 Geostorage, Account. Chem. Res., 50, 1134–1142, https://doi.org/10.1021/acs.accounts.6b00602, 2017.
Ivanova, A. A., Miturev, N. A., Shilobreeva, S. N., and Cheremisin, A. N.: A review of experimental methods for studying the wetting properties of oil reservoir rocks, Earth Phys., 135–149, https://doi.org/10.31857/s0002-333720193135-149, 2019.
Jagadisan, A. and Heidari, Z.: Experimental Quantification of the Effect of Thermal Maturity of Kerogen on Its Wettability, SPE-195684-PA, Society of Petroleum Engineers, Richardson, TX, USA, 22, 1323–1333, https://doi.org/10.2118/195684-PA, 2019.
Kontorovich, A. E., Moskvin, V. I., Bostrikov, O. I., Danilova, V. P., Fomin, A. N., Fomichev, A. S., Kostyreva, E. A., and Melenevsky, V. N.: Main oil source formations of the West Siberian Basin, Petrol. Geosci., 3, 343–358, https://doi.org/10.1144/petgeo.3.4.343, 1997.
Lazar, O. R., Bohacs, K. M., Schieber, J., Macquaker, J. H., and Demko, T. M.: Mudstone Primer: Lithofacies variations, diagnostic criteria, and sedimentologic-stratigraphic implications at lamina to bedset scales, SEPM – Society for Sedimentary Geology, Broken Arrow, OK, USA, 2015.
Liu, F., Yang, H., Chen, T., Zhang, S., Yu, D., Chen, Y., and Xie, Q.: Direct Evidence of Salinity and pH Effects on the Interfacial Interactions of Asphaltene-Brine-Silica Systems, Molecules, 25, 1214, https://doi.org/10.3390/molecules25051214, 2020.
Liu, X., Zhang, J., Liu, Y., Huang, H., and Liu, Z.: Main factors controlling the wettability of gas shales: A case study of over-mature marine shale in the Longmaxi Formation, J. Nat. Gas Sci. Eng., 56, 18–28, https://doi.org/10.1016/j.jngse.2018.05.017, 2018.
Morrow, N. R.: Wettability and Its Effect on Oil Recovery, SPE-21621-PA, Society of Petroleum Engineering, Richardson, TX, USA, 42, 1476–1484, https://doi.org/10.2118/21621-PA, 1990.
Odusina, E. O., Sondergeld, C. H., and Rai, C. S.: NMR Study of Shale Wettability, in: SPE Unconventional Resources Conference, 1 January 2011, Calgary, Alberta, Canada, 2011.
Ogunberu, A. L. and Ayub, M.: The Role of Wettability in Petroleum Recovery, Petrol. Sci. Technol., 23, 169–188, https://doi.org/10.1081/LFT-200028145, 2005.
Pan, B., Li, Y., Zhang, M., Wang, X., and Iglauer, S.: Effect of total organic carbon (TOC) content on shale wettability at high pressure and high temperature conditions, J. Petrol. Sci. Eng., 193, 107374, https://doi.org/10.1016/j.petrol.2020.107374, 2020.
Prishchepa, O. M., Averianova, O. Y., Ilyinskiy, A. A., and Morariu, D.: Tight oil and gas formations – Russia's hydrocarbons future resources, VNIGRI, Saint-Petersburg, Russia, 12–24, 2014.
Ryzhkova, S. V., Burshtein, L. M., Ershov, S. V., Kazanenkov, V. A., Kontorovich, A. E., Kontorovich, V. A., Nekhaev, A. Y., Nikitenko, B. L., Fomin, M. A., Shurygin, B. N., Beizel, A. L., Borisov, E. V., Zolotova, O. V., Kalinina, L. M., and Ponomareva, E. V.: The Bazhenov Horizon of West Siberia: structure, correlation, and thickness, Russ. Geol. Geophys., 59, 846–863, https://doi.org/10.1016/j.rgg.2018.07.009, 2018.
Safari, M., Rahimi, A., Gholami, R., Permana, A., and Siaw Khur, W.: Underlying mechanisms of shale wettability alteration by low salinity water injection (LSWI), in: Journal of Dispersion Science and Technology, Taylor & Francis, Oxfordshire, UK, 1–9, https://doi.org/10.1080/01932691.2020.1813156, 2020.
Sayers, C. M.: The effect of kerogen on the elastic anisotropy of organic-rich shales, Geophysics, 78, D65–D74, https://doi.org/10.1190/geo2012-0309.1, 2013.
Sheng, J. J.: Discussion of shale rock wettability and the methods to determine it, Asia-Pac. J. Chem. Eng., 13, e2263, https://doi.org/10.1002/apj.2263, 2018.
Siddiqui, M. A. Q., Ali, S., Fei, H., and Roshan, H.: Current understanding of shale wettability: A review on contact angle measurements, Earth-Sci. Rev., 181, 1–11, https://doi.org/10.1016/j.earscirev.2018.04.002, 2018.
Song, X., Qin, Y., Ma, H., Wu, M., and Ma, L.: The effect of sedimentary microfacies on wettability of tight sandstone in coal-bearing strata: a case from Ordos Basin, China, Petrol. Sci. Technol., 36, 1958–1967, https://doi.org/10.1080/10916466.2018.1519577, 2018.
Straley, C., Rossini, D., Vinegar, H. J., Tutunjan, P., and Morriss, C. E.: Core Analysis by Low-Field NMR, SPWLA-1997-v38n2a4, Society of Petroleum Engineering, Richardson, TX, USA, 38, 84–94, 1997.
Thyne, G.: A review of the measurement of wettability, Science Based Solution Report based on a report for Sandia National Laboratory, 1–27, available at: https://esalinity.com/2015/10/06/a-review-of-the-measurement-of-wettability/ (last access: December 2020), 2015.
Valori, A. and Nicot, B.: A Review of 60 Years of NMR Wettability, SPWLA-2019-v60n2a3, Society of Petrophysicists and Well-Log Analysts, Houston, TX, USA, 60, 255–263, 2019.
Yan, F. and Han, D.-H.: Measurement of elastic properties of kerogen, in: SEG Technical Program Expanded Abstracts 2013, SEG Technical Program Expanded Abstracts, Society of Exploration Geophysicists, Tulsa, OK, USA, 2778–2782, 2013.
Yang, R., He, S., Hu, Q., Zhai, G., Yi, J., and Zhang, L.: Comparative Investigations on Wettability of Typical Marine, Continental, and Transitional Shales in the Middle Yangtze Platform (China), Energ. Fuels, 32, 12187–12197, https://doi.org/10.1021/acs.energyfuels.8b02805, 2018.