 | 27 Nov 2020
Clustering, Connectivity and Flow Responses of Deterministic Fractal-Fracture Networks
Ankur Roy
It is well known that fracture networks display self-similarity in many cases and the connectivity and flow behavior of such networks are influenced by their respective fractal dimensions. In the past, the concept of lacunarity, a parameter that quantifies spatial clustering, has been implemented by one of the authors in order to demonstrate that a set of seven nested natural fracture maps belonging to a single fractal system, but of different visual appearances, have different clustering attributes. Any scale-dependency in the clustering of fractures will also likely have significant implications for flow processes that depend on fracture connectivity. It is therefore important to address the question as to whether the fractal dimension alone serves as a reasonable proxy for the connectivity of a fractal-fracture network and hence, its flow response or, if it is the lacunarity, a measure of scale-dependent clustering, that may be used instead. The present study attempts to address this issue by exploring possible relationships between the fractal dimension, lacunarity and connectivity of fractal-fracture networks. It also endeavors to study the relationship between lacunarity and fluid flow in such fractal-fracture networks. A set of deterministic fractal-fracture models generated at different iterations and, that have the same theoretical fractal dimension are used for this purpose. The results indicate that such deterministic synthetic fractal-fracture networks with the same theoretical fractal dimension have differences in their connectivity and that the latter is fairly correlated with lacunarity. Additionally, the flow simulation results imply that lacunarity influences flow patterns in fracture networks. Therefore, it may be concluded that at least in synthetic fractal-fracture networks, rather than fractal dimension, it is the lacunarity or scale-dependent clustering attribute that controls the connectivity and hence the flow behavior.
- Article
(1834 KB) - Full-text XML
-
Supplement
(128 KB) - BibTeX
- EndNote


In nature, there are many fracture networks that display self-similarity such that their geometries may be described by a single fractal dimension as shown by Barton and La Pointe (1995), Berkowitz and Hadad (1997) and Roy et al. (2007). Such fractal dimensions of fracture networks have been related to their physical properties such as the percolation threshold (Zhang and Sanderson, 1994) and dynamic processes such as flow and transport (Doughty and Karasaki, 2002). However, it should be noted that two or more fracture networks with the same fractal dimension often look very different from each other and such visual differences are attributed to the differences in scale-dependent fracture clustering (Roy et al., 2010). Any scale-dependency in the clustering of fractures will also likely have significant implications for flow processes that depend upon fracture connectivity.
In a continuum percolation model with random line placement, all connectivity is achieved through line interconnections (X-nodes) and two ends of each line terminated as isolated line tips (I-nodes). In opening-mode fracture systems many fractures terminate as abutments/splays against other fractures to form connections with a Y geometry. The topological connectivity of any fracture network is defined by the contribution of intersections (X nodes), abutments (Y nodes) and isolated line tips (I nodes).
While connectivity of a fracture network indicates whether or not any fluid or tracer will move from one point of the network to another, evaluating the flow response is indispensable for understanding how long will it take for a volume of fluid to move or how much of such fluid can move in a given time-period. In petroleum related research such responses are often quantified by the “recovery factor” which is a function of the displacement mechanism. We use Trace3D, (Datta-Gupta and King, 2007), a Darcy-based streamline simulator, in simulating flow in fracture networks. In order to implement Trace3D in our research, it is considered that fractures are highly porous and permeable zones and the matrix has nearly zero porosity and permeability. This model ensures that flow occurs only through the fractures.
The concept of lacunarity is based on multi-scale analysis of spatial or temporal dispersion (Plotnick et al., 1996). In simple words, characterization of the distribution of spaces or gaps in any pattern as a function of scale can be achieved by estimating the lacunarity value. In the case of fracture networks, it can be employed to quantify the degree of fracture clustering at a given spatial resolution as demonstrated by Roy et al. (2010) who implemented this parameter in distinguishing between fracture networks with the same fractal dimension.
In this research, we explore if lacunarity can serve as a reasonable proxy for the connectivity and flow behavior of a fractal-fracture network instead of the fractal dimension. The present study attempts to address this issue by studying the scale-dependent clustering behavior (lacunarity), connectivity and flow response of a set of synthetically generated deterministic fractal-fracture patterns. This set of deterministic synthetic fractal-fracture models are generated using the method described in Roy et al. (2007) at different iterations, i=1 to 8, all of which have the same theoretical fractal dimension. The connectivity and lacunarity of these networks are calculated and compared to each other. The fluid recovery values are obtained from simulating flow through these networks. The results show that differences in clustering attributes lead to differences in connectivity values and flow behavior, even between networks that may have the same fractal dimension.
2.1 Generating Fractal-Fracture Networks
A set of deterministic fractal-fracture networks at different iterations are generated as described in Roy et al. (2007). These are essentially a set of Sierpinski lattices that comprise self-similar line segments as shown in Fig. 1. Three parameters are used in generating these lattices: the scale factor, b, the iteration level, i, and the initial number of un-fractured blocks, n. As seen in Fig. 1, a sequence of hierarchically fractured patterns are generated by selecting the spatial locations of the fractured and un-fractured blocks in a deterministic manner. In our particular case, Fig. 1a is the initiator that divides the entire area into blocks and Fig. 1b is the generator that shows how one such block (thus n=1), the upper left corner, is left un-fractured and scaled down versions of the initiator is used for populating the remaining three blocks. Since this is a deterministic fractal, at each iteration starting from i=2 (Fig. 1c), the un-fractured block is placed at the exact location (upper-left corner in this case) as in the generator.
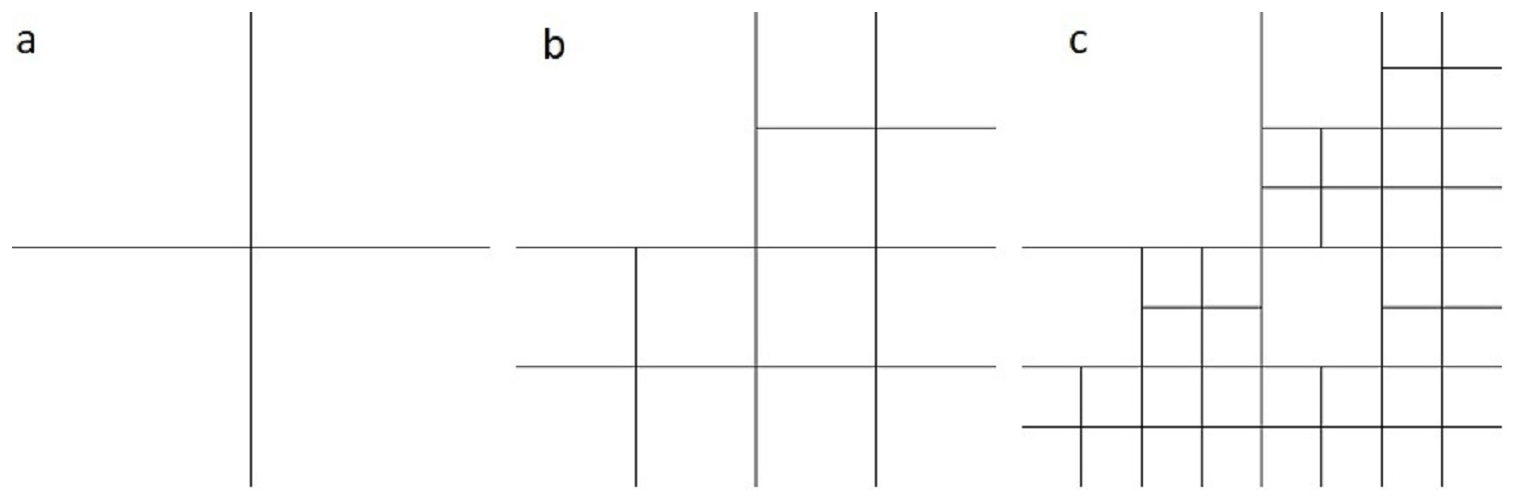
Figure 1Generating deterministic fractal-fracture networks, initiator (i=0), generator (i=1), and i=2 (modified from Roy et al., 2007).
All the models described here have the same set of values for b and n where, b=2, n=1, the theoretical box-counting fractal dimension, . Since D is independent of the iteration, i, all of the patterns have the exact same theoretical fractal dimension. The empirical box-counting values of this dimension as documented in Roy et al. (2007) stabilize at i=3 and closely approximates the theoretical D value as seen in Fig. 2.
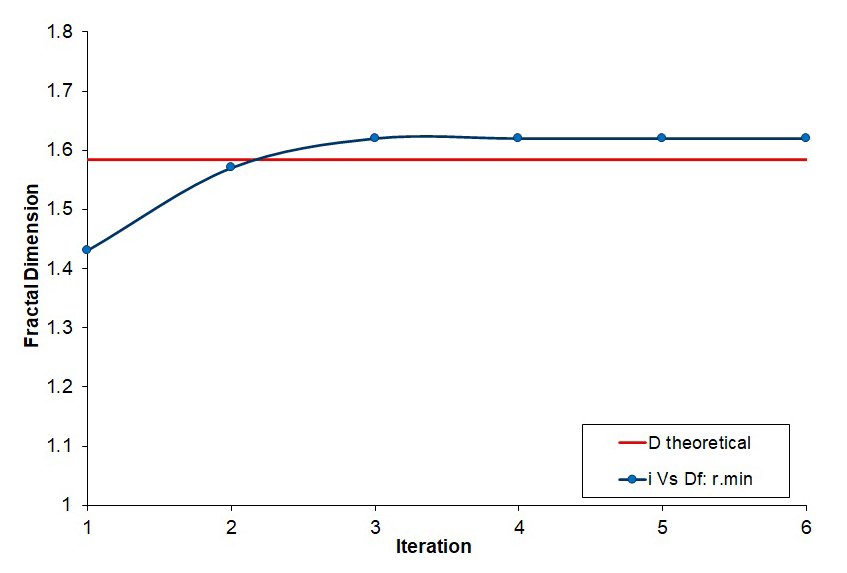
Figure 2Variation of box-counting fractal-dimension with iteration for networks, i = 1–6 (modified from Roy et al., 2007).

From a visual inspection of Fig. 1 and especially, Fig. 3 it is apparent that as the number of iterations, i is increased from 1 to 2 and 4 to 6 respectively, the square domain which remains at the same size, is populated with more and more fractures. Hence, while the patterns still have the same fractal dimension, the fracture intensity increases with increase in iteration. This leads to a possible increase in the scale-dependent clustering attribute of the fracture networks as well as that in their topological connectivity and hence, the fluid recovery. These parameters are discussed in some detail in the next sections.
2.2 Scale-dependent Clustering of Fracture Networks: Lacunarity
Lacunarity is a parameter that characterizes the distribution of spaces or gaps in a pattern as a function of scale and quantifies the degree of clustering at a given spatial resolution. In essence, lacunarity is a scale-dependent measure of heterogeneity in datasets (Plotnick et al., 1993). Quantifying lacunarity as a function of scale can be achieved by using the gliding-box algorithm (Allan and Cloitre, 1991; Plotnick et al., 1996). This algorithm slides a window or box of a given length, r, translated in increments of a chosen unit length across the pattern. The box-size, r, is generally a multiple of this assigned unit length. The interrogator box searches for occupied sites in the pattern at each step and counts them. The total number of steps, N(r), required to cover the entire pattern is given by:
Here, E is the Euclidean dimension of the pattern and rt is the total length of the set. The first and second moments of the distribution of the number of occupied sites at each step, Z1(r), and Z2(r) respectively, are given by (Plotnick et al., 1996):
Here, s(r) and are the arithmetic mean and variance respectively. The lacunarity is then defined as a function of box-size, L(r), as (Allain and Cloitre, 1991):
A single value for lacunarity, 〈L〉 is computed from the values of lacunarity obtained at different scales, r by log transforming the parameters and applying the following Eq. (3) as described in Roy and Perfect (2014):
2.3 Connectivity
The topological connectivity is a measure of intersections of the fracture segments in a fracture network. It can be computed through a combination of fracture intersections (X-nodes) and abutments or splays (Y-nodes). Barton and Hsieh (1989) invoked the use of ternary diagrams to characterize the connectivity, where the relative frequencies of all three node types: intersections (X-nodes), abutments (Y-nodes) and isolated line tips (I-nodes) present in a fracture network system are plotted as a point. Figure 4 illustrates the X, Y and I nodes present in a fracture network. The connectivity of a fracture network is a useful tool to forecast the fluid flow and transport characteristics in a fractured reservoir.

Figure 4I (isolated), X (intersection) and Y (abutments) nodes in a fracture network (Sanderson and Nixon, 2015).
Manzocchi (2002) showed that the connectivity can also be expressed in terms of a single parameter, n, defined by Eq. (4):
Where, PI = Proportion of I (isolated) nodes, PX = Proportion of X (intersection) nodes, PY = Proportion of Y (abutment) nodes, .
2.4 Flow Response
Evaluating the flow response is key in understanding the importance of fractures in any given network, especially for hydrogeologists and petroleum engineers. The deterministic fractal-fracture networks are modeled as a grid of cells. This is a fracture-continuum model similar to those described by Langevin (2003), Neuman (2005), Svensson (2001) and Tsang et al. (1996), by means of which discrete fractures are converted into permeability structures on a model grid. This is done in a manner such that each cell gets a characteristic porosity and permeability value depending on whether or not it is occupied by a fracture.
In our research, a cell occupied by a fracture is assigned porosity and permeability of 95 % and 106 md respectively, whereas all the others (“matrix” cells) have values 5 % and 102 md. These values are chosen so as to ensure that flow occurs only through the fractures. A pair of injection and production wells are placed at diagonally opposite corners of the grid i.e., at (1, 1) and (500, 500) such that there is a total areal swept of the fluids present in the modelled rock volume. These models are then flow simulated in Trace3D, a Darcy-based streamline simulator, at constant boundary conditions with reservoir pressure of 2480 psi and an injection rate of 500 bbl d−1 for a period of 1000 d. The overall fluid recovery values thus obtained from each deterministic fractal-fracture model is used for parametric characterization of the flow behavior.
3.1 Lacunarity and Connectivity
The lacunarity parameter, 〈L〉, which is a measure of scale dependent clustering, is calculated for the set of eight deterministic fractal-fracture patterns (Table A1 in the Appendix) and plotted as shown in Fig. 5. Although all the fractal-fracture patterns have the same theoretical fractal dimension, the lacunarity value increases with increase in the number of iterations. The lacunarity, which is a measure of fracture clustering thus increases because in going from one iteration to the next higher one, more and more fractures are added in populating the same domain which increases the fracture intensity.
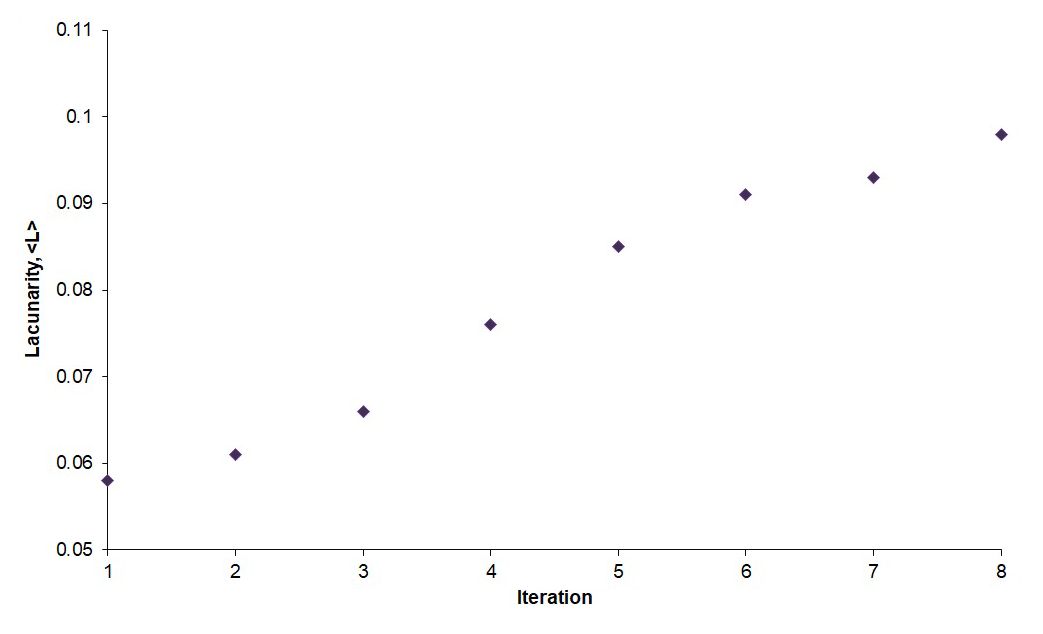
Figure 5Variation of lacunarity with iterations for deterministic fracture-fractal patterns (i=1 to 8).
The connectivity values of the set of eight deterministic fractal-fracture patterns are computed (Table A1) and plotted as shown in Fig. 6. Similar to the lacunarity parameter, the connectivity also increases with the increase in the number of iterations and somewhat appears to “stabilize” at higher iterations. However, at least until i=8, the connectivity actually does not “stabilize”. This behaviour is different when compared with Fig. 2 in Sect. 2.1 where the empirical fractal dimension of the same patterns stabilizes at iteration i = 3. This points to the fact that while the empirical fractal dimension stabilizes around its theoretical value (all patterns have the same dimension), it is not so in the case of the connectivity. This is because it increases with every iteration as does the intensity of these fractal-fracture networks.
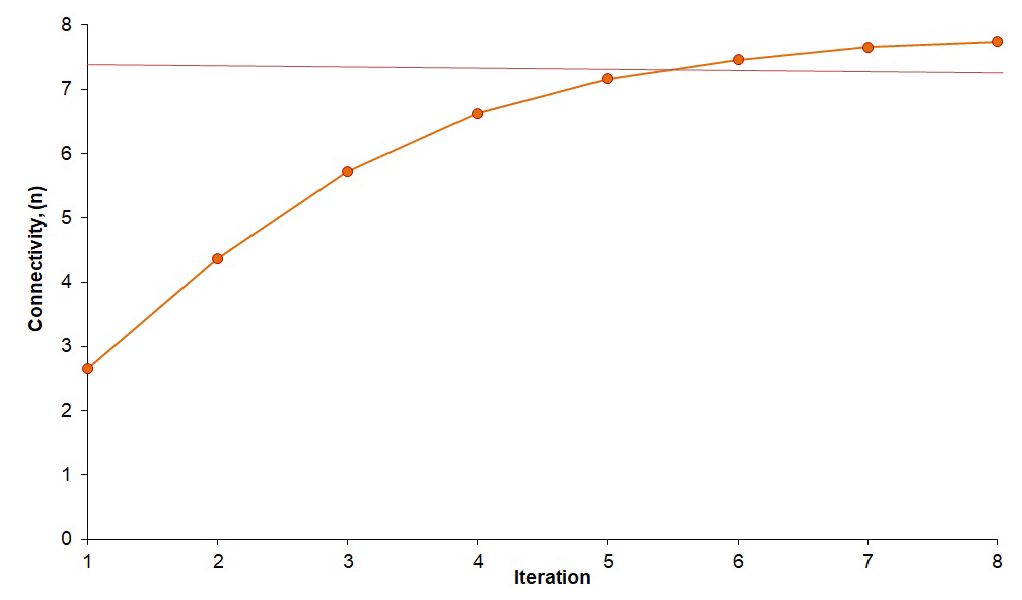
Figure 6Variation of connectivity with iterations for deterministic fracture-fractal patterns (i=1 to 8).
The differences in the connectivity of these fractal-fracture networks generated at different iterations can also be demonstrated in the form of a ternary diagram (Fig. 7) that plots the relative proportions of I, X and Y nodes of a network as a point representing the connectivity of that network. As seen in the figure, an increase in the iteration results in the formation of a higher relative number of X and Y nodes as compared to the number of I nodes.

Figure 7Ternary diagram showing connectivity of deterministic fractal-fracture patterns generated at iterations, i=1 to 6.
Such an increase in the X and Y nodes relative to I, hence, the connectivity of fractal-fracture networks, at increasing iterations is possibly related to the fact that fracture intensity also increases as i goes from 1 to 8. It has been shown previously that fracture clustering (lacunarity) also increases with iteration as more and more fractures populate the domain whose size remains fixed.
Lacunarity can therefore, be implemented in investigating possible relationships between clustering and connectivity by cross-plotting the two parameters. Figure 8 shows an appreciable positive correlation between these two thus indicating that instead of the fractal dimension which remains unchanged at different iterations (Fig. 2), it is the lacunarity parameter which can be used as a proxy for connectivity. From a computational point of view, the prime advantage of using lacunarity over connectivity lies in the fact that it does not require maps to be presented in vector formats, in other words, a simple bitmap figure file (raster data) can be used for analysis.
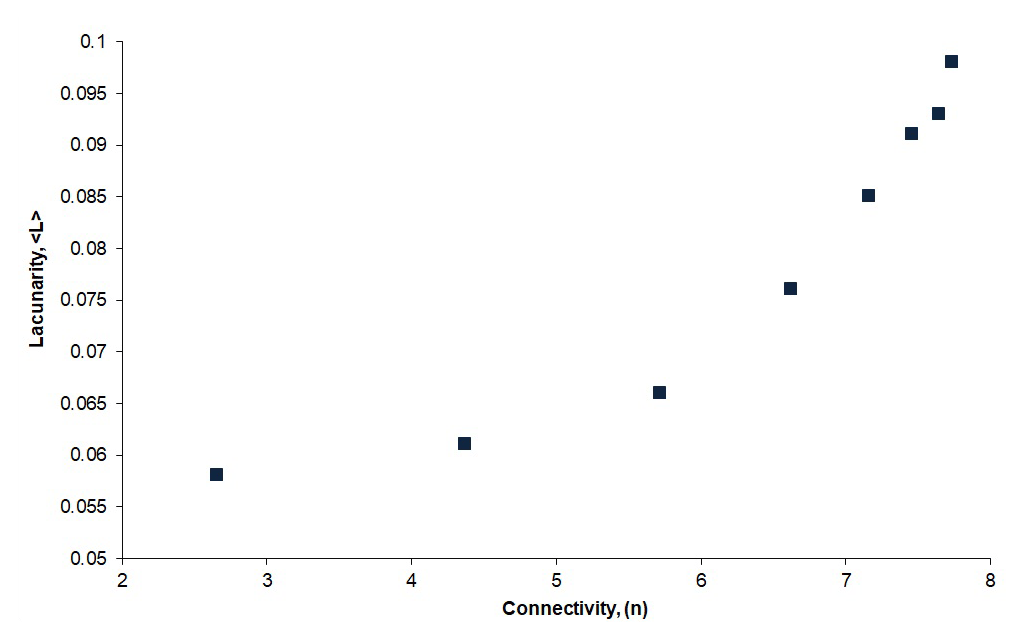
Figure 8Lacunarity vs. Connectivity plot for deterministic fractal-fracture patterns (i=1 to 8).
3.2 Lacunarity and Fluid Recovery
The fluid recovery obtained by flow simulation of deterministic fractal-fracture models increases with increase in the number of iterations and is positively correlated to lacunarity as seen in Fig. 9. This can possibly be attributed to the fact that recovery is directly controlled by connectivity. The latter in turn, is related to fracture clustering which is quantified by lacunarity. As the number of iterations increase, more fractures are added that increases lacunarity which leads to better connectivity that enhances transport of fluid from the injection point to the production point of the fractured domain. This observation thus indicates that instead of the fractal dimension which remains unchanged at different iterations (Fig. 2), the lacunarity parameter is better suited to represent fluid recovery of deterministic fractal-fracture networks.
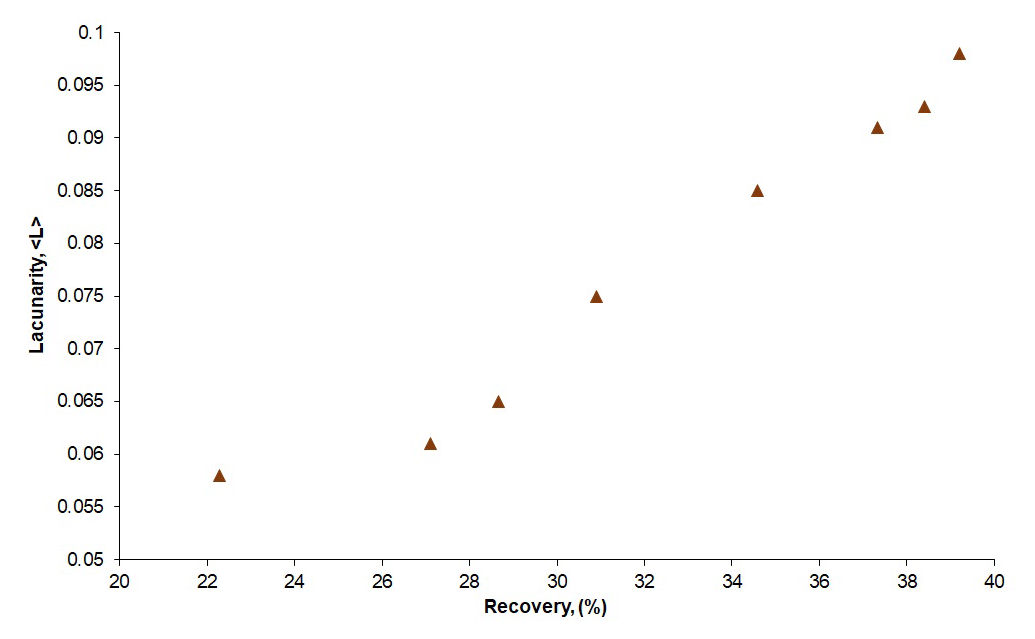
Figure 9Lacunarity vs. Recovery plot for deterministic fractal-fracture patterns (i=1 to 8).
The present research explores if the fractal dimension of a fractal-fracture network is a unique identifier of network connectivity and its flow properties. It addresses the question of whether lacunarity, a parameter that quantifies the scale-dependent clustering of fractures (Roy et al., 2010) in distinguishing between networks with same fractal-dimension, can be used instead and studies the influence of clustering attributes on flow behavior of fractal-fracture networks.
A set of synthetic deterministic fractal-fracture networks generated at different iterations and having a known theoretical fractal dimension, D=1.585 (Roy et al., 2007) were implemented in this study. It was found that unlike the empirical fractal dimension that stabilizes at a given theoretical value, connectivity and clustering (lacunarity) increase with increasing iterations from i=1 to 8. A similar trend is observed when the patterns are flow simulated and the recovery factor is compared to lacunarity. This does not come as a surprise because as seen in Figs. 1 and 3, with increasing iterations more and more fractures are added in the domain which leads to higher fracture intensity. The results of our research point to the fact that the fractal dimension is not a unique identifier of connectivity or flow properties in case of such deterministic fractal-fracture patterns. Instead, it is the clustering of such fracture networks that can be used to understand the connectivity because there is a reasonable correlation between the connectivity and lacunarity parameter which quantifies scale-dependent clustering. The positive correlation between scale dependent clustering and fluid recovery bolsters the fact that rather than the fractal dimension it is the lacunarity parameter that might be considered for understanding connectivity and flow response of such fractal-fracture networks.
Based on our findings with respect to synthetic fractal-fracture maps, it can be ascertained that the lacunarity parameter can be used as a proxy for connectivity and is also an indicator of fluid flow for fracture networks. In order to test whether this applies to real world fractal-fracture maps, this study can be extended to a set of natural maps with similar fractal-dimension.
Table A1Connectivity (n), Lacunarity (〈L〉) and Fluid Recovery (%) of Deterministic Fractal-Fracture Networks from i = 1–8.

The fractal-fracture maps analysed in this research have been provided as a Supplement to the article. These were generated using a MATLAB code provided in the MS dissertation of one of the authors (Roy, 2006).
The supplement related to this article is available online at: https://doi.org/10.5194/adgeo-54-149-2020-supplement.
AKS implemented the workflow and carried out the simulation cases. AR provided ideas for the case design and all critical suggestions also reviewed the final work. All authors contributed to writing the paper.
The authors declare that they have no conflict of interest.
This article is part of the special issue “European Geosciences Union General Assembly 2020, EGU Division Energy, Resources & Environment (ERE)”. It is a result of the EGU General Assembly 2020, 4–8 May 2020.
We would like to thank IIT Kharagpur for funding the Quantitative Fractured Reservoir Research Initiative Lab (QFRRI), a facility that was used for carrying out all the analyses discussed in this work. A very special note of thanks goes to Akhil Datta-Gupta of Texas A&M University who not only made Trace3D available to us but took all the trouble to teach us the details of how to use it.
This paper was edited by Christopher Juhlin and reviewed by Christopher Juhlin and one anonymous referee.
Allain, C. and Cloitre, M.: Characterizing the lacunarity of random and deterministic fractal sets, Phys. Rev. A, 44, 3552–3558, https://doi.org/10.1103/PhysRevA.44.3552, 1991.
Barton, C. C. and Hsieh, P. A.: Physical and hydrological-flow properties of fractures, International Geological Congress, Environmental, Engineering and Urban geology, United States 2, Field Trip Guidebook, T385, 36 pp., ISBN 0-87590-650-8, AGU, Washington, D. C., 1989.
Barton, C. C. and La Pointe, P. R.: Fractals in the Earth Sciences, ISBN 0-30644-865-3, Springer-Verlag, New York, NY, 1995.
Berkowitz, B. and Hadad, A.: Fractal and multifractal measures of natural and synthetic fracture networks, J. Geophys. Res., 102, 12205–12218, https://doi.org/10.1029/97JB00304, 1997.
Datta-Gupta, A. and King, M. J.: Streamline Simulation: Theory and Practice, Textbook Series 11, ISBN 978-1-55563-111-6, Society of Petroleum Engineers, Richardson, TX, 2007.
Doughty, C. and Karasaki, K.: Flow and Transport in hierarchically fractured rocks, J. Hydrol., 263, 1–22, https://doi.org/10.1016/S0022-1694(02)00032-X, 2002.
Langevin, C. D.: Stochastic ground water flow simulation with a fracture zone continuum model, Ground Water, 41, 587–601, https://doi.org/10.1111/j.1745-6584.2003.tb02397.x, 2003.
Manzocchi, T.: The connectivity of two-dimensional networks of spatially correlated fractures, Water Resour. Res., 38, 1162, https://doi.org/10.1029/2000WR000180, 2002.
Neuman, S. P.: Trends, prospects and challenges in quantifying flow and transport through fractured rocks, Hydrogeol. J., 13, 124–147, https://doi.org/10.1007/s10040-004-0397-2, 2005.
Plotnick, R. E., Gardner, R. H., and O'Neill, R. V.: Lacunarity indices as measures of landscape texture, Landscape Ecol., 8, 201–211, 1993.
Plotnick, R. E., Gardner, R. H., Hargrove, W. W., Prestegaard, K., and Perlmutter, M.: Lacunarity analysis: A general technique for the analysis of spatial patterns, Phys. Rev. E, 53, 5461–5468, https://doi.org/10.1103/PhysRevE.53.5461, 1996.
Roy, A.: A quantitative study of scaling properties of fracture networks, MS thesis, 103 pp., Univ. of Tenn., Knoxville, 2006.
Roy, A. and Perfect, E.: Lacunarity analyses of multifractal and natural grayscale patterns, Fractals, 22, 1440003, https://doi.org/10.1142/S0218348X14400039, 2014.
Roy, A., Perfect, E., Dunne, W. M., Odling, N., and Kim, J. W.: Lacunarity analysis of fracture networks: Evidence for scale-dependent clustering, J. Struct. Geol., 32, 1444–1449, https://doi.org/10.1142/S0218348X14400039, 2010.
Roy, A., Perfect, E., Dunne, W. M., and McKay, L. D.: Fractal characterization of fracture networks: An improved box-counting technique, J. Geophys. Res., 112, B12201, https://doi.org/10.1029/2006JB004582, 2007.
Sanderson, J. D. and Nixon, W. C.: Topology, connectivity and percolation in fracture networks, J. Struct. Geol., 115, 167–177, https://doi.org/10.1016/j.jsg.2018.07.011, 2015.
Svensson, U.: A continuum representation of fracture networks, part II: Application to the Äspo Hard Rock laboratory, J. Hydrol., 250, 187–205, https://doi.org/10.1016/S0022-1694(01)00436-X, 2001.
Tsang, Y. W., Tsang, C.-F., Hale, F. V., and Dverstorp, B.: Tracer transport in a stochastic continuum model of fractured media, Water Resour. Res., 32, 3077–3092, https://doi.org/10.1029/96WR01397, 1996.
Zang, X. and Sanderson, D. J.: Anisotropic features of geometry and permeability in fractured rock masses, 40, 65–75, https://doi.org/10.1016/0013-7952(95)00040-2, 1994.