 | 27 Oct 2020
Statistical moments of power spectrum: a fast tool for the classification of seismic events recorded on volcanoes
Danilo Galluzzo
Lucia Nardone
Mario La Rocca
Antonietta M. Esposito
Roberto Manzo
Rosa Di Maio
Spectral analysis has been applied to almost thousand seismic events recorded at Vesuvius volcano (Naples, southern Italy) in 2018 with the aim to test a new tool for a fast event classification. We computed two spectral parameters, central frequency and shape factor, from the spectral moments of order 0, 1, and 2, for each event at seven seismic stations taking the mean among the three components of ground motion. The analyzed events consist of volcano-tectonic earthquakes, low frequency events and unclassified events (landslides, rockfall, thunders, quarry blasts, etc.). Most of them are of low magnitude, and/or low maximum signal amplitude, therefore the signal to noise ratio is very different between the low noise summit stations and the higher noise stations installed at low elevation around the volcano. The results of our analysis show that volcano-tectonic earthquakes and low frequency events are easily distinguishable through the spectral moments values, particularly at seismic stations closer to the epicenter. On the contrary, unclassified events show the spectral parameters values distributed in a broad range which overlap both the volcano-tectonic earthquakes and the low frequency events. Since the computation of spectral parameters is extremely easy and fast for a detected event, it may become an effective tool for event classification in observatory practice.
- Article
(2651 KB) - Full-text XML
- BibTeX
- EndNote


Active volcanoes are complex systems characterized by heterogeneous geological structure and by a variety of phenomena that may generate seismic waves. Therefore, seismic signals recorded in volcanic areas may have a broad range of features due to the different type of sources and to the wave propagation in heterogeneous media. Internal sources produce volcano-tectonic (VT) earthquakes, low frequency (LF), long period (LP) events and volcanic tremor, while external sources include landslides, rockfalls, thunders and other atmospheric phenomena. Furthermore, artificial sources such as quarry blasts and other events related to human activity often produce transient seismic signals detected by the monitoring seismic networks. Over the years a considerable number of detected events that are not VT earthquakes remained unclassified due to their unclear waveform and spectral features. Recognize seismic events, discriminate between natural and artificial sources, and classify them based on the recorded waveforms are the main task of a volcanological observatory. This is particularly important in the cases of dormant volcanoes, where seismicity may be weak and sporadic, in alert-status volcanoes, where any changes in the seismicity features may reveal an evolution of the volcanic system, and in densely populated areas, where transient seismic signals of artificial origin could be confused with natural seismic events and vice versa. A quick classification of weak seismic signals in some cases may result impossible for automatic systems and difficult even for expert personnel. This may happen for many reasons, such as the low number of seismic stations that record the event, the low signal to noise ratio, the occurrence of many events with a very short time separation, and so on.
The three volcanic areas of Campania region (southern Italy), Mt. Vesuvius, Campi Flegrei complex and Ischia island, are characterized by very high population density. The real time monitoring of these active volcanoes is very important for civil protection purposes, but the classification of weak seismic events often is difficult due to the high background noise and to the many artificial sources of transient signals. Here we analyze one year of seismicity at Mt. Vesuvius to test new methods that could help a quick classification of seismic events. We choose Vesuvius because it shows the most abundant seismicity of many different types among the three active volcanoes. During the last decades the seismicity of Vesuvius has been characterized by hundreds of low-magnitude VT earthquakes recorded every year (D'Auria et al., 2013), low frequency events (Bianco et al., 2005; Cusano et al., 2013; La Rocca and Galluzzo, 2016) and many events of other types (landslides, rockfalls, artificial explosions, unclassified). Esposito et al. (2013) count about 21 000 seismic events of local origin recorded in the period 2007–2011 classified as follows: 54 % are local earthquakes, 30 % are produced by artificial explosions in local quarries, 11 % are associated with thunders and other unknown source events and 5 % are attributed to small local landslides and rockfalls occurred inside and around the top of the crater. Detailed study of the natural seismicity recorded during the last two decades allowed for the identification of previously unrecognized LF events characterized by source depth greater than 6 km b.s.l. (La Rocca and Galluzzo, 2016). This type of seismicity was located, classified and studied taking advantage from the use of array data (La Rocca and Galluzzo, 2014) in addition to an accurate analysis of the signals recorded by the local seismic network. The used methodologies provided detailed results regarding deep LF events by estimating characteristics and position of the corresponding sources. Unfortunately, this kind of analysis requires expertise and working time that usually are beyond the task and schedule required to people involved in the real time monitoring of active volcanoes.
Understanding the origin of the low frequency signals observed on active volcanoes (LF events and volcanic tremor) is of fundamental importance because this type of seismicity often precede eruptions and, therefore, it can be indicative for evaluating the potential eruption of a volcano (Chouet, 2003). For this reason, an efficient classification of the seismic events recorded on volcanoes can be achieved only taking into account both the signal shape in time domain, and their spectral characteristics (Chouet, 1996; McNutt, 2005; Zobin, 2017). In the last years, statistical moments have been used mainly in the analysis of signals in time domain, such as the kurtosis for automatic phase picking (Baillard et al., 2014), while spectral features jointly with other parameters have been considered in an automatic classification scheme to identify volcanic signals typologies (Sherburn, 1998; Esposito et al., 2006; Ibs-von Seht, 2008; Malfante et al., 2018). In this work we propose the characterization of power spectra by two parameters obtained from statistical moments evaluation: central frequency and shape factor. The aim is to provide a raw analysis tool of fast application on real time signals, or to be computed in a few seconds once the seismic event has been detected, in order to be effective for the classification of seismic events in observatory practice. The proposed approach has been tested by analyzing almost a thousand seismic events recorded at Vesuvius volcano in 2018.
The seismicity recorded at Mt. Vesuvius in 2018 is particularly rich of both natural and artificial types of events. The seismic catalogue of Istituto Nazionale di Geofisica e Vulcanologia (INGV) Osservatorio Vesuviano contains 976 events detected in Mt. Vesuvius area that include 925 VT earthquakes (), 12 LF events and other 39 unclassified events. For this work we selected the recordings of all events of the year 2018 at seven broad band seismic stations of the mobile seismic network of INGV – Osservatorio Vesuviano. These stations work offline in a continuous acquisition mode and provide data used for detailed seismological analyses and monitoring purposes (La Rocca and Galluzzo, 2015). Figure 1 shows the position of seismic stations and the epicenters of VT earthquakes analyzed in this work. LF, landslides and unclassified events are not located, therefore they are not shown in Fig. 1. Figure 2 shows a vertical cross section of the volcano with the source position of VT earthquakes, the seismogenic volume where LF events likely occur (from La Rocca and Galluzzo, 2016), and the summit area where landslides and rockfall occur, both inside and outside of the crater. Seismic signals from the stand alone instruments are characterized by high dynamic range, high sensitivity of broad band sensors (Guralp CMG 40T and Lennartz LE3D 20s) and higher continuity of seismic records compared with telemetered stations.
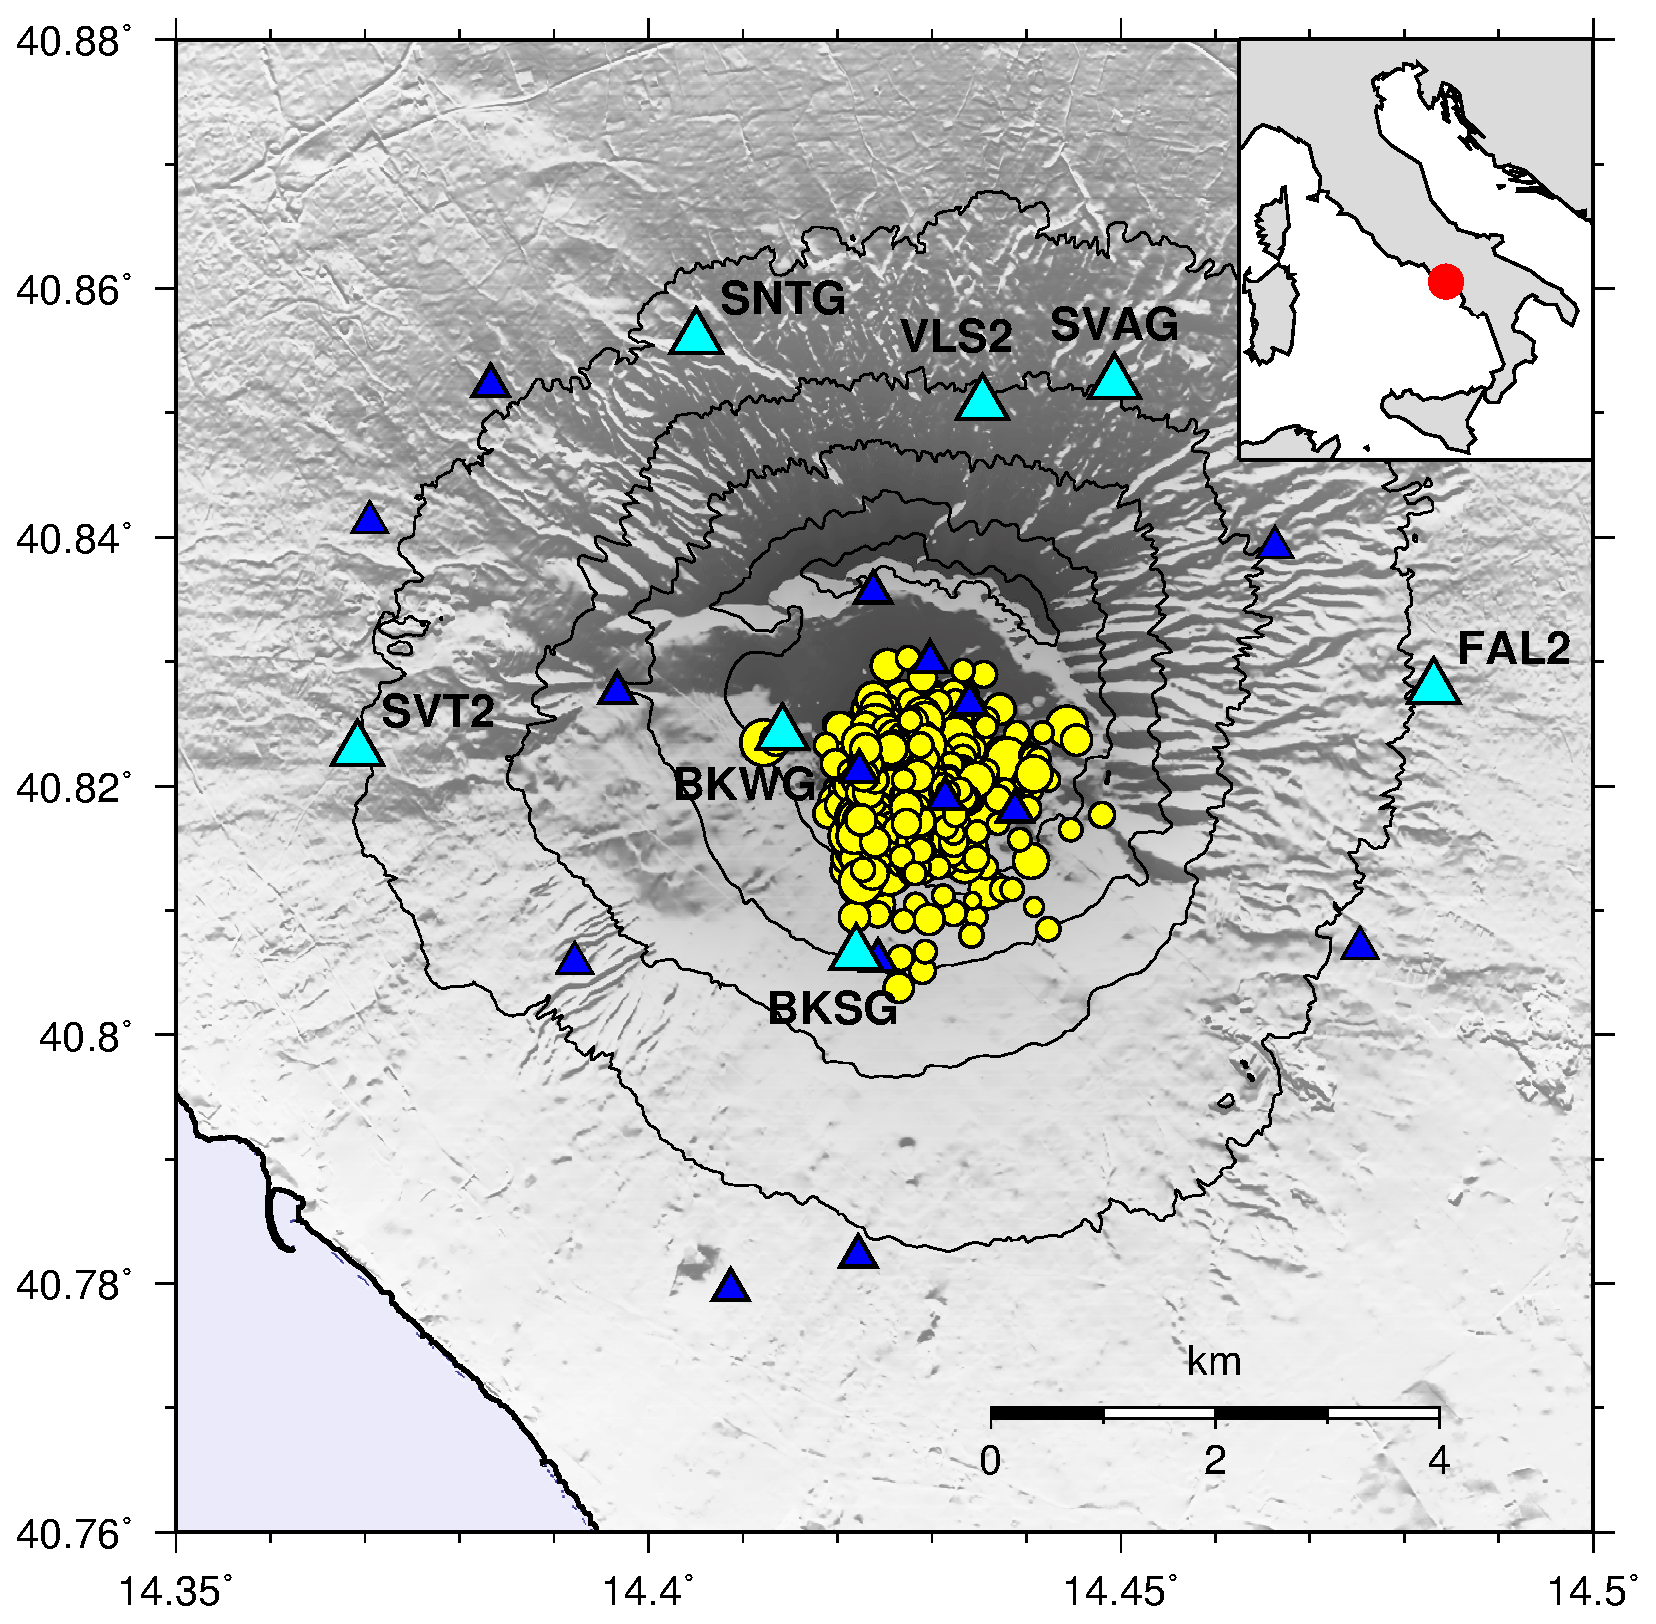
Figure 1The monitoring seismic network operating on Mt. Vesuvius during 2018. The cyan triangles indicate the position of stand-alone seismic stations used in this work while blue symbols show the position of permanent network stations. The yellow circles are the epicenters of the volcano-tectonic events occurred in 2018, with size proportional to magnitude. The position of Mt. Vesuvius in Italy is shown in the inset map.
We have characterized each seismic event by estimating spectral parameters as central frequency and shape factor of power spectrum (Kramer, 1996) for each station individually. The first three statistical moments of seismic power spectrum, λn, are evaluated through the relationships:
where for n=0, 1, 2 we have the zero-, first- and second-moment, respectively, of seismic power spectrum G. The integration is performed in frequency domain in the f1–f2 range. From the three statistical moments we calculated two spectral parameters for each seismic event, i.e. the central frequency Ω and shape factor δ, according to the relationships:
The power spectrum G was computed on signal windows of three different lengths (3, 4 and 5 seconds) around the maximum amplitude (which corresponds to S-wave phase) to check the stability of results. Statistical moments were evaluated through Eq. (1) with integration limits of 2 and 40 Hz. The choice of the S-wave window signal is due to the need to calculate the spectral parameters on the part of the signal characterized by the maximum signal/noise ratio. In this way the calculated spectral features characterize as much as possible the source contribution with respect to the propagation and possibly site contributions. It's known that the site effect contribution is negligible for the stations located in the summit part of the volcano (Galluzzo et al., 2009) and that the frequency content of the local seismicity is due mainly to source than propagation contribution (La Rocca and Galluzzo, 2016). The power spectrum parameters of Eqs. (2) and (3) were evaluated for each seismic event at any stations taking the mean value among the three components of ground motion. The central frequency Ω is a measure of the frequency where the signal power is higher, while the shape factor indicates the dispersion of the power spectral density about the central frequency (Vanmarcke, 1976). The shape factor δ takes values between 0 and 1, with higher values corresponding to larger bandwidths. The lower integration limit in Eq. (1) is important to reduce the effects of low frequency seismic noise (wind, sea, etc. which could be predominant at frequency lower than 1–2 Hz) in the seismic signals of low magnitude events. The upper integration limit is required to take into account that the bandwidth of signals sampled at 100 sps usually is reliable up to 40 Hz, and also because some seismic sensors are characterized by flat response up to 40 Hz (Guralp CMG 40 T). Examples of seismic signals and their spectra for two different types of earthquakes are shown in Fig. 3. The green, magenta and red signals show the waveform window (left) and the corresponding spectra (right) of VT events (from top: MD2.5, MD0.3), seismic noise and LF event, respectively. Starting from top, we have central frequencies equal to 12.6 Hz, 13.3 Hz for two VT earthquakes, 7.6 Hz for seismic noise and 4.2 Hz for LF event. Shape factors are equal to 0.44 and 0.50 for VT events, 0.69 for noise and 0.49 for LF event. As expected, the MD 0.3 VT event shows an higher central frequency compared with the MD 2.5 magnitude earthquake. Seismic noise shows a central frequency higher than values found for earthquakes due to the greater spreading of the noise energy within the investigated range of frequency. The LF event shows a central frequency very close to the main frequency of its spectrum and a shape factor comparable or slightly higher than VT earthquakes.
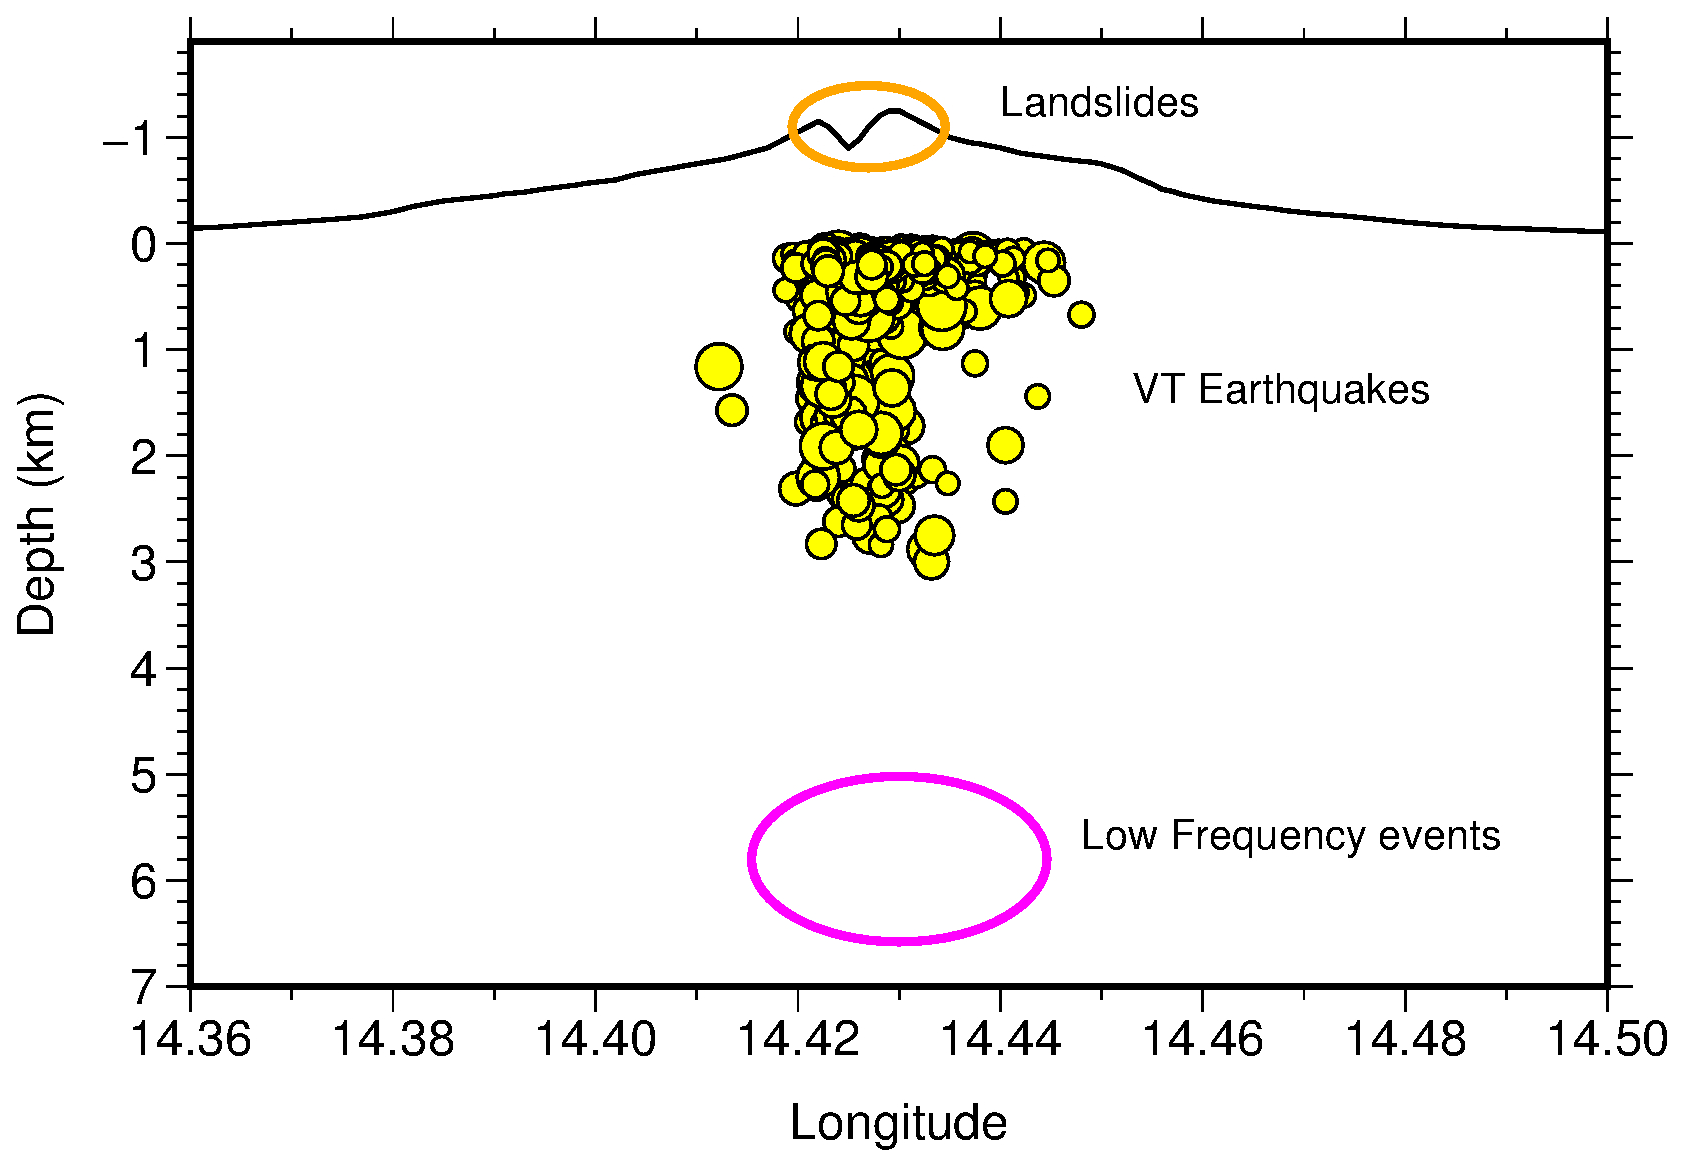
Figure 2E-W vertical section of Mt. Vesuvius with the source location of VT earthquakes analyzed in this work. LF events usually occur in the seismogenic volume shown by the magenta ellipse. Orange ellipse identifies the area where local landslides occur.
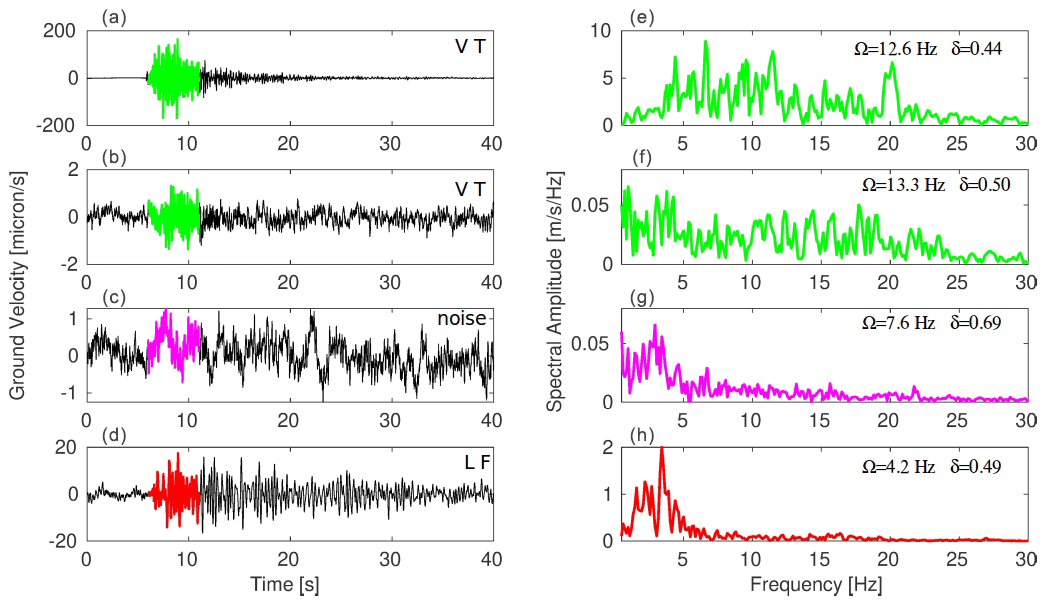
Figure 3Local seismic events recoded at BKSG station (left, Z component) and their amplitude spectra (right). From top to bottom 2 VT earthquakes (2018-10-16 01:07:09 MD 2.5, 2018-01-29 17:32:58 MD 0.3, green), seismic noise (magenta) and LF event (red) are shown. The green, magenta and red time windows (left side) indicate the signal used for amplitude spectrum evaluation (right side). In the upper-right corners of the amplitude spectra figures, the corresponding values of central frequency and shape factor are shown.
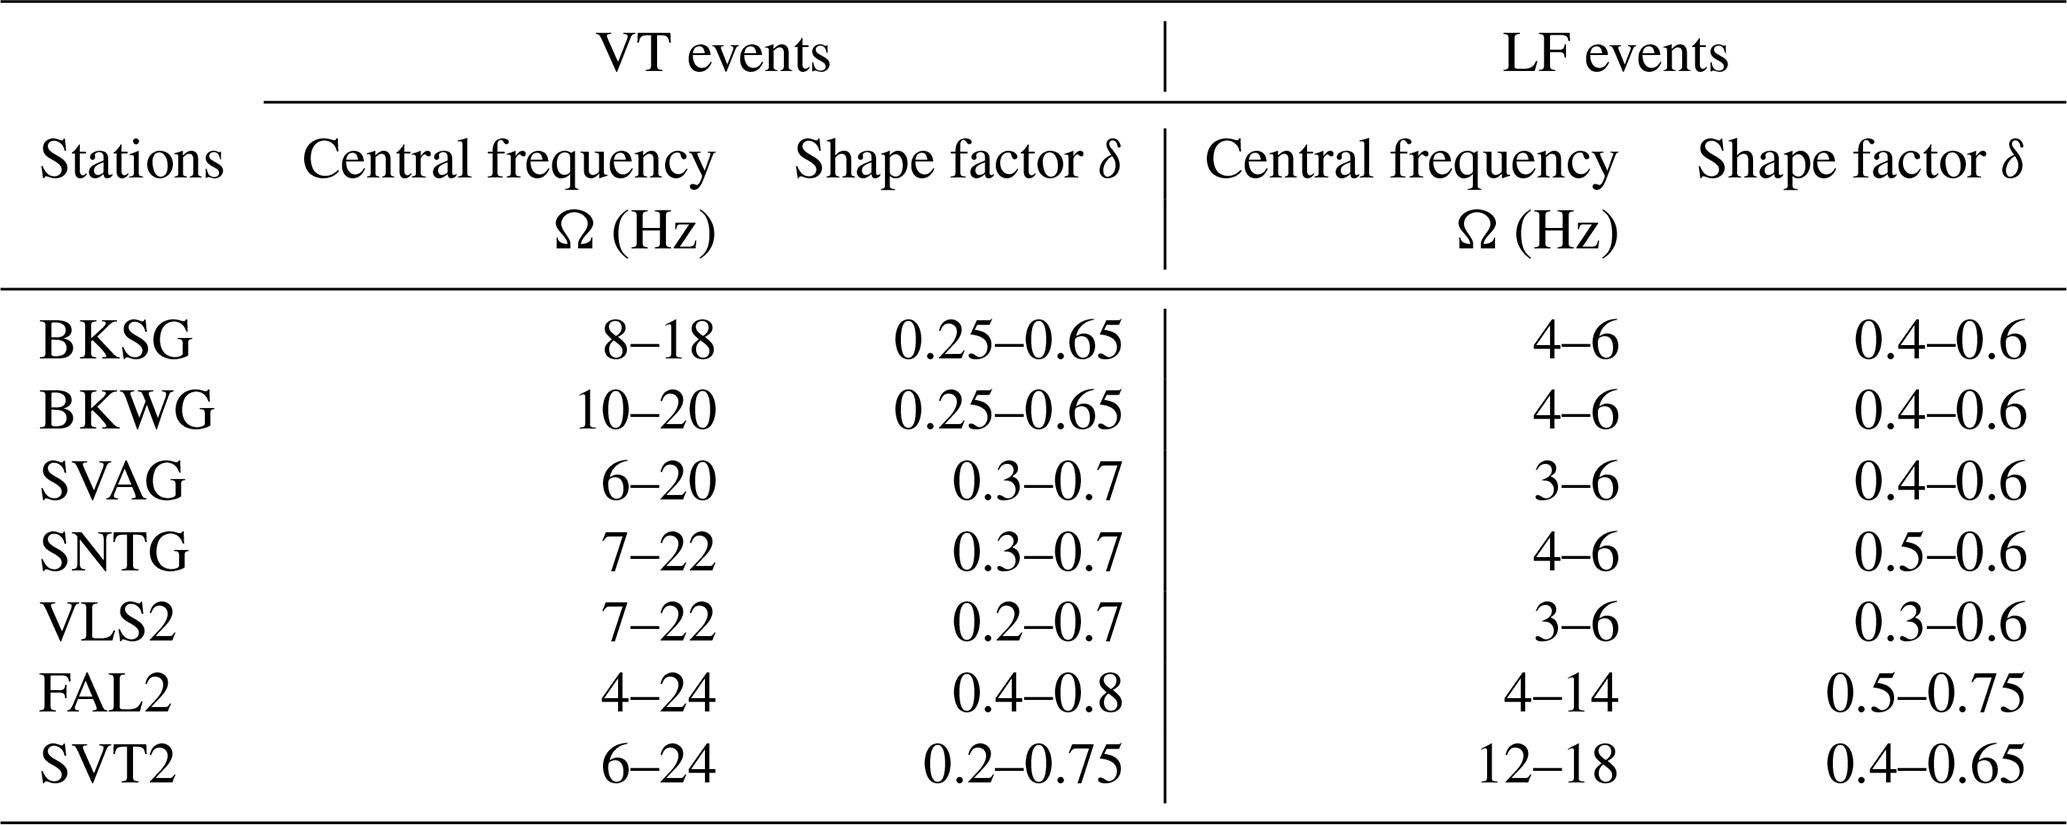
Table 1Spectral parameters range for VT and LF events evaluated for all the selected stations.
The spectral parameters obtained from the analysis of all events are shown in Fig. 4 (BKSG and BKWG stations), Fig. 5 (SVAG, SNTG, and VLS2 stations) and Fig. 6 (FAL2 and SVT2 stations). We have plotted the shape factor δ versus central frequency Ω with different symbols and colors for each event type. The size of symbols is representative of the maximum signal amplitude for VT, LF earthquakes and unclassified events.

Figure 4Average shape factor vs central frequency evaluated for BKSG (a) and BKWG (b) stations. LF events, unclassified events and VT earthquakes are shown with red circles, blue diamonds and yellow squares, respectively. The size of symbol is indicative of the signals maximum amplitude in ground velocity. The visualized results are obtained by averaging on the three components of motion.
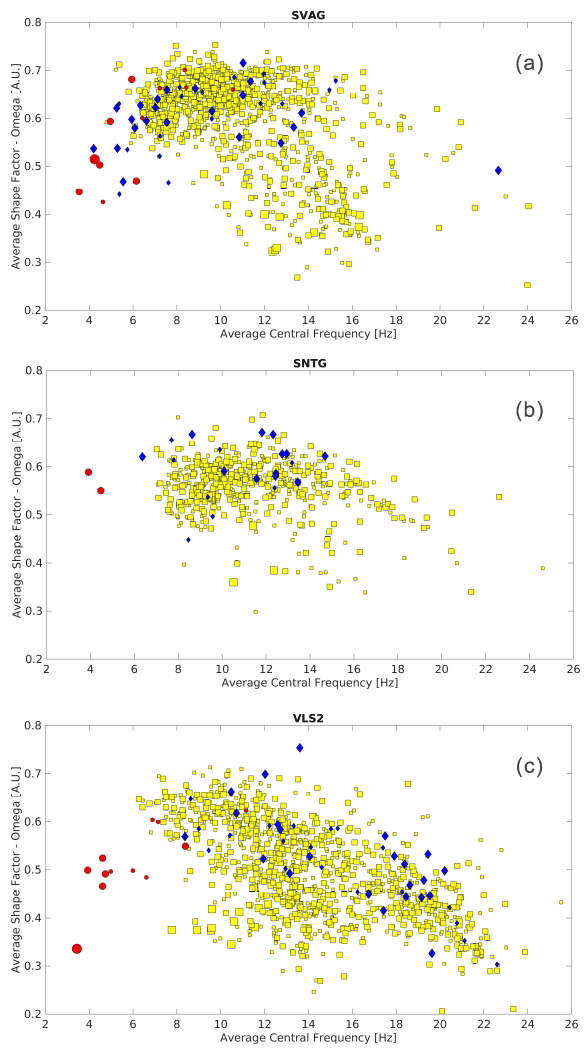
Figure 5Average shape factor vs central frequency evaluated for SVAG (a), SNTG (b) and VLS2 (c) stations located on the northern sector of Mt. Vesuvius (see Fig. 1). LF events, unclassified events and VT earthquakes are shown with red circles, blue diamonds and yellow squares, respectively. The symbol size indicates the maximum amplitude of the observed signals. The illustrated results are obtained by averaging on the three components of motion.

Figure 6Average shape factor vs central frequency evaluated for FAL2 (a) and SVT2 (b) stations located in the most densely populated sites. LF events, unclassified events and VT events are shown with red circles, blue diamonds and yellow squares respectively. The symbol size represents the maximum amplitude of the observed signals. The presented results are obtained by averaging on the three components of motion.
Figure 4 shows the results obtained for BKSG and BKWG, which are the two summit stations closer to the epicenters and characterized by the lowest noise level among the seven used sites. It's clear that the representation of seismicity through central frequency and shape factor groups different types of events into distinct areas of the graph. Specifically Fig. 4a shows:
-
VT earthquakes (yellow squares) are distributed in a broad range of central frequency, between 10 and 20 Hz. The most energetic events are characterized by shape factor between 0.2 and 0.4, while the lower magnitude events (smaller yellow squares) have higher values of shape factor and lower central frequency. Both these effects are a consequence of the lower signal-to-noise ratio that characterizes smaller events. In fact, as the signal-to-noise decreases, the increasing contribution of the seismic noise in the analyzed signal pulls the central frequency toward lower values and increases the shape factor, which are the typical features of seismic noise.
-
LF events (red circles) are characterized by central frequency in the range [4–7 Hz] and shape factor in the range [0.4–0.6].
-
Unclassified events (likely corresponding to landslides, atmospheric events, artificial explosions, etc.) identified by blue diamonds have values of central frequency and shape factor that span both the ranges of VT earthquakes and LF events.
Same features are observed for BKWG site (Fig. 4b), but due to the lack of recorded LF data, they are less clear than that detected at BKSG station.
For the stations located on the northern sector of the volcano (SVAG, VLS2 and SNTG, Fig. 5), LF seismic events mainly show comparable features with shape factor in the range [0.3–0.6] and central frequency between 3 and 6 Hz, with few cases of Ω>6 Hz at SVAG. VT events are characterized by central frequency in the range 8–26 Hz and shape factor between 0.3 and 0.5. Unclassified events have features similar to more noisy earthquakes (shape factor greater than 0.6 and frequency range between 7 and 28 Hz). The results obtained for the station FAL2 and SVT2 (Fig. 6) located in the most dense inhabited area are less clustered. SVT2 is the site characterized by the highest background noise among the seven stations used in our analysis. The unclassified events and the few LF events recorded at this station are hardly recognized in the seismograms, thus their spectral parameters are confused within the cloud of points that shows VT earthquakes.
The seismic waveform in time domain and its amplitude spectrum are the result of source, path and site effects. In the past years several techniques have been used to analyze separately each contribution, and strong attention has been given to the study of the source scaling of VT earthquakes at Mt. Vesuvius (Galluzzo et al., 2009). In the present work we try a step forward in the analysis of seismic signals through the estimation of spectral parameters obtained from statistical moments of the power spectrum. The aim of this analysis is an aid to the classification of seismic events recorded at Mt. Vesuvius. The procedure was applied to 976 seismic events that include several LF events occurred in 2018. LF events deserve particular attention in areas of high volcanic risk because their source may be an important marker of the volcanic activity at depth. The results of our analysis show that for less noisy stations in the summit area of the volcano, that are also closer to the epicenter, LF events have well distinct characteristics in terms of central frequency and shape factor compared with VT earthquakes. LF events have center frequencies primarily between 4 and 6 Hz and a power spectrum shape factor between 0.4 and 0.6. These characteristics are evident at most of the stations located at altitudes greater than 300 m above sea level where the inhabited centers are more sparse. Being LF signals characterized by low amplitude, they are not easily distinguished from VT in the results obtained for stations installed at low elevation around the volcano, characterized by a higher background noise. VT earthquakes have center frequency in a wider range, typically greater than 6–7 Hz and up to 20 Hz or more. The shape factor is mostly in the range from 0.3 to 0.6, wider than LF events. The spectral parameters of unclassified events in many cases are spread in a wide range of both central frequency and shape factor. In addition, noisy records are characterized by higher values of shape factor due to the spreading of spectral energy in a wide range of frequency.
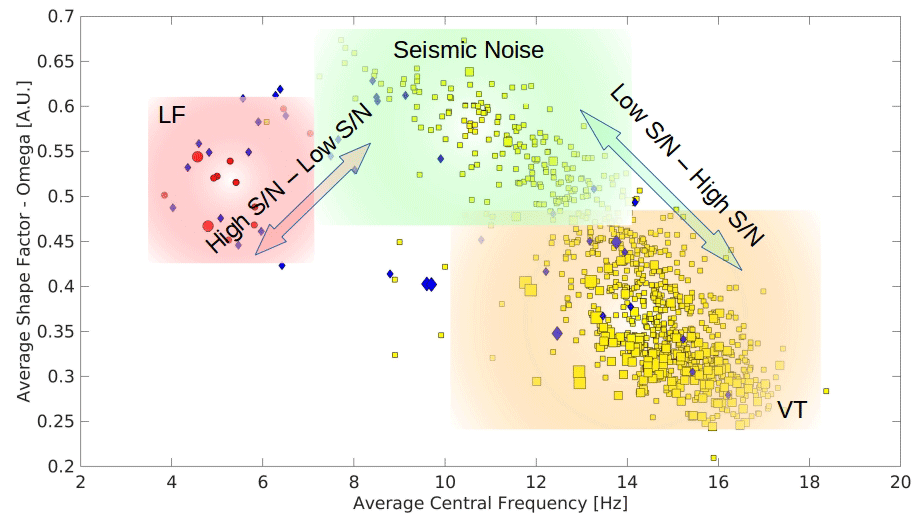
Figure 7Spectral parameters results obtained for BKSG station. Red and yellow background areas identify the two sectors where LF and VT events are characterized by a high signal-to-noise ratio (S ∕ N in the figure). Green background color shows the area where the waveforms are characterized by low signal-to-noise ratio.
The significant finding of our study concerns the possibility of identifying LF events at the less noisy stations where these events show very similar characteristics in terms of spectral power at all the recording sites. This is probably due to the fact that these events are produced by sources deeper than VT earthquakes, therefore the seismic waves arrive with characteristics more similar to the different stations. This aspect is not evident for VT earthquakes, for which some differences between the stations are clear (Table 1). These differences are explained through the combination of two reasons. First, for shallow sources (at most 2 km depth) the seismic radiation can be more different among the various sites due to the wave propagation in the shallower structure of the volcano, likely more heterogeneous than the deeper structure (Del Pezzo et al., 2013). Second, very often site effects are more important for the spectrum modification at higher frequency than they are at lower frequency.
In Fig. 7 we show again the results obtained for BKSG station, which is one of the lowest noise site, and highlight the ranges of spectral parameters where each type of seismic signals falls. LF events and VT earthquakes are always separated and the separation increases for increasing signal-to-noise ratio, therefore they are easily distinguishable. On the contrary, unclassified events show an almost random distribution in the plot, which makes very difficult or impossible to distinguish them from LF and VT events. The present work has shown encouraging results for discriminating different categories of seismic events. The analysis of events occurred in the past yields the “best range” of values for any seismic stations corresponding to the various types of events. When a new seismic event is detected, the spectral parameters can be computed very quickly, and the comparison of their values with those of known events can help the observatory analysts in the classification of events with unclear features. Therefore, this application could be useful for surveillance purposes by providing a fast aid to inexpert operators for a preliminary classification of seismic events.
Data are available on request from the authors.
GD, MLR and RDM conceived the original idea of the paper research. LN, AME and RM prepared the data set. GD, MLR and RM elaborated the data. All the authors interpreted the results and contributed in writing and reviewing the manuscript.
The authors declare that they have no conflict of interest.
This article is part of the special issue “Understanding volcanic processes through geophysical and volcanological data investigations: some case studies from Italian sites (EGU2019 GMPV5.11 session, COV10 S01.11session)”. It is not associated with a conference.
Edoardo Del Pezzo and Girolamo Milano are acknowledged for their useful comments which contributed to improve this manuscript. The dataset used in this paper collected by mobile seismic network have been carried out n the framework of the Agreement (Annex A) between the Italian Civil Protection Department (DPC) and INGV.
This paper was edited by Mariarosaria Falanga and reviewed by Girolamo Milano and Edoardo Del Pezzo.
Baillard, C., Crawford, W. C., Ballu, W. C., Hibert, C., and Mangeney, A.: An Automatic Kurtosis-Based P- and S-Phase Picker Designed for Local Seismic Networks, B. Seismol. Soc. Am., 104, 394–409, https://doi.org/10.1785/0120120347, 2014.
Bianco, F., Cusano, P., Petrosino, S., Castellano, M., Buonocunto, C., Capello, M., and Del Pezzo, E.: Small-aperture array for seismic monitoring of Mt. Vesuvius, Seismol. Res. Lett., 76, 344–355, 2005.
Chouet, B. A.: Long-period volcano seismicity: its source and use in eruption forecasting, Nature, 380, 309–316, https://doi.org/10.1038/380309a0, 1996.
Chouet, B. A.: Volcano seismology, Pure Appl. Geophys., 160, 739–788, 2003.
Cusano, P., Petrosino, S., Bianco, F., and Del Pezzo, E.: The first Long Period earthquake detected in the background seismicity at Mt. Vesuvius, Ann. Geophys., 56, S0440, https://doi.org/10.4401/ag-6447, 2013.
D'Auria, L., Esposito, A. M., Lo Bascio, D., Ricciolino, P., Giudicepietro, F., Martini, M., Caputo, T., De Cesare, W., Orazi, M., Peluso, R., Scarpato, G., Buonocunto, C., Capello, M., and Caputo, A.: The recent seismicity of Mt. Vesuvius: inference on seismogenic processes, Ann. Geophys., 56, 1–12, 2013.
Del Pezzo, E., Chiodini G., Caliro, S., Bianco, F., and Avino, R.: New insights into Mt. Vesuvius hydrothermal system and its dynamic based on a critical review of seismic tomography and geochemical features, Ann. Geophys., 56, S0444, https://doi.org/10.4401/ag-6450, 2013.
Esposito, A. M., Giudicepietro, F., Scarpetta S., D'Auria, L., Marinaro, M., and Martini, M.: Automatic Discrimination among Landslide, Explosion-Quake, and Microtremor Seismic Signals at Stromboli Volcano using Neural Networks, B. Seismol. Soc. Am., 96, 1230–1240, https://doi.org/10.1785/0120050097, 2006.
Esposito, A. M., D'Auria, L., Giudicepietro, F., Caputo, T., and Martini, M.: Neural analysis of seismic data: applications to the monitoring of Mt. Vesuvius, Ann. Geophys., 56, S0446, doi:10.44 01/ag-6452, 2013.
Galluzzo, D., Del Pezzo, E., La Rocca, M., Castellano, M., and Bianco, F.: Source Scaling and Site Effects at Vesuvius Volcano, B. Seismol. Soc. Am., 99, 1705–1719, https://doi.org/10.1785/0120080142, 2009.
Ibs-von Seht, M.: Detection and identification of seismic signals recorded at Krakatau volcano (Indonesia) using artificial neural networks, J. Volcanol. Geoth. Res., 176, 448–456, https://doi.org/10.1016/j.jvolgeores.2008.04.015, 2008.
Kramer, S. L.: Geotechnical Earthquake Engeneering, Prentice-Hall Civil Engineering and Engineering Mechanics Series, Upper Saddle River, 653 pp., 1996.
La Rocca, M. and Galluzzo, D.: Seismic Monitoring of Mt. Vesuvius by Array Methods, Seismol. Res. Lett., 85, 809–816, https://doi.org/10.1785/0220130216, 2014.
La Rocca, M. and Galluzzo, D.: Seismic monitoring of Campi Flegrei and Vesuvius by stand-alone instruments, Annal. Geophys., 58, S0544, https://doi.org/10.4401/ag-6748, 2015.
La Rocca, M. and Galluzzo, D.: Volcanic tremor at Mt Vesuvius associated with low frequency shear failures, Earth Planet. Sci. Lett., 442, 32–38, 2016.
Malfante, M., Dalla Mura, M., Mars, J. I., Métaxian, J.-P., Macedo, O., and Inza, A.: Automatic classification of volcano seismic signatures, J. Geophys. Res.-Sol. Ea., 123, 10645–10658, https://doi.org/10.1029/2018JB015470, 2018.
McNutt, S. : Volcanic Seismology, Annu. Rev. Earth Planet. Sc., 32, 461–91, https://doi.org/10.1146/annurev.earth.33.092203.122459, 2005.
Sherburn, S., Scott, B. J., Nishi, Y., and Sugihara, M.: Seismicity at White Island volcano, New Zealand: a revised classification and inferences about source mechanism, J. Volcanol. Geoth. Res., 83, 287–312, https://doi.org/10.1016/S0377-0273(98)00022-5, 1998.
Vanmarcke, E. H.: Developments in Geotechnical Engineering, Elsevier, Vol. 15, 287–337, https://doi.org/10.1016/B978-0-444-41494-6.50011-4, 1976.
Zobin, V. Introduction to Volcanic Seismology, 3rd Edn., Elseiver, Amsterdam/New York/Tokyo, p. 559, 2017.