 | 11 Sep 2020
Spectral analysis of ground thermal image temperatures: what we are learning at Solfatara volcano (Italy)
Paola Cusano
Simona Petrosino
Fabio Sansivero
Giuseppe Vilardo
The Solfatara volcano in the Campi Flegrei caldera (Italy), is monitored by different, permanent ground networks handled by INGV (Istituto Nazionale di Geofisica e Vulcanologia), including thermal infrared cameras (TIRNet). The TIRNet network is composed by five stations equipped with FLIR A645SC or A655SC thermal cameras acquiring at nightime infrared scenes of portions of the Solfatara area characterized by significant thermal anomalies. The dataset processed in this work consists of daily maximum temperatures time-series from 25 April 2014 to 31 May 2019, acquired by three TIRNet stations (SF1 and SF2 inside Solfatara crater, and PIS near Pisciarelli boiling mud pool), and also consists of atmospheric pressure and air temperature time-series. Data pre-processing was carried out in order to remove the seasonal components and the influence of the Earth tides to the selected time-series. By using the STL algorithm (Seasonal Decomposition of Time Series by Loess), the time-series were decomposed into three components (seasonal, trend and remainder) to find seasonality and remove it. Then, a harmonic analysis was performed on the de-seasonalized signals in order to identify and remove the long-period tidal constituents (mainly fortnightly and monthly). Finally, Power Spectral Density was calculated by FFT Matlab algorithm, after applying an acausal Butterworth filter, focusing on the [15–120] d band, to check if characteristic periodicities exist for each site. The reliability and significance of the spectral peaks were proved by statistical and empirical methods. We found that most of the residual periodicities are ascribable to ambient factors, while 18.16 d for Pisciarelli site and 88.71 d for Solfatara have a possible endogenous origin.
- Article
(6206 KB) - Full-text XML
- BibTeX
- EndNote


Thermal remote sensing is largely used in active volcanic environment, as it allows to detect, analyse and monitor thermal phenomena associated with volcanic activity and to characterize volcanic deposits (Kervyn et al., 2007). Different types of volcanic thermal sources (fumarolic fields, lava domes, lava flows, lava lakes, etc.) can be monitored by different sensors (satellite, airborne, ground-based and portable sensors) (Spampinato et al., 2011; Harris, 2013; Blackett, 2017) in order to characterize volcanic thermal precursors. Thermal precursors can provide important information on the state of the volcanic system and highlight changes in the surface thermal anomalies, indicative of possible modifications in the volcano dynamics. Volcanic surveillance based on a thermal infrared ground camera is a powerful tool commonly used as an indicator of these changes (Caputo et al., 2019). Several works on field observations of the ground thermal features have allowed to identify spatio-temporal changes of volcanic thermal anomalies as precursors of an eruption. Kieffer et al. (1981) found that the pre-existing thermal anomaly undergone to structural failure with an increasing of thermal activity before 18 May 1980 eruption at Mount St. Helens. Hernández et al. (2007) used a handheld thermal camera to monitor the crater lake of the Santa Ana volcano, finding that thermal infrared images of the crater provided precursory signals several days before the eruption. Indeed, a significant increase in the extent and intensity of the fumarolic field inside the crater rim and of the surface temperature of the crater lake was observed. In their study, Calvari et al. (2004) monitored two eruptions, at Mt. Etna and Stromboli, both occurred in 2002–2003, with a handheld thermal camera and revealed a failure and instability on the flanks of the volcanoes before the opening of fractures. Over the last few decades, various studies have been done at Campi Flegrei caldera (CFc, Southern Italy) using data from different thermal infrared (TIR) sensors; from satellite thermal sensors (Silvestri et al., 2016), ground-based TIR permanent network (Vilardo et al., 2008, 2015; Sansivero and Vilardo, 2019), up to surveys by hand-held thermal cameras (Marotta et al., 2019). The main goal of all these studies was to highlight spatio-temporal changes of the amount of the emitted thermal energy by assessing ground temperatures field modification.
Campi Flegrei is a nested caldera placed to the west of the urban area of Naples (Italy, Fig. 1), with an extension of about 65 km2. Its formation lasted 50 ka, mainly with the two devastating eruptions of the Campanian Ignimbrite (about 40 ka; Costa et al., 2012; Giaccio et al., 2017) and the Neapolitan Yellow Tuff (about 15 ka; Orsi et al., 1992; Scarpati et al., 1993; Deino et al., 2004). The most recent eruption, Monte Nuovo, occurred in 1538 AD (Di Vito et al., 1999, 2016). In the last 10 ka CFc is affected by the alternation of caldera uplift and subsidence phases, and the phenomenon is locally called “bradyseism”. In recent times, two main ground uplift episodes occurred, in 1969–1972 and 1982–1984, with a maximum net ground displacement of 3.5 m a.s.l. (Del Gaudio et al., 2010). From 2005, after a 20 years' phase of prevailing deflection, the CFc has experienced a new slow-rate uplift phase, with a total maximum vertical displacement of about 0.63 m detected until 2019 (Bevilacqua et al., 2020). The bradyseism seems to be ruled by the dynamics of the magmatic-hydrothermal system (Chiodini et al., 2016). It is composed of a deep gas accumulation zone at about 4 km of depth, possibly related to a small magma batch, and a hydrothermal reservoir at about 2 km of depth, where upwelling magmatic fluids mix meteoric water. At present, the ground deformations are accompanied by seismicity, diffuse soil CO2 degassing and a strong fumarolic activity, mainly concentrated in the highly hydrothermally active zones of Solfatara crater, Pisciarelli site, and the immediate surroundings (Fig. 1a). The coincidence on plan view between the elongated shape of the CO2 anomalies and the alignments of the structural features suggests that the diffuse degassing is strongly controlled by faults and fractures (Chiodini et al., 2001; Granieri et al., 2010). The main fault system inside the Solfatara (Fig. 1a) shows a NW-SE striking, and a secondary one strikes along NE-SW direction. The main fumarolic fields are located at the intersection between the two fault systems (Bocca Grande) and along the NW-SE faults that cross the north-eastern crater wall (Stufe). CO2 degassing is concentrated in the SE sector, while the NW sector is almost inactive. Pisciarelli area (Fig. 1a) is a fault-related fumarolic field, recently affected by shallow seismicity (http://www.ov.ingv.it/ov, last access: 2 September 2020). Its hydrothermal activity has shown a clear increase during the ongoing unrest phase and the area presents large bubbling mud pools, characterized by high flow rate fumaroles, emitting a H2O-CO2 gas mixture with minor H2S. On plan view the CO2 anomaly is elongated toward NW, along with the fault system (Granieri et al., 2010).
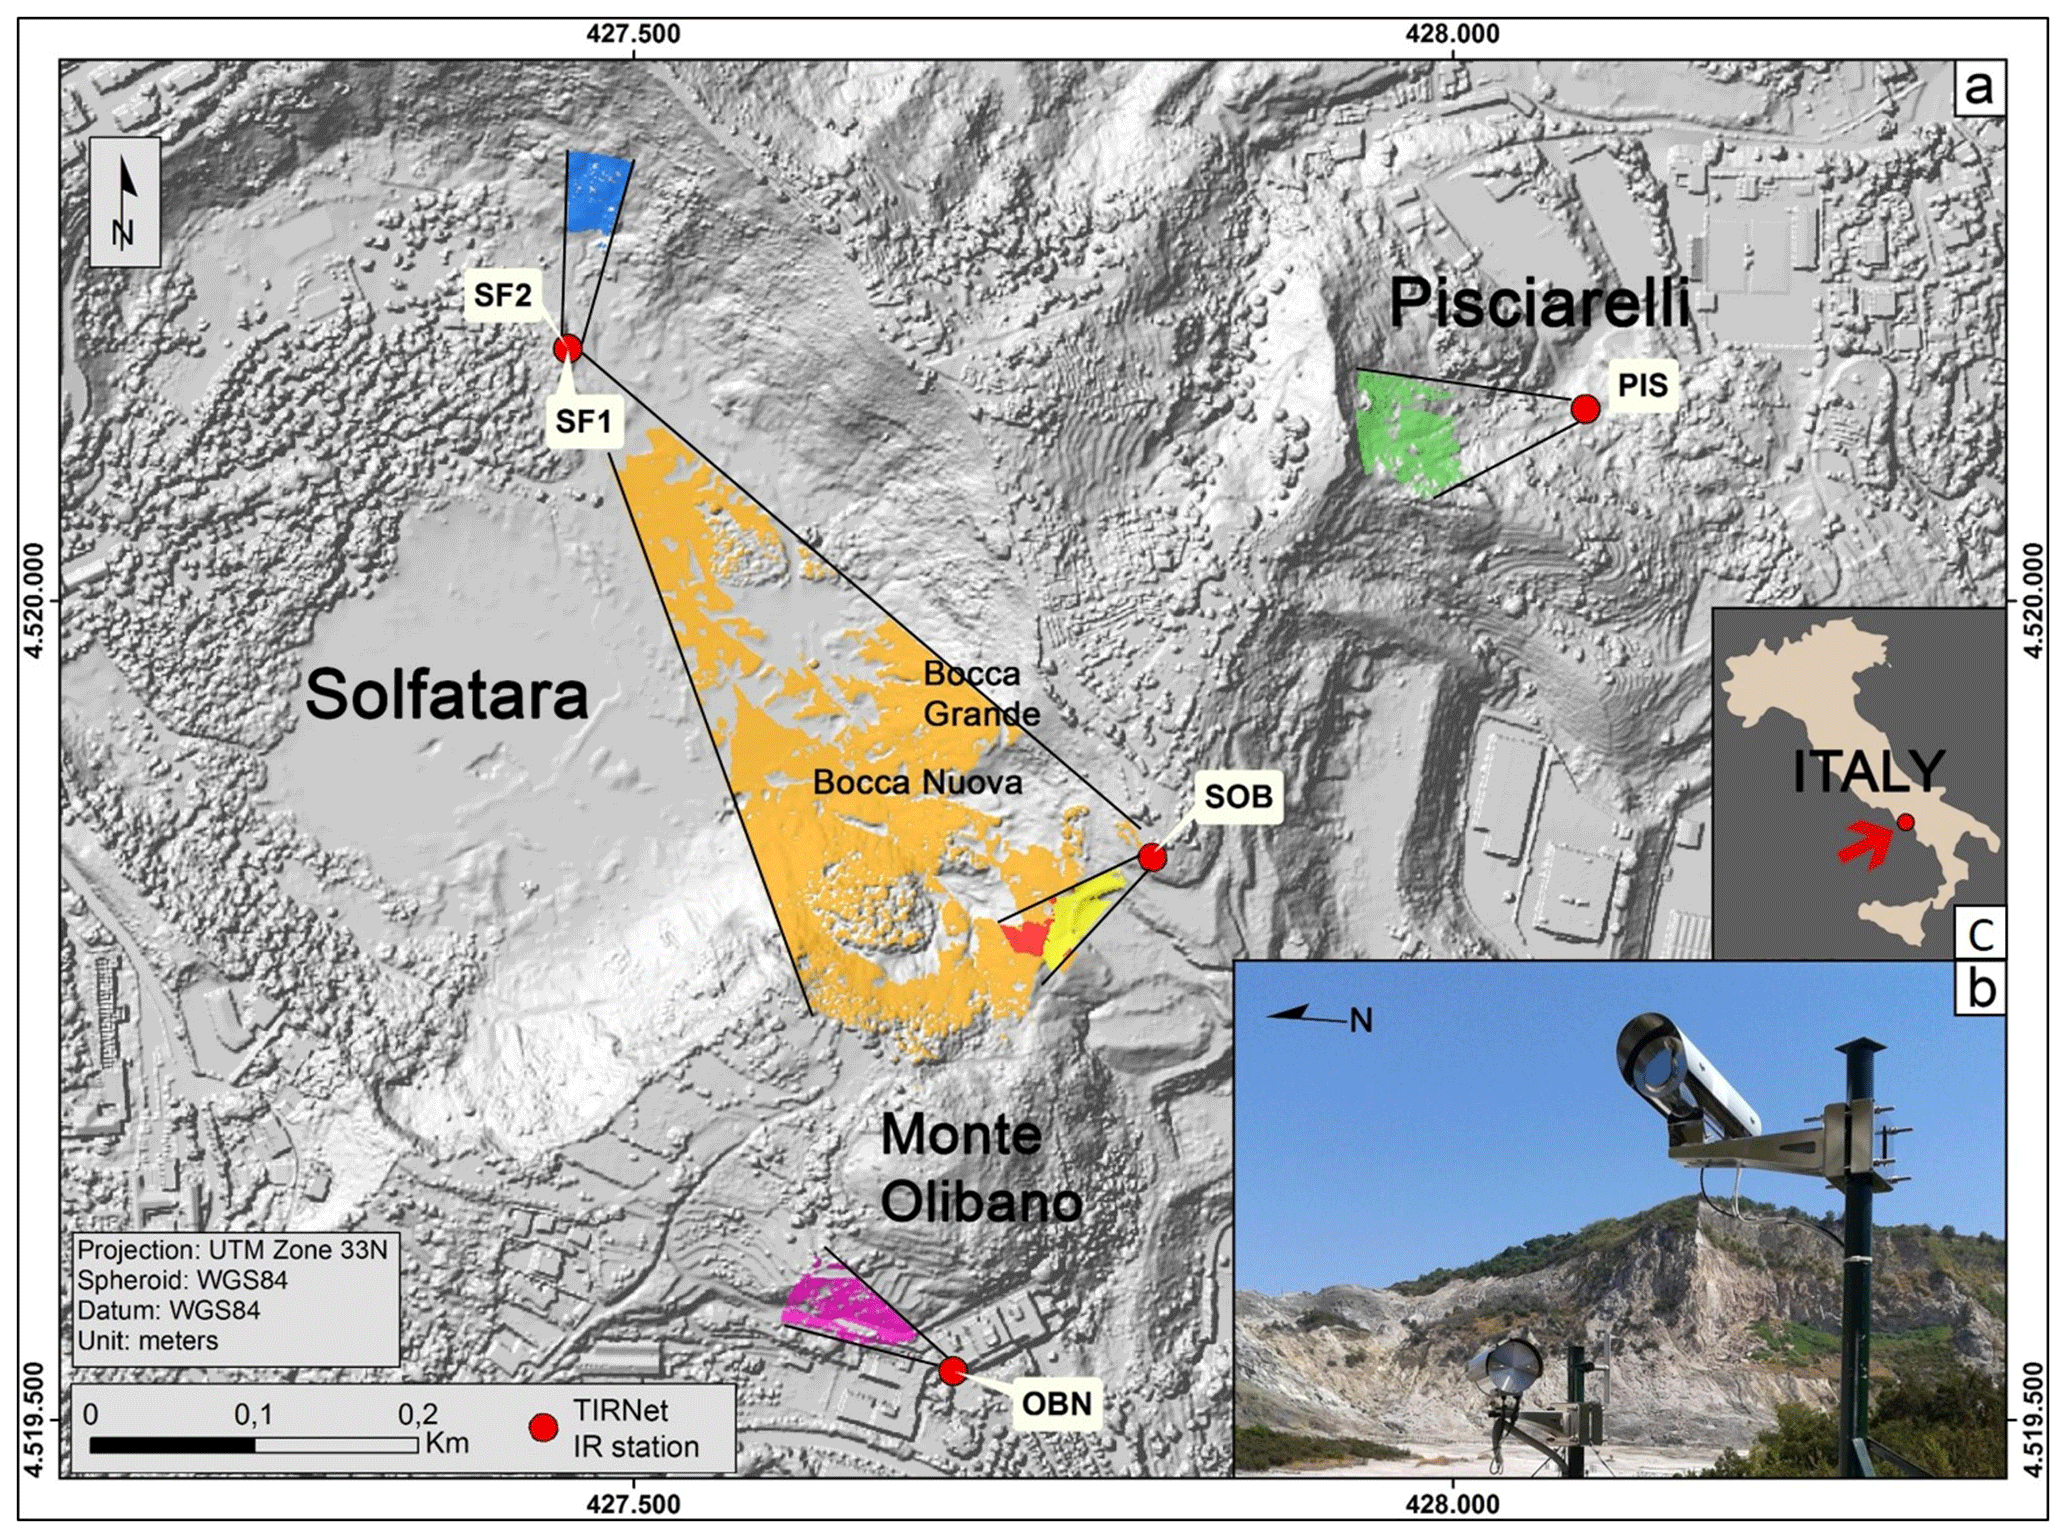
Figure 1(a) Digital Terrain Model (DTM) of Solfatara crater (Vilardo et al., 2013) with location of TIRNet stations (red dots) and studied framed areas mapped in GIS environment by using Field of View (FoV) values of infrared sensors. The area framed by SF1 is highlighted in orange, SF2 in blue, PIS in green, OBN in magenta, SOB in yellow and the common area between SF1 and SOB in red. (b) Picture of the TIRNet station site inside Solfatara crater (SF1 and SF2), composed of two TIR cameras pointing towards two different anomaly areas. The photo contained in Fig. 1 was taken by authors. (c) The position of the study area on the Italian territory is indicated by a red arrow.
The present paper is a first attempt to detect periodicity in long time-series of temperature acquired by TIR cameras in the Solfatara and Pisciarelli areas (CFc), with the aim to verify if characteristic periods exist for each site end/or to recognize common possible periodic phenomena among the TIR stations. We performed a harmonic analysis on the TIR and atmospheric temperature time-series to remove the seasonal and tidal components by using STL and T_Tide software (Pawlowicz et al., 2002), respectively. Then, we estimated the Power Spectral Densities (PSD) of all the time-series and carried out a statistical analysis, based on the Rayleigh criterion, in order to verify the significance of the emerged periodicities. Similar studies are uncommon in scientific literature and our approach is innovative for the CFc.
2.1 Sensors and data acquisition
The permanent ground-based Thermal Infrared Network (TIRNet) has been installed for the first time in 2006 at CFc for volcanic surveillance purpose. At present time the network consists of 5 stations at CFc and 1 station at Vesuvius crater monitoring areas characterized by significant thermal anomaly due to diffuse degassing activity (Sansivero et al., 2013; Vilardo et al., 2015; Sansivero and Vilardo, 2019). The monitoring activity is carried by Osservatorio Vesuviano (OV), Section of Istituto Nazionale di Geofisica e Vulcanologia (INGV). In this work, we used TIR frames acquired by three TIR cameras installed respectively at Solfatara crater (Fig. 1, SF1 and SF2) and at Pisciarelli area (Fig. 1, PIS), since the acquisition time-interval of about 5 years (25 April 2014 to 31 May 2019) is long enough to have significant spectral components up to seasonal periodicity. SF1 monitors the SE inner slope of Solfatara crater, including Bocca Grande and Bocca Nuova fumaroles. SF2 monitors the cryptodome area beside the inner NW slope of Solfatara and PIS monitors the area close to the base of south-eastern Solfatara rim (Fig. 1). The distance between sensor and target area ranges from 80 m up to a maximum of about 340 m (Sansivero and Vilardo, 2019; Caputo et al., 2019). The acquired scenes are sent via WiFi radios or UMTS to the surveillance centre of INGV-OV and an automated Matlab© application (ASIRA – Automated System of InfraRed Analysis; Sansivero and Vilardo, 2019) processes the TIR data. The TIR stations are equipped with FLIR cameras A645SC/A655SC having a Focal Plane Array (FPA) uncooled Microbolometer detector, whose resolution is 640×480 pixels with a high accuracy ±2 ∘C, a spectral range of 7.5–14 µm and a thermal sensitivity <0.03 ∘C ±30 ∘C. The TIR cameras acquire three frames of the target area every day, at night time (00:00, 02:00, 04:00 a.m.). For our analysis we use the maximum temperature value among all the three acquired frames for each camera.
Meteorological data are acquired from a station installed inside Capo Miseno lighthouse, in Bacoli town. The used station is VAISALA all-in-one model WXT520, which records six parameters: relative humidity, environmental temperature, atmospheric pressure, rain, velocity and direction of wind. The meteorological station acquires with OTT data logger LogoSens2 every ten minutes and then transmits data to INGV-OV by HIPERLAN (HIgh PErformance Radio LAN). The meteorological time-series consist of one value per day, extracted at 04:00 a.m., of environmental pressure (Patm, in mbar) and temperature (Tatm, in Celsius degrees). For the present analyses, we used 5-year-long TIR and meteorological time-series acquired from 25 April 2014 to 31 May 2019.
2.2 Data pre-processing
2.2.1 Seasonal component removal
The three TIR imagery time series acquired at SF1, SF2 and PIS are processed with the last version of automated Matllab® application ASIRA (Sansivero et al., 2013; Vilardo et al., 2015; Sansivero and Vilardo, 2019). The TIR raw scenes are converted in 3D arrays in order to process them in Matlab® environment. As raw values of temperature time-series show typical seasonal periodicities (Fig. 2a), we removed the seasonal component by applying the STL decomposition method as described in Sansivero and Vilardo (2019). STL is a package running in R programming ambient (https://www.rdocumentation.org/packages/stats/versions/3.6.2/topics/stl, last access: 2 March 2020; R Core Team, 2018) and it is an acronym for “Seasonal and Trend decomposition using Loess”, where Loess is a method for estimating nonlinear relationships developed by Cleveland et al. (1990) to decompose temperatures time-series into three components: Trend, Seasonality and Reminder. The procedure consists of removing from all pixels' temperatures time-series of raw 3D arrays the seasonal component (i.e. the Seasonality component extracted by applying STL) related to a background area inside TIR scenes. By this way a 3D array of de-seasonalized IR frames is produced (Sansivero and Vilardo, 2019). Figure 2 shows the daily raw temperatures time-series of SF2 station (a), the three components: seasonal (b), trend (c) and remainder (d) extracted by applying STL decomposition method, and the de-seasonalized temperatures time-series (e) obtained by subtracting seasonal component to RAW data. From Fig. 2c, it can be seen that a peculiar trend affects the de-seasonalized time series at SF2. Certainly, this trend is not ascribable to seasonal effects and, at least on the analysed time scale, it does not present a periodic behaviour. Surely, it will be object of future analysis.

Figure 2Decomposition plots of daily temperature time-series at SF2 station: (a) raw temperature data, (b) seasonal time-series for the investigated time range, (c) trend, (d) remainder and (e) de-seasonalized data.
2.2.2 Harmonic analysis
As further data pre-processing, we performed a harmonic analysis on the de-seasonalized 5-year-long temperature time-series by using the T_Tide software (Pawlowicz et al., 2002). In fact, the de-seasonalized signals can contain components related to medium/long period tidal constituents that should be removed before further processing (De Lauro et al., 2018). By applying the T_Tide software, we identified and removed the following components: lunisolar fortnightly (Mf, T=14.76 d), lunisolar synodic fortnightly (Msf, T=13.66 d), lunar monthly (Mm, T=27.55 d), solar monthly (Msm, T=31.81 d), solar semiannual (Ssa T=182.63 d) and solar annual (Sa, T=365.26 d). These components appear in the temperature time-series acquired at all the three sites (Fig. 3); the solar annual and semiannual constituents have almost comparable amplitudes, indicating a similar response of the ground temperature to long period tidal strains. On the other hand, the amplitudes of the monthly and fortnightly ones show some slight differences depending on the site. The tidal signature in the geophysical signals at CFc is not surprising: periodicities related to tidal constituents have also been found in ground tilting (De Lauro et al., 2018; Ricco et al., 2019; Petrosino et al., 2020) and seismic activity (De Lauro et al., 2012, 2013; Petrosino et al., 2018), suggesting a relevant influence of Earth tides on the caldera dynamics. In addition, the site rheology can modulate the amplitude of the medium response to tidal forces (De Lauro et al., 2018; Petrosino et al., 2020).
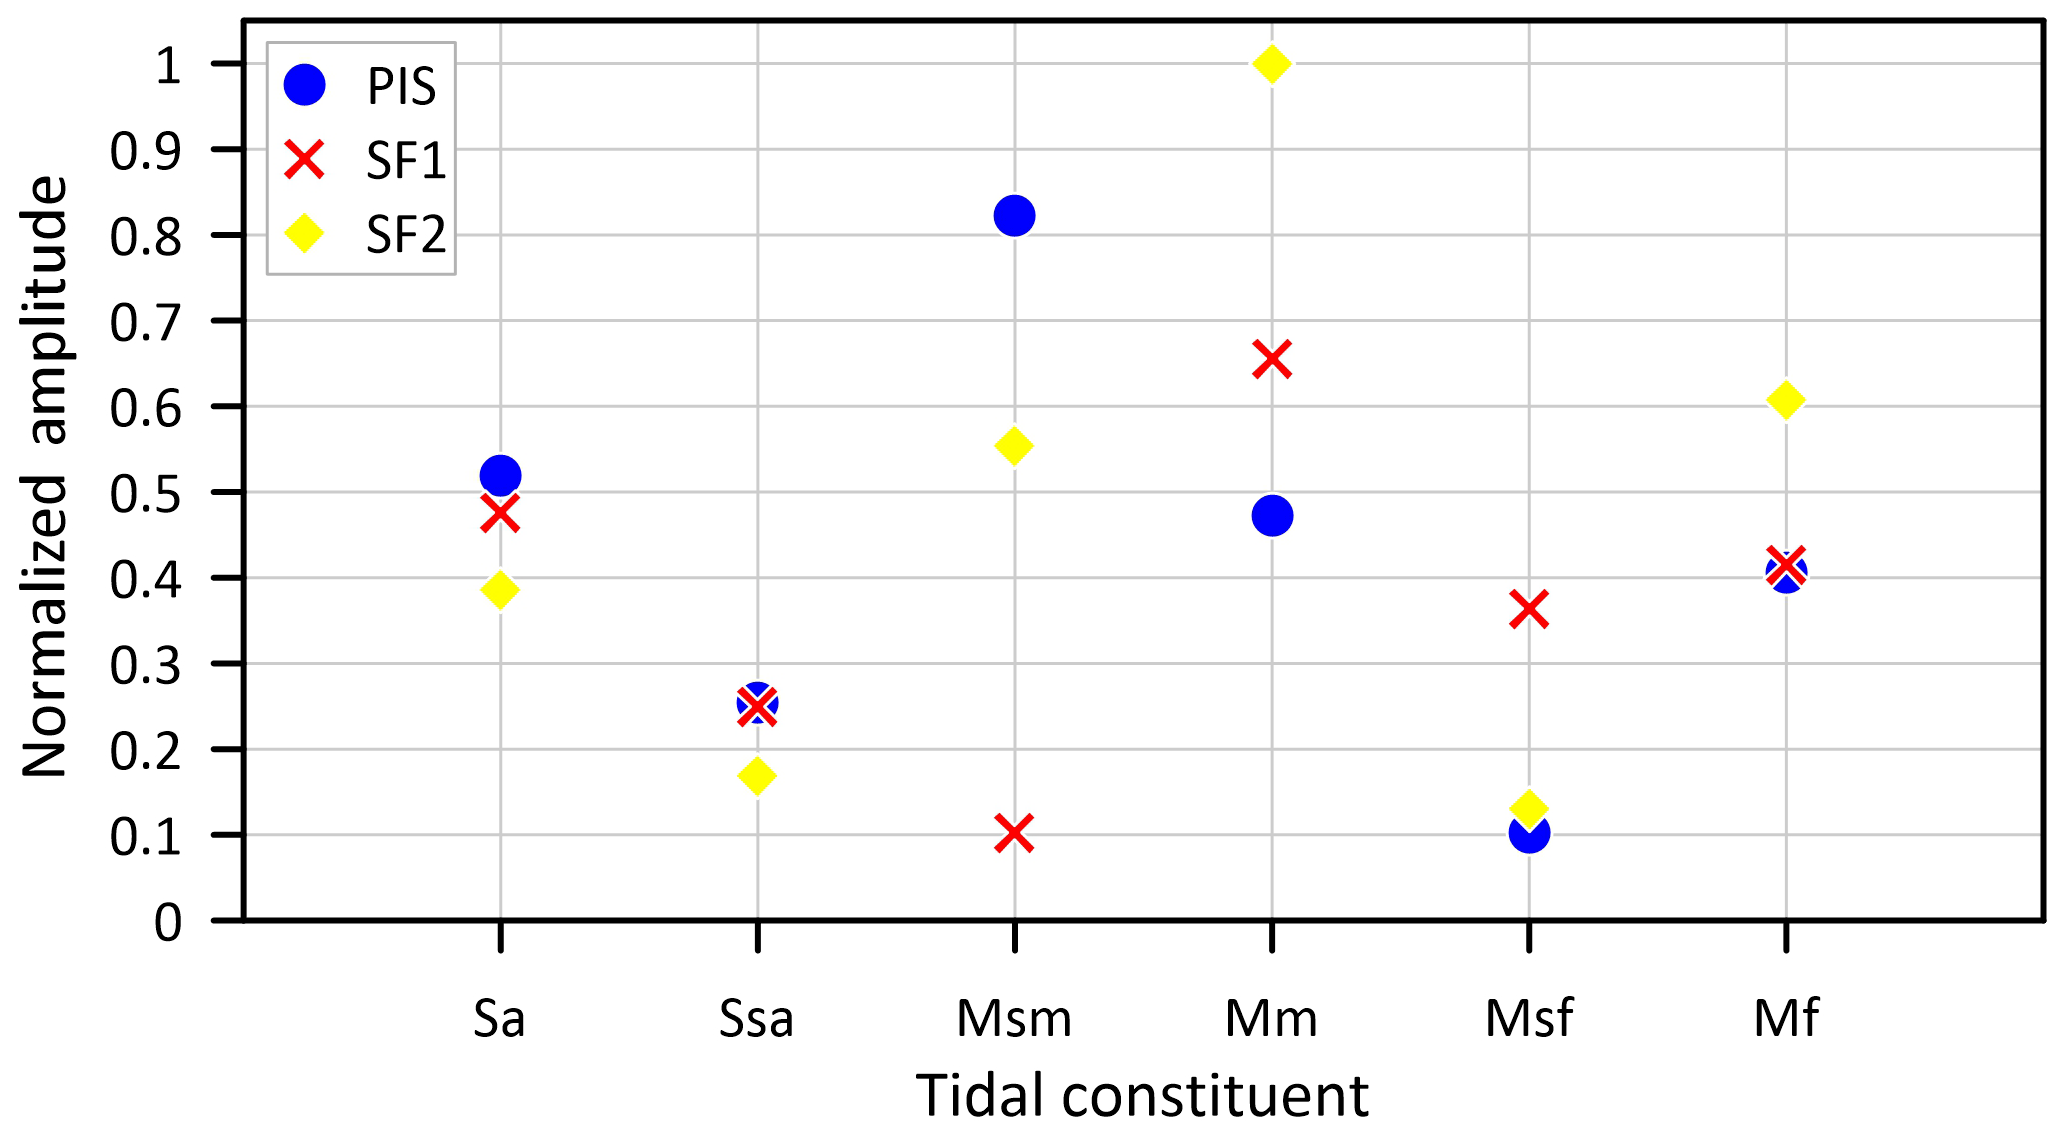
Figure 3Amplitudes (normalized to the maximum) of the tidal constituents identified in the temperature time-series recorded by the three TIR cameras.
The pre-processing was applied to the TIR, environmental pressure (Patm) and temperature (Ten) time-series (Fig. 4).
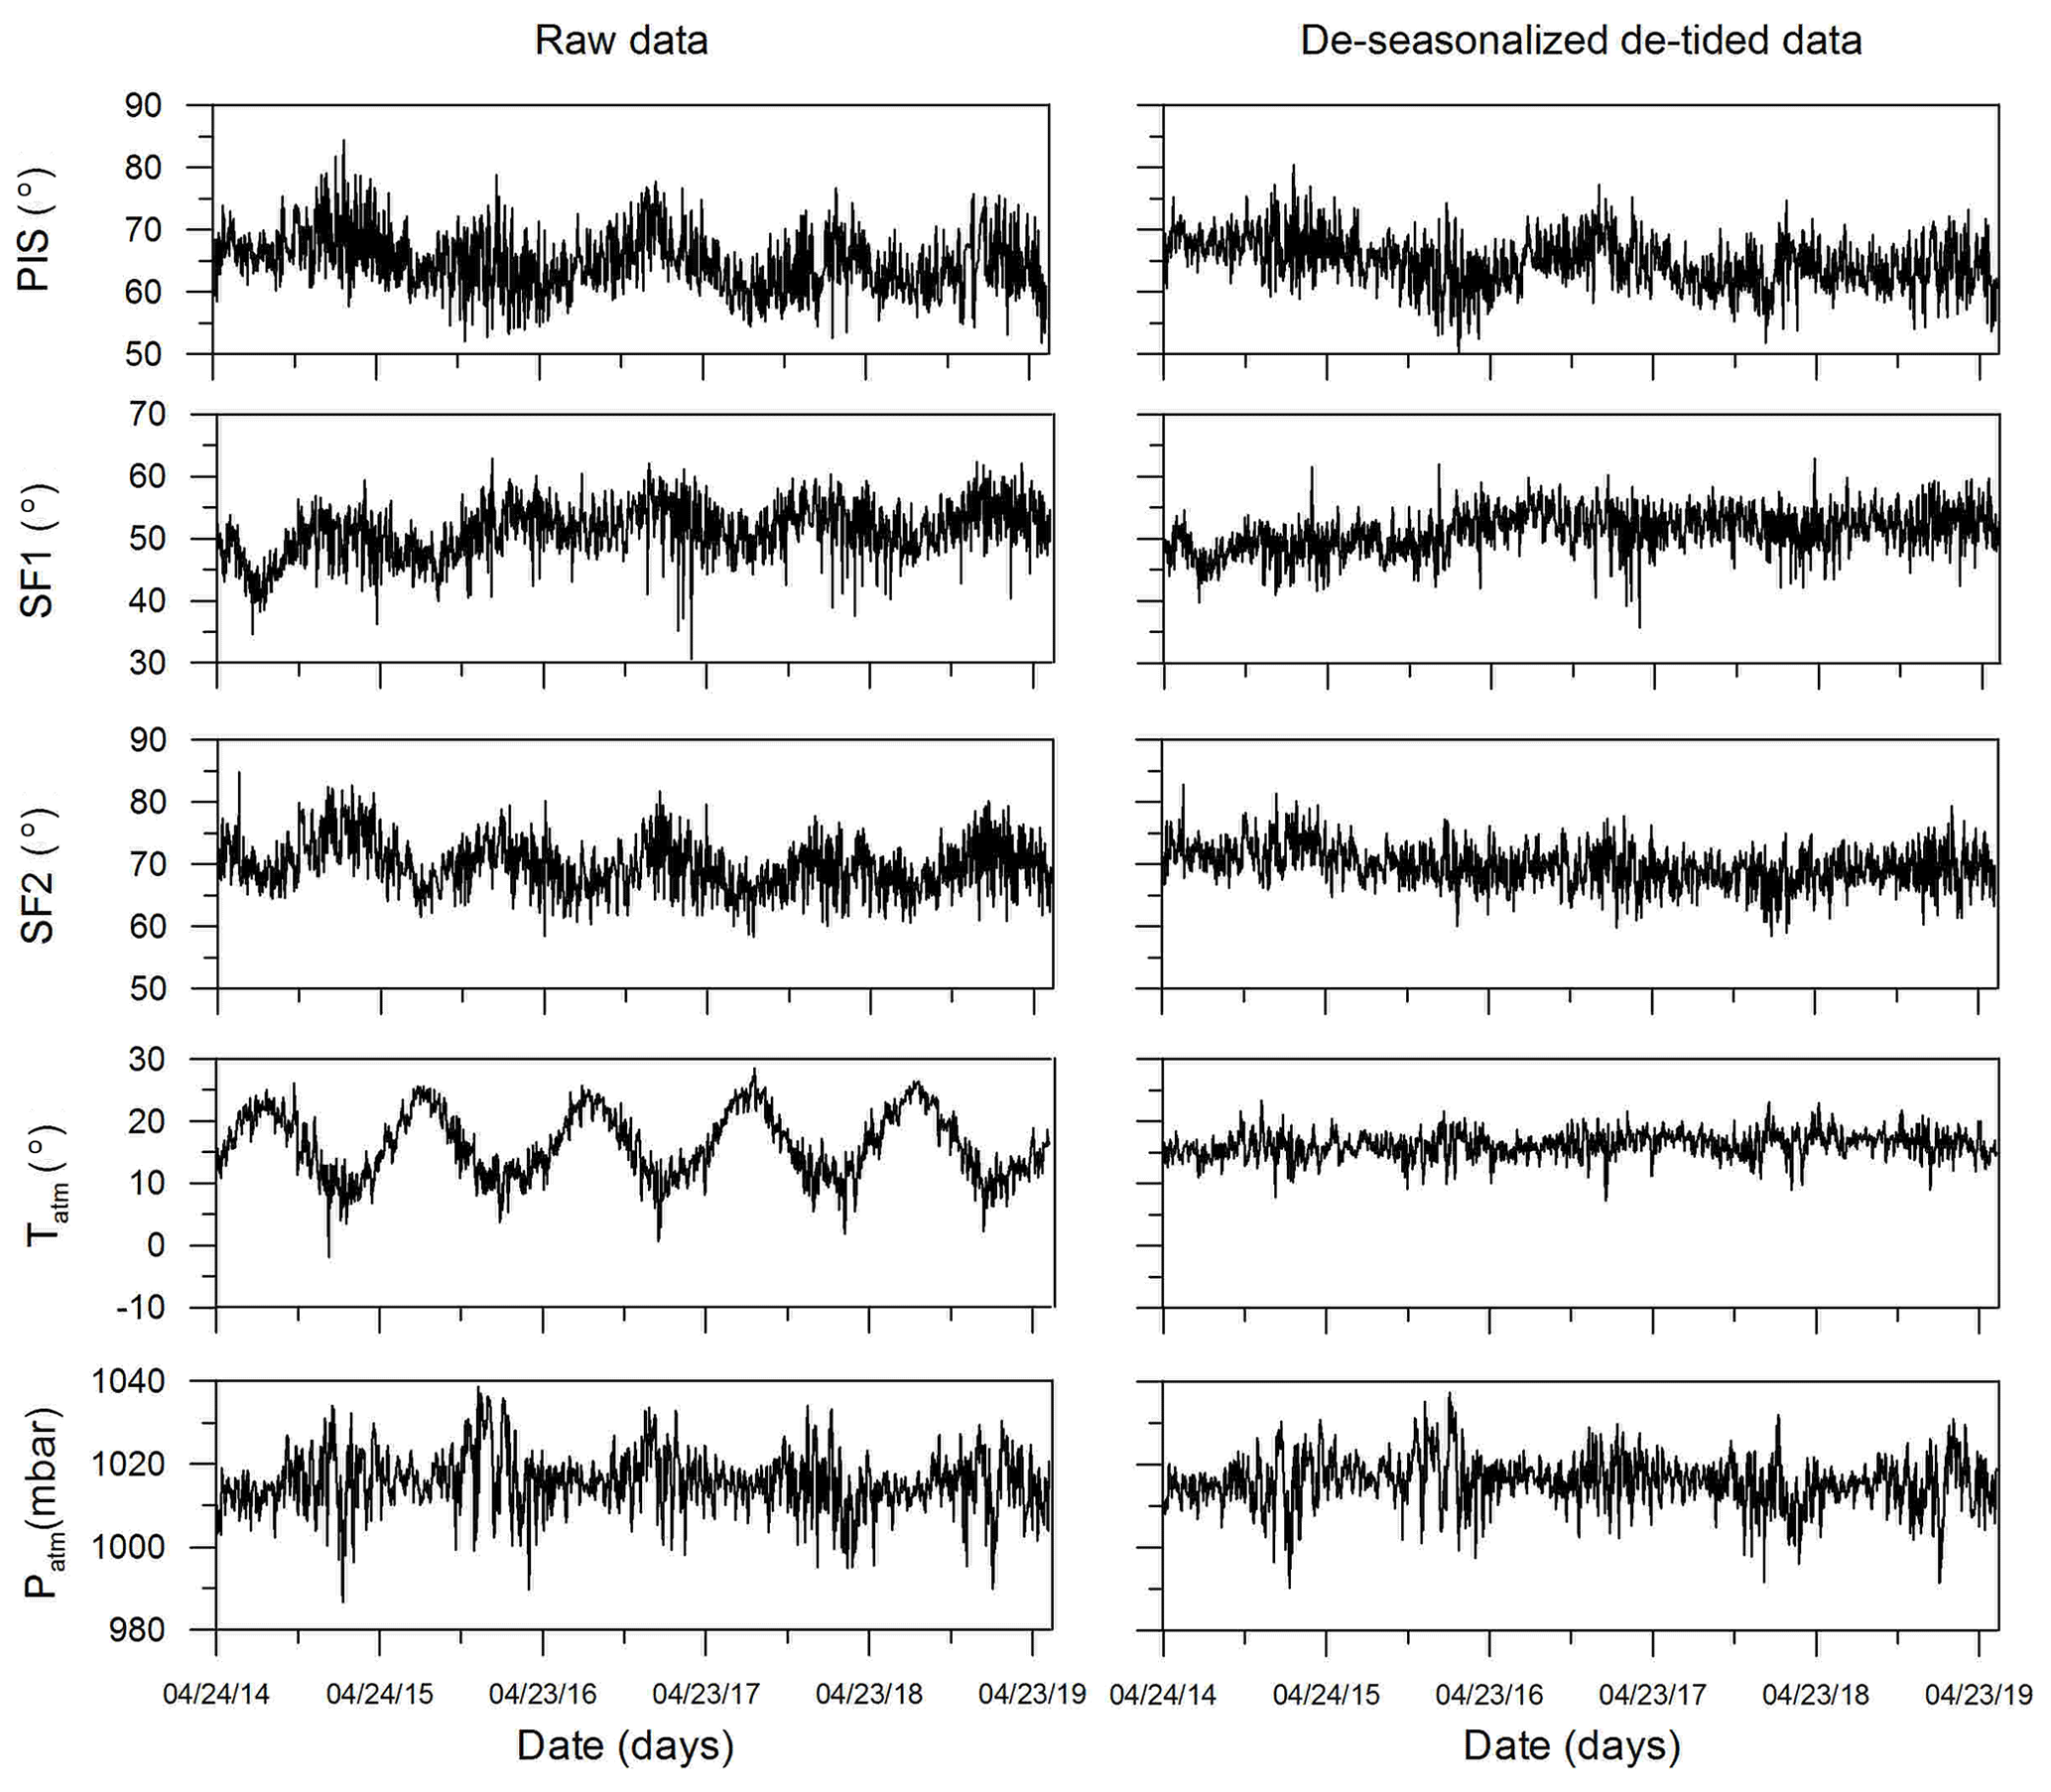
Figure 4Time-series analysed in this study. On the left we show the raw time-series and on right the time-series corrected from the seasonal and tidal periodicities.
3.1 Spectral analysis
The spectral analysis was performed by applying the Fast Fourier Transform (FFT) algorithm to all the dataset, TIR and meteorological time-series, each one composed of 1863 samples with a rate of 1 sample per day. First, an acausal bandpass Butterworth filter with lower and higher cut-offs at 15 and 120 d was used. Then we estimated the PSDs of all the time-series, and normalized them respect to the own maximum in order to make comparable thermal and barometric spectral peaks. Finally, we represented the normalized PSDs as function of period (T=1/frequency) (Fig. 5).
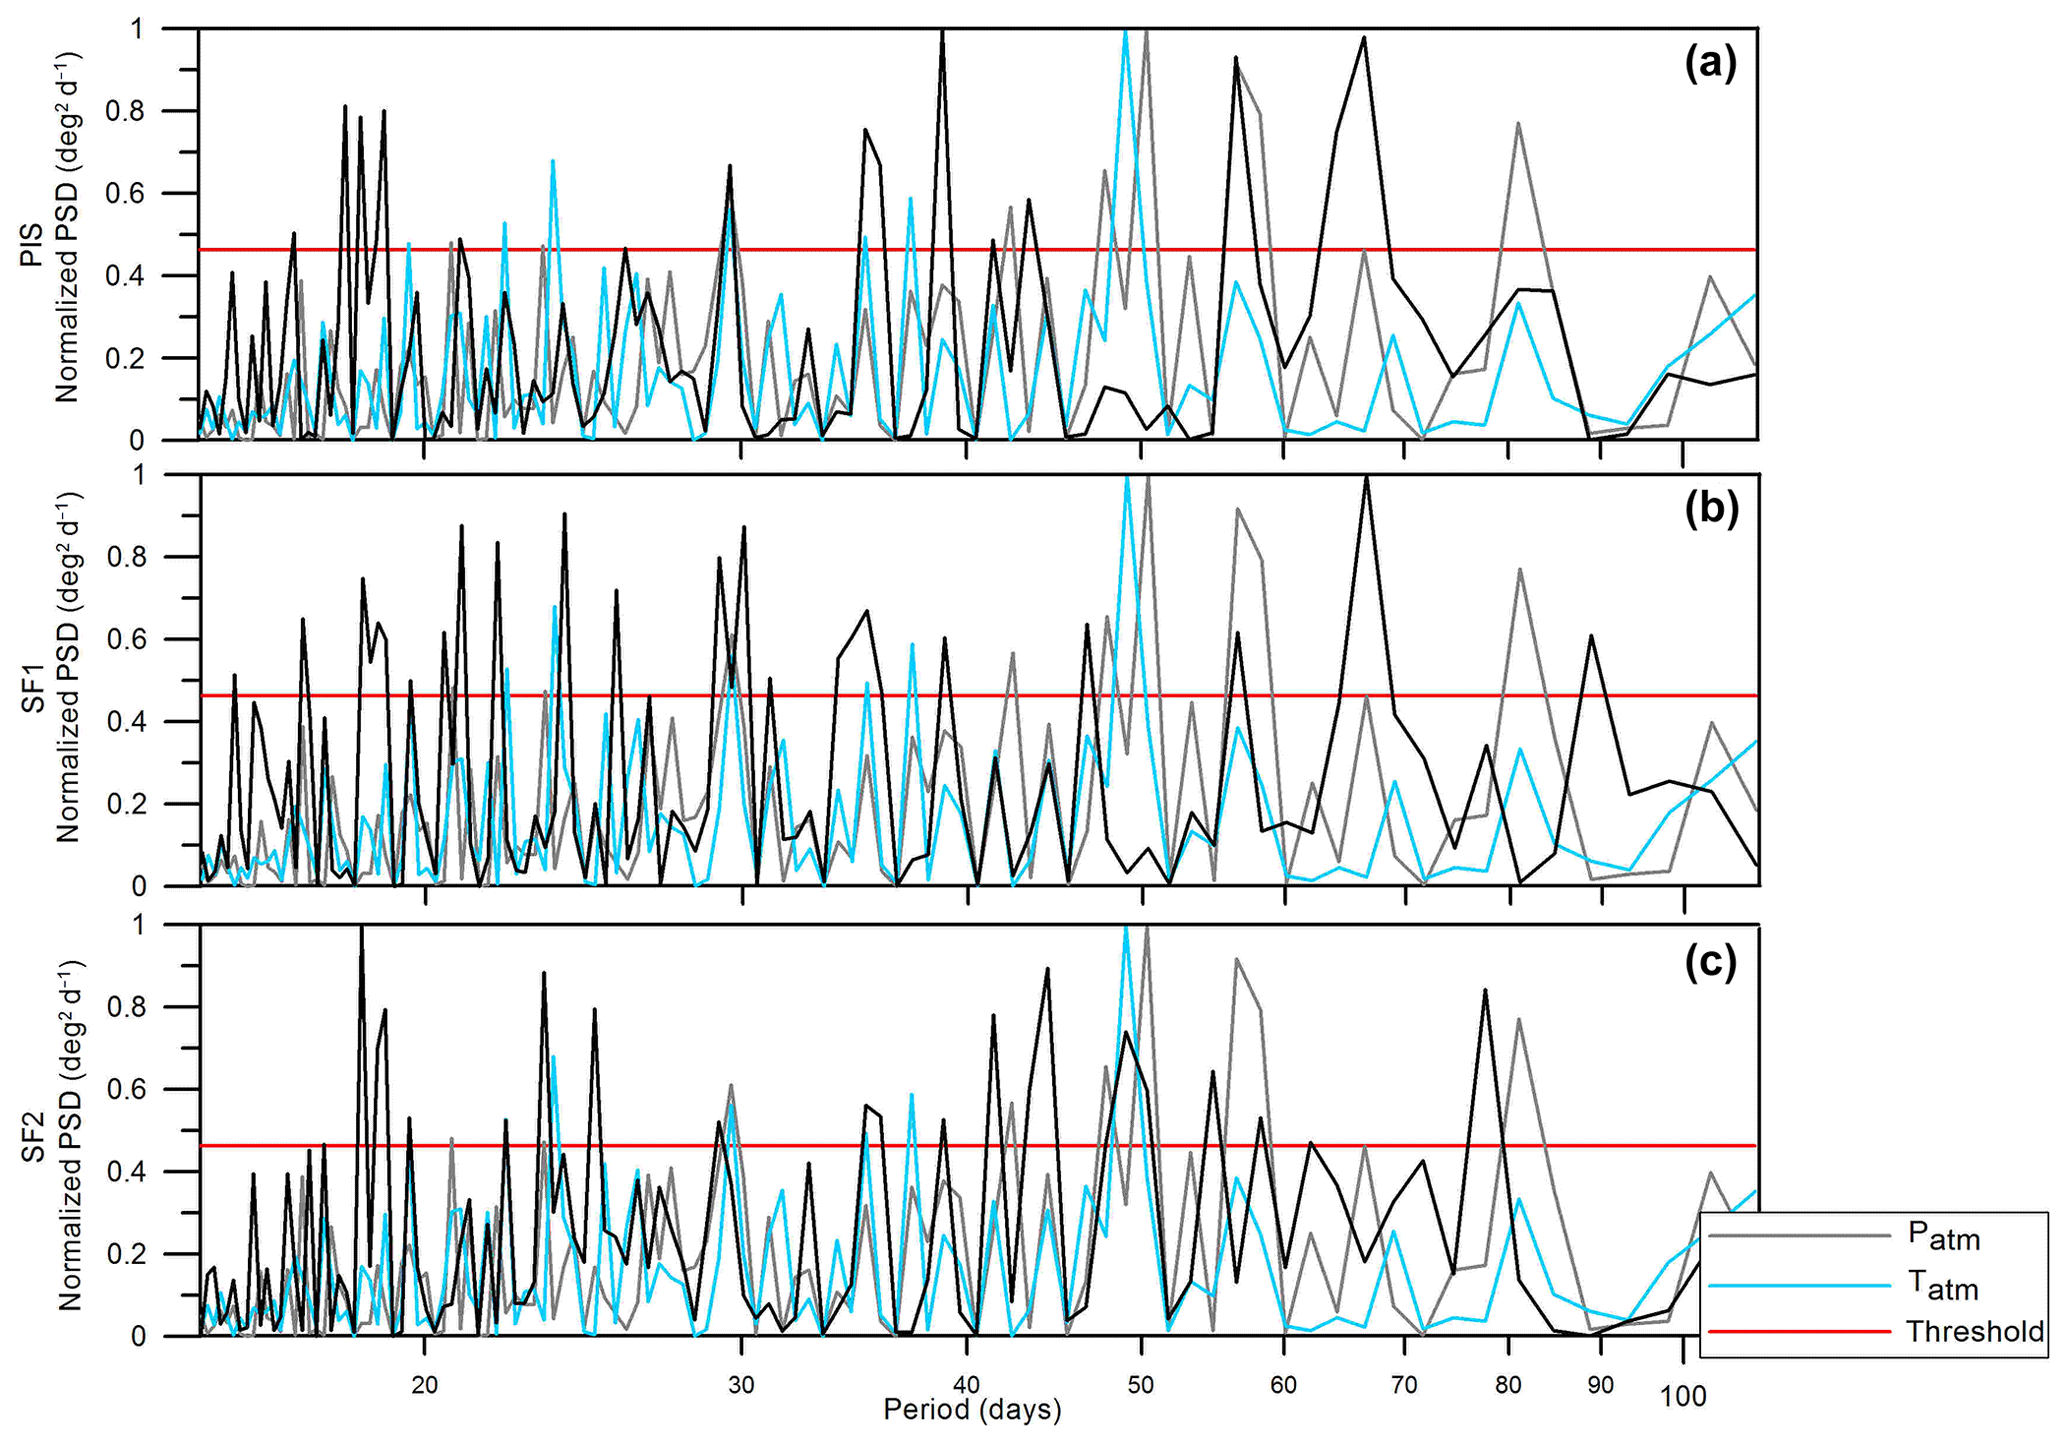
Figure 5Power Spectral Densities as function of periods (days). The name of TIR stations is indicated on the vertical axes. Each TIR PSD (black lines) is superimposed to Patm (grey lines) and Tatm (cyan lines). All the PSDs are normalized to their own maximum. Red horizontal lines indicate the thresholds for the high values of spectral amplitudes (see statistical analysis for details). The horizontal axes are in log scale.
3.2 Statistical analysis
A cut-off at 15 d has been applied to the PSDs to remove the effect of background ambient noise due to the short period variability of the environmental parameters: air humidity, wind speed, etc., which influence the measured ground temperatures, and/or to remove anthropic or sea water effects. On the other hand, for this study we do not consider the periodicities longer than 120 d (4 months), since we intend to concentrate on the short period periodicities that are generally linked to volcanic gas emissions, as observed worldwide (Pering et al., 2019).
The aim of this analysis is to identify if there are either peculiar periodicities of each TIR site or common periodicities between TIR temperature and environmental factors. We focused our attention on the peaks with a high value of amplitude, taking , where PSDnorm indicates the normalized PSD, is its mean value and its standard deviation. In this way we define a threshold for the high spectral amplitude values and consider the peaks close or above about 50 % of the PSDs' maximum (Fig. 5). This choice is directed to individuate possible periodic constituents that emerges over what can be considered as background, rather than to provide a rigorous statistical significance.
TIR PSDs share some peaks with the meteorological observables (Fig. 5):
-
18.45, 19.01 and 19.61 d, peaks in all the TIR time-series and Tatm;
-
29.57 d, in all. At SF1the peak splits in two;
-
35.15, 38.81, 41.40 and 44.36 d, common to all;
-
49.03 d, common between PIS (very small), SF2, Patm and Tatm;
It can be also noticed that for periods >50 d SF2 has a peculiar behaviour, while SF1 and PIS show a pattern common with the environmental parameters. In general, for the TIR peaks that show a perfect coincidence with the environmental factors, it is reasonable to assume an atmospheric origin, thus they do not need further analysis. In the first column of Table 1, we report the periods that do not exactly match the meteorological periodicities, and can be considered as candidates to be characteristic of a TIR site. We indicate with ai, bi and ci the periods for PIS, SF1 and SF2 respectively.
Table 1Results of Rayleigh criterion. Grey rows separate the statistics relative to different TIR datasets. The columns, from the left to the right, show: (1) period, T; (2) [Tmin, Tmax] interval; (3) period of the lower adjacent peak of Patm; (4) period of the higher adjacent peak of Patm; (5) period of the lower adjacent peak of Tatm; (6) period of the higher adjacent peak of Tatm; (7) Summary results. When an adjacent period results to be statistically distinct from T (outside [Tmin, Tmax]), bold font is used, otherwise a statistical link is possible (T inside [Tmin, Tmax]). All the periods are in days.

We applied the Rayleigh criterion (Godin, 1972) to determine if a TIR period can be considered distinct from the adjacent peaks of the time-series, as well as statistically independent from the peaks related to the atmospheric parameters. According to this method two harmonic constituents are resolved if their frequencies, fi and fj, satisfy the relation , where τ is the series length and r is the Rayleigh coefficient. Hence, a certain peak at period T can be considered distinct from another at T1, if T1<Tmin or T1>Tmax, with
Generally, r is fixed at 1 and in the present case τ is equal to 1863 (samples). Obviously, this criterion allows also to establish if two peaks of the same time-series could be considered distinct or not. For example, for the peak at a1 (Table 1) of PIS site, we have Tmin=17.93 d and Tmax=18.28 d. Therefore, the peak at a1 is statistically distinct from the adjacent peaks of PIS, and those of Patm and Tatm (Table 1).We can be confident that a1 is a characteristic periodicity for the PIS site. According to the criterion, all the peaks whose period is reported in Table 1 result distinct from the adjacent ones. The results of the comparison with the periodicities of the atmospheric parameters are synthesized in Table 1.
In summary, by applying the Rayleigh criterion, we found that two peaks are characteristic for the corresponding site, a1 (18.16 d) for PIS and b6 (88.71 d) for SF1, and all the others are likely linked to atmospheric factors.
In this work we carried out an innovative analysis on the maximum IR frames temperatures acquired by the TIRNet surveillance network at Solfatara and Pisciarelli areas (CFc) with the aim of finding eventual periodicities possibly linked to endogenous local sources. We focused the attention on the [15–120] d band: the choice to fix a lower cut-off at 15 d arises to exclude high frequency thermal noise, whose sources could be related to low period fluctuations of air humidity, wind speed, etc., that influence the degassing from the soil. Previous studies experienced the typical periods of these disturbances to fall below the fixed lower cut-off. For instance, Chiodini et al. (2005) find that the high frequency variations in soil temperature in Solfatara are due to the rainfall episodes which also produce peaks in the soil humidity, with typical cycles of 4–5 d. The heating produced by urban traffic, linked to anthrophic sources, is characterized by periodicities of 24 h and 7 d (Petrosino et al., 2012; Bianco et al., 2010). Other anthropogenic sources, such as factories, irrigation systems, greenhouses or solar panel expanses, are not present in the nearby surroundings, and hence their influence is not considered. We are also confident that our data are not contaminated by false effects due to the caldera morphology, i.e. the build-up of periodicities in the gas emissions related to the perturbation of the local wind field by topographic features. In fact, this phenomenon has characteristic periods on the order of minutes (Pering et al., 2019), which is below our data sampling rate (1 sample per day). The presence of the seasonal cycles in the TIR data does not surprise. Vilardo et al. (2008) investigated the dependence of TIR time-series on environmental parameters at Solfatara and Vesuvius volcanoes. They retrieved that atmospheric temperature controls 92 %–97 % of the TIR temperature variance, implying a strong seasonal control on the all TIR frames. Moreover, seasonal periodicities of CO2 degassing have been found in the study area by Granieri et al. (2010) that observed a correspondence between wet seasons (autumn–winter) and higher-flux periods. We efficiently removed such effects by applying STL decomposition method (Fig. 2), which is currently used for Solfatara and Vesuvius TIR data (Sansivero and Vilardo, 2019; Caputo et al., 2019) and, hence, such periodicities are not present in the subsequent estimated PSDs (Fig. 5). In addiction a non-volcanic mechanism could affect TIR raw data: it is tidal forcing. T_Tide software has permitted us to individuate and filter for the tidal constituents shown in Fig. 3 and common to all the TIR sites. It is noteworthy that the same periodicities have also been retrieved in seismic activity (Petrosino et al., 2018) and ground tilting (De Lauro et al., 2018; Ricco et al., 2019; Petrosino et al., 2020), suggesting that many geophysical observables reflect the influence of Earth tides on the caldera dynamics. The PSDs estimated from the TIR series, resulting from the abovementioned data pre-processing, seem largely conditioned by environmental parameters (Fig. 5). The Rayleigh criterion indicates that all the high energy TIR peaks (spectral amplitude above the threshold in Fig. 5) are significant respect to the spectral resolution limits and they are almost likely influenced by ambient temperature and pressure. We are confident that the measures of environmental parameters and TIR temperatures are independent since the relative acquisition devices are about 6 km distant. From the results of Rayleigh statistical analysis, it is reasonable to assume that the generation of most of PSD peaks is linked to exogenous, atmospheric factors, and we hypothesize the existence of two site characteristic periodicities, 18.16 d (a1) and for PIS and 88.71 d (b6) for SF1.
The link among frame temperatures and environmental observables is not trivial. TIR cameras point towards the major thermal anomaly areas of Solfatara and Pisciarelli, that are characterized by intense fumarolic activity, with soil gas emissions, mainly CO2. Granieri et al. (2010) observed that in the studied areas the relationship between CO2 flux fluctuations and the environmental parameter variations is not univocal but depends on the physical properties of the measuring site, due, i.e., to differences in soil porosity, hydraulic conductivity and/or topographic effects. This is likely reflected in the different thermal site response to environmental inputs, and could explain why the TIR temperatures of the three daily IR frames show some different periodicities linked to meteoric factors. The local rheology plays an important role in modulating the geophysical signals at CFc: as example thermoelastic site effects have been recognized in ground deformation (De Lauro et al., 2018; Ricco et al., 2019; Petrosino et al., 2020). However, although the recurrent recrudescence of geochemical, geophysical and geodynamic anomalies in the hydrothermal system of CFc are the result of the combined action between endogenous and exogenous processes, constituting a contributing cause of changes in the magmatic system (Petrosino et al., 2018), they are far from following a simple, deterministic pathway. In any case, the identification of that link is fundamental to correctly recognize the phenomena generated by the volcanic/hydrothermal system. We will take a step in that direction, providing possible insights in the interpretation of the retrieved periodicities, leaving a conclusive rigorous modelling to future studies.
Many retrieved periodicities are common to the TIR PSDs and the environmental ones. The peaks common to all are ascribable to large scale phenomena, and could be linked to the dynamics of the whole Solfatara-Pisciarelli hydrothermal/volcanic system. The periodicities at 25.50–25.98 d appear at PIS, SF1, and Tatm, but not at SF2. It could be interesting to investigate if this band is characteristic for the south-eastern sector of Solfatara-Pisciarelli. The 35.15 d period shows a sort of local amplification at PIS. The 19.61 d peak has about the same absolute (not normalized) amplitude at all the temperature PSDs and, hence, it could simply due to the measurement of the atmospheric temperature at that period. An intriguing observation is that the maximum of the atmospheric temperature, in correspondence of about 49 d, is well visible only at SF2 site, sharing a comparable absolute spectral amplitude. Nicholson et al. (2013), evaluated the periodicities in SO2 flux time-series at Soufrière Hills (Montserrat, United Kingdom) trough PSD estimation, retrieving a main periodicity at about 50 d. They performed a cross-correlation with other geophysical/volcanological parameters (seismicity, ground tilt and lava efflux) meeting the same periodicities. This coincidence could be the signature of a common driving mechanism, and the authors invoked the necessity of further investigations to better define the underlying processes. Except for 88.71 d at SF1, periods >49 d of the TIR time-series show a pattern similitude with the environmental parameters, although the absolute amplitude at PIS site are very high, with values close to the absolute maximum. Above 93 d, the pattern of the TIR temperatures and Tatm is practically the same. Viveiros et al. (2014) applied a spectral analysis to CO2 efflux time-series recorded at Furnas Volcano (Azores archipelago-Spain) between 2002 and 2009. They recognized efflux variations dependent on the meteorological (air temperature, barometric pressure, air humidity, and wind speed) periodicities and identified the higher-energy spectral peaks at ∼340, 98, 60, and 20 d. The authors correlated them to lunar cycles, attributing the discrepancies in the day's periodicity to the spectral resolution and/or by a leakage effect. They hypothesized that the 60 d cycle may also result from a multiple of the solar rotation, but without proving. Takahashi et al. (2010) invocated solar rotation effects to explain some of these periodicities. Also Christopher et al. (2010) found periodicities on the order of 6–8 weeks (50 d) in SO2 degassing time-series at Soufriere Hills volcano (Montserrat) in the years 1995–2009, retrieving those variations also in lava extrusion and seismicity.
Much could arise from the comparison (i.e. cross-correlation) of the TIR time-series with atmospheric variables and other volcanological/geophysical observables (Nicholson et al., 2013; Christopher et al., 2010; Pering et al., 2019 and references therein), as well as with the other TIR stations of OV TIRNet network. For example, the match of the recordings of SOB and OBN TIR cameras (Fig. 1a) and the OV TIR station installed on Mt. Vesuvius (about 25 km far from Solfatara) could help to distinguish among large spatial, local and very local effects.
In our analysis two characteristic periodicities have emerged, 18.16 d (a1) for PIS and 88.71 d (b6) for SF1. Some authors have attributed the periods close to 20 d to lunar cycles (Viveiros et al., 2014). But we are confident that this not the case for Pisciarelli site since we have removed such effects. A period on the order of a1 appears has secondary peak in the CO2 flux PSD estimated by Granieri et al. (2010) inside the Solfatara crater. A periodicity of the same order of b6 (about 94 d) was found in SO2 flux at Masaya volcano, Nicaragua, that was hypothesized to reflect the volcanic influence, involving replenishment of magma into storage zones (Pering et al., 2019, and references therein).
Recently Pering et al. (2019) made a review of the periodicities retrieved in scientific literature from the spectra of soil gas emissions in volcanic/hydrothermal areas. They divided the periodicities associated to efflux in four categories according to the nature of the generating process, and associated periodicity timescales: (C1) Non-volcanic, atmospheric- or tidal- generated – variable periodicity time scale; (C2) Gas-driven, shallow process – seconds to hours; (C3) Shallow magma movement, in-conduit or shallow storage – from minutes to days; (C4) deep magmatic processes – from days to months. According to this schema, the periodicities generated within a shallow plumbing system fall inside C2 and C3, and both a1 and b6 could belong to these categories. b6 could also reflect a process contemplated in C4. In conclusion, the characteristic periods (a1 and b6) could be the footprint of local endogenous source mechanisms, but further analyses are necessary to establish which mechanism could produce such periodicities.
The present study is far from being definitive. All the presented observations need further investigations also adopting innovative spectral and imaging techniques (Barnie and Oppenheimer, 2015; Capuano et al., 2017), that could lead to interesting and relevant outcomes, important for volcanic hazard. In addition, among the possible analyses that can be performed over the TIR data, the cross-correlation with other geophysical time-series is determinant to have a correct insight in the mechanisms that control the dynamics of the hydrothermal/volcanic system. Finally, the comparison of volcanological/geophysical and atmospheric and tidal observables results fundamental and decrees the necessity of the inclusion of environmental conditions in any volcanic monitoring program.
Data are available on request from the authors.
GV, TC and FS conceived the original idea of the present research. TC, PC and SP, analysed and validated the data. FS and GV managed raw data acquisition by surveillance network. All the authors elaborated the interpretations of the results. All the authors contributed in writing and reviewing the manuscript.
The authors declare that they have no conflict of interest.
This article is part of the special issue “Understanding volcanic processes through geophysical and volcanological data investigations: some case studies from Italian sites (EGU2019 GMPV5.11 session, COV10 S01.11session)”. It is not associated with a conference.
We wish to thanks two anonymous referees for their useful comments that contributed to improve the paper. The analyses performed in this paper have been carried out with the INGV-OV monitoring data, in the framework of the Agreement (Annex A) between the Italian Civil Protection Department (DPC) and INGV. We wish to thank Adriano La Rocca (INGV-OV) for giving the meteorological data, and Eliana Bellucci Sessa (INGV-OV) for thematic map.
This paper was edited by Enza De Lauro and reviewed by Sonia Calvari and Paolo Capuano.
Barnie, T. and Oppenheimer, C.: Extracting high temperature event radiance from satellite images and correcting for saturation using independent component analysis, Remote Sens. Environ., 158, 56–68, https://doi.org/10.1016/j.rse.2014.10.023, 2015.
Bevilacqua, A., Neri, A., De Martino, P., Isaia, R., Novellino, A., D'Assisi Tramparulo, F., and Vitale, S.: Radial interpolation of GPS and leveling data of ground deformation in a resurgent caldera: application to Campi Flegrei (Italy), J. Geod., 94, 1–27, https://doi.org/10.1007/s00190-020-01355-x, 2020.
Bianco, F., Castellano, M., Cogliano, R., Cusano, P., Del Pezzo, E., Di Vito, M. A., Fodarella, A., Galluzzo, D., La Rocca, M., Milana, M., Petrosino, S., Pucillo, S., Riccio, G., and Rovelli, A.: Caratterizzazione del noise sismico nell'area vulcanica dei Campi Flegrei (Napoli): l'esperimento “UNREST”, Quaderni di Geofisica, 2010, 86, 1–21, ISSN 1590-2595, 2010.
Blackett, M.: An overview of infrared remote sensing of volcanic activity, J. Imaging, 3, 13, 2017.
Calvari, S., Lodato, L., and Spampinato, L.: Monitoring active volcanoes using a handheld thermal camera, in: Thermosense XXVI, Vol. 5405, pp. 199–209, International Society for Optics and Photonics, https://doi.org/10.1117/12.547497, 2004.
Capuano, P., De Lauro, E., De Martino, S., Falanga, M., and Petrosino, S.: Convolutive independent component analysis for processing massive datasets: a case study at Campi Flegrei (Italy), Nat. Hazards, 86, 417–429, https://doi.org/10.1007/s11069-016-2545-0, 2017.
Caputo, T., Bellucci Sessa, E., Silvestri, M., Buongiorno, M. F., Musacchio, M., Sansivero, F., and Vilardo, G.: Surface temperature multiscale monitoring by thermal infrared satellite and ground images at Campi Flegrei volcanic area (Italy), Remote Sens., 11, 1007, https://doi.org/10.3390/rs11091007, 2019.
Chiodini, G., Frondini, F., Cardellini, C., Granieri, D., Marini, L., and Ventura, G.: CO2 degassing and energy release at Solfatara Volcano, Campi Flegrei, Italy, J. Geophys. Res., 106, 16213–16221, 2001.
Chiodini, G., Granieri, D., Avino, R., Caliro, S., and Costa, A.: Carbon dioxide diffuse degassing and estimation of heat release from volcanic and hydrothermal systems, J. Geophys. Res., 110, B08204, https://doi.org/10.1029/2004JB003542, 2005.
Chiodini, G., Paonita, A., Aiuppa, A., Costa, A., Caliro, S., De Martino, P., Acocella V., and Vandemeulebrouck, J.: Magmas near the critical degassing pressure drive volcanic unrest towards a critical state, Nat. Comm., 7, 13712, https://doi.org/10.1038/ncomms13712, 2016.
Christopher, T., Edmonds, M., Humphreys, M. C. S., and Herd, R. A.: Volcanic gas emissions from Soufrie`re Hills Volcano, Montserrat 1995–2009, with implications for mafic magma supply and degassing, Geophys. Res. Lett., 37, L00E04, https://doi.org/10.1029/2009GL041325, 2010.
Cleveland, R. B., Cleveland, W. S., McRae, J. E., and Terpenning, I.: STL: A Seasonal-Trend Decomposition Procedure Based on Loess, J. Off. Stat., 6, 3–73, 1990.
Costa, A., Folch, A., Macedonio, G., Giaccio, B., Isaia, R., and Smith, V. C.: Quantifying volcanic ash dispersal and impact of the Campanian Ignimbrite super-eruption, Geophys. Res. Lett., 39, L10310, https://doi.org/10.1029/2012GL051605, 2012.
Deino, A. L., Orsi, G., De Vita, S., and Piochi, M.: The age of the Neapolitan Yellow Tuff caldera-forming eruption (Campi Flegrei caldera, Italy) assessed by 40Ar/39Ar dating method, J. Volcanol. Geotherm. Res., 133, 157–170, 2004.
De Lauro, E., Falanga, M., and Petrosino, S.: Study on the long period source mechanism at Campi Flegrei (Italy) by a multiparametric analysis, Phys. Earth Planet. In., 206–207, 16–30, https://doi.org/10.1016/j.pepi.2012.06.006, 2012.
De Lauro, E., De Martino, S., Falanga, M., and Petrosino, S.: Synchronization between tides and sustained oscillations of the hydrothermal system of Campi Flegrei (Italy), Geochem. Geophy. Geosy., 14, 2628–2637, https://doi.org/10.1002/ggge.20149, 2013.
De Lauro, E., Petrosino, S., Ricco, C., Aquino, I., and Falanga, M.: Medium and long period ground oscillatory pattern inferred by borehole tiltmetric data: New perspectives for the Campi Flegrei caldera crustal dynamics, Earth Planet Sc. Lett., 504, 21–29, https://doi.org/10.1016/j.epsl.2018.09.039, 2018.
Del Gaudio, C., Aquino, I., Ricciardi, G. P., Ricco, C., and Scandone, R.: Unrest episodes at Campi Flegrei: A reconstruction of vertical ground movements during 1905–2009, J. Volcanol. Geotherm. Res., 195, 48–56, https://doi.org/10.1016/j.jvolgeores.2010.05.014, 2010.
Di Vito, M. A., Isaia, R., Orsi, G., Southon, J., de Vita, S., D'Antonio, M., Pappalardo, L., and Piochi, M.: Volcanism and deformation since 12,000 years at the Campi Flegrei caldera (Italy), J. Volcanol. Geotherm. Res., 91, 221–246, 1999.
Di Vito, M. A., Acocella, V., Aiello, G., Barra, D., Battaglia, M., Carandente, A., Del Gaudio, C., de Vita, S., Ricciardi, G. P., Ricco, C., Scandone, R., and Terrasi, F.: Magma transfer at Campi Flegrei caldera (Italy) before the 1538 AD eruption, Sci. Rep., 6, 1–9, https://doi.org/10.1038/srep32245, 2016.
Giaccio, B., Hajdas, I., Isaia, R., Deino, A., and Nomade, S.: High-precision 14C and 40Ar/39Ar dating of the Campanian ignimbrite (Y-5) reconciles the time-scales of climatic-cultural processes at 40 Ka, Sci. Rep., 7, 45940, https://doi.org/10.1038/srep45940, 2017.
Granieri, D., Avino, R., and Chiodini, G.: Carbon dioxide diffuse emission from the soil: ten years of observations at Vesuvio and Campi Flegrei (Pozzuoli), and linkages with volcanic activity, Bull. Volcanol., 72, 103–118, https://doi.org/10.1007/s00445-009-0304-8, 2010.
Godin, G.: The Analysis of Tides, University of Toronto Press, 264 pp., ISBN 0802017479 978-0-8020-1747-5, 1972.
Harris, A.: Thermal remote sensing of active volcanoes: a user's manual, Cambridge University Press, ISBN 978-0-5218-5945-5, 2013.
Hernández, P. A., Pérez, N. M., Varekamp, J. C., Henriquez, B., Hernández, A., Barrancos, J., and Melián, G.: Crater lake temperature changes of the 2005 eruption of Santa Ana volcano, El Salvador, Central America, Pure Appl. Geophys., 164, 2507–2522, https://doi.org/10.1007/s00024-007-0275-7, 2007.
Kervyn, M., Kervyn, F., Goossens, R., Rowland, S. K., and Ernst, G. G. J.: Mapping volcanic terrain using high-resolution and 3D satellite remote sensing, Geol. Soc. Lond. Special Publications, 283, 5–30, https://doi.org/10.1144/SP283.2, 2007.
Kieffer, H. H., Frank, D., and Friedman, J. D.: Thermal infrared surveys at Mount St. Helens – observations prior to the eruption of May 18, in: The 1980 eruptions of Mount St. Helens, Washington, edited by: Lipman, P. W. and Mullineaux, D. R., USGS Prof. Pap. 1981, 1250, 257–278, ISSN 10449612, 1981.
Marotta, E., Peluso, R., Avino, R., Belviso, P., Caliro, S., Carandente, A., and Marfè, B.: Thermal Energy Release Measurement with Thermal Camera: The Case of La Solfatara Volcano (Italy), Remote Sensing, 11, 167, https://doi.org/10.3390/rs11020167, 2019.
Nicholson, E. J., Mather, T. A., Pyle, D. M., Odbert, H. M., and Christopher, T.: Cyclical patterns in volcanic degassing revealed by SO2 flux timeseries analysis: Anapplication to Soufrière Hills Volcano, Montserrat, Earth Planet Sc. Lett., 375, 209–221, https://doi.org/10.1016/j.epsl.2013.05.032, 2013.
Orsi, G., D'Antonio, M., de Vita, S., and Gallo, G.: The Neapolitan Yellow Tuff, a large-magnitude trachytic phreatoplinian eruption: eruptive dynamics, magma withdrawal and caldera collapse, J. Volcanol. Geoth. Res., 53, 275–287, https://doi.org/10.1016/0377-0273(92)90086-S, 1992.
Pawlowicz, R., Beardsley, B., and Lentz, S.: Classical tidal harmonic analysis with error analysis in MATLAB using T_TIDE, Comput. Geosci., 28, 929–937, 2002.
Pering, T. D., Ilanko, T., and Liu, E. J.: Periodicity in Volcanic Gas Plumes: A Review and Analysis, Geosciences, 9, 394, https://doi.org/10.3390/geosciences9090394, 2019.
Petrosino, S., Damiano, N., Cusano, P., Di Vito, M. A., de Vita, S., and Del Pezzo, E.: Subsurface structure of the Solfatara volcano (Campi Flegrei caldera, Italy) as deduced from joint seismic-noise array, volcanological and morphostructural analysis, Geochem. Geophy. Geosy., 13, Q07006, https://doi.org/10.1029/2011GC004030, 2012.
Petrosino, S., Cusano, P., and Madonia, P.: Tidal and hydrological periodicities of seismicity reveal new risk scenarios at Campi Flegrei caldera, Sci. Rep., 8, 13808, https://doi.org/10.1038/s41598-018-31760-4, 2018.
Petrosino, S., Ricco, C., De Lauro, E., Aquino, I., and Falanga, M.: Time evolution of medium and long-period ground tilting at Campi Flegrei caldera, Adv. Geosci., 52, 9–17, https://doi.org/10.5194/adgeo-52-9-2020, 2020.
R Core Team: R: A language and environment for statistical computing, R Foundation for Statistical Computing, Vienna, Austria, available at: https://www.R-project.org/ (last access: 2 September 2020), 2018.
Ricco, C., Petrosino, S., Aquino, I., Del Gaudio, C., and Falanga, M.: Some Investigations on a Possible Relationship between Ground Deformation and Seismic Activity at Campi Flegrei and Ischia Volcanic Areas (Southern Italy), Geosciences, 9, 222, https://doi.org/10.3390/geosciences9050222, 2019.
Sansivero, F. and Vilardo, G.: Processing Thermal Infrared Imagery Time-Series from Volcano Permanent Ground-Based Monitoring Network, Latest Methodological Improvements to Characterize Surface Temperatures Behavior of Thermal Anomaly Areas, Remote Sens., 11, 553, https://doi.org/10.3390/rs11050553, 2019.
Sansivero, F., Scarpato, G., and Vilardo, G.: The automated infrared thermal imaging system for the continuous long-term monitoring of the surface temperature of the Vesuvius crater, Ann. Geophys., 56, S0454, https://doi.org/10.4401/ag-6460, 2013.
Scarpati, C., Cole, P., and Perrotta, A.: The Neapolitan Yellow Tuffa large volume multiphase eruption from Campi Flegrei, Southern Italy, Bull. Volcanol., 55, 343–356, 1993.
Silvestri, M., Cardellini, C., Chiodini, G., and Buongiorno, M. F.: Satellite derived surface temperature and in situ measurement at Solfatara of Pozzuoli (Naples, Italy), Geochem. Geophy. Geosy., 17, 2095–2109, https://doi.org/10.1002/2015GC006195, 2016.
Spampinato, L., Calvari, S., Oppenheimer, C., and Boschi, E.: Volcano surveillance using infrared cameras, Earth Sci. Rev., 106, 63–91, https://doi.org/10.1016/j.earscirev.2011.01.003, 2011.
Takahashi, Y., Okazaki, Y., Sato, M., Miyahara, H., Sakanoi, K., Hong, P. K., and Hoshino, N.: 27-day variation in cloud amount in the Western Pacific warm pool region and relationship to the solar cycle, Atmos. Chem. Phys., 10, 1577–1584, https://doi.org/10.5194/acp-10-1577-2010, 2010.
Vilardo, G., Chiodini, G., Augusti, V., Granieri, D., Caliro, S., Minopoli, C., and Terranova, C.: The permanent thermal infrared network for the monitoring of hydrothermal activity at the Solfatara and Vesuvius volcanoes, in: Conception, verification and application of innovative techniques to study active volcanoes, Istituto Nazionale di Geofisica e Vulcanologia, 481–495, ISBN 978-8-8899-7209-0, 2008.
Vilardo, G., Ventura, G., Bellucci Sessa, E., and Terranova, C.: Morphometry of the Campi Flegrei caldera (Southern Italy), J. Maps, 4, 635–640, https://doi.org/10.1080/17445647.2013.842508, 2013.
Vilardo, G., Sansivero, F., and Chiodini, G.: Long-term TIR imagery processing for spatiotemporal monitoring of surface thermal features in volcanic environment: A case study in the Campi Flegrei (Southern Italy), J. Geophys. Res.-Solid Earth, 120, 812–826, https://doi.org/10.1002/2014JB011497, 2015.
Viveiros, F., Vandemeulebrouck, J., Rinaldi, A. P., Ferreira, T., Silva, C., and Cruz, J. V.: Periodic behavior of soil CO2 emissions in diffuse degassing areas of the Azores archipelago: Application to seismovolcanic monitoring, J. Geophys. Res.-Solid Earth, 119, 7578–7597, https://doi.org/10.1002/2014JB011118, 2014.