 | 18 Feb 2021
Aseismic strain episodes at Campi Flegrei Caldera, Italy
Bellina Di Lieto
Pierdomenico Romano
Roger Bilham
Roberto Scarpa
Since 2004 a research project has been developed to monitor subsurface deformation of Italian volcanoes using borehole strainmeters and long-baseline tiltmeters. Six Sacks-Evertson dilatometers were installed around Campi Flegrei caldera and Vesuvius during 2004–2005 (Scarpa et al., 2007), and in 2008 these instruments were supplemented by two arrays of 28–280 m long water-tube tiltmeters in underground tunnels.
Relevant strainmeter and tiltmeter data have been collected and analysed from the instruments installed near Campi Flegrei caldera during the recent unrest episodes. In the period 2004–2005 strain, tilt and GPS data from Campi Flegrei indicate the onset of surface deformation that accompanied a low rate of vertical displacement that continued to 2006, corresponding to an increase of CO2 emission. This strain episode preceded caldera microseismic activity by a few months, as was observed also during a significant inflation episode in 1982. Other transient strain episodes occurred in October 2006, which were accompanied by a swarm of VT (Volcano-Tectonic) and LP (Long Period) events, in 2009, at the time of renewed gas emission activity at Solfatara, and again in March 2010, several minutes before a seismic swarm. The time scale of these transient strain events ranges from some hours to several days, putting tight constraints on the origin of ground uplifts at Campi Flegrei. Their location is compatible with a source inferred from long term deformation signals, located about 4 km beneath Pozzuoli. A proposed mechanism for these aseismic strain episodes is that they are associated with magma growth in reservoirs with occasional pressure relief associated with the leakage of gas.
- Article
(2202 KB) - Full-text XML
- BibTeX
- EndNote


Campi Flegrei is an active caldera, with a diameter exceeding 10 km, located close to the city of Naples in southern Italy. The northern and western parts of the caldera are located inland and are characterized by the presence of numerous volcanic cones and craters, whereas its southern part is submarine and lies beneath the Gulf of Pozzuoli. The region is famous for the slow subsidence of Roman columns of the Serapeo market in Pozzuoli until their emergence prior to the volcanic eruption in 1538 that formed Monte Nuovo, a small cinder cone, characterized by a volcanic explosivity index VEI = 3. The 1538 eruption was preceded several decades before its occurrence by ground uplift and seismicity that peaked a few days before the eruptive event. After this eruption, the Pozzuoli region continued to subside at a rate of 14–15 mm yr−1 until 1950. Approximately 74 cm of uplift occurred between 1950 and 1952 (Del Gaudio et al., 2010), but without any report or record of associated seismic activity. Slow subsidence followed this period of uplift interrupted in 1970–1972 and in 1982–1984 by rapid (≈1.5 m) inflation episodes, the first accompanied by moderate low seismicity (Corrado et al., 1977) with only few events felt by residents, whereas the second was accompanied by relatively intense swarms of volcano tectonic (VT) earthquakes (Barberi et al., 1986). This seismic activity caused alarm in the population and a spontaneous partial evacuation of the city of Pozzuoli (44 000 residents). Since this last episode, subsidence has been recorded for several years, interrupted by some small mini-uplift episodes, each with a duration of several weeks, all accompanied by seismic swarms of low magnitude VT events. The last mini-uplift episode had an unusual duration, starting from 2004 and continuing until 2013, with a total uplift amounting to about 25 cm, accompanied by swarms of low magnitude VT and LP (long period) earthquakes (M<2), most noticeably in October 2006. Cumulative uplift since 1950 amounts to ≈2.5 m, similar to pre-eruptive uplift before 1538: both episodes are characterized by an average rate of uplift of the order of 4–5 cm yr−1. It is noteworthy that the strain linked to the recent uplift episodes has accumulated almost aseismically, as firstly evidenced by Yokoyama (1971), which makes this caldera quite different from many other volcanic areas or calderas in the world experiencing unrest episodes.
Borehole strainmeters permit subsurface deformation processes associated with aseismic events to be quantified. Several processes can be identified, some of which precede seismic activity: slow earthquakes, episodic tremors and slip (ETS) and aseismic creep. Strainmeters, like the Sacks-Evertson dilatometers treated in the current paper, are installed in boreholes at depth of hundreds of meters below the surface thereby obtaining high signal to noise ratio and useful measurement sensitivities of 10−10 strain (Agnew, 1986). Long baseline tiltmeters achieve similar (10−10 radian) measurement accuracy at long periods when installed in the subsurface and when their lengths exceed tens of meters.
One objective of the strain and tilt monitoring program is devoted to isolating and identifying the response to subsurface mass movement. The main aims of these experiments are to discriminate between magma inflow and other mass transport processes (e.g. hydrothermal activity). In contrast to seismic records of volcanic tremor, borehole strainmeter data are less sensitive to propagating waves associated with nucleation and impulsive fluid mobility, thus providing more direct information on the structure of the conduit, the physical properties of magma and the dynamics of magma transport (Scarpa et al., 2000; Scarpa, 2001). The observations performed by using the few borehole strainmeters and long-baseline tiltmeters operating near volcanic systems elsewhere in the world (see e.g. Ishihara, 1988; Linde and Sacks, 1995; Fukao et al., 1998; Mattioli et al., 2004; Voight et al., 2006; Bilham et al., 1982) have shown clear signals related to eruptions with significantly higher sensitivity than GPS, and permit the details of the gas-magma transport mechanisms linked to strain transients with durations from minutes to weeks to be quantified. Moreover, the subsurface installation of strainmeters and tiltmeters reduces high frequency seismic surface noise, mostly due to anthropogenic activities or weather conditions, which further enhances the signal-to-noise ratio, helping in the detection of LP, VLP (very-long period) or ULP (ultra-long period) events, which are currently considered among the most reliable precursors of volcanic activity (Chouet, 1996).
Following the deflation after the 1538 Monte Nuovo eruption, the uplift started in 1950 and reached a maximum of ≈4 m in 1985 near the town of Pozzuoli (Del Gaudio et al., 2010). Subsequent to this episode, slow subsidence of the area started, with mini-uplifts, superimposed on the general trend, occurring in 1989, 1994, 2000 and 2006 (Amoruso et al., 2007). Since 2005 this subsidence ceased and the region is now uplifting erratically at an accelerating rate (http://www.ov.ingv.it/ov/campi-flegrei.html, last access: 14 May 2020).
The Solfatara crater shows many active fumaroles and the presence of a significant geothermal field. Its three main fumaroles (Bocca Grande, Bocca Nova and Pisciarelli) are subject to diffuse emissions of volcanic-hydrothermal gases (mainly H and CO2) (Chiodini et al., 2012), which are routinely analysed for their chemical composition. Increased gas emission is attributed to the injection of magmatic fluids into the surface hydrothermal system. Analysis of SBAS-DInSAR data (Manconi et al., 2010) during the period 1992–2008 showed that the deformation can be related to the activity in a small, shallow (<3 km) source located beneath the centre of the caldera. The ground uplift and seismicity episodes occurred during the 1989–2010 period were correlated (D'Auria et al., 2011) to hot fluids injections, with a significant magmatic component, in the geothermal reservoir.
The inflation episodes of 2000 and 2006 have been interpreted as caused by the volumetric expansion of strain sources at about 5 km below Campi Flegrei, migrating upward, giving rise to complex spatial and temporal patterns (D'Auria et al., 2012). Both events have been interpreted as hot fluid batches injected at the bottom of the geothermal reservoir, which reached the surface. These injections were found to occur at different points along the margins of the caldera, in different points, before migrating to its centre.
Specifically, the 2004–2006 uplift (about 4 cm of total displacement) has been studied with episodic vertical levelling data and continuous horizontal GPS data (Troise et al., 2007), with the ratio between maximum horizontal and maximum vertical displacement equalling that observed during the 2000 uplift, and with spatial similarities to significant vertical deformation that accompanied the 1982–1984 uplift episode. The use of a layered medium (Amoruso et al., 2007) permits all the surface deformation data to be emulated theoretically as inflation of a circular horizontal crack source.
The Campi Flegrei area and Mt. Vesuvius are currently monitored by the Osservatorio Vesuviano – Istituto Nazionale di Geofisica e Vulcanologia (see web site http://www.ov.ingv.it/ov/, last access: 14 May 2020). Volcano monitoring has been improved in the last forty years by distance change measurements (originally EDM surveys and since 1995 GPS), levelling (referenced to a benchmark located in Naples), gravity and broad band seismic data acquisition.
In 2004, the DINEV project started in the Campi Flegrei – Vesuvius volcanic areas (Scarpa et al., 2007). This research program belongs to the Centro Regionale di Competenza AMRA, supported by PON funds, Regione Campania. The project was designed to complement the seismic and geodetic monitoring system of the Osservatorio Vesuviano through the installation of a small network of seven borehole stations, each installed at a depth up to 200 m and instrumented with a broad-band 3-component Teledyne Geotech KS2000BH borehole seismometer and a Sacks-Evertson volumetric strainmeter. At the time of writing, six borehole Sacks-Evertson strainmeters have been installed within the DINEV project (three near Mt. Vesuvius, along with the three dilatometers installed in the proximity of the Campi Flegrei caldera), and two sites (Quarto and Mt. S. Angelo, a few kilometres east of the caldera) were instrumented with borehole seismometers. In addition, two Guralp CMG 3-ESP broad band seismometers were installed at surface sites. Each borehole station is separated by several kilometres from other stations, and the network covers many strategic distances from Campi Flegrei and Vesuvius volcanoes.
Subsequently, starting in 2008, the UNREST project was developed, supported by a convention between INGV and DPC (Civil Protection Department). This project aimed to install in the same region two multiple-sensor, high-sensitivity long-baseline Michelson water pipe tiltmeters.
In the present work, data acquired by three Sacks-Evertson dilatometers and the two long-baseline tiltmeters installed near Campi Flegrei caldera (Fig. 1) have been used.
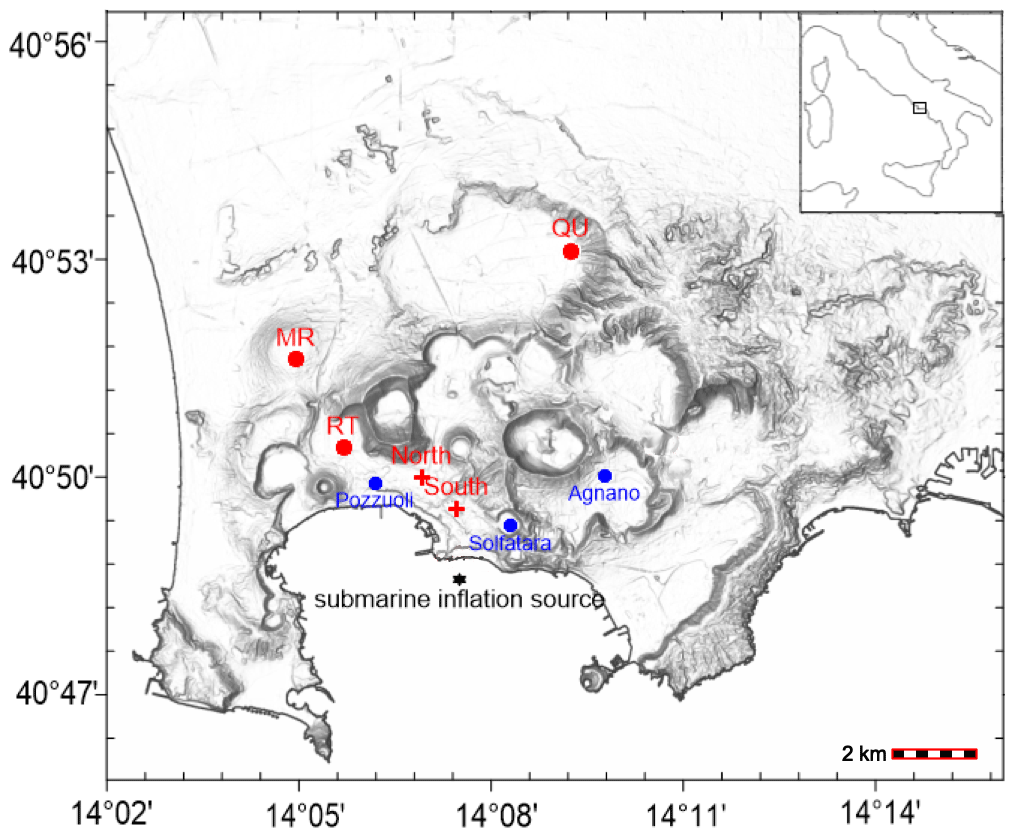
Figure 1Location of the borehole dilatometers (red dots) and long baseline tiltmeters (red crosses) in the Campi Flegrei region. RT = Rione Toiano, MR = Monteruscello, QU = Quarto. The submarine inflation source is indicated with a black star. Blue dots represent the location of Pozzuoli town, as well as the two interest areas of highest seismic and degassing activity: Solfatara and Agnano-Pisciarelli fumarole system.
3.1 Sacks-Evertson strainmeters
The installation of a borehole strainmeter involves it being lowered into a borehole that has been cored or rotary drilled slightly larger than the strainmeter diameter. The strainmeter is then coupled to the rock by injection of a special expansive grout between the instrument and borehole wall, used to couple it to the wellbore in slight compression. Installation sites can be equipped with multiple sensors, and, in this way, it is possible to monitor multiple parameters at the installation site, which allows the removal of any spurious, non-strain, signals that are recorded. In the current work, each installation site is equipped with a barometric pressure transducer, used in order to remove from the recorded data the dilatational strain signal arising from an atmospheric-pressure loading. Most sites are equipped with broadband seismometers (both surface accelerometers or borehole seismometers), in order to correctly calibrate the dilatometers to higher frequencies. Calibration in the lower frequency bands is carried out by using the theoretical tides calculated at the installation sites. Changes in the aquifer caused by surface rainfall also influence the contractional strain measured by the dilatometers, and it has been proved (Segall, 2003) that the contractional strain coincides with an increase in the fluid pressure. Monitoring the rainfall therefore allows the removal of a possible spurious signal overlapping the strain measured by the instruments.
The Sacks-Evertson strainmeters (7 cm diameter, 4 m long cylinders filled with degassed silicone oil) provide two signal outputs, obtained from two different hydro-mechanical amplification systems. The high-sensitivity output integrates the volumetric change in the strained reservoir. The low-sensitivity one is connected to the strained reservoir only when the instrument is sensing a rapid and strong strain change, and thus measuring strain. Usually the low-sensitivity channel measures the pressure in a closed cell, that is proportional to local temperature. The temperature resolution is a few microdegrees. Air pressure is also measured at the surface, in order to correct recorded data for dilatational strain resulting from atmospheric pressure loading. The nominal resolution of the Sacks-Evertson strainmeter is about 10−12 strain units, with a nominal dynamic range of 10−11–10−3. Low-frequency calibration of installed strainmeters is obtained by comparison with Earth tides (Hart et al., 1996; Amoruso et al., 2000), while surface waves caused by earthquakes can be used to calibrate the sensors in higher frequency bands (Currenti et al., 2017). High- and low-sensitivity strain signals are continuously recorded, and sampled at 50 Hz by a six channels, 24 bit Kinemetrics Quanterra Q330 digitiser.
3.2 Long-baseline tiltmeters
Tiltmeters monitor ground deformation relative to a gravitational equipotential surface. The lower half of the 12 cm diameter horizontal pipes of the Michelson tiltmeters installed near Campi Flegrei caldera are filled with water and terminated by 20 cm diameter reservoirs, fastened to concrete floors by concrete-filled steel pillars (Fig. 2). Heated floating sensors support the core of a linear variable displacement transducer (LVDT) whose output is recorded to a 16 bit precision once per minute with a resolution of approximately 0.02 µm. The tilt is given by the ratio of the difference in height change divided by the total length of the pipes. The tilt resolution in the longest water-pipes attains 80 picoradians (0.08 nrad), approximately three orders of magnitude more sensitive than the electrolytic bubble sensors hitherto operating near Pozzuoli. Depending on the length of each pipe, the range obtainable without mechanical adjustment is ±9 to ±100 µrad, a range that can be extended by a factor of 7 by mechanical adjustment. Thermal noise in the tunnel environment increasingly dominates the signal at sensitivities of 1 nrad.
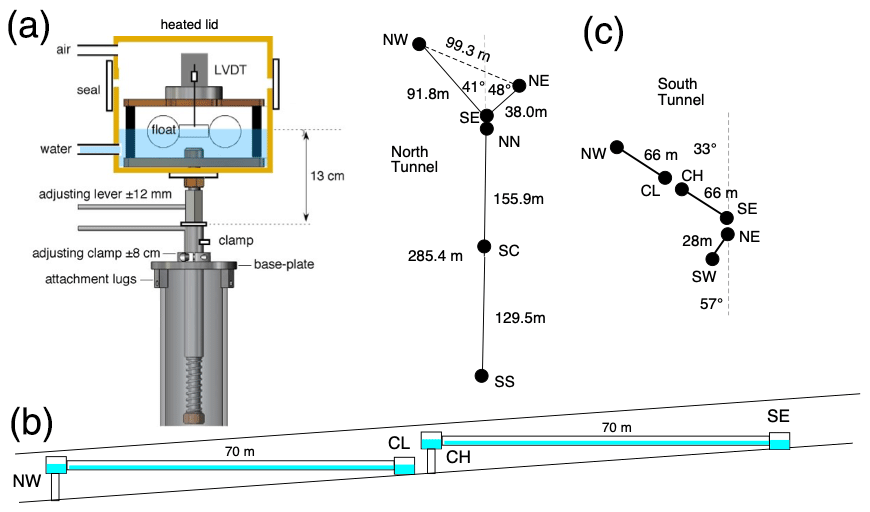
Figure 2(a) Schematic section through water level sensor. The float is heated to inhibit condensation. (b) Michelson tiltmeter pipe installation in sloping NW/SE tunnel. (c) Map view of pipe geometries in the North and South Pozzuoli tunnels. Filled circles indicate the location of water level sensors. In both tunnels co-linear tiltmeters were installed to enhance noise discrimination resulting from sub-micron thermal perturbations to water level and mounts. The calibration of each of the sensors is of the order of 1 %, and since the instruments are long compared to the width of the tunnels, strain-tilt coupling is negligible.
The tiltmeters were installed in early 20th century tunnels that were driven through a weak volcanic ash and lined with tephra blocks or concrete. The tunnels are inclined at low gradients to permit drainage, but because the half-filled water pipes must be installed to within a few mm of horizontal, the lengths of the tiltmeters in certain azimuths are restricted by these gradients and by the floor-to-ceiling height of the tunnels. Pipes with lengths of 28–285 m were installed at various azimuths in the two tunnel systems. The tunnels are ventilated to the atmosphere and, although they afford good stability and immunity from surface-induced thermoelastic noise and precipitation, they are environmentally less stable than a sealed tunnel. Air currents in the tunnels result in thermal fluctuations of up to 3 ∘C at periods of minutes, especially when atmospheric pressure fronts pass above the area. In the 285 m long water pipe the fundamental mode is approximately 8 min and we note that it is rarely stimulated, damping being close to critical.
The network of borehole strainmeters and long-baseline tiltmeters in the Pozzuoli region permits us to examine subsurface magma movements and pressures associated with magma ascent, storage, and the recharge of shallow magma reservoirs, and with the response of surface faults to these changes. Strainmeters and tiltmeters are both recognized as the potential best short- and middle-term instruments for eruption forecasting. They are optimally applied to the measurement of deformation signals with durations of hours to weeks, providing quantitative constraints on the depth of the pressure source in case of inflation or deflation, and the possible detection of ground deformation accompanying small pressure variations due to increased bubble formation, hydrothermal fluid motions, and/or magmatic ascent in prior to inflation episodes.
A recent uplift episode was initiated in Campi Flegrei in November 2004, shortly after the installation of the borehole strainmeters. The uplift begun relatively slowly, but after two well recognised transient accelerations (in October 2006 and March 2010, Fig. 3) was recorded by GPS data at an increasing rate after 2011 (Pingue et al., 2006; Troise et al., 2007).
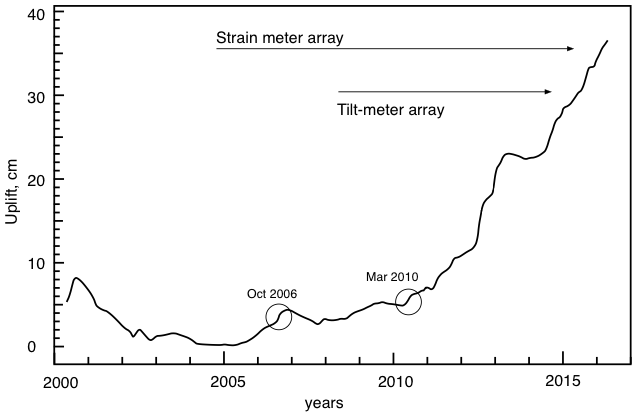
Figure 3Uplift of the vertical component of the GPS station RITE near Pozzuoli harbour (compiled from Vesuvius Observatory data) showing times of transient accelerations and reversals in inflation rate discussed in text. Time period covered by the datasets of the two arrays used in the present paper is shown in the figure.
The time series of the strainmeter signals, starting from the date of installation, are shown in Fig. 4: data, acquired at 50 samples s−1, have been downsampled at 60 s. They show overall stable trends, apart during the first few months, where they are heavily affected by cement-curing effects. Minor interruptions to the data occurred in the first months of operations due to problems in the electronics (battery charger, data logger, etc.), mainly at the Quarto and Monterusciello sites.
The tiltmeter data were interrupted several times by vandalism resulting in the loss of data loggers, electrical cables, and consequent loss of power. These interruptions have resulted in incomplete capture of some of the transient events by the entire array.
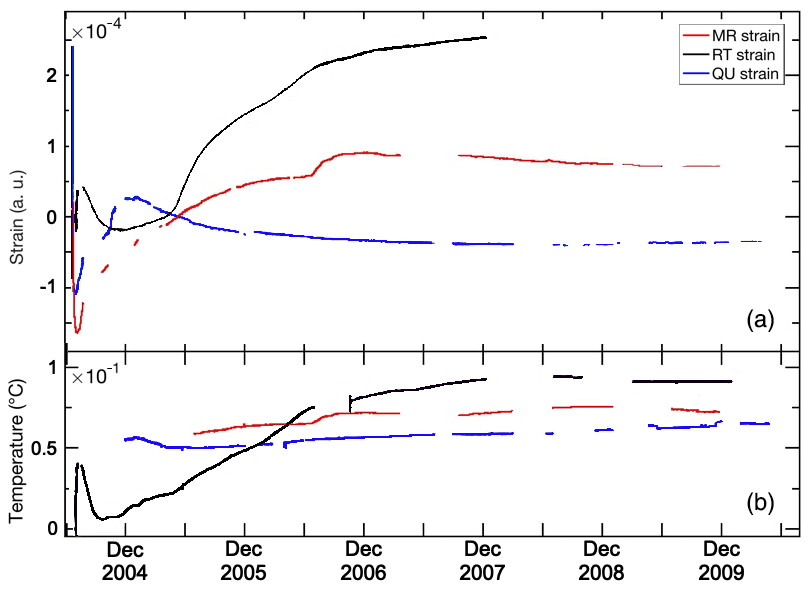
Figure 4Time series of the raw, unfiltered, 60 s downsampled strain and temperature signals. Data are represented from installation up to 30 June 2010. The upper panel shows the strain (dimensionless and plotted relative to an arbitrary datum) recorded by the three instruments, while the lower panel represents the change in temperature recorded by the low-sensitivity output, expressed in Celsius degrees.
Due to their intrinsic resolution and stability, both strainmeters and tiltmeters record Earth tides and ocean loading tides, which can largely be removed by predictive filtering prior deformation analysis. Moreover, other spurious signals overlap the trend sought, these can be related to the atmospheric pressure load on the area, local rainfall or earthquakes. While higher frequency spurious signals don't modify the overall strain trend, lower frequency signals (as is the case of the atmospheric pressure loading) can, so it is necessary to suppress their effects in order to observe the true strain or tilt deformation. To do so, a Bayesian approach (Hart et al., 1996; Tamura et al., 1991) has been used in the following of the current paper. Despite this processing technique, the Quarto strainmeter (QU) shows a residual pressure effect, possibly due to the non-linear dependence of strain on atmospheric pressure.
Many of the residual transients are correlated with imperfectly supressed atmospheric pressure variations. There are, however, some interesting transients observed occasionally related to other phenomena. Strain data show typical strain trends characterized by their duration and/or their occurrence, and noticeable correlate with different kind of events happening in the Campi Flegrei caldera. Specifically, from the observations of recorded strain data, we distinguish distinct deformational patterns related to exogenous or endogenous events in the region. Exogenous events are typically caused by rainfall episodes occurring in the area. Conversely, endogenous events originate within the caldera, and are due to genuine magmatic ascent, hot fluid injections in the geothermal reservoir and/or temperature variation in the hydrothermal system. As an example, Fig. 5 depicts the strain data from the QU strainmeter during the period 17 October–6 November 2006. Raw data have been cleaned by removing the tidal signal and atmospheric pressure loading, then filtered in the 0.0005–0.005 Hz frequency band: larger signals are due to rainfall episodes that occurred in the area, while pre-swarm strain changes can be distinctly discerned. Although background variations in filtered strain data remain, a pronounced strain-rate change occurs just before LP swarms are recorded by nearby seismic stations.
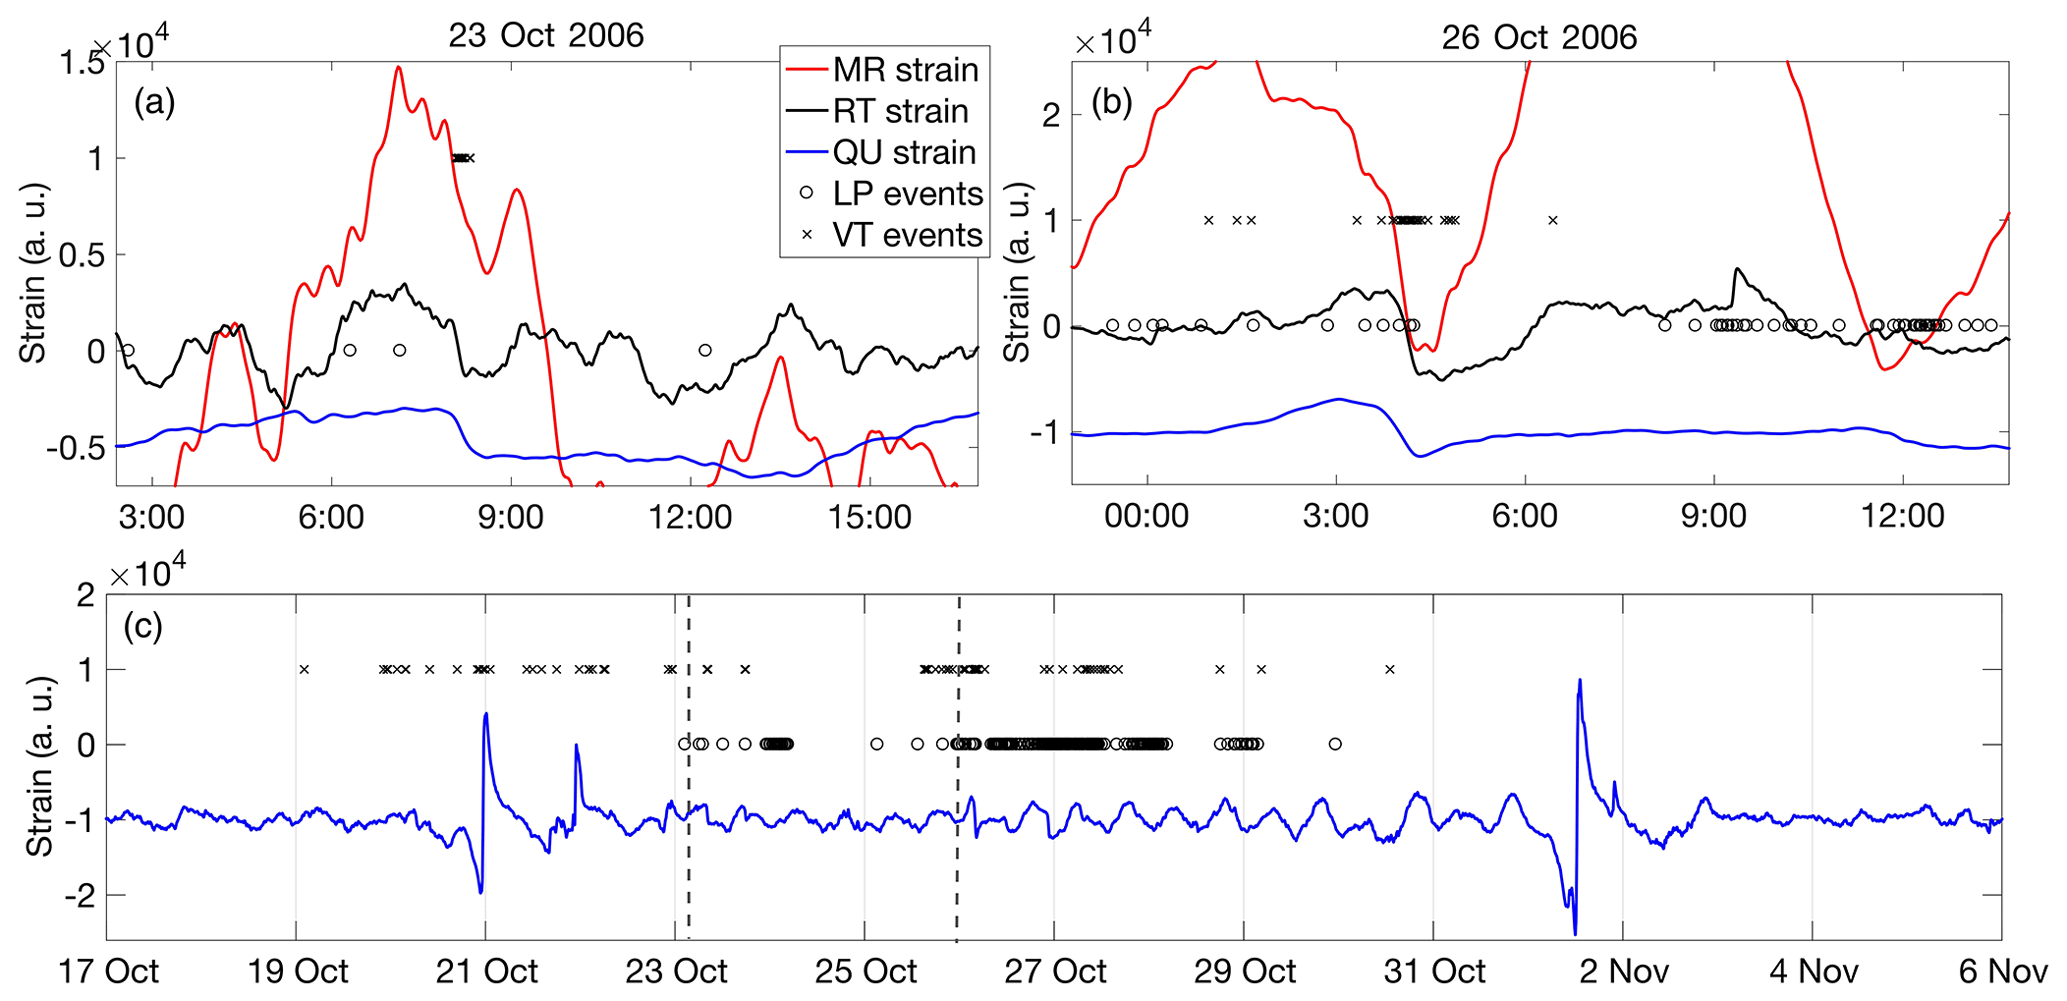
Figure 5QU strainmeter data recorded during the period 17 October–6 November 2006. Raw data have been corrected by removing earth tides and the effects of atmospheric pressure variations before applying a band-pass filter in the 0.0005–0.005 Hz frequency band. The units of strain are dimensionless, relative to an arbitrary datum. (c) shows the overall strain in the period: crosses and circles show VT and LP events, respectively. (a) and (b) show a magnified comparison of strain transient recorded at the three sites (RT, MR and QU sites depicted in black, red and blue, respectively), corresponding to the two dashed lines depicted in (c).
In the following, we show the characteristic signals for these different event types, recorded by the strainmeters and long-baseline tiltmeters network installed near Campi Flegrei caldera.
4.1 Rainfall and precipitation events
This class of events recorded by the sensors installed at various radial distances from the centre of the deformation area, is characterized by abrupt strain changes in the dataset, not correlated with changes in the atmospheric pressure ensuing at the time of recording, but occurring from several minutes up to a few hours after heavy rain in the caldera. In Fig. 6 we show typical 1–2 h duration strain signals caused by rainfall.

Figure 6Exogenous events, caused by three different rainfall episodes. In (a) it is depicted the rain in mm/day from 1 January 2006, up to 28 January 2008 recorded by the Agnano rain sensor (data from CAR – Regione Campania). (b), (c), and (d) represent RT, MR and QU strainmeters data for the three most significant rainfall events, the first of them is accompanied by the VT swarm. Strainmeter data for other intense rainfalls are missing. Strain data are plotted relative to an arbitrary datum, and in (b) and (c) QU data have been multiplied by a factor 2.
4.2 Strain transients caused by magma movements and subsurface thermoelastic expansion
Endogenous events are characteristic of Campi Flegrei caldera. As shown by D'Auria et al. (2011), although a quantitative relationship between ground uplift and seismicity is not easily found, deformation of the caldera is related to the injection of magmatic fluids in the geothermal reservoir beneath the Campi Flegrei area. Based on these findings, the LP swarm that occurred in October 2006, when more than 870 LP events were recorded within 7 d, has been interpreted (Saccorotti et al., 2007) as evidence of a transient upward migration of fluids, exciting the resonance of fluid-filled fractures, linked to the fluid transfer from a deeper to a shallower geothermal reservoir. Continuous GPS data at RITE and ACAE sites (De Martino et al., 2014), however, show how the deformation process starts several months before the time that the LP swarm initiates, as evidenced also by geochemical data (Chiodini et al., 2015).
In addition, the strain data appear to be sensitive to thermoelastic deformation that is caused by the intense heating processes that affect the deeper parts of the hydrothermal system, as well as the magmatic gas zone (Chiodini et al., 2015). The impulsive 10−7 strain changes with decaying time constants of the order of several weeks recorded during June 2008 by the MR strainmeter (Fig. 7) are attributed to this effect.
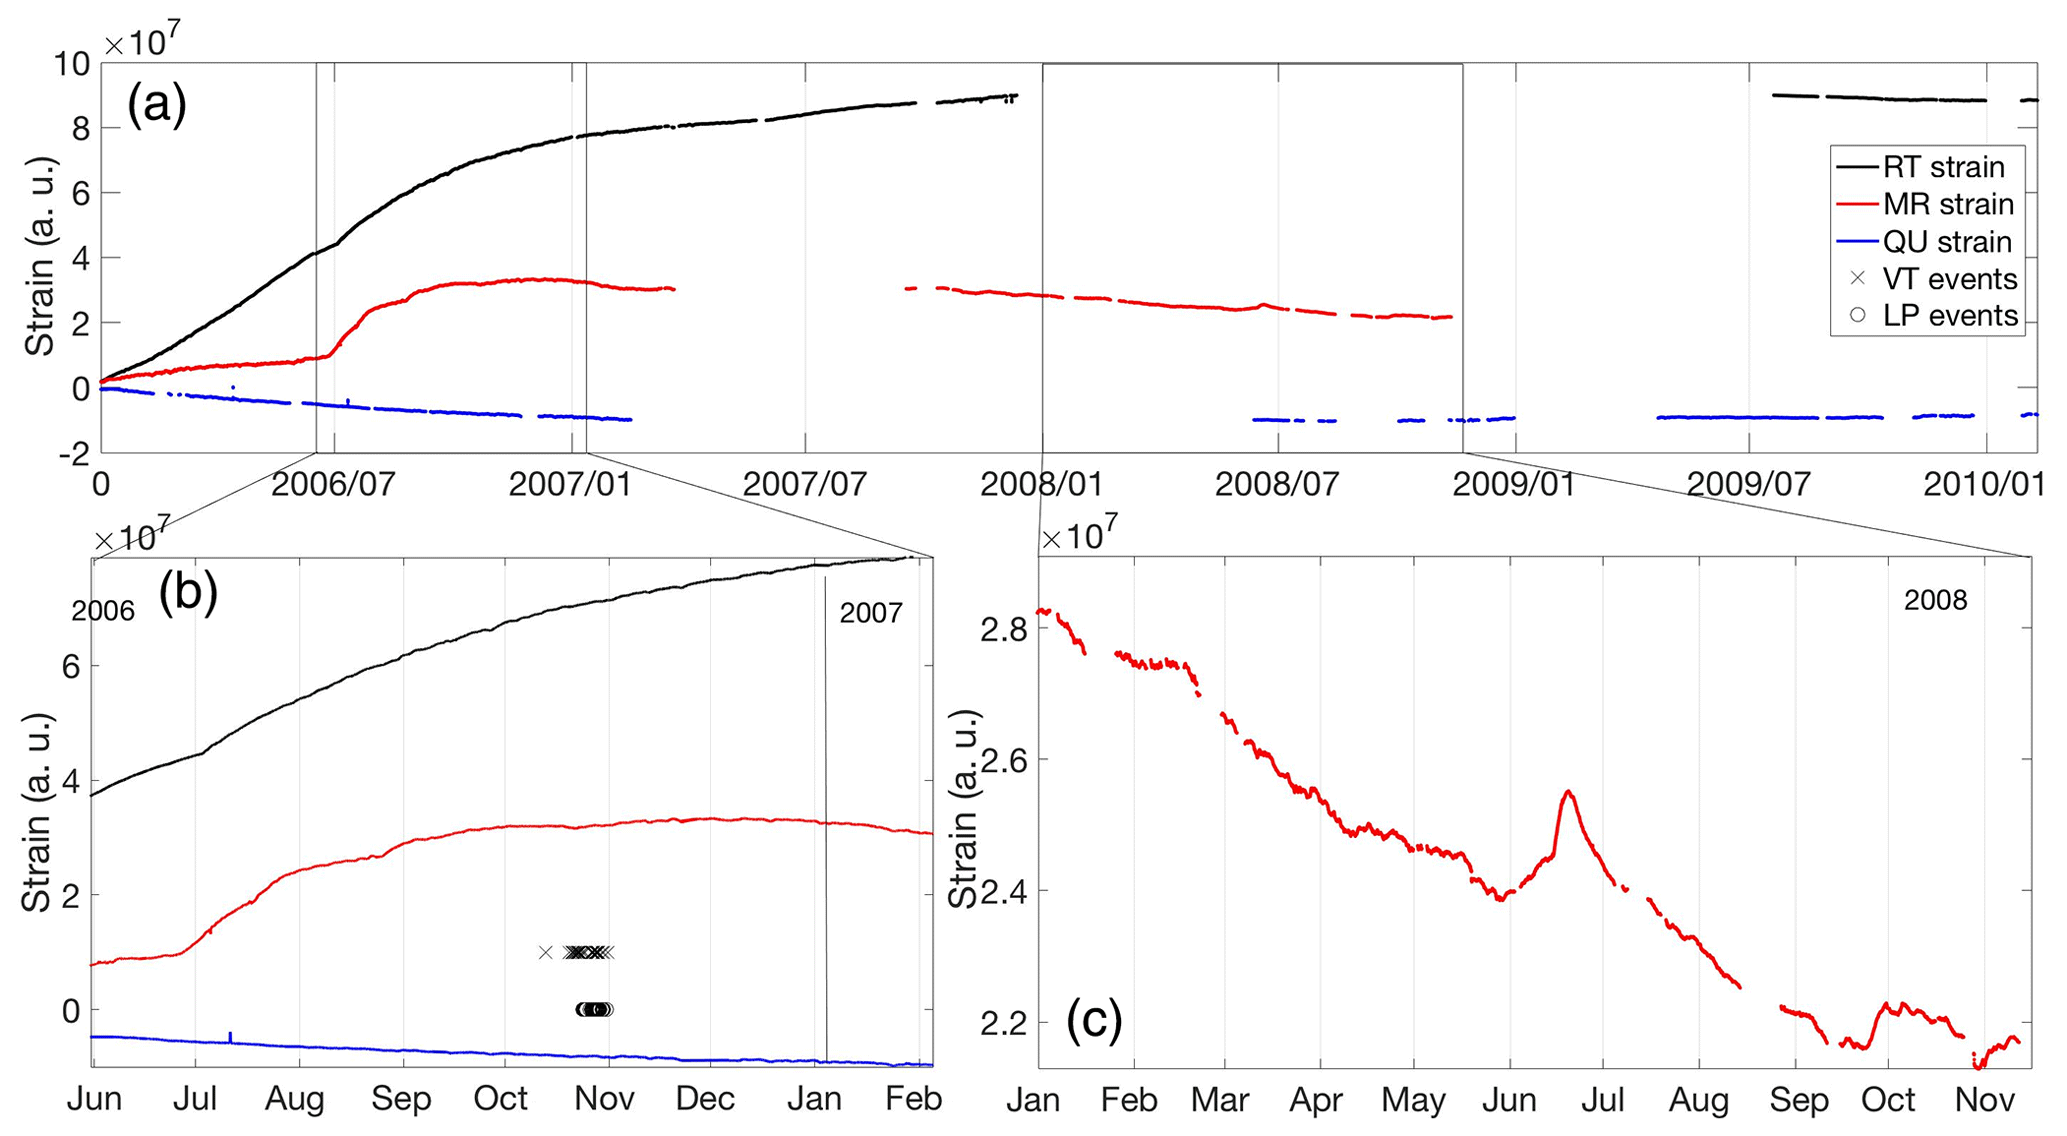
Figure 7Endogenous events recorded by the three strainmeters. (a) shows the strain recorded by the three strainmeters at RT, MR and QU from January 2006 until March 2010. Strain data are plotted relative to an arbitrary datum. (b) and (c) show a magnified view of the two most significant endogenous events, occurred during 2006 (b) and 2008 (c).
Increased volcanic tremor activity in 26 October 2006, corresponded to a transient strain contraction at the RT strainmeter with a duration of approximately 1 h (Fig. 8).
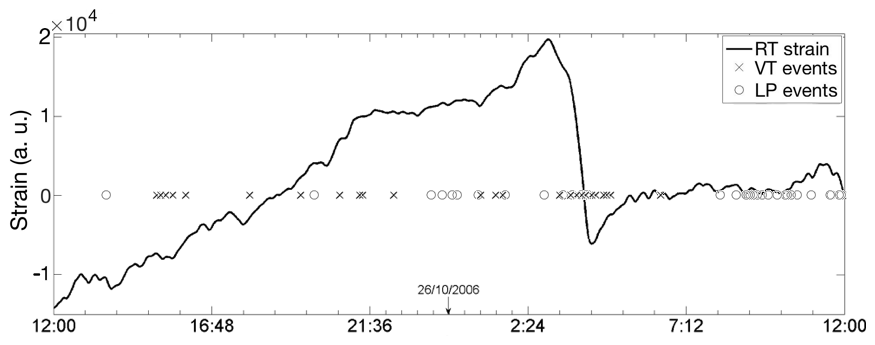
Figure 8Strainmeter signal observed at RT. Crosses and circles on the zero axis show the time of occurrence of VT and LP events recorded near Solfatara. Tides and atmospheric pressure have been removed from the raw strainmeter data. An arbitrary datum has been used for strain.
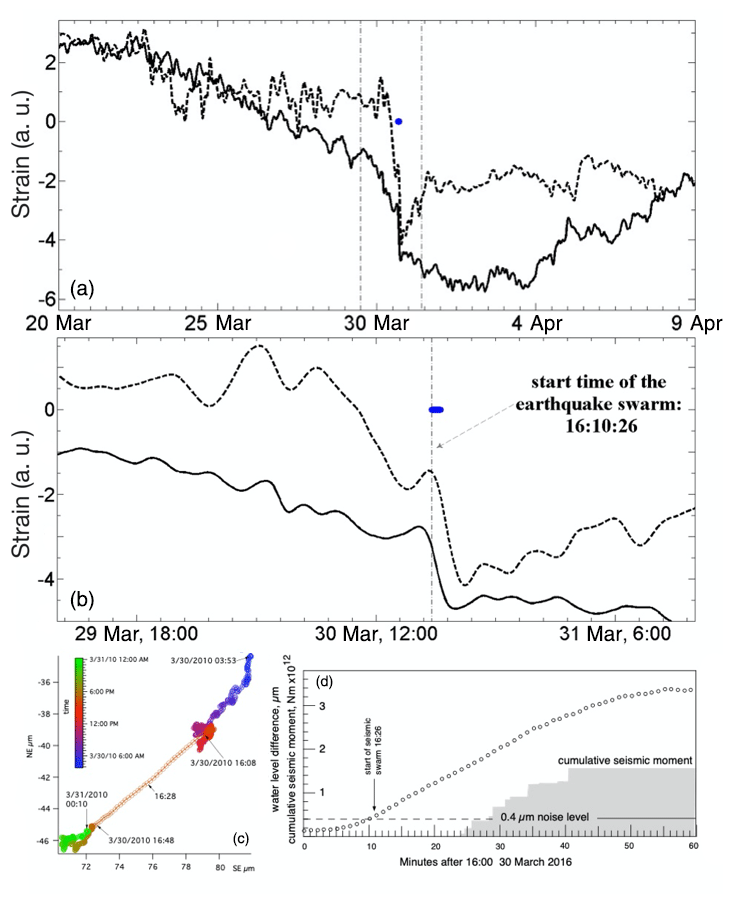
Figure 9(a) and (b) show strain (RT, continuous line) and southward tilt (dashed line) preceding and accompanying the Astroni-Pisciarelli seismic swarm in March 2010. The tilt amplitude unit is µrad and the strain unit multiplier is 10−8. (b) shows an expanded view of the deformation, and (c) and (d) shows the tilt vector at one-minute intervals, compared to the seismic moment release, the bulk of which occurs 15–30 min after the first microearthquake in the swarm. The dashed line lower right shows the 10–30 min RMS noise-level threshold in the raw data. The first microearthquake corresponds to the approximate time at which the tilt signal exceeds the short term noise level, however, the microseismic energy release starts 15 min after this threshold is exceeded, suggesting its utility in early warning methods.
One of the most significant transients recorded by the strainmeters and tiltmeters on 30 March 2010 coincided with a seismic swarm containing about one hundred volcano-tectonic earthquakes with small magnitudes (Md≤1.2), located close to the Agnano crater (Fig. 1). A small increase in volumetric strain, as well as in the north component of tilt, occurs during the day preceding the event, followed by a reversal and accelerated dilatation and a southward tilt which precedes the swarm by 10–20 min (Fig. 9). The event, clearly recorded by the whole borehole strainmeters and long-baseline tiltmeters network, has a tilt “step” approximately equal to 200–400 nanoradians, while the volumetric strain-step is 10−8. The source is compatible with the location of the inflation and deflation episodes analysed by Amoruso and Crescentini (2011) and Amoruso et al. (2015). The cumulative magnitude of the swarm was equivalent to magnitude Mw=1.3 and the epicentral area is the Astroni-Pisciarelli zone, at a depth of approximately 2 km.
We briefly discuss here a possible mechanism to account for observed secular uplift interrupted by transient subsidence and renewed uplift. We use insights from the most prominent aseismic episode observed coherently by our Campi Flegrei long baseline tiltmeter and dilatometer data, which was followed by a seismic swarm of very small magnitude events, with a duration of 40 min in March 2010. This episode occurs after a period of inflation with a duration of a few months, which may be related to an increase in the pressurized triaxial ellipsoid (Amoruso et al., 2015) located at about 4 km in depth below Pozzuoli. Inflation accelerates the day before the occurrence of the deflation. We consider the most likely phenomenon for the deflation event to be a leak from the deeper (∼ 4 km) source to the shallower reservoir (∼ 2 km in depth), where magmatic fluids mix with vaporizing meteoric liquids (Chiodini et al., 2015) (Fig. 10). The duration of the supposed evacuation event coincides with the 40 min duration of the observed changes measured by strainmeters and tiltmeters. A cylindrical conduit with radius ≈10 m, or a 100 m × 5 cm rectangular cross-section fissure, would permit the transfer of ≈105 m3 of volatile magma/gas mix in 40 min at a flow velocity of 1 m/s, which we consider reasonable values for conduit flow rates (Vassalli, 2008; Longo et al., 2012). This volume is comparable to a Strombolian eruption and it is compatible with the release of gas evaluated at surface by Chiodini et al. (2012) and modelling of the main source deflation inferred by Amoruso et al. (2015).
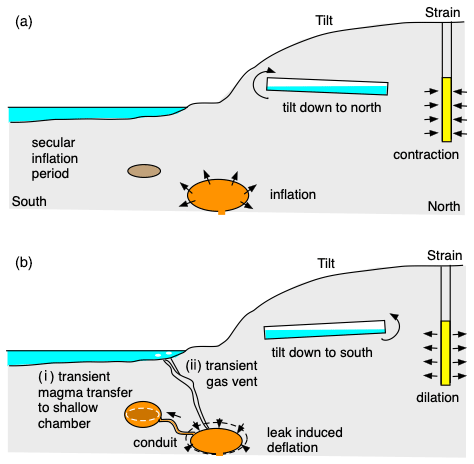
Figure 10(a) Inferred secular Inflation of deep magma source leading eventually to fracture of the confining rock. (b) Two possible mechanisms for deflation (i) leak to shallower chamber via a hydraulic conduit, or (ii) submarine or subaerial venting of gas. The transient deflation episode in March 2010 is interpreted as process (i) (Amoruso et al., 2015).
The leak is interpreted to have been initiated by small fractures preceding the subsequent seismic swarm. This observation gains importance since seismic swarms of VT earthquakes have generally been dominated by normal faulting, occurring at the time of small uplift episodes associated with magma chamber inflation. Our quantitative model, based on spatially coherent strain and tilt data, is the first observation reporting short term anomalous strain associated with a reduction of magma-chamber volume (Amoruso et al., 2015), preceding seismicity by tens of minutes. The location of these volume changes is confined to depth of about 4 km beneath Pozzuoli, coincident with the locus of inflation and deflation episodes estimated by Amoruso and Crescentini (2011) and Amoruso et al. (2014a, b) on the basis of non-linear inversion of geodetic data. Calculations made by Amoruso et al. (2015) have suggested that the Campi Flegrei microseismicity that occurred in March 2010 was induced by a rapid transient deflation on all, or part of, a previously known, slowly inflating offshore magma source amounting to 4.5×10⁴ m3. The rate of volume decrease during the 40 min deflation event has been estimated approximately as 105 m3/h, that is a factor of 500 faster than the mean inflation rate before and after the event, thus suggesting that stressing rates were a relevant factor to the triggering of seismicity. Although microseismicity occurred ≈20 min after the starting of the deflation, the mechanism for the delay is uncertain, but the suggested leaking is the most likely explanation. It is possible that poroelasticity delayed the transmission of stress, but it is also possible that rupture responded either to the attainment of a static strain threshold, or it may also respond to the maximum strain rate change.
Complexity similar to this has been recently modeled at the active volcano Sakurajima, Japan, by Yokoo et al. (2013) and has been associated with the observed anomalies of strain signals before vulcanian explosions at the active Showa crater. The main difference between these examples and the Campi Flegrei region, is the 4 km depth from the surface at which intense degassing or underground fluid migration occurs, with no surface eruption of magma. Any long-term oscillation due to the refilling of magma chamber have not been observed up to present in Campi Flegrei: this is also different from recent observations made by Hautmann et al. (2014) and Di Lieto et al. (2020) for SHV (Montserrat) and Stromboli active volcanoes in correspondence with paroxysmal activity. The transient ULP signals discussed by Bagagli et al. (2017) as an evidence of magmatic refilling process are correlated with barometric and other meteorological data and consequently are of external origin.
Recent deformation in the Campi Flegrei caldera is dominated by aseismic inflation, interrupted by transient aseismic reversals in rate. These are typically below the noise level or are poorly sampled by the low sampling frequency of most geodetic techniques, but can be quantified relatively easily using high sensitivity strainmeters and tiltmeters. These instruments provide coherent views of deformation at several different time scales, capturing reversals in rate with periods from minutes to months. Monotonic uplift episodes have been recorded with durations of several weeks to a few years. The longest of these mini-uplift periods recorded since 1994 appears not be continuous, but occurred in several small episodes, each lasting not more than a few weeks, as demonstrated by the inflections in rate evident in Fig. 3.
The current array provides a glimpse of the potential utility of a dense array of strainmeters and tiltmeters surrounding the Campi Flegrei region in providing enhanced details of the inflation/deflation process and associated seismicity. An expanded array of tiltmeters and strainmeters operating continuously would permit the details of magma-transfer and the underlying cause of subsequent seismic activity to be monitored.
Data used in the current paper are available at https://doi.org/10.1594/PANGAEA.927603 (Di Lieto et al., 2021).
BDL and PR have collected and analyzed the strainmeter and tiltmeter data, and contributed to the writing of the manuscript. RB, PR, RS and BDL installed the tiltmeters. RS and PR installed the strainmeters. RS and RB wrote the manuscript.
The authors declare that they have no conflict of interest.
This article is part of the special issue “Understanding volcanic processes through geophysical and volcanological data investigations: some case studies from Italian sites (EGU2019 GMPV5.11 session, COV10 S01.11session)”. It is not associated with a conference.
This study was supported by Istituto Nazionale di Geofisica e Vulcanologia and by the University of Salerno.
This research has been supported by CRdC – AMRA and Università degli Studi di Salerno.
This paper was edited by Paola Cusano and reviewed by Patrick Smith and one anonymous referee.
Agnew, D. C.: Strainmeters and tiltmeters, Rev. Geophys., 24, 579–624, 1986.
Amoruso, A. and Crescentini, L.: Modelling deformation due to a pressurized ellipsoidal cavity, with reference to the Campi Flegrei caldera, Italy, Geophys. Res. Lett., 38, L01303, https://doi.org/10.1029/2010GL046030, 2011.
Amoruso, A., Crescentini, L., and Scarpa, R.: Removing tidal and atmospheric effects from Earth deformation measurements, Geophys. J. Int., 140, 493–505, 2000.
Amoruso, A., Crescentini, L., Linde, A. T., Sacks, I. S., Scarpa, R., and Romano, P.: A Horizontal Crack in a Layered Structure Satisfies Deformation for the 2004-2006 Uplift of Campi Flegrei, Geophys. Res. Lett., 34, L22313, https://doi.org/10.1029/2007GL031644, 2007.
Amoruso, A., Crescentini, L., and Sabbetta, I.: Paired deformation sources of the Campi Flegrei caldera (Italy) required by recent (1980–2010) deformation history, J. Geophys. Res., 119, 858–879, https://doi.org/10.1002/2013JB010392, 2014a.
Amoruso, A., Crescentini, L., Sabbetta, I., De Martino, P., Obrizzo, F., and Tammaro, U.: Clues to the cause of the 2011–2013 Campi Flegrei caldera unrest, Italy, from GPS data, Geophys. Res. Lett., 41, 3018–3088, https://doi.org/10.1002/2014GL059539, 2014b.
Amoruso, A., Crescentini, L., Scarpa, R., Bilham, R., Linde, A. T., and Sacks, I. S.: Abrupt magma chamber contraction and microseismicity at Campi Flegrei, Italy: Cause and effect determined from strainmeters and tiltmeters, J. Geophys. Res.-Sol. Ea., 120, 5467–5478, https://doi.org/10.1002/2015JB012085, 2015.
Bagagli, M., Montagna, C. P., Papale, P., and Longo, A.: Signature of magmatic processes instrainmeter records at Campi Flegrei(Italy), Geophys. Res. Lett., 44, 718–725, https://doi.org/10.1002/2016GL071875, 2017.
Barberi, F., Corrado, G., Innocenti, F., and Luongo, G.: Phlegrean Fields 1982-1984: a brief chronicle of a volcano emergency in a densely populated area, Bull. Volcanol., 47, 175–185, 1986.
Bilham R., Beavan, R., and Evans, K.: Long-baseline water tube geometry, the detection of flexure and tilt and the suppression of locally generated signals, 9th International Symp. on Earth Tides, NY, E. Schweitzerbartsche Buchhandlung D-7000, Stuttgart, 85–94, 1982.
Chiodini, G., Caliro, S., De Martino, P., Avino, R., and Gherardi, F.: Early signals of new volcanic unrest at Campi Flegrei caldera? Insights from geochemical data and physical simulations, Geology, October 2012, 40, 943–946, https://doi.org/10.1130/G33251.1, 2012.
Chiodini, G., Vandemeulebrouck, J., Caliro, S., D'Auria, L., De Martino, P., Mangiacapra, A., and Petrillo, Z.: Evidence of thermal-driven processes triggering the 2005–2014 unrest at Campi Flegrei caldera, Earth Planet. Sc. Lett., 414, 58–67, https://doi.org/10.1016/j.epsl.2015.01.012, 2015.
Chouet, B. A.: Long-period volcano seismicity: its source and use in eruption forecasting, Nature, 380, 309–316, 1996.
Corrado, G., Guerra, I., Lo Bascio, A., Luongo, G., and Rampoldi, F.: Inflation and microearthquake activity of Phlegraean Fields, Italy, Bull. Volcanol., 40, 169–188, 1977.
Currenti, G., Zuccarello, L., Bonaccorso, A., and Sicali, A.: Borehole volumetric strainmeter calibration from a nearby seismic broadband array at Etna volcano, J. Geophys. Res.-Sol. Ea., 122, 7729–7738, https://doi.org/10.1002/2017JB014663, 2017.
D'Auria, L., Giudicepietro, F., Aquino, I., Borriello, G., Del Gaudio, C., Lo Bascio, D., Martini, M., Ricciardi, G. P., Ricciolino, P., and Ricco, C.: Repeated fluid‐transfer episodes as a mechanism for the recent dynamics of Campi Flegrei caldera (1989–2010), J. Geophys. Res., 116, B04313, https://doi.org/10.1029/2010JB007837, 2011.
D'Auria, L., Giudicepietro, F., Martini, M., and Lanari, R.: The 4D imaging of the source of ground deformation at Campi Flegrei caldera (southern Italy), J. Geophys. Res., 117, B08209, https://doi.org/10.1029/2012JB009181, 2012.
Del Gaudio, C., Aquino, I., Ricciardi, G. P., Ricco, C., and Scandone, R.: Unrest episodes at Campi Flegrei: A reconstruction of vertical ground movements during 1905–2009, J. Volc. Geoth. Res., 195, 48–56, https://doi.org/10.1016/j.jvolgeores.2010.05.014, 2010.
De Martino, P., Tammaro, U., and Obrizzo, F.: GPS time series at Campi Flegrei caldera (2000–2013), Ann. Geophys., 57, 2, https://doi.org/10.4401/ag-6431, 2014.
Di Lieto, B., Romano, P., Scarpa, R., and Linde, A. T.: Strain signals before and during paroxysmal activity at Stromboli volcano, Italy. Geoph. Res. Let., 47, e2020GL088521, https://doi.org/10.1029/2020GL088521, 2020.
Di Lieto, B., Romano, P., and Scarpa, R.: Aseismic strain episodes at Campi Flegrei Caldera, PANGAEA, https://doi.org/10.1594/PANGAEA.927603, 2021.
Fukao, Y., Fujita, E., Hori, S., and Kanjio, K.: Response of a volcanic conduit to step-like change in magma pressure, Geophys. Res. Lett., 25, 105–108, 1998.
Hart, R. H. G., Gladwin, M. T., Gwyther, R. L., Agnew, D. C., and Wyatt, F. K.: Tidal calibration of borehole strain meters: removing the effect of small-scale inhomogeneity, J. Geophys. Res., 101, 25553–25571, 1996.
Hautmann, S., Witham, F., Christopher, T., Cole, P., Linde, A. T., Sacks, I. S., and Sparks, S. J.: Strain field analysis on Montserrat (W.I.) as tool for assessing permeable flow paths in the magmatic system of Soufrière Hills Volcano, Geochem. Geophy. Geosy., 15, 676–690, https://doi.org/10.1002/2013GC005087, 2014.
Ishihara, K.: Prediction of summit eruption by tilt and strain data at Sakurajima volcano, Japan, Proc. Kagoshima Int. Conf. on Volcanoes, 19–23 July 1988, Kagoshima, Japan, 207–210, 1988.
Linde, A. T. and Sacks, I. S.: Continuous monitoring of volcanoes with borehole strainmeters, AGU Geophys. Mon., 92, 171–185, 1995.
Longo, A., Papale, P., Vassalli, M., Saccorotti, G., Montagna, C. P., Cassioli, A., Giudice, S., and Boschi, E.: Magma convection and mixing dynamics as a source of ultra-long-period oscillations, Bull. Volcanol., 74, 873–880, 2012.
Manconi, A., Walter, T. R., Manzo, M., Zeni, G., Tizzani, P., Sansosti, E., and Lanari, R.: On the effects of 3‐D mechanical heterogeneities at Campi Flegrei caldera, southern Italy, J. Geophys. Res., 115, B08405, https://doi.org/10.1029/2009JB007099, 2010.
Mattioli, G. S., Young, S. R., Voight, B., Steven, R., Sparks, J., Shalev, E., Sacks, I. S., Malin, P., Linde, A. T., Johnston, W., Hidayat, D., Elsworth , D., Dunkley, P., Herd, R., Neuberg, J., Norton, G., and Widiwijayanti, C.: Prototype PBO instrumentation of CALIPSO Project captures world-record lava dome collapse on Montserrat volcano, Eos, 85, 317–328, 2004.
Pingue, F., De Martino, P., Obrizzo, F., Serio, C., and Tammaro, U.: Stima del campo di spostamento ai Campi Flegrei dai dati CGPS e di livellazione di precisione nel periodo maggio 2004–marzo 2006, Technical Report, available at: http://www.ov.ingv.it/ov/ (last access: 14 May 2020), 2006.
Saccorotti, G., Petrosino, S., Bianco, F., Castellano, M., Galluzzo, D., La Rocca, M., Del Pezzo, E., Maccarelli, L., and Cusano, P.: Seismicity associated with the 2004-2006 renewed ground uplift at Campi Flegrei caldera, Italy, Phys. Earth Plan. Int., 165, 14–24, 2007.
Scarpa, R.: Predicting volcanic eruptions, Science, 293, 615–616, 2001.
Scarpa, R., Amoruso, A., Crescentini, L., Linde, A. T., Sacks, I. S., Del Pezzo, E., and Martini, M.: Forecasting volcanic eruptions: the case of Vesuvius and Campi Flegrei, in: Problems in Geophysics for the New Millennium, edited by: Boschi, E., Ekstrom, G., and Morelli, A., 13–26, Ed. Compositori, Bologna, 2000.
Scarpa, R., Amoruso, A., Crescentini, L., Romano, P., De Cesare, W., Martini, M., Scarpato, G., Linde, A. T., and Sacks, I. S.: New borehole strain system detects uplift at Campi Flegrei, EOS Trans. AGU, 88, 197–203, 2007.
Segall, P.: When is the strain in the meter the same as the strain in the rock?, Geophys. Res. Lett., 30, 19, https://doi.org/10.1029/2003GL017995, 2003.
Tamura, Y., Sato, T., Ooe, M. and Ishiguro, M.: A procedure for tidal analysis with a Bayesian information criterion, Geophys. J. Int., 104, 507–516, https://doi.org/10.1111/j.1365-246X.1991.tb05697.x, 1991.
Troise, C., De Natale, G., Pingue, F., Obrizzo, F., De Martino, P., Tammaro, U., and Boschi, E.: Renewed round uplift at Campi Flegrei caldera (Italy): new insight on magmatic process and forecast, Geophys. Res. Lett, 34, L03301, https://doi.org/10.1029/2006GL028545, 2007.
Vassalli, M.: Numerical simulations of magma chamber dynamics at Campi Flegrei, and associated seismicity, deformation and gravity changes, PhD Thesis, University of Bologna, 2008.
Voight, B., Linde, A. T., Sacks, I. S., Mattioli, G. S., Sparks, J., Elsworth, D., Hidayat, D., Malin, P., Shalev, E., Widiwijayanti, C., Young, S. R., Bass, V., Clarke, A., Dunkley, P., Johnston, W., McWorther, N., Neuberg, J., and Williams, P.: Unprecedented pressure increase in deep magma reservoir triggered by lava-dome collapse, Geophys. Res. Lett., 33, L03312, https://doi.org/10.1029/2005GL024870, 2006.
Yokoo, A., Iguchi, M., Tameguri, T., and Yamamoto, K.: Processes Prior to Outbursts of Vulcanian Eruption at Showa Crater of Sakurajima Volcano, Bull. Volcanol. Soc. Japan, 58, 163–181, 2013.
Yokoyama, I.: Pozzuoli event in 1970, Nature, 229, 532–533, 1971.
- Abstract
- Introduction
- Overview of ground deformation at Campi Flegrei caldera
- Borehole deformation network at Campi Flegrei
- Data observations and analysis
- Discussion
- Conclusions
- Data availability
- Author contributions
- Competing interests
- Special issue statement
- Acknowledgements
- Financial support
- Review statement
- References