 | 04 Sep 2019
Inferring microseismic source mechanisms and in situ stresses during triaxial deformation of a North-Sea-analogue sandstone
Jérémie Dautriat
Ismael Vera Rodriguez
Kamran Iranpour
Guillaume Sauvin
Joonsang Park
Joel Sarout
Magnus Soldal
Lars Grande
Volker Oye
David N. Dewhurst
Nazmul Haque Mondol
Jung Chan Choi
Monitoring microseismic activity provides a window through which to observe reservoir deformation during hydrocarbon and geothermal energy production, or CO2 injection and storage. Specifically, microseismic monitoring may help constrain geomechanical models through an improved understanding of the location and geometry of faults, and the stress conditions local to them. Such techniques can be assessed in the laboratory, where fault geometries and stress conditions are well constrained. We carried out a triaxial test on a sample of Red Wildmoor sandstone, an analogue to a weak North Sea reservoir sandstone. The sample was coupled with an array of piezo-transducers, to measure ultrasonic wave velocities and monitor acoustic emissions (AE) – sample-scale microseismic activity associated with micro-cracking. We calculated the rate of AE, localised the AE events, and inferred their moment tensor from P-wave first motion polarities and amplitudes. We applied a biaxial decomposition to the resulting moment tensors of the high signal-to-noise ratio events, to provide nodal planes, slip vectors, and displacement vectors for each event. These attributes were then used to infer local stress directions and their relative magnitudes. Both the AE fracture mechanisms and the inferred stress conditions correspond to the sample-scale fracturing and applied stresses. This workflow, which considers fracture models relevant to the subsurface, can be applied to large-scale geoengineering applications to obtain fracture mechanisms and in-situ stresses from recorded microseismic data.
- Article
(8934 KB) - Full-text XML
- BibTeX
- EndNote


Microseismic monitoring at sites such as producing hydrocarbon reservoirs, mines, and geological CO2 storage reservoirs, can inform on rock integrity, fault locations and geometries, and localised stress changes. For example, at CO2 injection sites, pressure changes may cause slip on pre-existing fractures or faults, resulting in detectable induced seismicity (Rutqvist, 2012) indicating the progression of the CO2 plume and the pressure front preceding it (Goertz-Allmann et al., 2014).
Moment tensors – a description of the equivalent forces acting at a seismic point source – are commonly inferred from microseismic data and, if the fault planes are derived, local stress orientations may also be inferred (Michael, 1984; Vavryčuk, 2014). Stress inversion has typically considered pure double couple sources, but recently Jia et al. (2018) extended the method to allow for non-double-couple sources, accounting for displacement outside of the fault plane. However, it remains difficult to verify the results of these stress inversion methods at the reservoir scale, where measurements of in situ stresses and their spatial variation are normally unavailable, and faults can be too small to be observed by active-source seismic surveys.
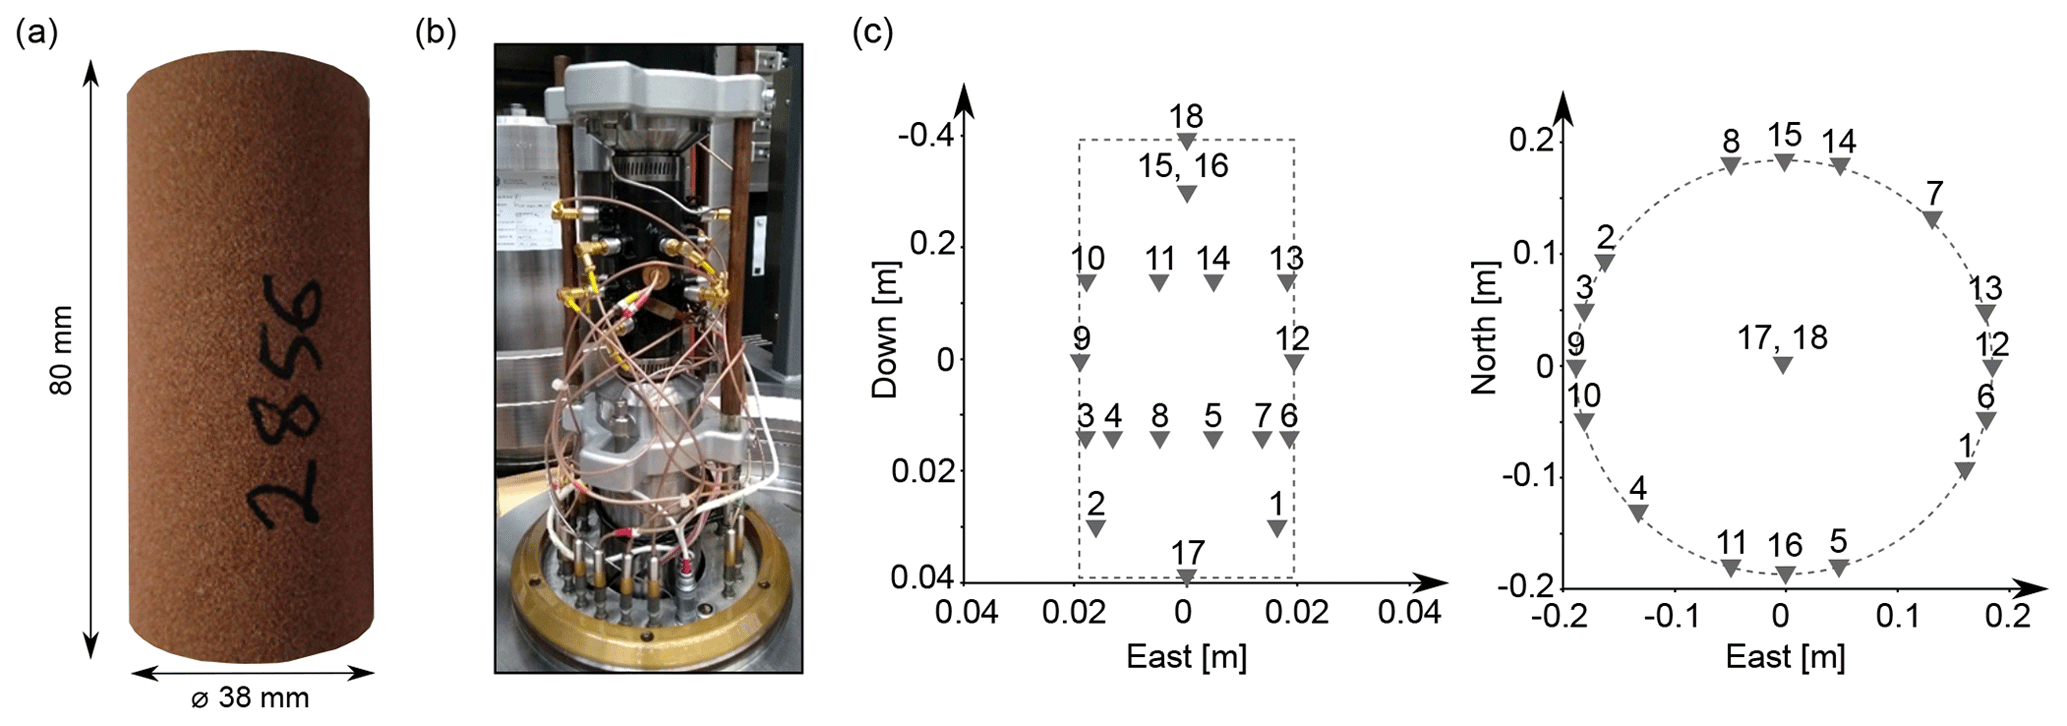
Figure 1Testing material and experimental setup. (a) the Red Wildmoor sandstone sample, (b) the sample within the triaxial cell at CSIRO Energy, Perth, Australia, and (c) a map of the transducers locations: Sensors 1–8, 10, 11, 13–16 (14 sensors in total) were used for acoustic emission monitoring. Sensors 17 and 18 were used to determine P-wave velocities in the axial direction, and sensors 9 and 12 in the radial direction.
When deforming rock samples in the laboratory, the macroscopic stress state is known and, through monitoring the laboratory-scale microseismic events (or Acoustic Emissions: AE), the initiation and location of any failure plane can be monitored as it develops. AE monitoring is a well-established technique to study failure processes in rocks (e.g. Baud et al., 2004; Eppes et al., 2016; Griffiths et al., 2018; Lockner, 1993; Lockner et al., 1991), and can provide insights into fracture source mechanisms by statistical evaluation of P-wave first motion polarities (Stanchits et al., 2006; Zang et al., 1998), or by seismic moment tensor inversion. The seismic moment tensor may be decomposed into isotropic, double-couple, and compensated linear vector dipole parts (Knopoff and Randall, 1970), and their relative contributions may be analysed (Aker et al., 2014; Kwiatek et al., 2014). An alternative decomposition of the seismic moment tensor is the biaxial decomposition (Chapman and Leaney, 2012), whereby the source mechanism is interpreted in terms of a general disclocation source accompanied by a pressure change. The advantage of the biaxial decomposition is that it takes into account the effects of general anisotropy in the source region, and provides a more physically intuitive representation of a seismic source (e.g., Vera Rodriguez et al., 2018). Further, the biaxial decomposition provides fault planes and displacement vectors which may be used as input for the aforementioned stress inversion methods.
Here we construct a workflow combining moment tensor inversion, biaxial decomposition and stress inversion to infer source mechanisms and in situ stresses from microseismic data, which we apply in the laboratory. We analyse AE data acquired during the deformation of a sandstone sample (relevant to North Sea reservoirs) until the formation of a through-going fracture, which we subsequently reactivated further.
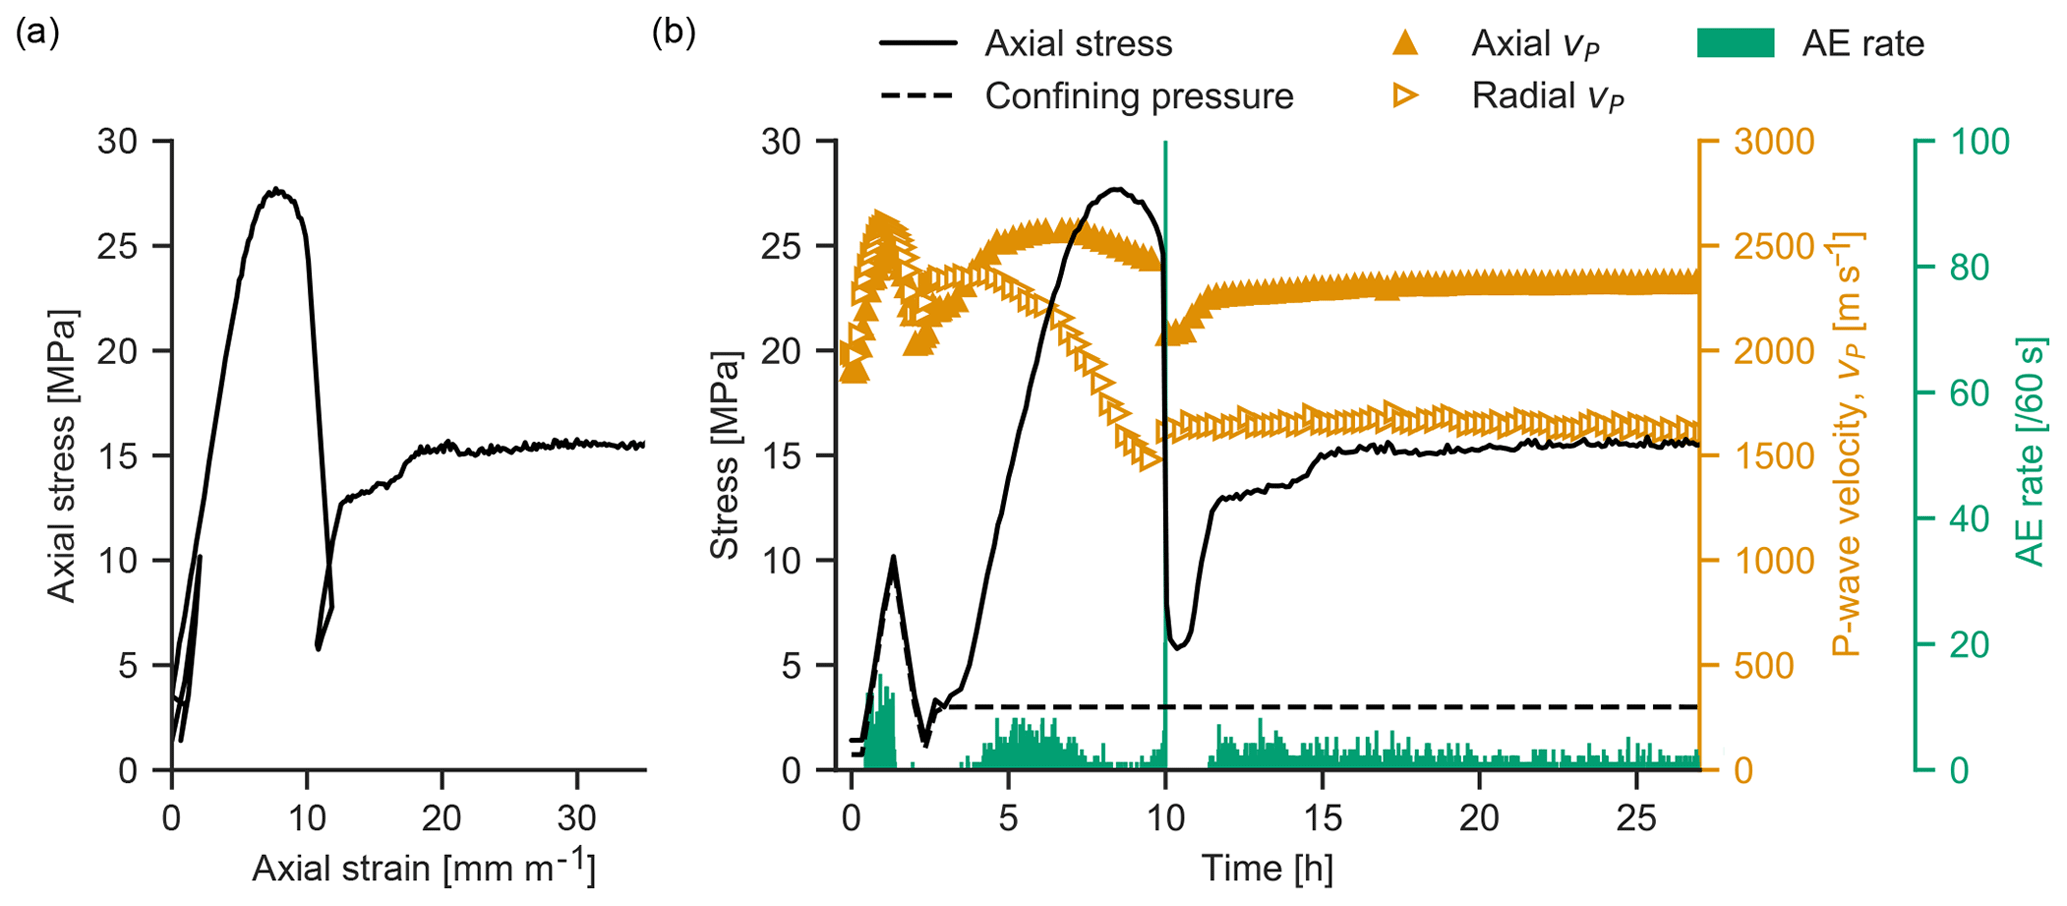
Figure 2Results of the triaxial testing of dry Red Wildmoor sandstone. (a) Axial strain against axial stress; (b) Axial stress, confining pressure, P-wave velocity in the axial and radial directions, and acoustic emission (AE) rate against time.
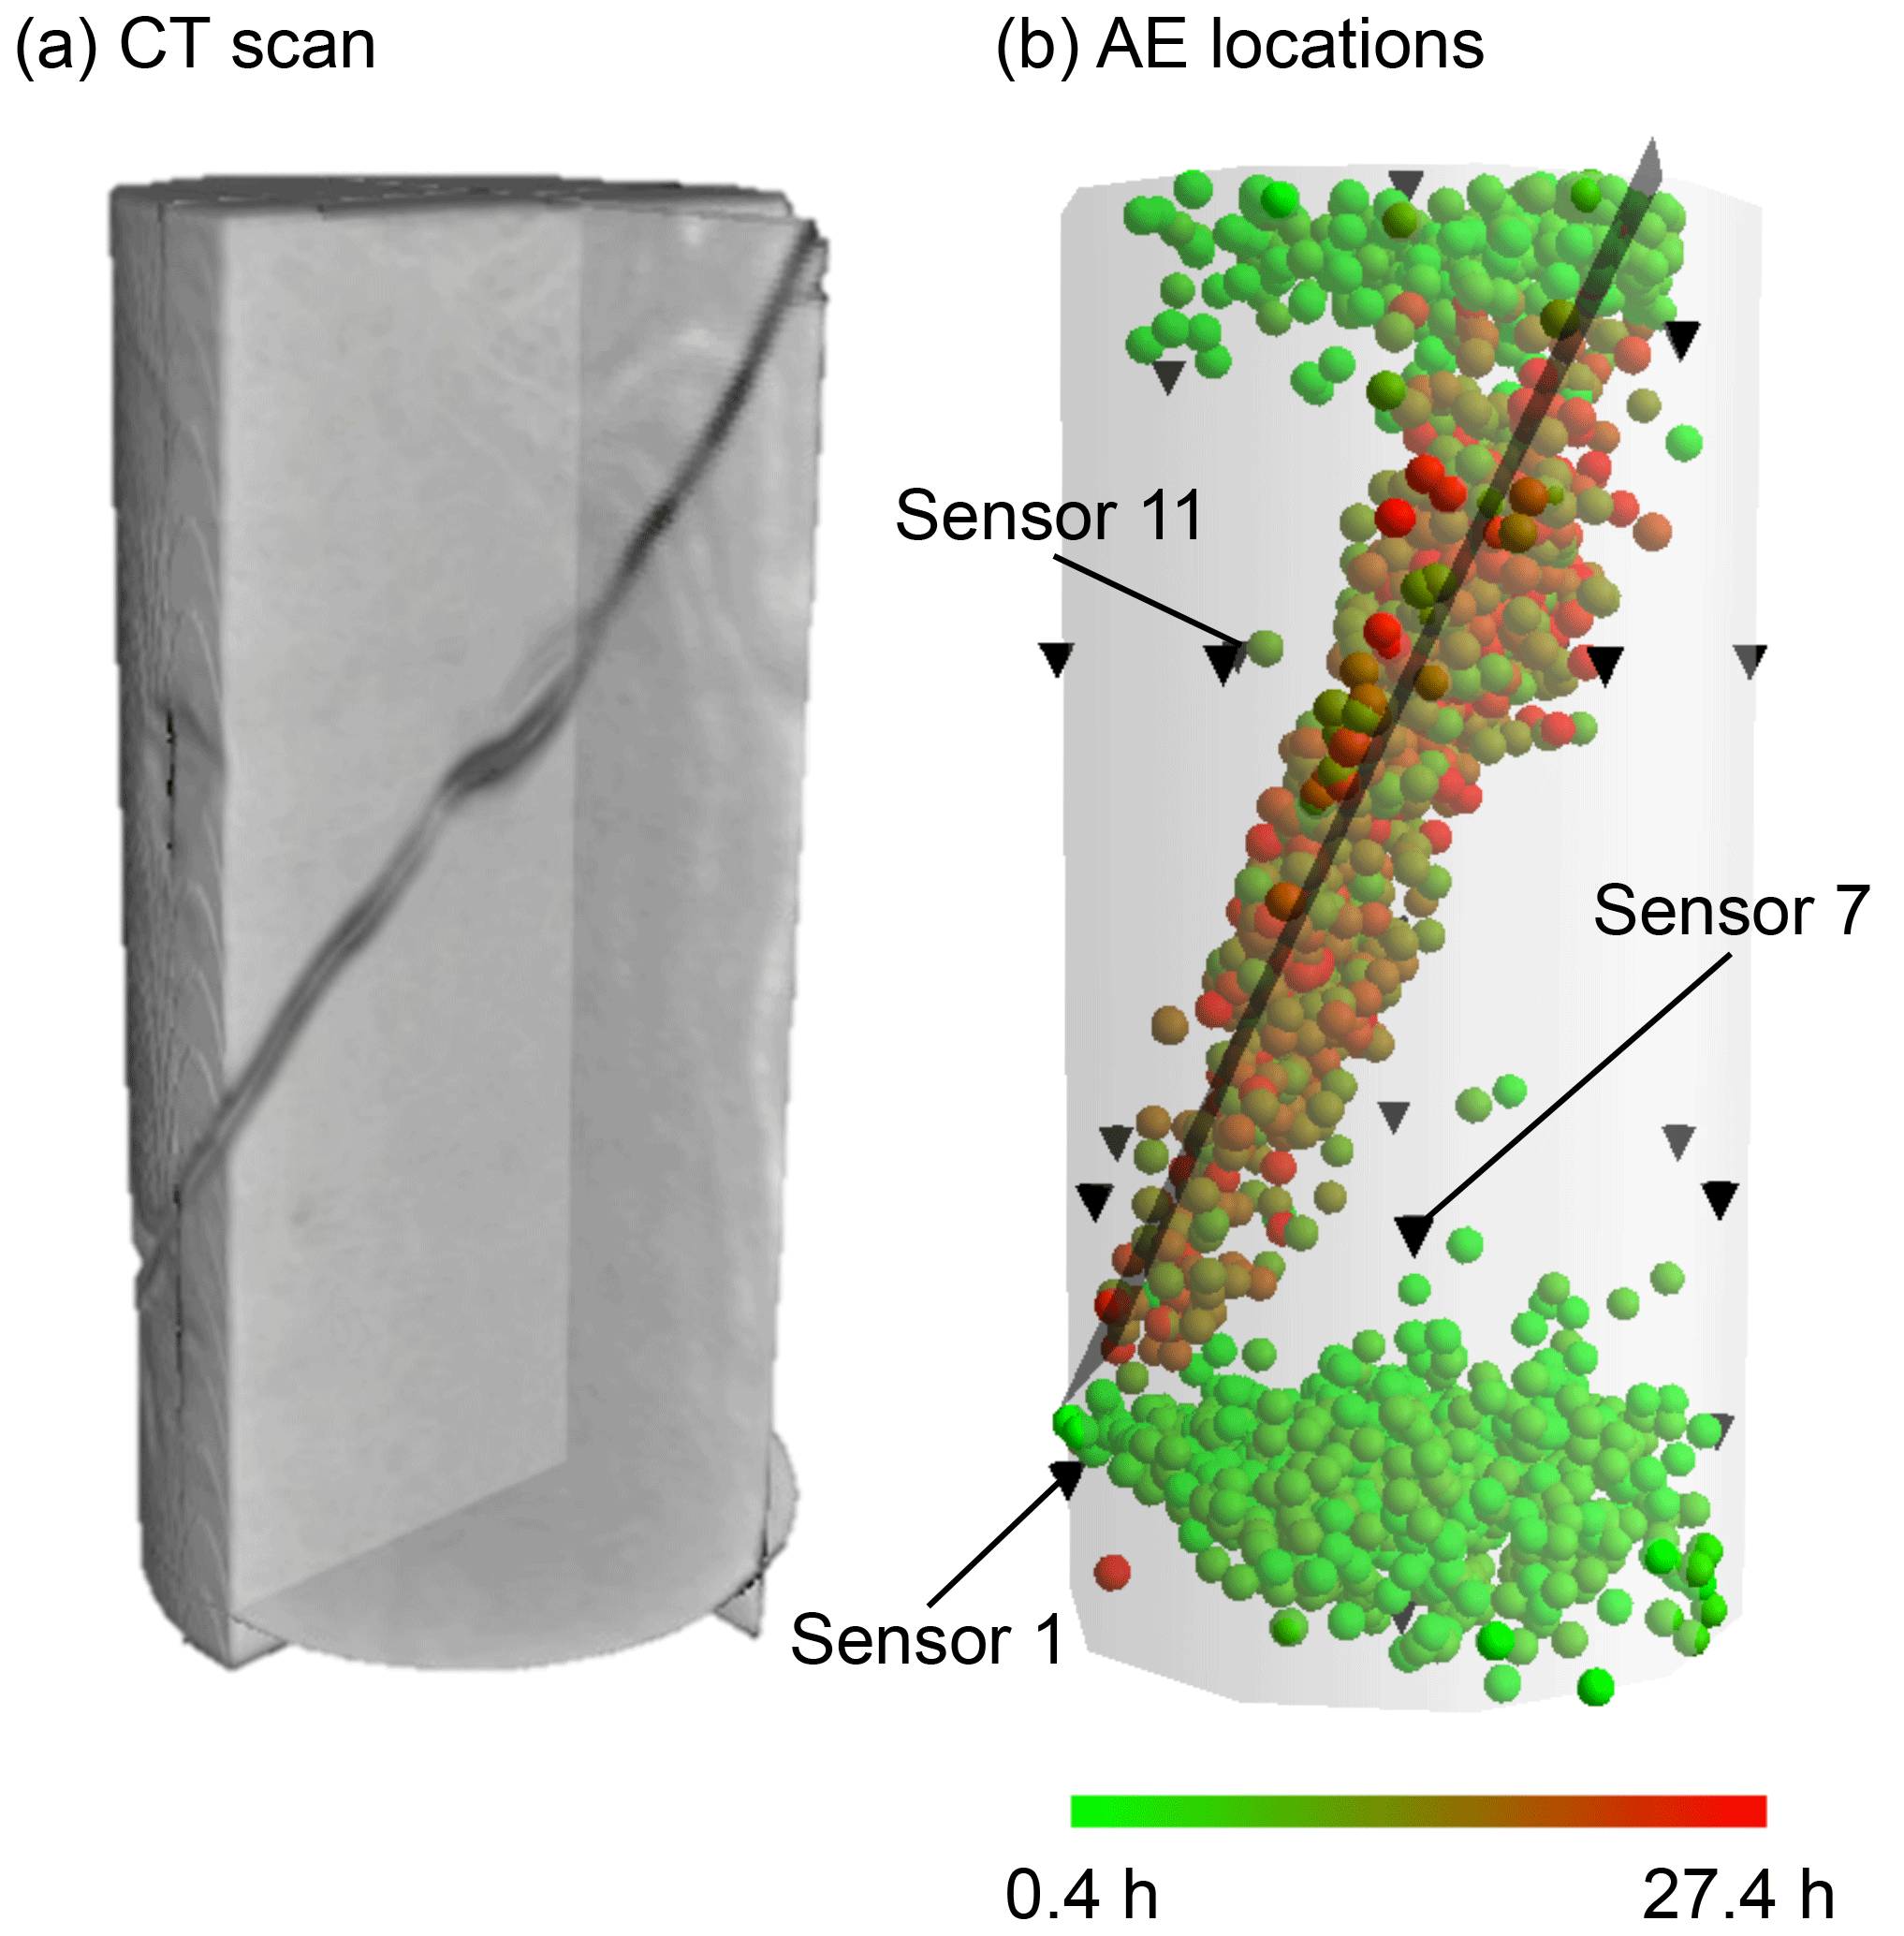
Figure 3(a) X-ray computed tomography of the Red Wildmoor sandstone sample following testing. (b) 2342 located acoustic emission (AE) events (coloured spheres) contained within the sample cylinder. Black upside-down cones show the locations of the AE receivers (sensor 11 is located at the far side of the sample). The grey plane is a manual fit of the fault.
Red Wildmoor sandstone, a Triassic sandstone from Bromsgrove U.K., has been widely used as an analogue to weak North Sea reservoir sandstones (Papamichos et al., 2000). We cored and ground a cylindrical sample 38 mm in diameter and 80 mm in length (Fig. 1a). The sample had a porosity of 24.1 %, and a permeability (to gas) of 199±75 mD ().
AE monitoring during the triaxial testing of the dry sample was performed using the sensors shown in Fig. 1b (Sarout et al., 2017). The sample was first subjected to a single isotropic stress cycle between 1 and 10 MPa and then deformed axially at a constant strain rate of s−1, under a confining pressure of 3 MPa (Fig. 2). Failure of the sample occurred at 27.8 MPa axial stress, resulting in the formation of a through-going shear fracture, which is visible in the X-ray CT images of the sample obtained after the experiment (Fig. 3a). Following failure, the sample was first unloaded to near the initial stress conditions, before being deformed again at the same strain rate, to reactivate the shear fracture. Slip on the fracture triggered when the residual axial stress had reached around 13 MPa, and the sheared sample was loaded until a total relative axial shortening of around 32 mm m−1 was achieved (Fig. 2a).
Throughout testing, AE events were monitored using 14 piezoelectric transducers attached to the lateral surface and end faces of the sample (Fig. 1c; Dautriat et al., 2016). We recorded waveforms at 10 MHz sampling rate and 12-bit amplitude resolution, over durations of 409.5 µs. Figure 2b shows the P-wave velocities in the radial (at the sample mid-height) and axial directions, calculated from the P-wave travel times between opposing source-receiver pairs and the sample dimensions (accounting for sample deformation).
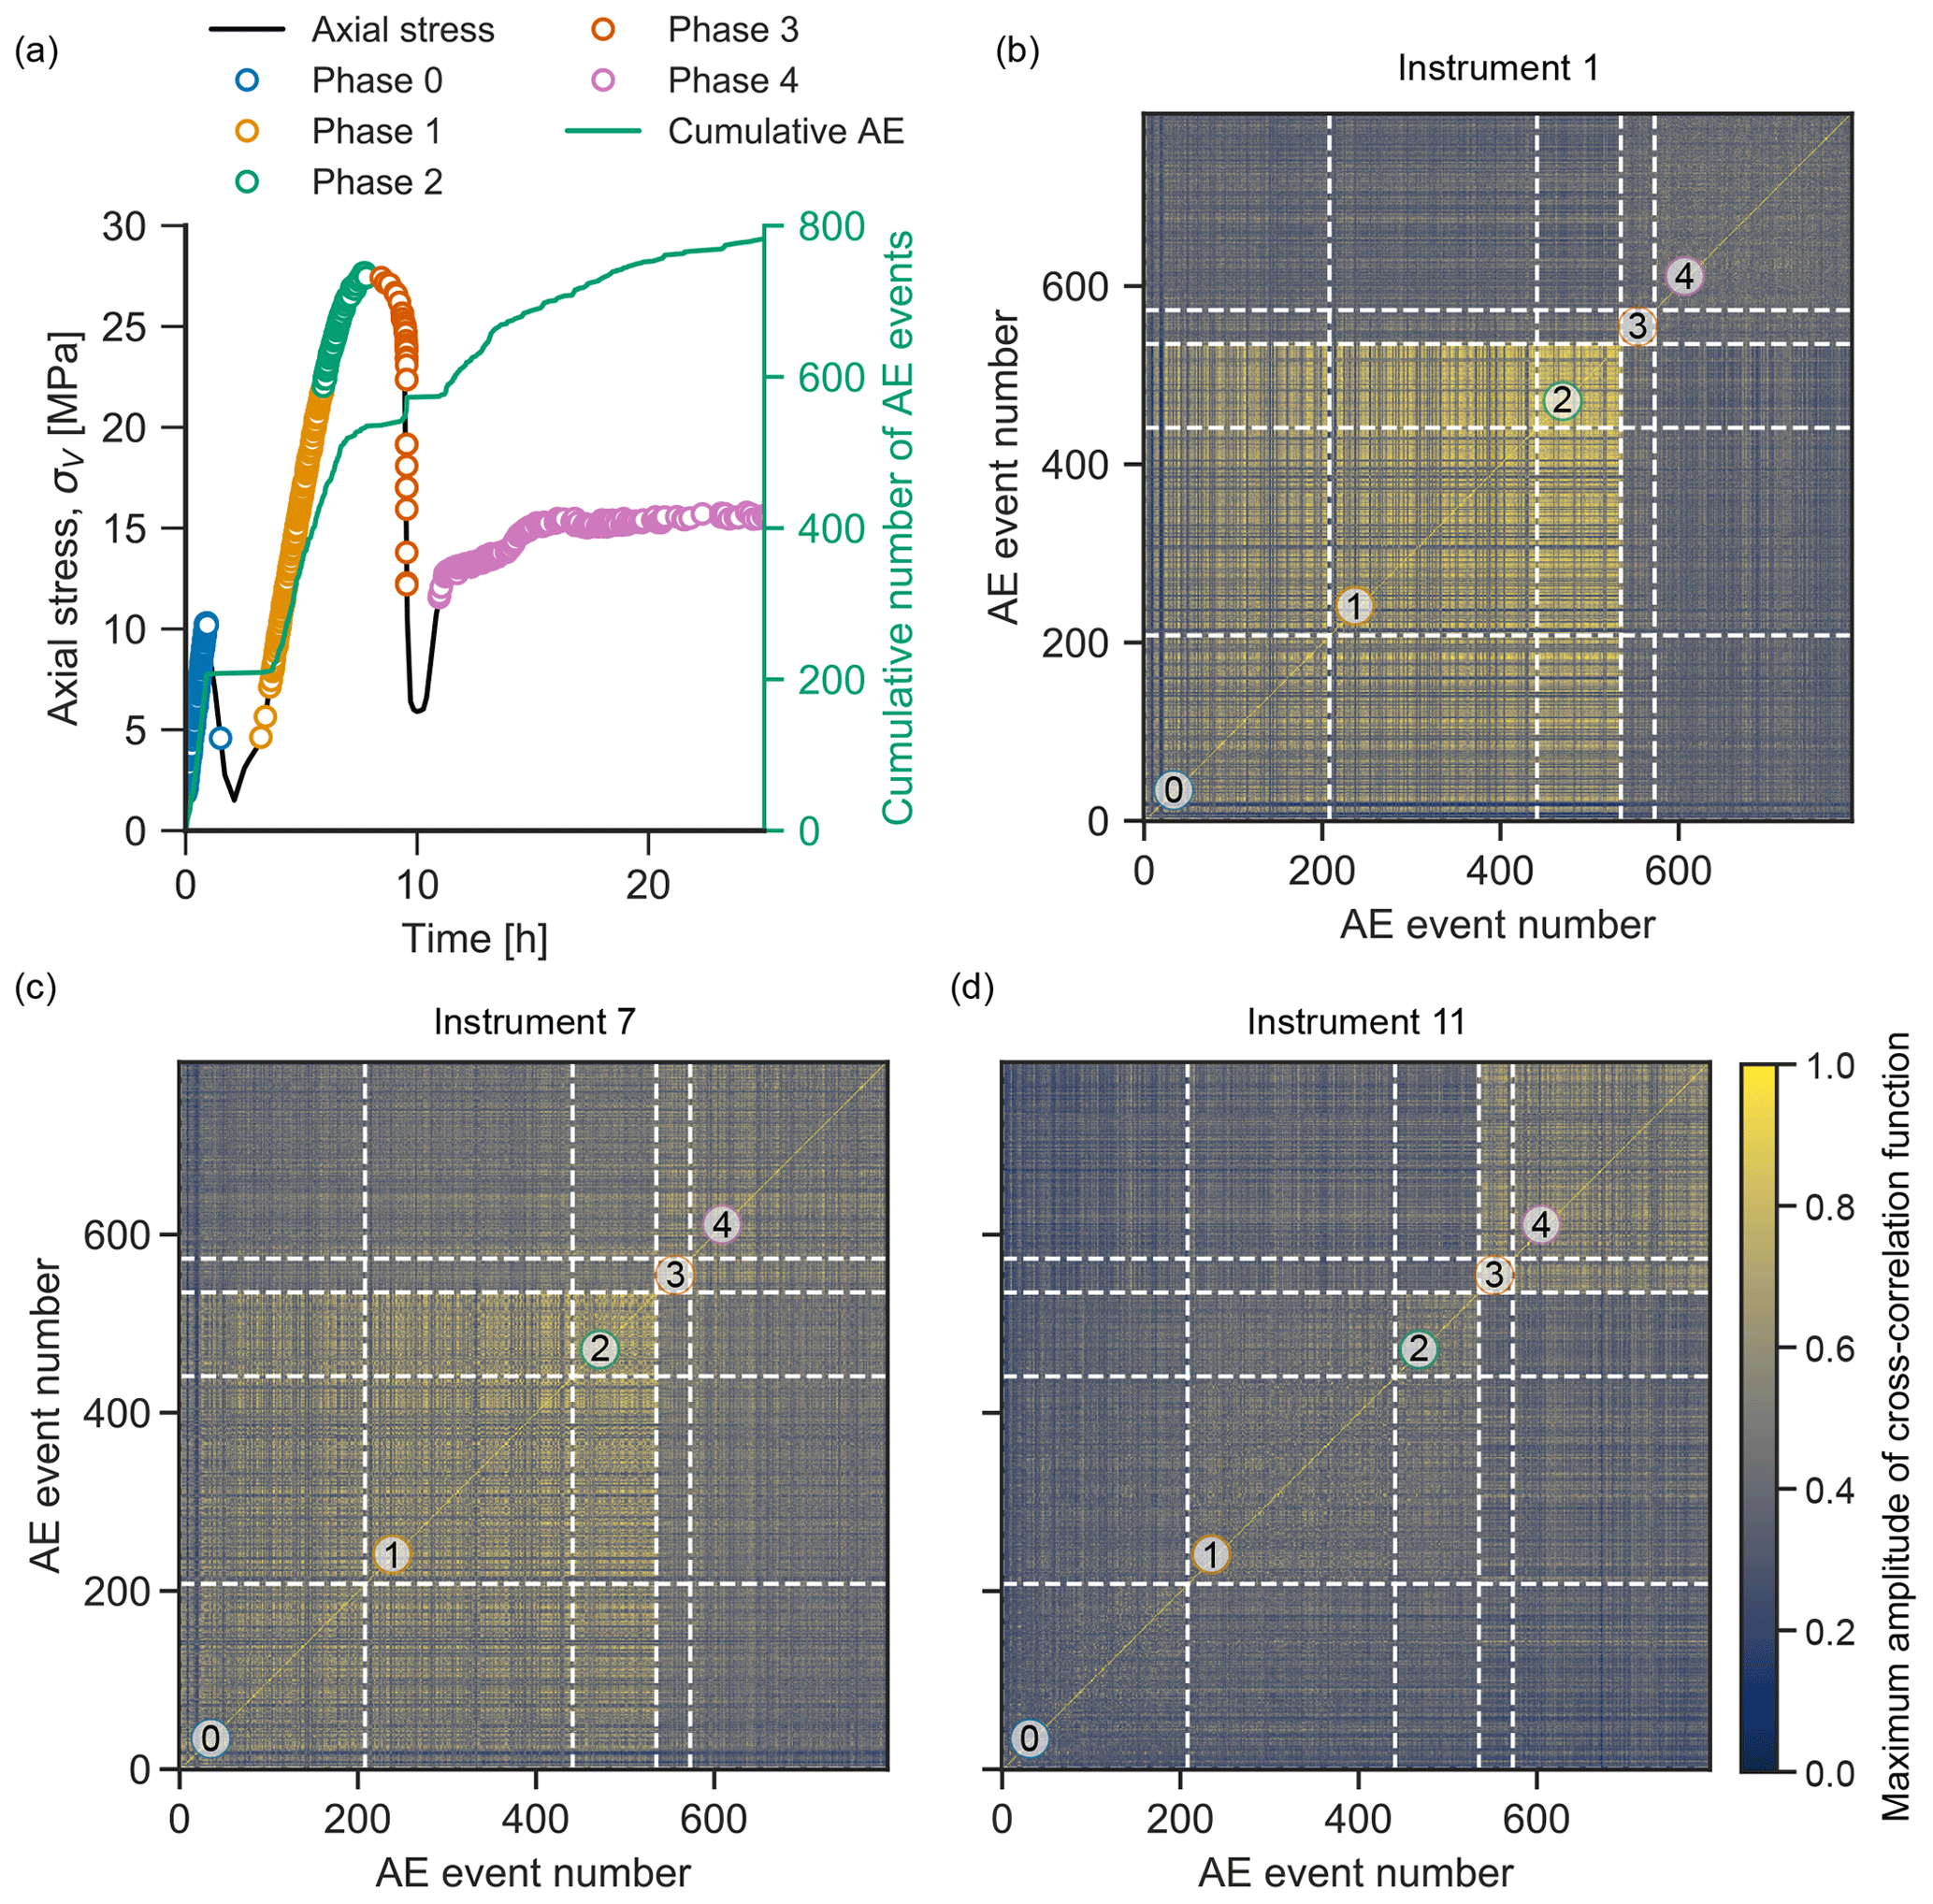
Figure 4Cross-correlation of AE waveforms. (a) A subset of 795 AE events, located along the stress-time curve and split into 5 phases. (b, c, d) Peak amplitudes of the normalised cross-correlation function between waveforms recorded at sensors 1 (b), 7 (c) and 11 (d, see Fig. 3 for sensor locations).
3.1 P-wave velocities
P-wave velocities measured in the axial and radial directions are shown in Fig. 2b. The initial velocities, measured at 0.7 MPa confining pressure and 1.4 MPa axial stress, were 1900 m s−1 in the axial direction and 1980 m s−1 in the radial direction. During loading to 10 MPa confining and axial pressure, P-wave velocities in both directions increased: to 2520 m s−1 in the axial direction and 2610 m s−1 in the radial direction. Velocities in both directions decreased during unloading, but with a hysteresis, resulting in slightly higher velocities than prior to loading (Fig. 2b). This hysteresis results from compaction of the sample, and is also observed on the axial strain in Fig. 2a.
During the axial loading, the velocities in both directions initially increased as the sample further compacted, reaching a peak in the radial direction at 10 MPa axial stress, and in the vertical direction at 25 MPa. The subsequent velocity decrease was primarily due to the formation of microcracks, oriented predominantly in the direction of axial loading (Kranz, 1983), which coincides with the orientation of the maximum principal compressive stress. Ultimately, propagation and coalescence of these microcracks lead to the nucleation and propagation of the macroscopic shear fracture, reflecting the failure of the rock. During the reactivation of this shear fracture (imposed slip), P-wave velocities were stable at around 2300 m s−1 in the axial direction, and 1650 m s−1 in the radial direction.
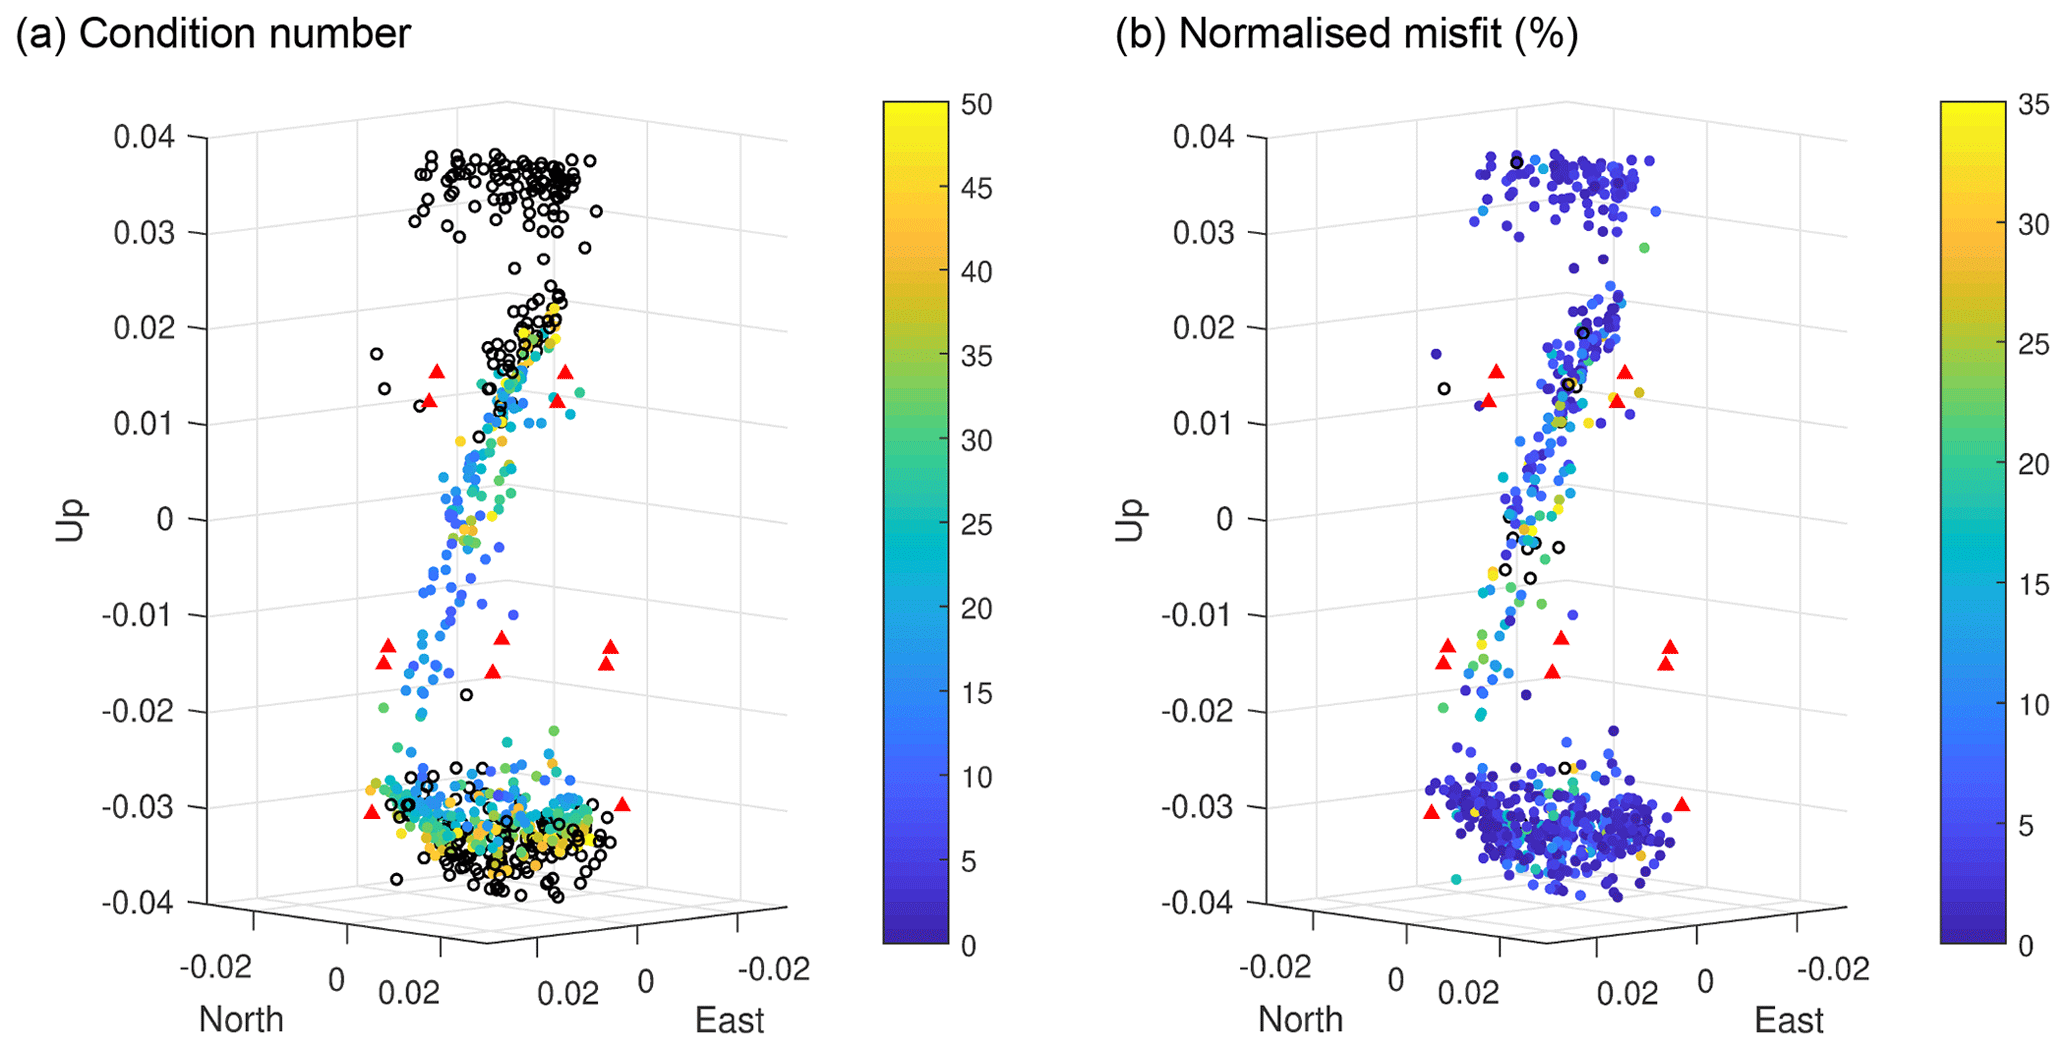
Figure 5Filtering of the 795 inferred moment tensors for biaxial decomposition, resulting in a subset of 418 events. (a) Condition number of moment tensor inversion: events with a condition number of 50 and below (in colour) were kept, and 50 and above (black circles) were excluded from further analysis. (b) Normalised misfit of moment tensor inversion: events with a misfit of 35 % and above were also excluded.
3.2 Acoustic emission monitoring
Multiple AE events were recorded during the isotropic load cycle and during the axial loading (see Fig. 2b). A subset of the detected AE events were located: 2342 events for which P-wave arrival times could be picked on at least 10 of the 14 sensors. These events were then located using a grid-search algorithm within the InSite software (Itasca; Pettitt and Young, 2007), considering a time-dependent transverse isotropic velocity model constrained by the axial and radial velocities shown in Fig. 2b. The spatio-temporal location of these events is reported in Fig. 3b. During the isotropic load cycling, multiple AE events were detected during the loading phase, but not during the unloading (Fig. 2b). Many AE events were also observed during the initial stages of axial loading, within the linear section of the stress-strain curve.
AE events that occurred during the early stages of the test – during isotropic loading and the initial shearing – are located near the sample's end faces, near the rock-platens interfaces (see Fig. 3b). We expect these events to result from localised frictional slip due to strain incompatibility at the interface between the steel platens and the rock sample ends. During shearing and reactivation of the fracture, AE events clustered near the fracture plane. A manual fit of the fault plane derived from this event cluster gave an orientation of 53∘ azimuth and 65∘ dip (azimuth is the angle from the North direction (see Fig. 1c), and the dip angle is with respect to the North–East plane). An X-ray CT image of the sample (Fig. 3a) revealed a through-going shear fracture, verifying a posteriori the inferred AE locations (Fig. 3b).
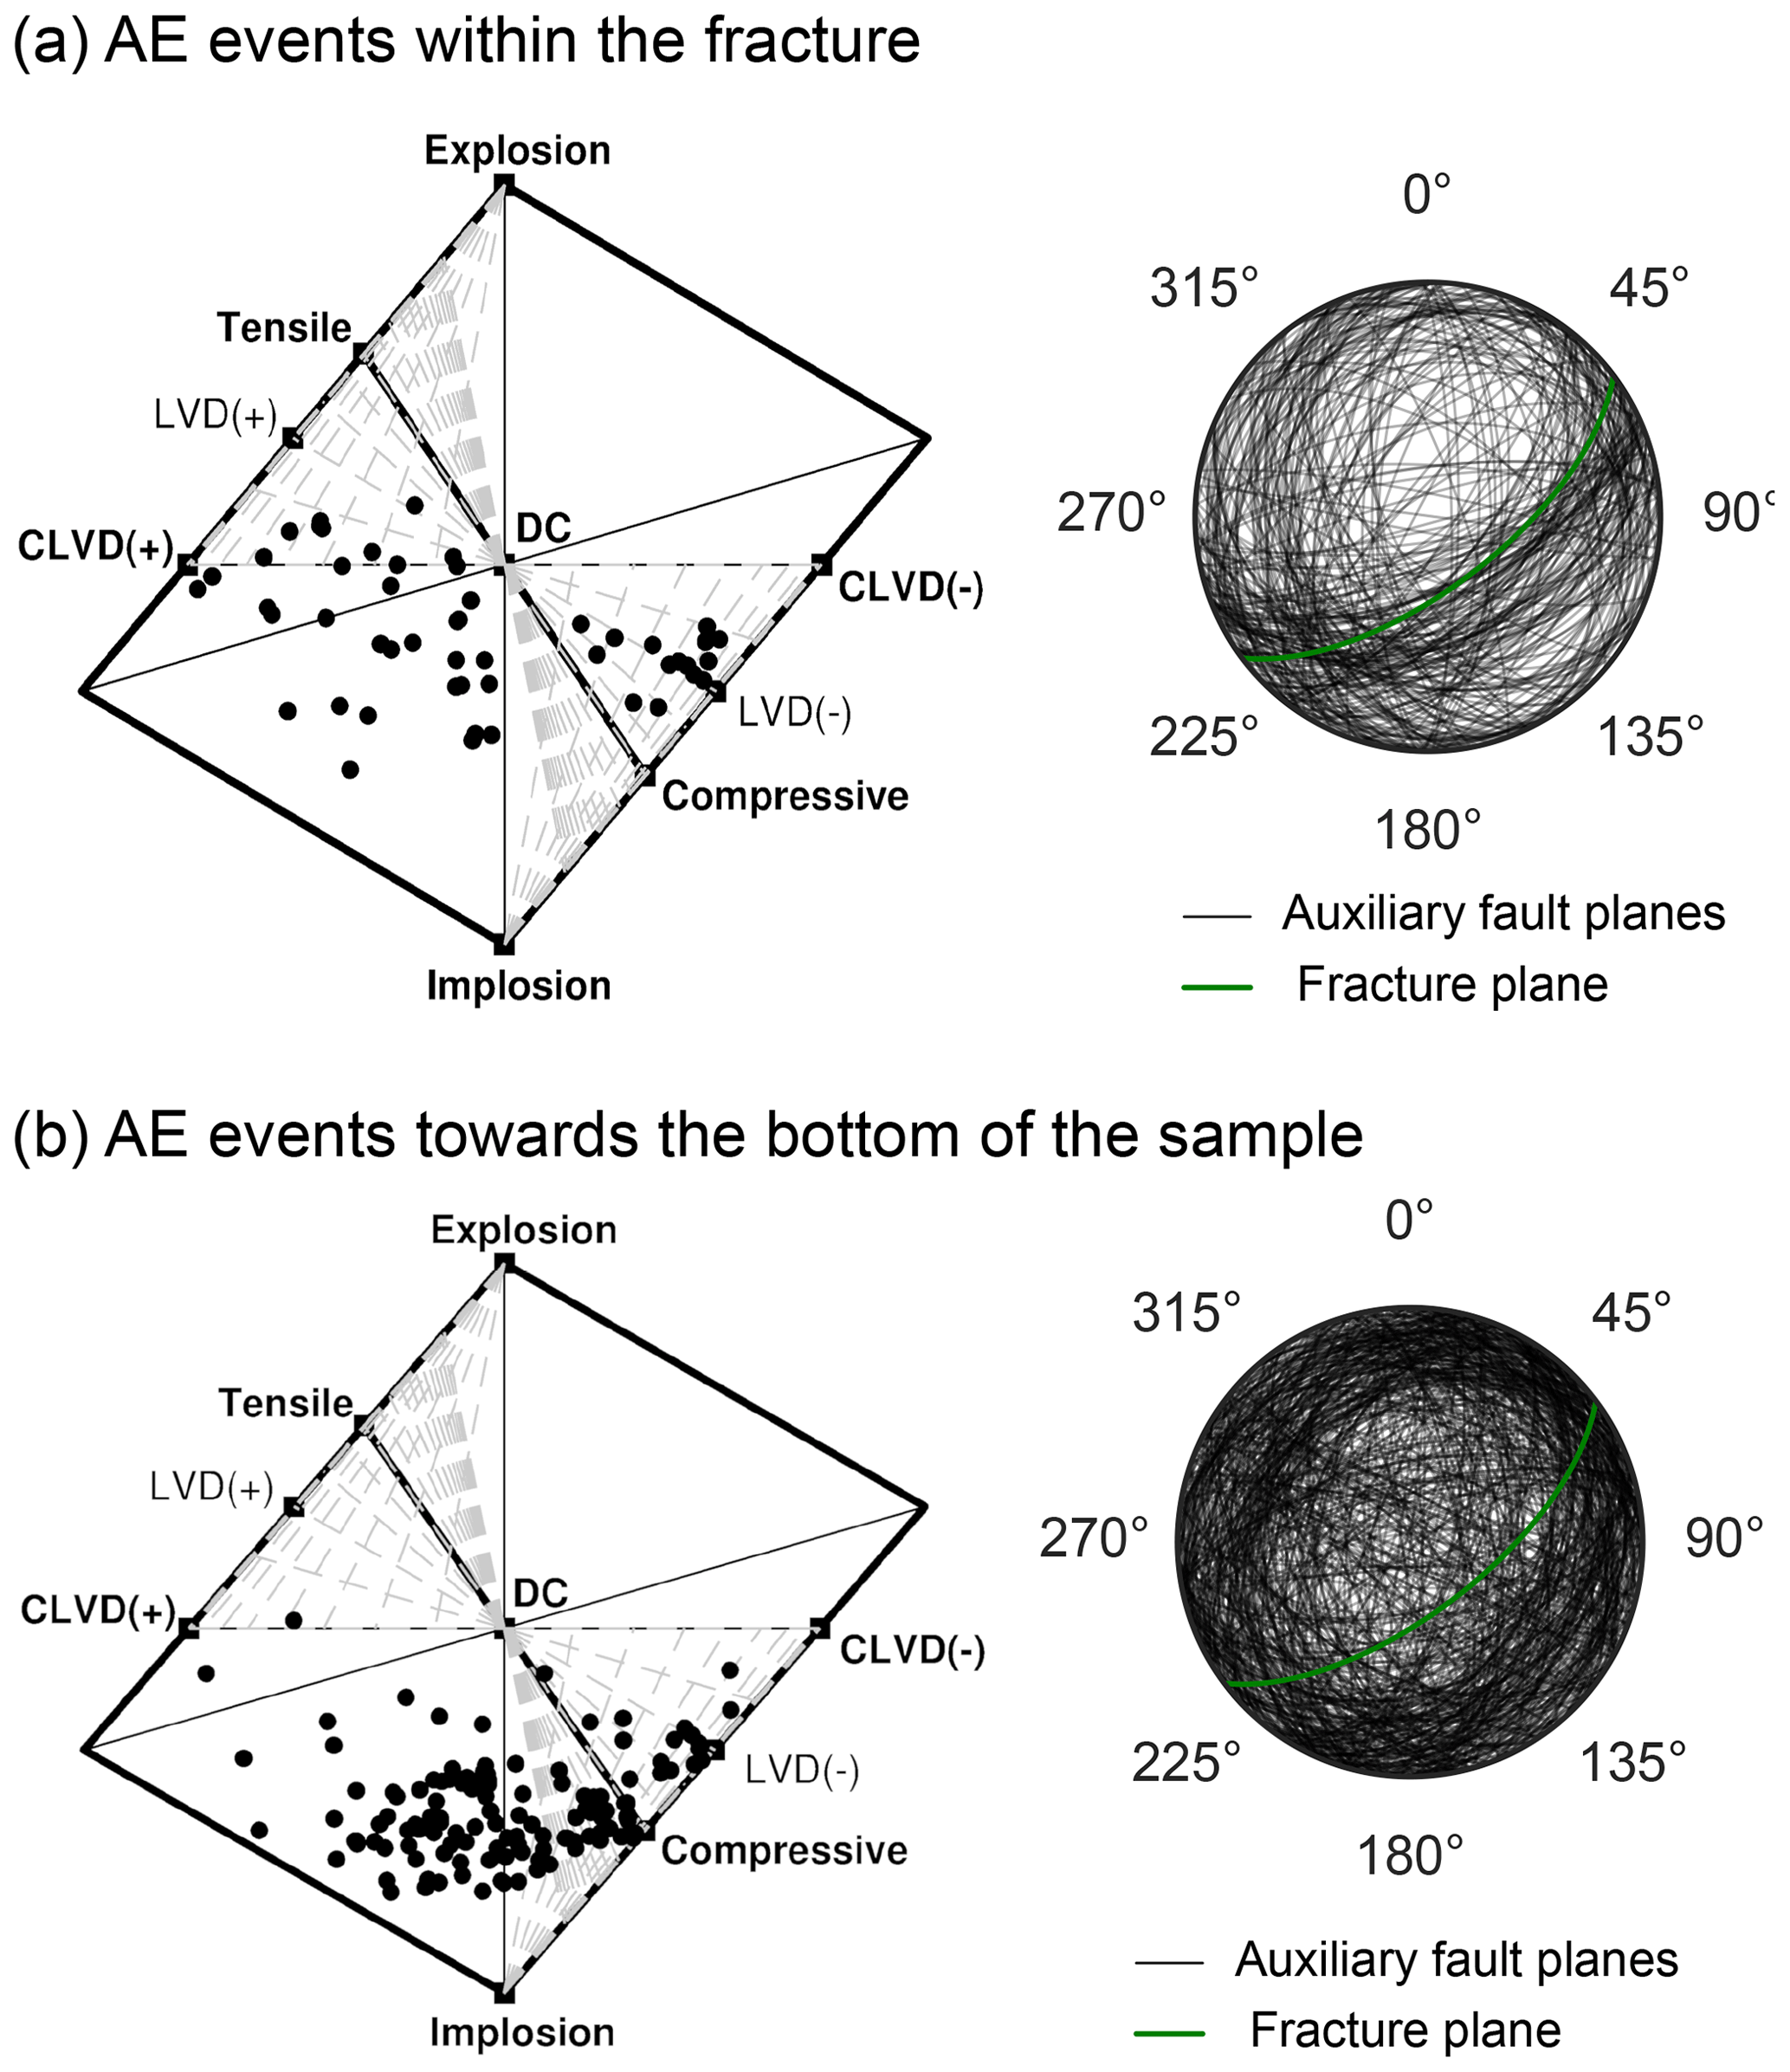
Figure 6(a) Left: Hudson plot of the decomposition of moment tensors into their isotropic (ISO), double-couple (DC), compensated linear vector dipole (CLVD) parts (see Hudson et al., 1989 and Jost and Herrmann, 1989). Right: stereographic projections of fault planes determined by the biaxial decomposition (Chapman and Leaney, 2012) of moment tensors. The green line shows the manual fit of the macroscopic fracture plane visible in Fig. 3. (b) The same results for AE events near the bottom of the sample.
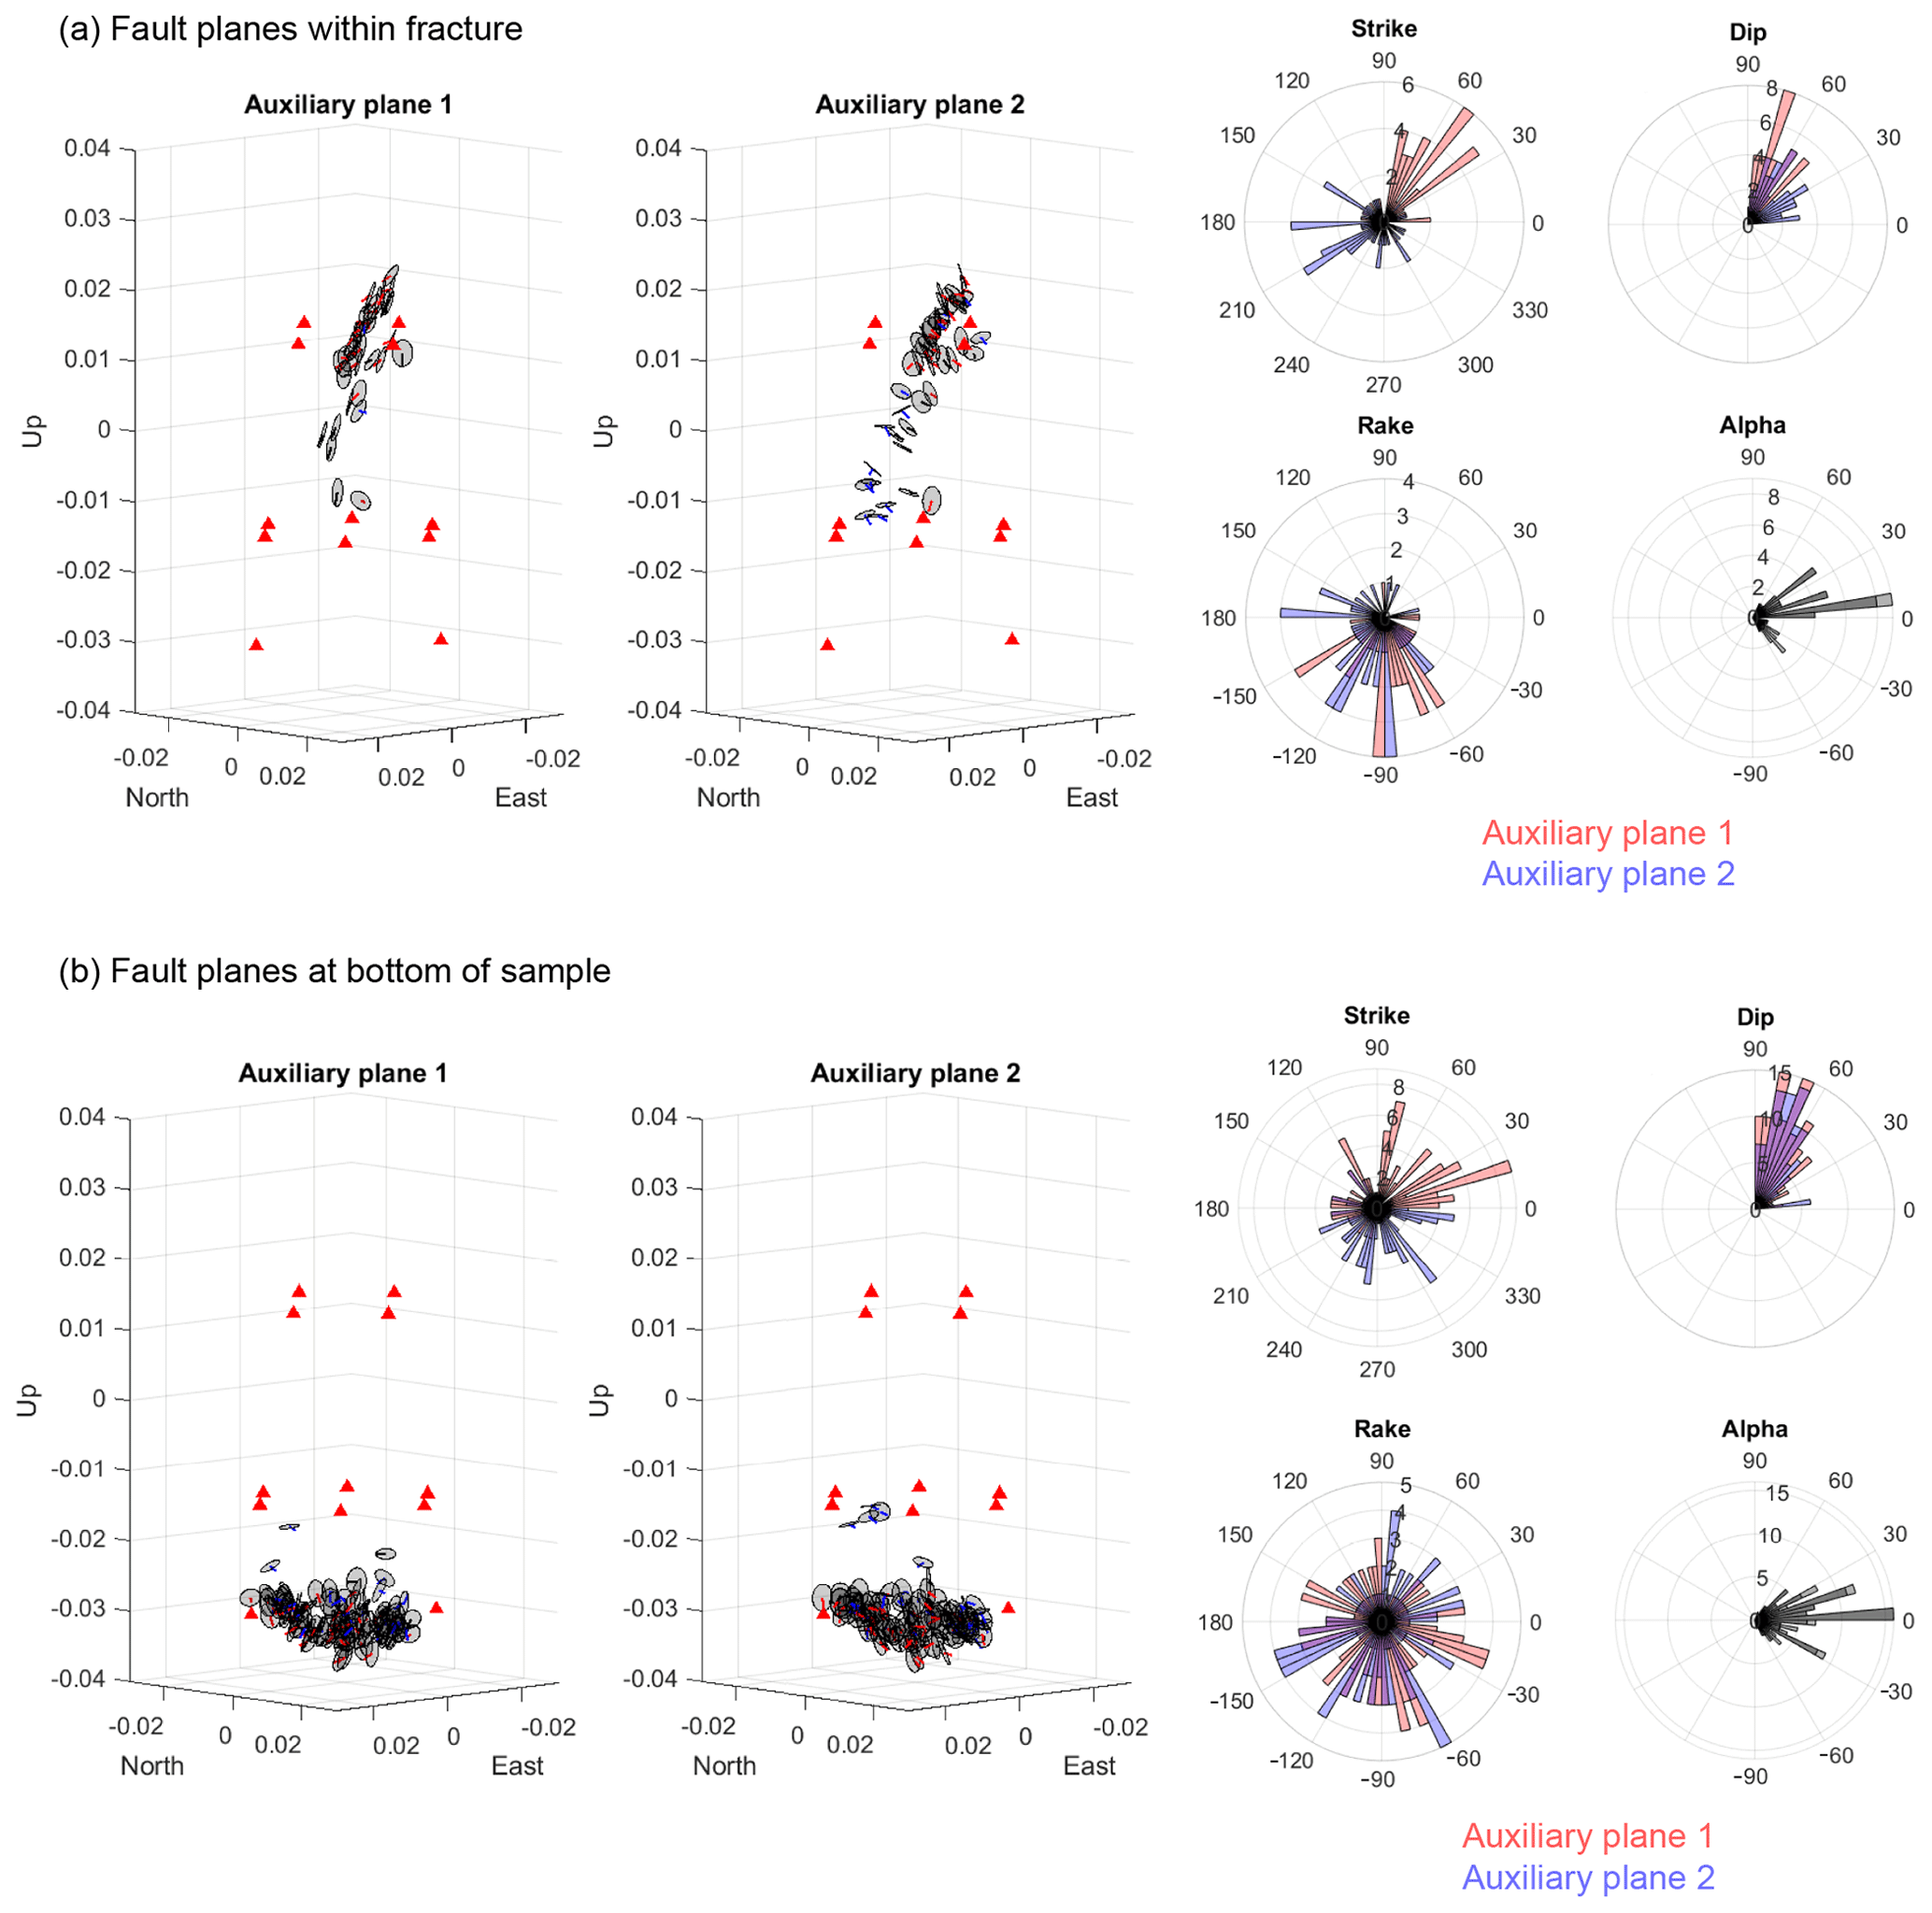
Figure 7Results of the biaxial decomposition (Chapman and Leaney, 2012) applied to the subset of 418 moment tensors. (a) Fault planes of AE events contained within the fracture, rose plots of their strike, dip, rake and alpha angle. (b) The same results for AE events near the bottom of the sample.
3.3 Cross-correlation of AE waveforms
Of the 2342 located AE events, a subset of high-quality events were selected for further analysis: 795 events with arrivals picked on at least 12 sensors and having a signal-to-noise ratio of the P-wave first-arrival greater than 40. In Fig. 4a, these events are plotted along the stress-time curve, and are divided into test phases 0–4: (0) isotropic load cycling; (1) “elastic” axial deformation; (2) pre-peak; (3) post-peak; and (4) fracture reactivation. For these events, and for each sensor, we calculated the zero-normalised cross-correlation between the recorded waveforms, given by Eq. (1):
where w1 and w2 are two AE waveforms, N is the number of samples they each contain, σ the standard deviation of a waveform, and μ is its mean. The peak amplitudes of these cross-correlation functions are shown in Fig. 4 for sensors 1, 7, and 11, in the form of a correlation matrix (see Fig. 3b for locations of these sensors). The correlation matrices show, for sensors 1 and 7, a higher correlation between the events occurring during the isotropic loading and pre-peak shearing (phases 0–2). Events which occurred post-shearing and during fracture reactivation (phases 3 and 4) are also correlated, especially for sensor 11. The observation of clustering of correlated events could suggest a change in source mechanism (as we see from the moment tensor analysis shown in the following section). This is useful for field-scale operations, where sensor coverage can be limited, as the cross-correlation technique can be used to group similar events and provide insight into their origin and nature. This technique has already been applied to microseismic monitoring of the In Salah CO2 storage site in Algeria (Oye et al., 2013), where high similarity amongst three distinct groups of waveforms were indicative of common locations, source mechanisms, and likely the same fractures.
3.4 Moment tensor inversion and biaxial decomposition
Moment tensors were inferred from the P-wave first motion amplitudes and polarities using a linear inversion method. For this purpose, the distance between each source and all sensors was calculated. The sensors lying less than 1.2 compressional wavelengths from the source were removed from the inversion to approximate far-field conditions. The threshold applied is consistent with previous analyses (e.g. Manthei, 2005 and Song and Toksöz, 2011). After a first-pass moment tensor inversion, we compared synthetics obtained from the forward modelling of the solutions against the observations. We compared the residual differences versus angle of arrival to identify systematic biases (Vera Rodriguez et al., 2017). Where necessary, these biases were corrected, and updated moment tensor solutions were finally estimated. We note that the recorded signals were not corrected by the instrument response. Therefore, while the relative amplitudes between sensors permitted us to estimate the moment tensor and relative size of events, it was not possible to calculate absolute magnitudes. For each AE, the condition number of the inversion and misfit were estimated for quality control purposes. The condition number reflects the sensitivity of the inversion to perturbations in the input data, for example, from noise. In practice, lower condition numbers are associated with more robust solutions. The misfit measures how well the inverted solution reproduces the observations. In these results, the misfit was normalized by the l2-norm of the observations, so that the values could be more conveniently represented within the approximate interval of 0 % to 100 %, with 0 % representing a perfect reproduction of the observations.
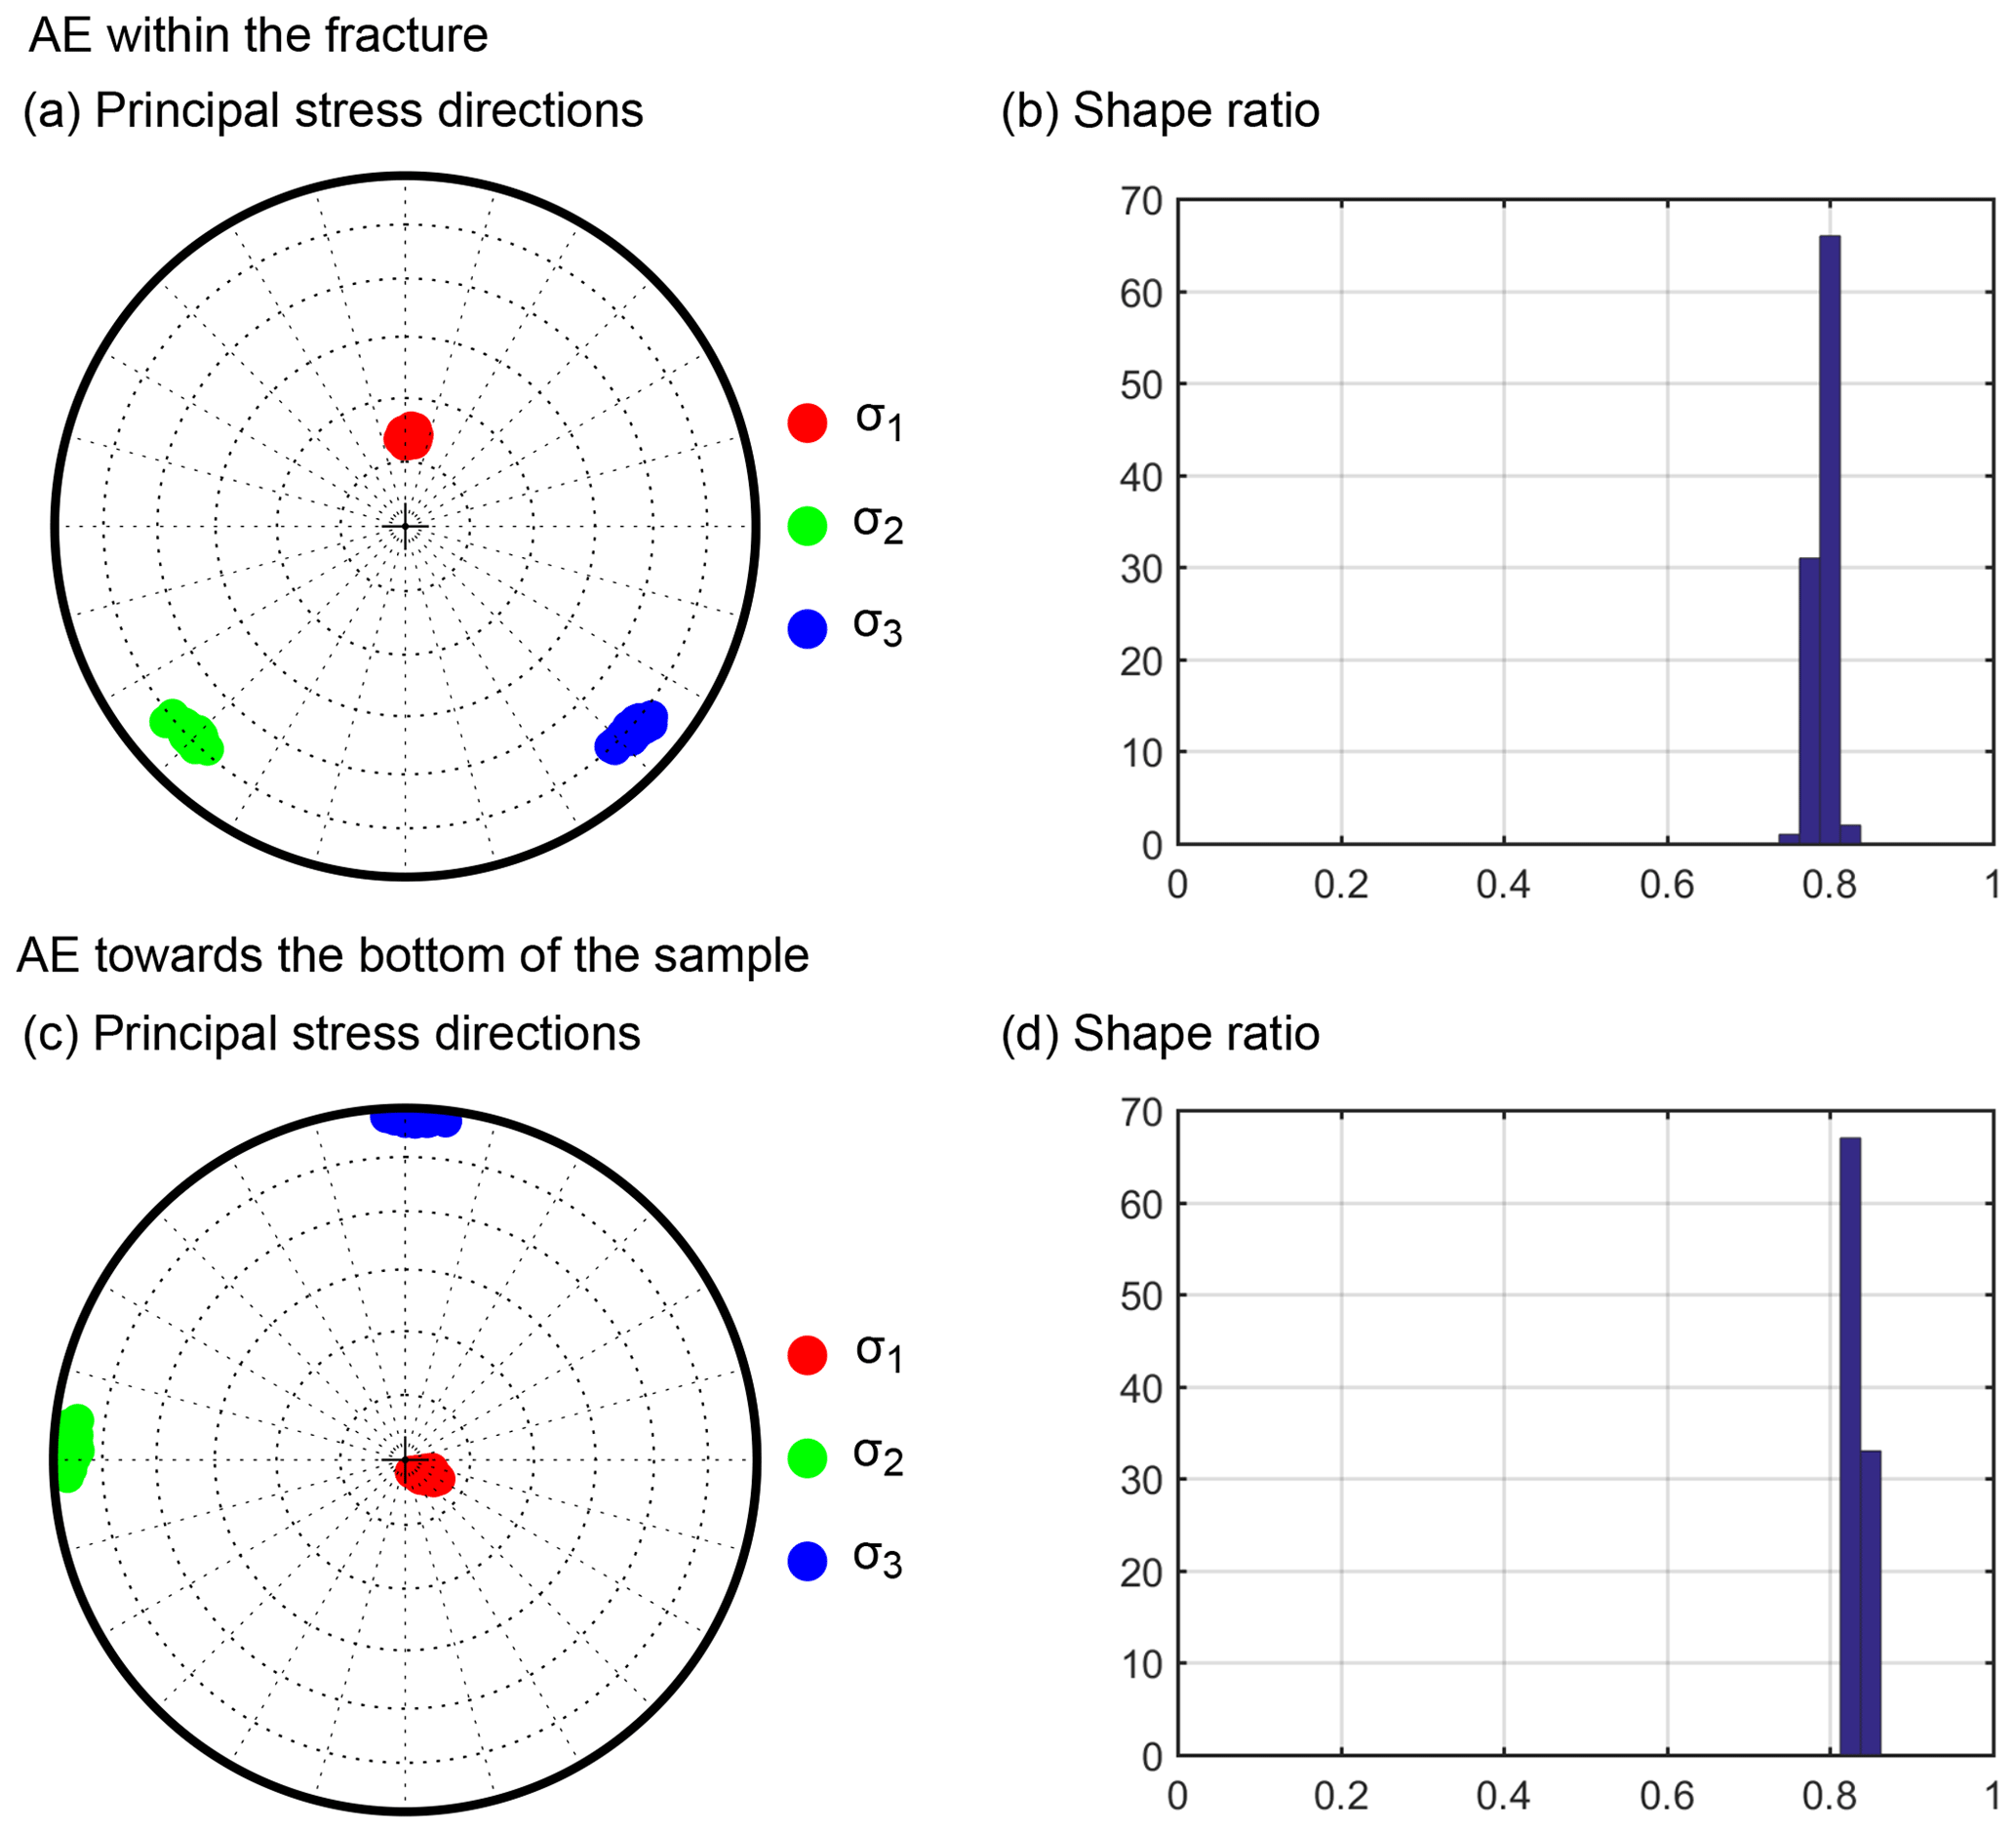
Figure 8Results of Jia et al. (2018) STESI stress inversion, a modification of the Vavryčuk (2014) method to take into account slip outside of the fault plane. To test the sensitivity of the inversion to noise, the inversion was performed on 100 “noisy” slip and normal vectors, by adding random angles with a mean deviation of 5∘. (a) Principal stress directions () and (b) shape ratio for events located within the fracture. (c) Principal stress directions and (d) shape ratio for events located at the bottom of the sample.
To interpret the moment tensors, we employed a biaxial decomposition (Chapman and Leaney, 2012), which considers a general displacement discontinuity on a fault accompanied by an isotropic pressure change. The biaxial decomposition of moment tensors provides a more relevant representation of the source mechanisms than classical decompositions into isotropic, double-couple, and compensated linear vector dipole sources (shown in Fig. 6, for reference), which do not account for wave velocity anisotropy. The fault planes determined from the biaxial decomposition of the moment tensors provide a physical representation of the source mechanisms that is consistent with the stress regime during the experiment. For this, we first filtered the moment tensor solutions, keeping a subset of 418 events with condition numbers lower than 50 and a misfit lower than 35 %. These 418 events, which occurred within the fracture and at the lower end of the sample (Fig. 5), were subjected to the biaxial decomposition.
Figure 7 shows the results of the biaxial decomposition: the fault nodal plane directions and deviation from pure double-couple (alpha angle). We see that the nodal planes of events within the macroscopic fracture plane align with its orientation (Figs. 5a and 6a). For the events located at the bottom of the sample, however, the strike of the nodal planes show no preferential orientation (Figs. 6b and 7b). For both sets of events, alpha angles may be either negative (compression) or positive (extension), but generally, are positive and low at around 30∘ or less.
3.5 Stress inversion
Stress inversion from focal mechanisms is becoming more commonly used in geo-engineering applications. For example, microseismic activity due to hydraulic fracturing (Jia et al., 2018) or mining (Chen et al., 2018) may be used to determine principal stress directions to track in situ stress changes.
Michael (1984) presented a linear inversion of the in situ principal stress directions and their relative amplitudes from the slip directions of faults. This method is limited, however, in that it is unknown which of the two nodal planes is the actual fault plane. This limitation was remedied by Vavryčuk (2014), who reported an iterative joint inversion for both the stress directions (calculated by linear inversion) and the fracture orientation (provided by a fault instability constraint). Recently, Jia et al. (2018) presented the shear-tensile earthquake stress inversion method (STESI), which is a modification of the Vavryčuk (2014) stress inversion, to account for out-of-plane slip. The STESI method is therefore well adapted to our AE events, which are not pure double-couple and exhibit significant opening angles (Fig. 7).
The strike, dip, rake, and opening angles of the best 418 AE events resulting from biaxial decomposition (Fig. 7) were input into the STESI package (Jia et al., 2018). The stress inversion was performed separately for two clusters of events: the 113 events that occurred within or near the main shear fracture, and the 287 events that occurred near the bottom of the sample. To test the sensitivity of the inversion to noise, the inversion was performed on 100 “noisy” versions of each set of slip and normal vectors, calculated by adding random angles with a mean deviation of 5∘. Figure 8 shows the inferred principal stress directions for both groups of events and the shape ratios. The shape ratio is given by , where the are the amplitudes of the principal stresses. For the shape ratio of around 0.8 observed here (Fig. 8), σ2 and σ3 are similar in amplitude. For both event clusters, the direction of principal stress (σ1) for the events within the fracture is sub-vertical, and vertical for the events in the lower half of the sample. The stress directions and relative amplitudes () are consistent with the macroscopic (far-field) stresses applied to the sample during axial loading.
We developed a workflow to characterise fracture mechanisms and in situ stresses from microseismic data, which we applied to laboratory-scale AE data acquired during the triaxial deformation of a North-Sea-reservoir-analogue sandstone. Fault planes inferred for AE events located within the main shear fracture were aligned with the direction of the macroscopic shearing, and the inferred local stress conditions show a strong similarity to the applied far-field triaxial stresses. The resulting seismological attributes and inferred local stress changes resulting from this workflow can be reliably correlated with the physical and mechanical properties of the rock observed in the laboratory. This approach may be applied to larger scale microseismicity data, showing promise for the effective microseismic monitoring of North Sea reservoirs for hydrocarbon production and CO2 storage. In such environments, microseismic data may provide valuable information on faulting mechanisms and changing stress conditions within the reservoir and overburden during hydrocarbon production and CO2 injection, resulting in safer and well-controlled operations.
Data presented in this paper are available at: https://doi.org/10.6084/m9.figshare.9758762 (Griffiths et al., 2019).
JD, JS, DND were responsible for laboratory testing. LG, IVR, KI, VO, JP, and GS were responsible for data analysis. All authors were involved in the interpretation of results and in the writing of the manuscript.
The authors declare that they have no conflict of interest.
This article is part of the special issue “European Geosciences Union General Assembly 2019, EGU Division Energy, Resources & Environment (ERE)”. It is a result of the EGU General Assembly 2019, Vienna, Austria, 7–12 April 2019.
We are very grateful to Suzie Qing Jia for generously providing the code for the Shear-Tensile Earthquake Stress Inversion Package (STESI). We also gratefully acknowledge the pivotal help of David Nguyen and Shane Kager in the preparation of the experiments at CSIRO's Geomechanics and Geophysics Laboratory. We thank reviewers Suzie Qing Jia and an anonymous reviewer for their time and effort in providing constructive comments and suggestions.
This research has been supported by the Research Council of Norway (CLIMIT, grant no. 268520/E20), as part of project IGCCS: Induced-seismicity geomechanics for controlled CO2 storage in the North Sea.
This paper was edited by Antonio Pio Rinaldi and reviewed by Suzie Qing Jia and one anonymous referee.
Aker, E., Kühn, D., Vavryčuk, V., Soldal, M., and Oye, V.: Experimental investigation of acoustic emissions and their moment tensors in rock during failure, Int. J. Rock. Mech. Min., 70, 286–295, https://doi.org/10.1016/j.ijrmms.2014.05.003, 2014.
Baud, P., Klein, E., and Wong, T.: Compaction localization in porous sandstones: spatial evolution of damage and acoustic emission activity, J. Struct. Geol., 26, 603–624, https://doi.org/10.1016/j.jsg.2003.09.002, 2004.
Chapman, C. H. and Leaney, W. S.: A new moment-tensor decomposition for seismic events in anisotropic media: Moment-tensor decomposition, Geophys. J. Int., 188, 343–370, https://doi.org/10.1111/j.1365-246X.2011.05265.x, 2012.
Chen, X., Wang, R., Huang, W., Jiang, Y., and Yin, C.: Clustering-based stress inversion from focal mechanisms in microseismic monitoring of hydrofracturing, Geophys. J. Int., 215, 1887–1899, https://doi.org/10.1093/gji/ggy388, 2018.
Dautriat, J., Sarout, J., David, C., Bertauld, D., and Macault, R.: Remote monitoring of the mechanical instability induced by fluid substitution and water weakening in the laboratory, Phys. Earth Planet In., 261, 69–87, https://doi.org/10.1016/j.pepi.2016.06.011, 2016.
Eppes, M. C., Magi, B., Hallet, B., Delmelle, E., Mackenzie-Helnwein, P., Warren, K., and Swami, S.: Deciphering the role of solar-induced thermal stresses in rock weathering, Geol. Soc. Am. Bull., 128, 1315–1338, https://doi.org/10.1130/B31422.1, 2016.
Goertz-Allmann, B. P., Kühn, D., Oye, V., Bohloli, B., and Aker, E.: Combining microseismic and geomechanical observations to interpret storage integrity at the In Salah CCS site, Geophys. J. Int., 198, 447–461, https://doi.org/10.1093/gji/ggu010, 2014.
Griffiths, L., Lengliné, O., Heap, M. J., Baud, P., and Schmittbuhl, J.: Thermal Cracking in Westerly Granite Monitored Using Direct Wave Velocity, Coda Wave Interferometry, and Acoustic Emissions, J. Geophys. Res.-Sol. Ea., 123, 2246–2261, https://doi.org/10.1002/2017JB015191, 2018.
Griffiths, L., Dautriat, J., Rodriguez, I. V., Iranpour, K., Sauvin, G., Park, J., Sarout, J., Soldal, M., Grande, L., Oye, V., Dewhurst, D. N., Mondol, N. H., and Choi, J. C.: Mechanical and microseismic data presented in: Inferring microseismic source mechanisms and in situ stresses during triaxial deformation of a North-Sea-analogue sandstone, data set, https://doi.org/10.6084/m9.figshare.9758762, 2019.
Hudson, J. A., Pearce, R. G., and Rogers, R. M.: Source type plot for inversion of the moment tensor, J. Geophys. Res., 94, 765, https://doi.org/10.1029/JB094iB01p00765, 1989.
Jia, S. Q., Eaton, D. W., and Wong, R. C.: Stress inversion of shear-tensile focal mechanisms with application to hydraulic fracture monitoring, Geophys. J. Int., 215, 546–563, https://doi.org/10.1093/gji/ggy290, 2018.
Jost, M. U. and Herrmann, R. B.: A student's guide to and review of moment tensors, Seismol. Res. Lett., 60, 37–57, 1989.
Knopoff, L. and Randall, M. J.: The compensated linear-vector dipole: A possible mechanism for deep earthquakes, J. Geophys. Res., 75, 4957–4963, https://doi.org/10.1029/JB075i026p04957, 1970.
Kranz, R. L.: Microcracks in rocks: A review, Tectonophysics, 100, 449–480, doi:10.1016/0040-1951(83)90198-1, 1983.
Kwiatek, G., Goebel, T. H. W., and Dresen, G.: Seismic moment tensor and b value variations over successive seismic cycles in laboratory stick-slip experiments, Geophys. Res. Lett., 41, 2014GL060159, https://doi.org/10.1002/2014GL060159, 2014.
Lockner, D.: The role of acoustic emission in the study of rock fracture, Int. J. Rock Mech. Min., 30, 883–899, https://doi.org/10.1016/0148-9062(93)90041-B, 1993.
Lockner, D. A., Byerlee, J. D., Kuksenko, V., Ponomarev, A., and Sidorin, A.: Quasi-static fault growth and shear fracture energy in granite, Nature, 350, 39–42, https://doi.org/10.1038/350039a0, 1991.
Manthei, G.: Characterization of Acoustic Emission Sources in a Rock Salt Specimen under Triaxial Compression, Bull. Seismol. Soc. Am., 95, 1674–1700, https://doi.org/10.1785/0120040076, 2005.
Michael, A. J.: Determination of stress from slip data: Faults and folds, J. Geophys. Res.-Sol. Ea., 89, 11517–11526, https://doi.org/10.1029/JB089iB13p11517, 1984.
Oye, V., Aker, E., Daley, T. M., Kühn, D., Bohloli, B., and Korneev, V.: Microseismic Monitoring and Interpretation of Injection Data from the in Salah CO2 Storage Site (Krechba), Algeria, Energy Procedia, 37, 4191–4198, https://doi.org/10.1016/j.egypro.2013.06.321, 2013.
Papamichos, E., Tronvoll, J., Vardoulakis, I., Labuz, J. F., Skjærstein, A., Unander, T. E., and Sulem, J.: Constitutive testing of Red Wildmoor sandstone, Mech. Cohes.-Frict. Mat., 5, 1–40, https://doi.org/10.1002/(SICI)1099-1484(200001)5:1<1::AID-CFM74>3.0.CO;2-H, 2000.
Pettitt, W. S. and Young, R. P.: InSite seismic processor–user operations manual version 2.14, Applied Seismology Consultants, Shrewsbury, UK, 2007.
Rutqvist, J.: The Geomechanics of CO2 Storage in Deep Sedimentary Formations, Geotech. Geol. Eng., 30, 525–551, https://doi.org/10.1007/s10706-011-9491-0, 2012.
Sarout, J., Le Gonidec, Y., Ougier-Simonin, A., Schubnel, A., Guéguen, Y., and Dewhurst, D. N.: Laboratory micro-seismic signature of shear faulting and fault slip in shale, Phys. Earth Planet. Int., 264, 47–62, 2017.
Song, F. and Toksöz, M. N.: Full-waveform based complete moment tensor inversion and source parameter estimation from downhole microseismic data for hydrofracture monitoring, Geophysics, 76, WC103–WC116, 2011.
Stanchits, S., Vinciguerra, S., and Dresen, G.: Ultrasonic velocities, acoustic emission characteristics and crack damage of basalt and granite, Pure Appl. Geophys., 163, 974–993, https://doi.org/10.1007/s00024-006-0059-5, 2006.
Vavryčuk, V.: Iterative joint inversion for stress and fault orientations from focal mechanisms, Geophys. J. Int., 199, 69–77, https://doi.org/10.1093/gji/ggu224, 2014.
Vera Rodriguez, I., Stanchits, S., and Burghardt, J.: Data-driven, in situ, relative sensor calibration based on waveform fitting moment tensor inversion, Rock Mech. Rock Eng., 50, 891–911, 2017.
Vera Rodriguez, I., Rutledge, J., and Stanchits, S.: The Role of Moment Tensors in the Characterization of Hydraulic Stimulations, in: Moment Tensor Solutions, Springer, Cham, 183–212, 2018.
Zang, A., Wagner, F. C., Stanchits, S., Dresen, G., Andresen, R. and Haidekker, M. A.: Source analysis of acoustic emissions in Aue granite cores under symmetric and asymmetric compressive loads, Geophys. J. Int., 135, 1113–1130, https://doi.org/10.1046/j.1365-246X.1998.00706.x, 1998.