 | 27 Jul 2018
Three-dimensional imaging from laser scanner, photogrammetric and acoustic non-destructive techniques in the characterization of stone building materials
Maria Giovanna Bianchi
Francesco Cuccuru
Silvana Fais
Paola Ligas
Concetta Ferrara
When combined, the three-dimensional imaging of different physical properties of architectural monumental structures acquired through different methodologies can highlight with efficiency the characteristics of the stone building materials. In this work, we compound high resolution Digital Color Images (DCI) and Terrestrial Laser Scanner (TLS) data for a dense 3-D reconstruction of an ancient pillar in a nineteenth century building in the town of Cagliari, Italy. The TLS technique was supported by a digital photogrammetry survey in order to obtain a natural color texturized 3-D model of the studied pillar. Geometrical anomaly maps showing interesting analogies were computed both from the 3-D model derived from the TLS application and from the high resolution 3-D model detected with the photogrammetry. Starting from the 3-D reconstruction from previous techniques, an acoustic tomography in a sector of prior interest of the investigated architectural element was planned and carried out. The ultrasonic tomography proved to be an effective tool for detecting internal decay or defects, locating the position of the anomalies and estimating their sizes, shapes, and characteristics in terms of elastic-mechanical properties. Finally, the combination of geophysical and petrographical data sets represents a powerful method for understanding the quality of the building stone materials in the shallow and inner parts of the investigated architectural structures.
- Article
(4762 KB) - Full-text XML
- BibTeX
- EndNote


In the context of the conservation of the monumental structures of the Cultural Heritage the need for three-dimensional imaging of different physical properties of architectural monumental structures has led to a significant development of multidisciplinary non-destructive diagnostic investigations. The application of various three-dimensional non-destructive techniques allows to produce data that can better visualize and detect defects in the shallow and inner parts of the building materials of the investigated architectural elements. Furthermore, thanks to the comparison of 3-D data acquired through different methodologies, it is possible to obtain all the qualitative and quantitative parameters needed to plan the recovery and preservation of a monumental structure (Costanzo et al., 2015; Fais et al., 2017, 2018; Montuori et al., 2016).
In this work we survey the pillars located inside the nineteenth century building named Exmà (Exhibiting and Moving Arts) in the historical city center of Cagliari – Italy. In the nineteenth century it hosted the municipal slaughterhouses; it has now been transformed into a cultural center home to contemporary art exhibitions. The survey has developed through the combination of high resolution Digital Color Images (DCI) and Terrestrial Laser Scanner (TLS) data for a dense 3-D reconstruction of an ancient pillar. This kind of information was effectively used as a valid complement to the ultrasonic 3-D tomographic reconstruction of the pillar.
2.1 Terrestrial Laser Scanner and photogrammetry
An integrated multi-step procedure is presented here aimed to produce high resolution 3-D models of architectural elements of ancient historical buildings with the integration of TLS and high resolution Photogrammetry (Figs. 1a, b, 2) that can be schematized in the following steps: TLS survey planning and execution, TLS data processing, Photogrammetric survey planning and execution, images gathering, alignment, registration and conversion to texturized point cloud, construction of integrated 3-D model, final computation of geometrical anomalies (Fig. 3, TLS processing with JRC-3-D Reconstructor®, and Cloud Compare, digital image processing with Agisoft Photoscan®). In particular, after an examination of the target object, the TLS survey was scheduled to search the appropriate sites to set the station points in order to obtain more scans of the same object. The survey was made with a Leica HDS-6200 long-range phase shift terrestrial laser scanner (Fig. 1a). Every station point cloud was rotated and translated with respect to every other cloud and one of them was used as an intrinsic reference system (IRS) in order to compute an aggregated 3-D cloud faithful to the real object. Each point of the cloud carries information about the position (XYZ) and the reflectance, a parameter between 0 and 1 representing the ratio between the emitted and reflected phases of the laser wave (Van Balen, 2017).
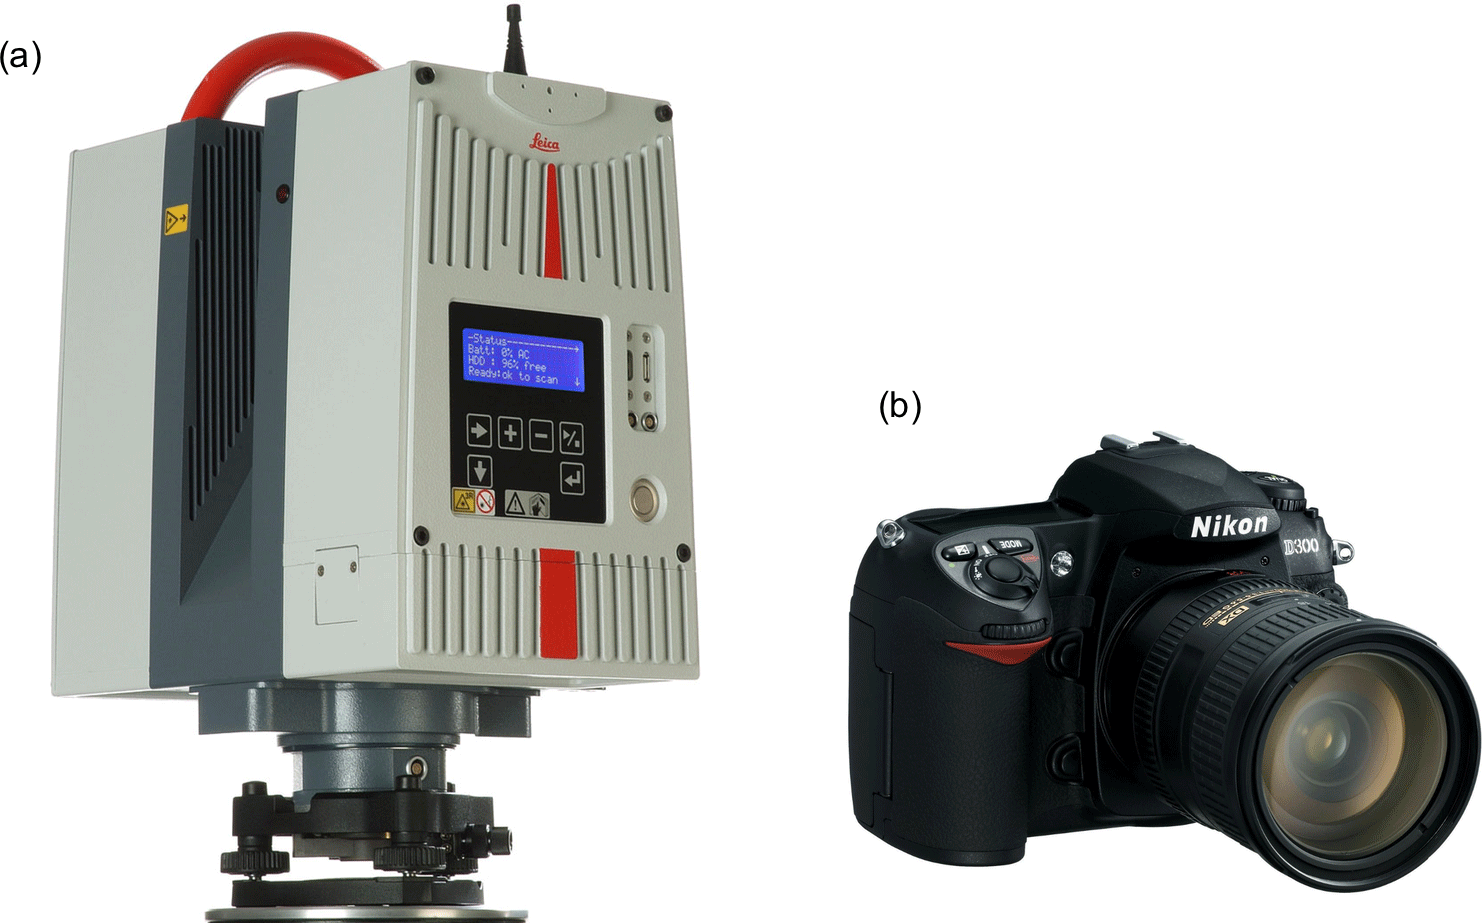
Figure 1(a) The Leica HDS-6200 TLS; (b) the digital reflex camera Nikon D300 used in this work.
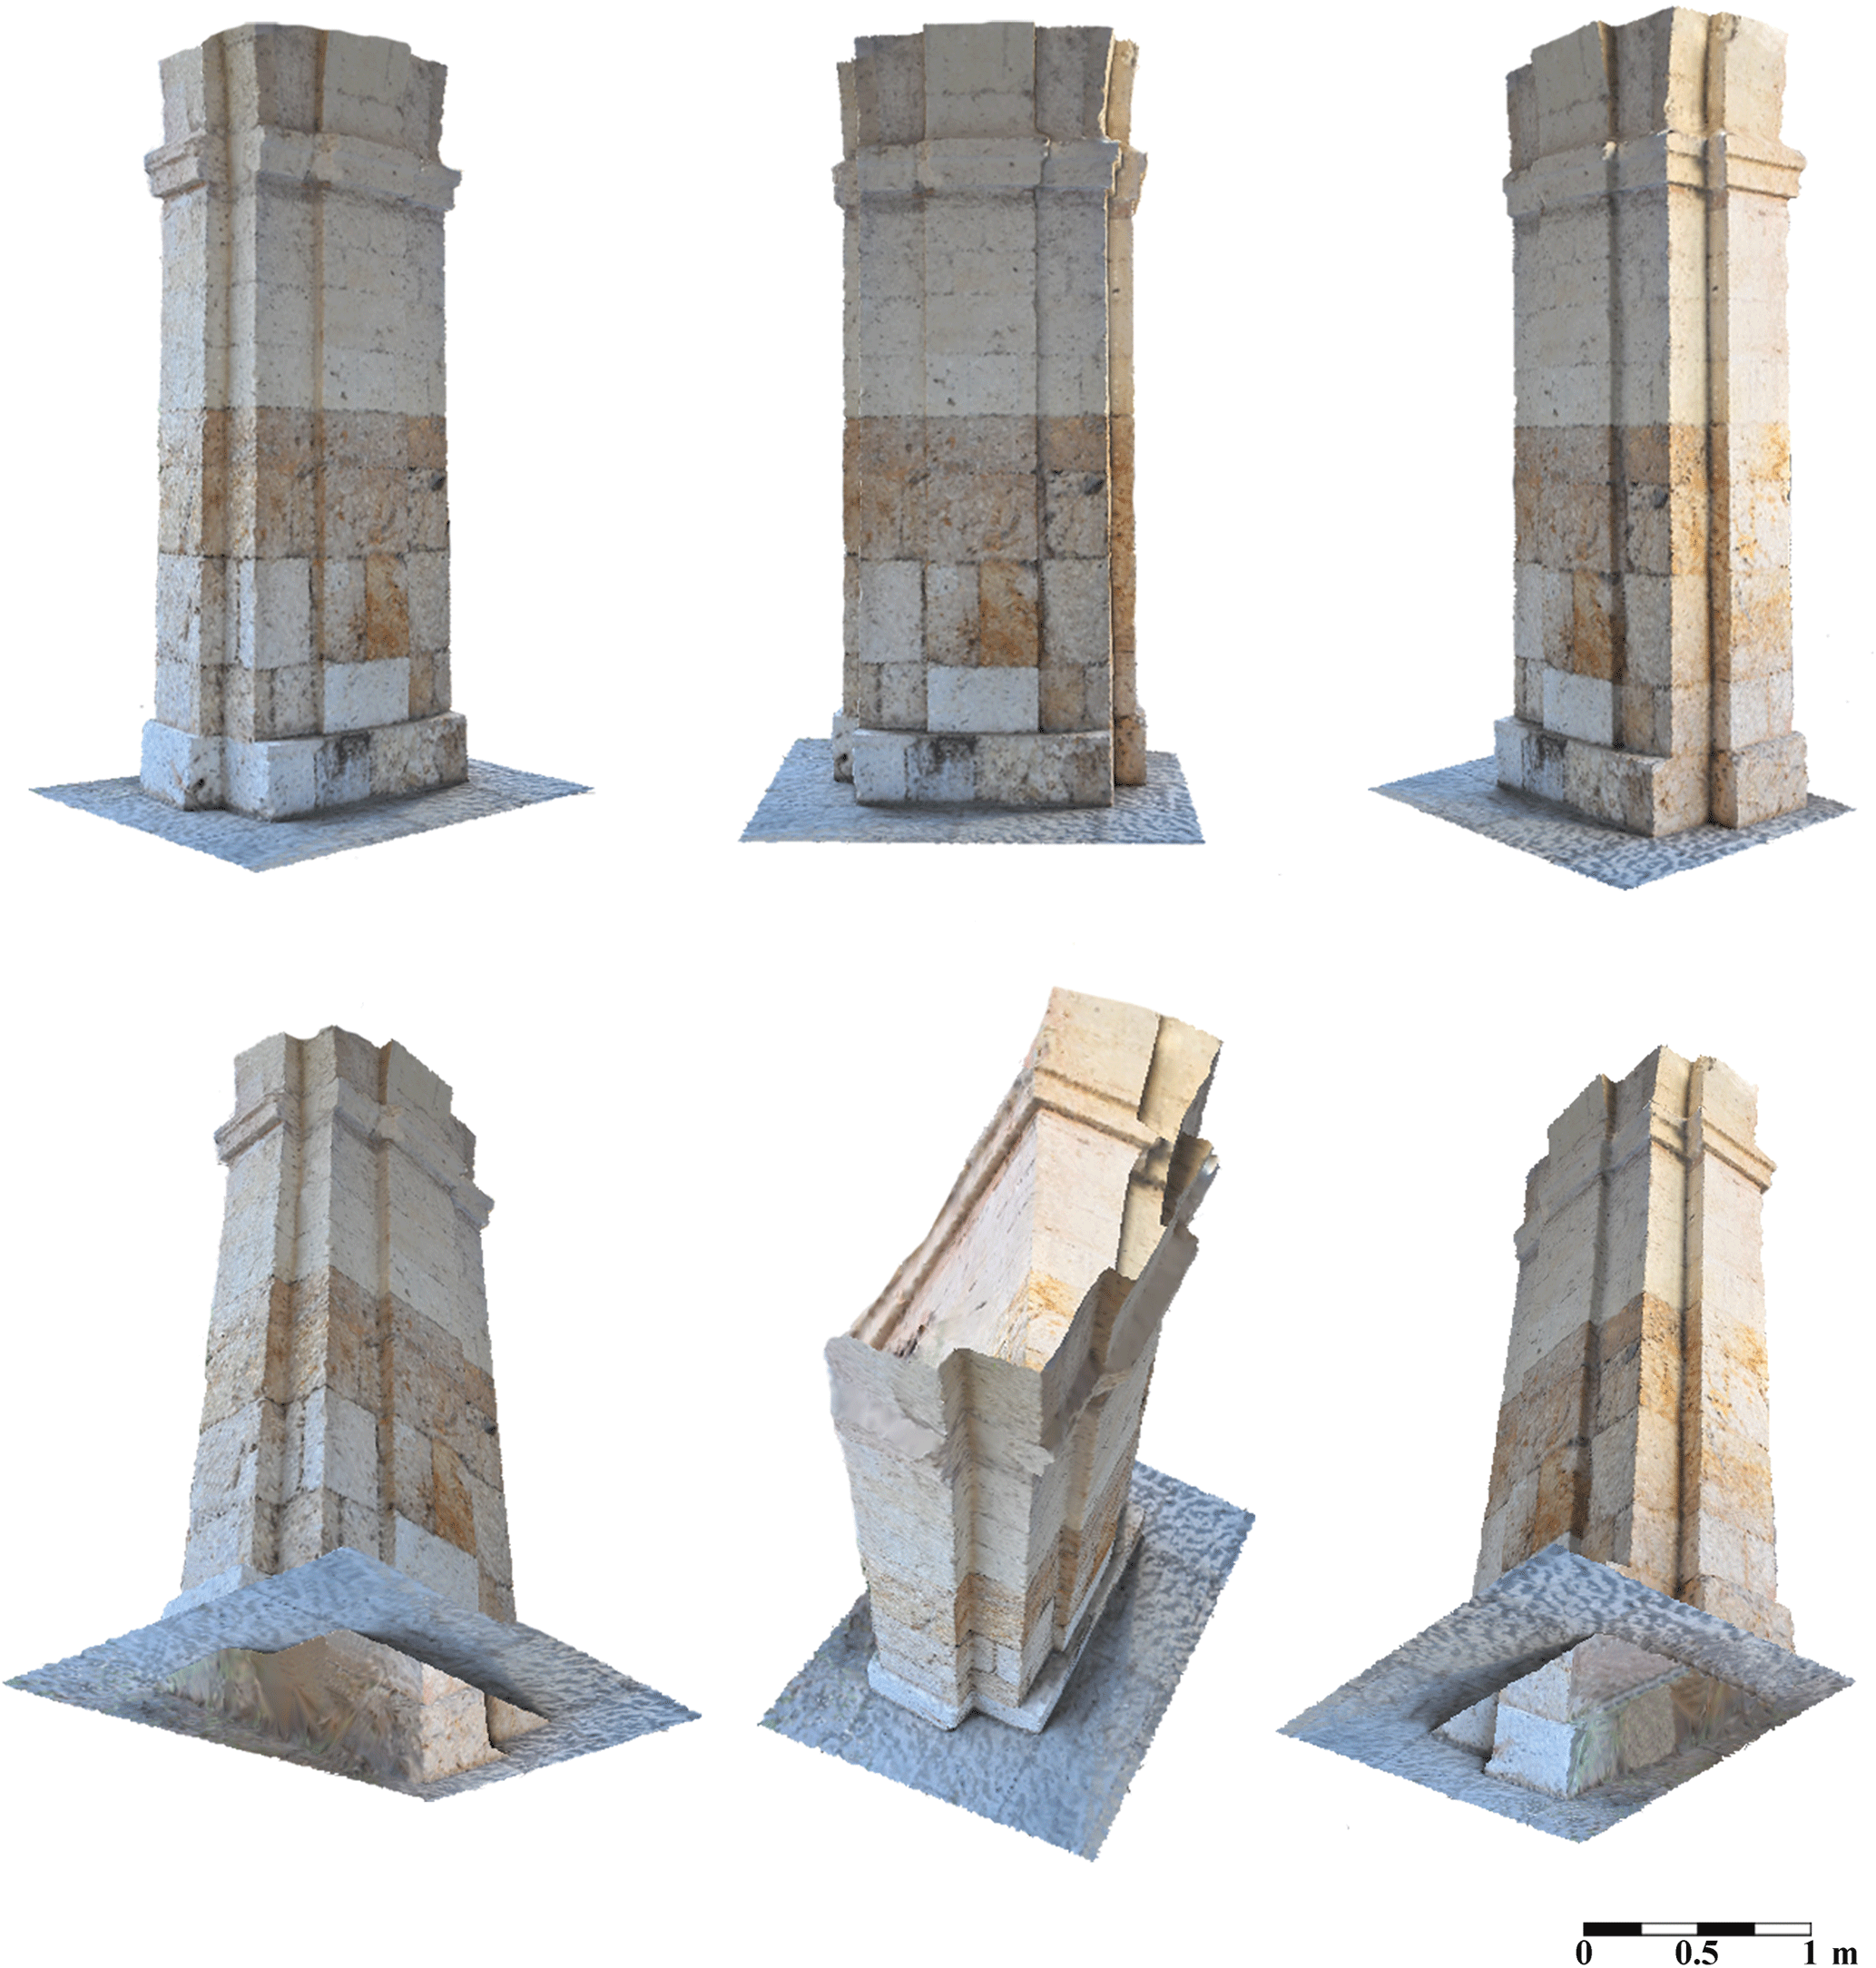
Figure 2Final high resolution color 3-D model of the investigated pillar reconstructed with the DCI photogrammetric technique: different views points of the pillar reconstructed with the DCI photogrammetric technique.
The TLS technique was supported by automatic photogrammetry in order to obtain a corresponding digital metrically correct color image of the study pillar. About 50 photos were taken by a digital reflex camera to get an almost complete 360∘ sequence of pictures to ensure a large overlap between images. The three-dimensional model was assembled combining, by a specific software, a set of 2-D high resolution color images captured on the investigated architectural element from multiple viewpoints using a digital 2-D camera (Fig. 1b). The final high resolution color 3-D model (Fig. 2) reproduces a faithful scale copy of the analyzed structure and can therefore be effectively associated with the surface geometric anomalies and the reflectivity values analyzed by the Laser Scanner technique. The flow chart of the survey is shown in Fig. 3. The point clouds elaboration process can be summarized as follows: point clouds input and format conversion, point clouds pre-processing and automatic filtering or manual editing with the elimination of data out of tolerance and unusable points, cloud to cloud draft alignment and fine registration with interactive closest point (ICP) algorithm, cloud aggregation, 3-D modeling and computation of morphological maps, output in dxf format suitable for input on AutoCAD®.
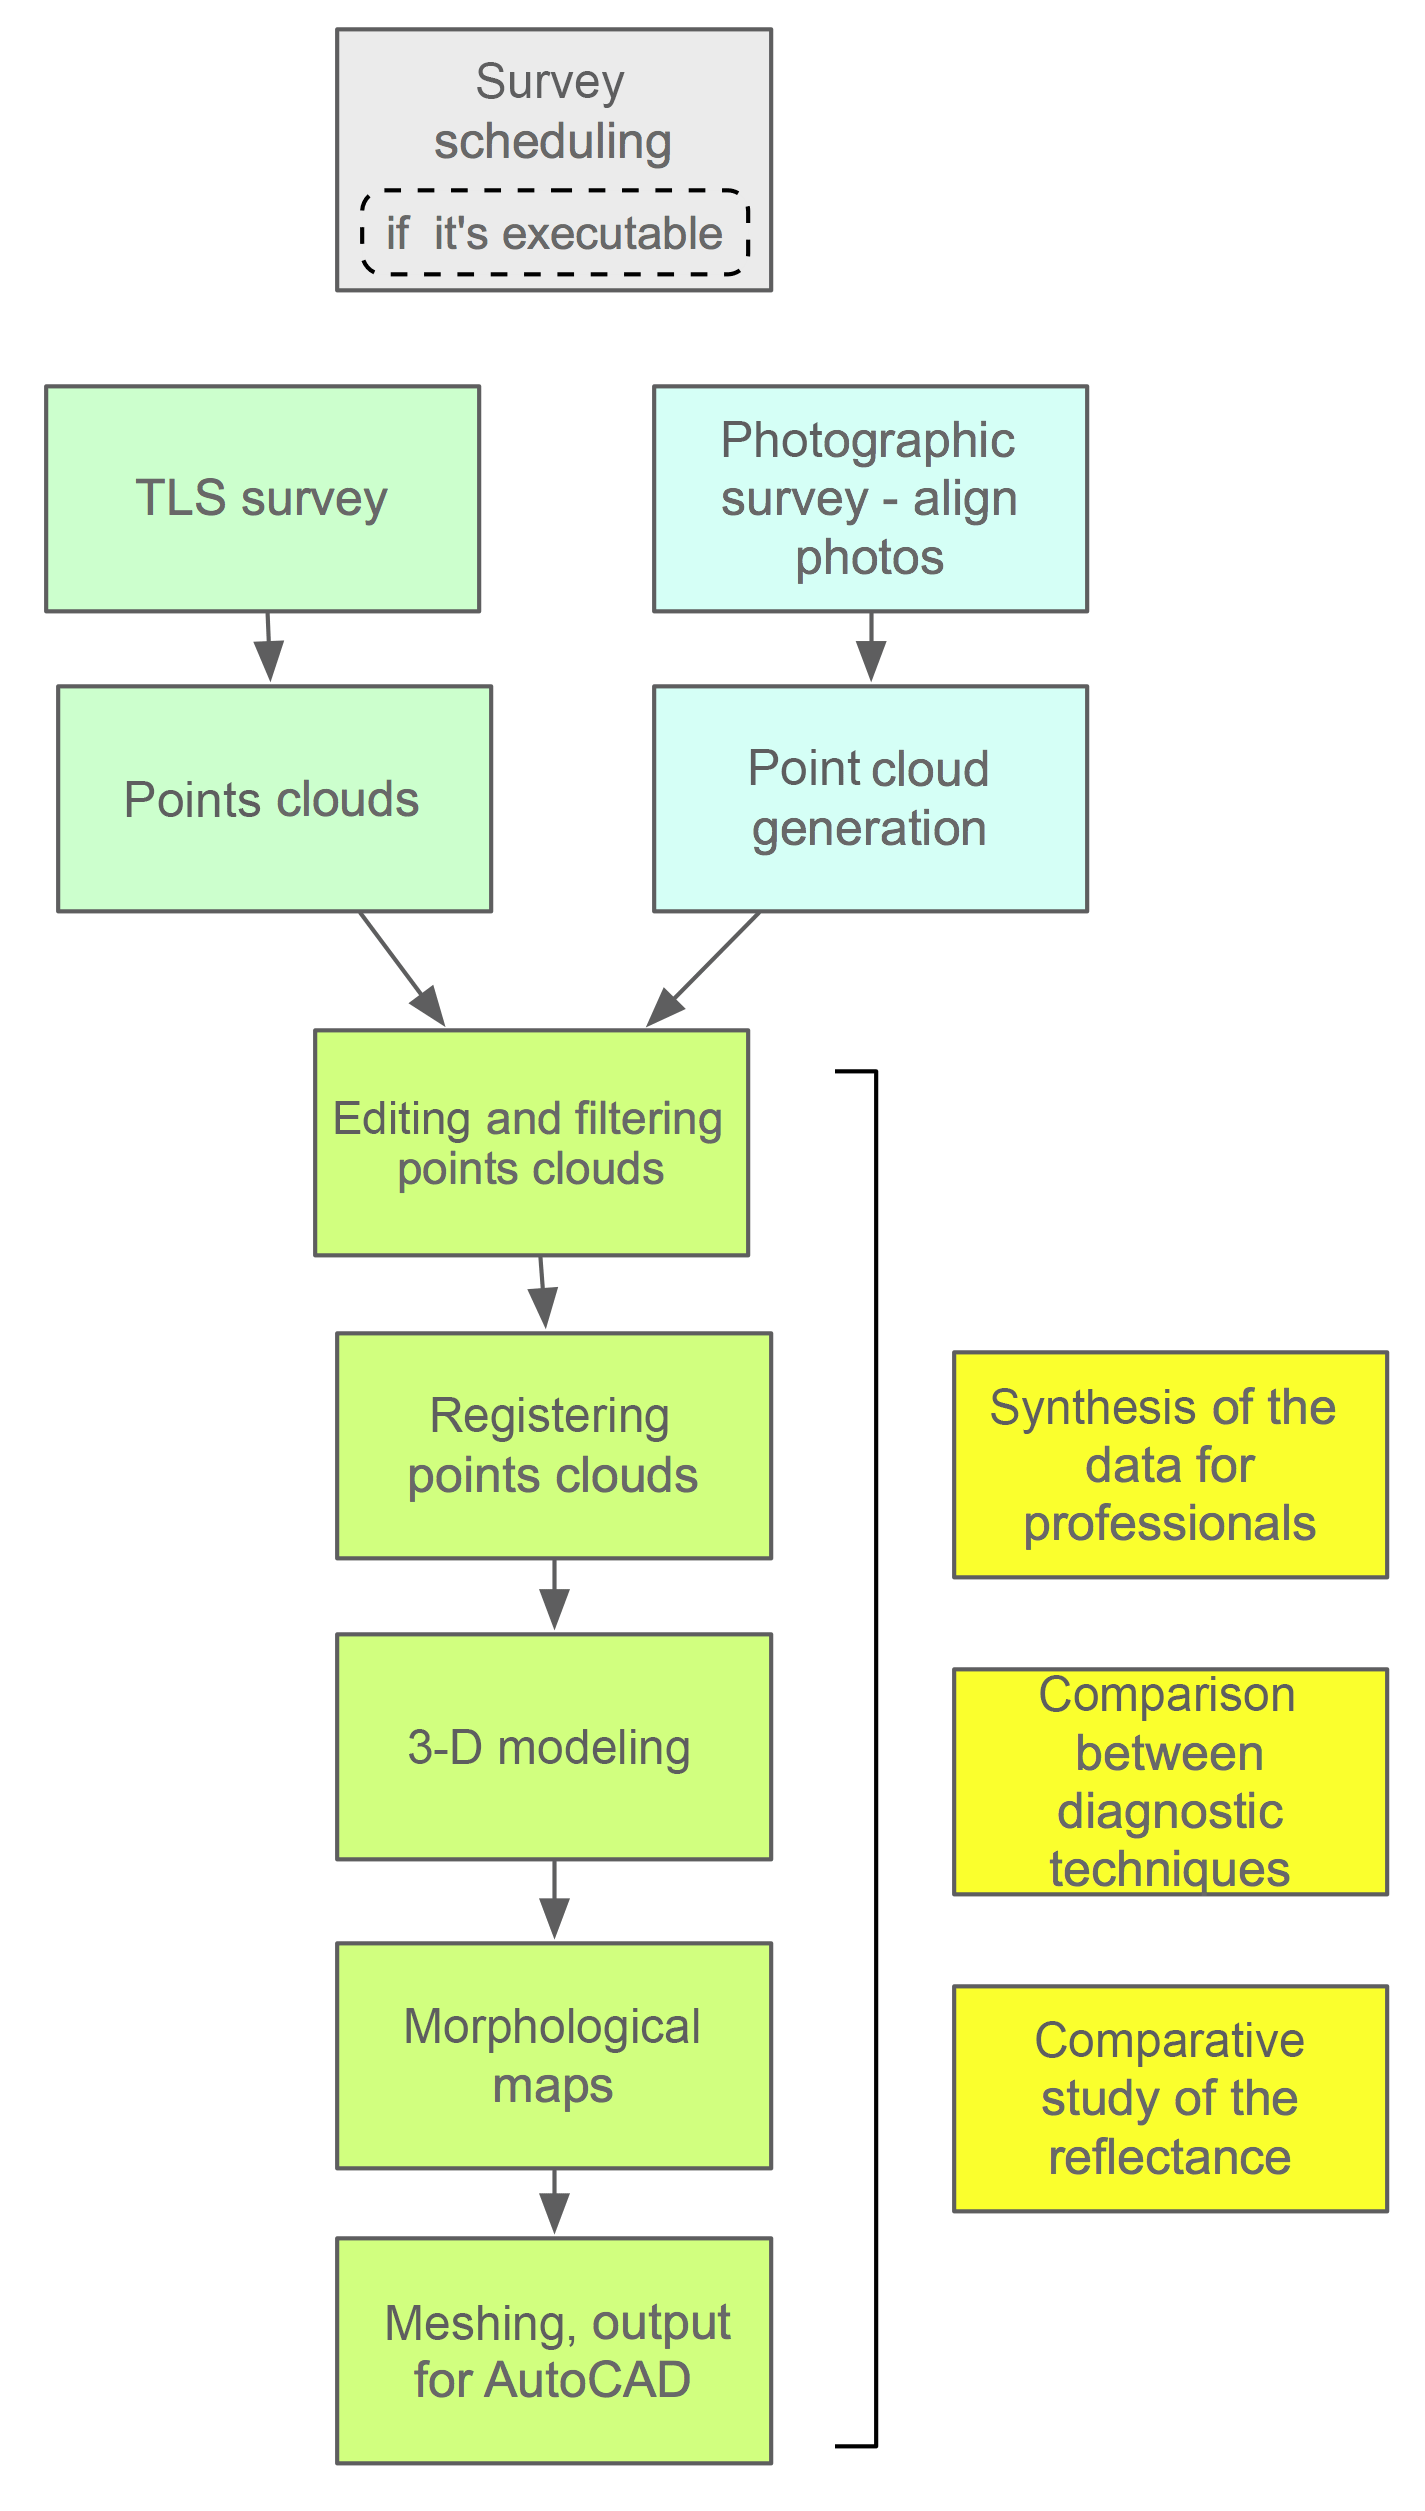
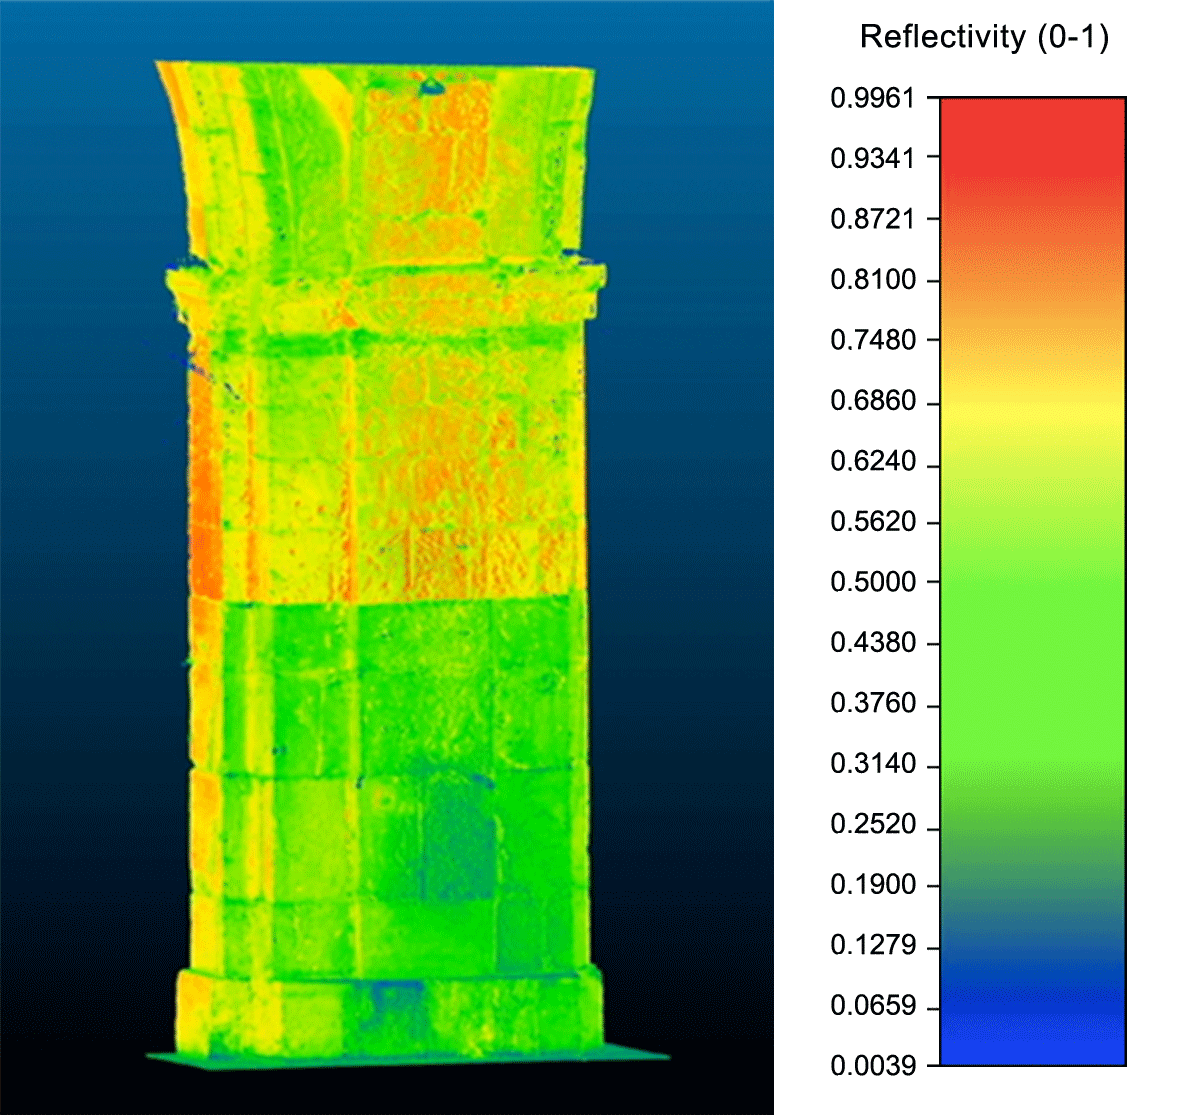
Figure 4Reflectivity map of the pillar from TLS survey (elaborated with CloudCompare). The pillar was built with different stone materials: lower part with Pietra Forte, upper part with Pietra Cantone.
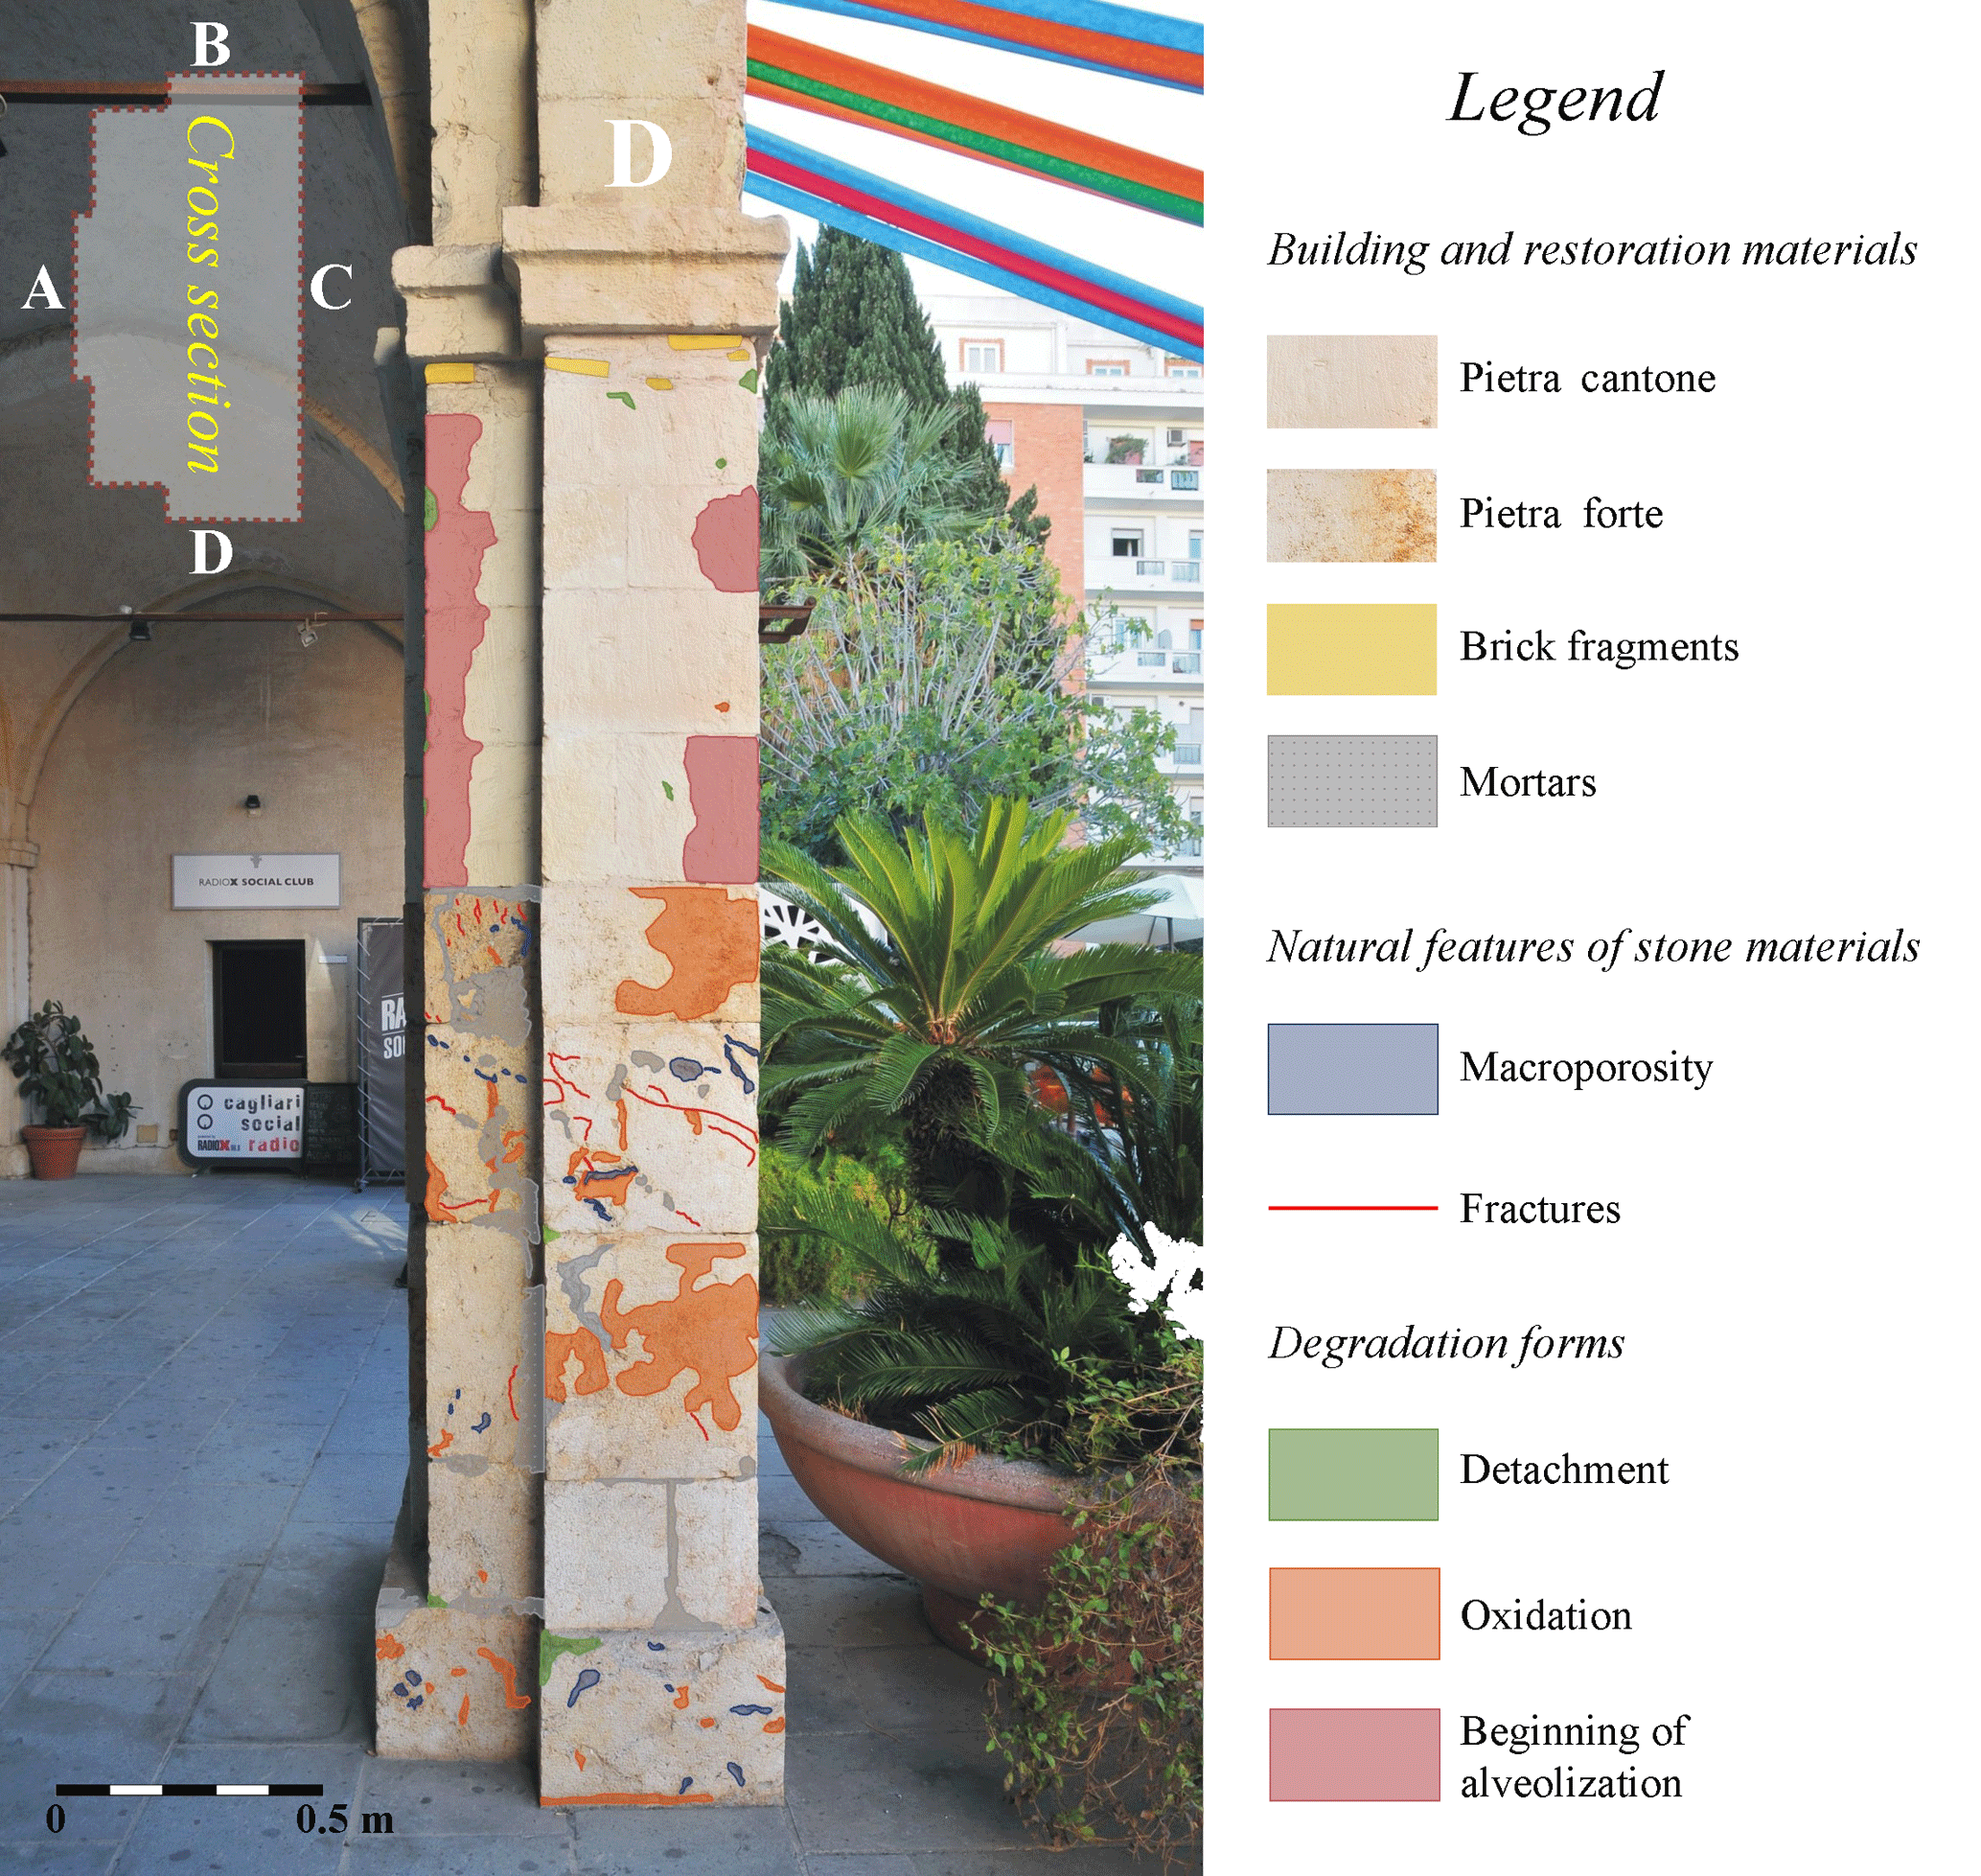
Figure 5Map of the characteristics of the shallow building materials in one of the investigated faces of the pillar.
The aggregated filtered and unstructured point clouds (3-D models) of the pillar obtained with photogrammetry and TLS methodologies were post-processed in order to compare the surface texturized with the reflectivity and the RGB (Red, Green, Blue) colors and the difference of the position of the pixels detected with the two techniques. In fact, the reflectivity map of an object provides preliminary information on construction materials, because different surfaces display different colours (Fig. 4).
In the TLS elaboration, we applied the INSPECTION module of software JRC 3-D Reconstructor® suitably implemented to compute the geometrical anomalies of the aggregated point cloud as residuals with respect to a best fitted plane geometrical models adopted as reference.
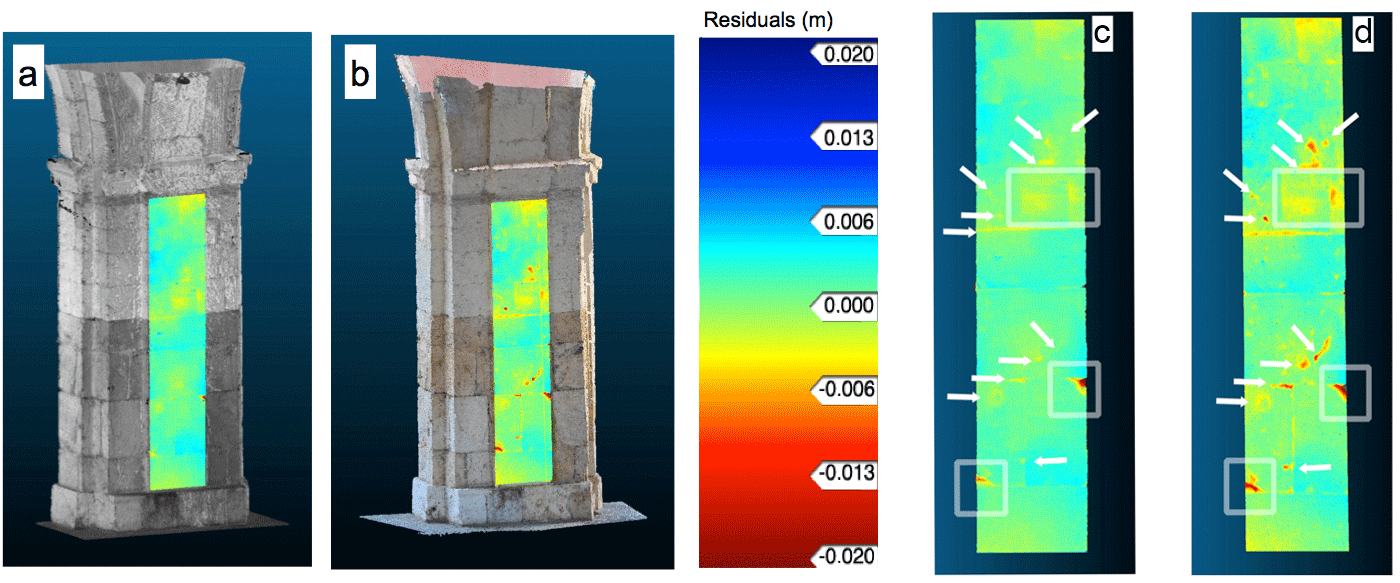
Figure 6Geometrical anomalies of the columns: the colors represent the residuals in meters inferred by the geometrical anomalies of the aggregated point cloud with respect to a fitted plane. Left side of the figure: (a) from TLS survey (b) from DCI photogrammetric survey. Right side of the figure: (c) geometrical anomalies only by TLS survey; (d) overlapping of the TLS survey and the DCI photogrammetric survey. The similarities are highlighted by the white arrows and the box, the anomalies are more perceivable thanks to the overlapping of the two techniques. This result indicates that the combination of the different methodologies can improve the detection of defective parts (JRC 3-D Reconstructor®, CloudCompare).
2.2 Ultrasonic measurements
A careful analysis of the textural characteristics of the complex carbonate materials used as building materials of the ancient monuments in the historical center of Cagliari is necessary to understand and interpret the acoustic behaviour of these materials and also to provide the best criteria for understanding their alteration processes. These carbonate rocks belong to the “Calcari di Cagliari Auct.” Miocenic Formation characterized by three transition facies, called from top to bottom: Pietra Forte, Tramezzario and Pietra Cantone (Cuccuru et al., 2014; Fais et al., 2017). An accurate microscopic examination of petrographic thin sections and scanning electron microscope (SEM) analysis of the carbonate materials was carried out in order to identify their textural characteristics and especially the nature and distribution of their porosity.
The pillar under study is made mainly from Pietra Forte and Pietra Cantone and subordinately from isolated fragments of bricks and different types of mortars used both to fill the joints and as restoration material (Fig. 5). The above carbonate materials are subject to different degradation and alteration forms, such as alveolization and pulverization in Pietra Cantone and oxidation in Pietra Forte. In the latter natural defects such as fractures and macroporosity are also present (Fig. 5).
In the lower part of the pillar the ashlars are made of Pietra Forte, a very tenacious and compact organogenic limestone, classified as boundstone according Dunham (1962), with porosity of about 1 %–4 % (Cuccuru et al., 2014). In its upper part, the pillar is made of ashlars of Pietra Cantone, a bioclastic mudstone or wackestone (Duhnam, 1962), with a porosity up to about 25 % (Cuccuru et al., 2014). The mud supported texture and high pore content make Pietra Cantone hygroscopic and subject to serious forms of degradation.
Starting from our knowledge of the textural characteristics of the investigated carbonate materials and from the 3-D reconstruction with previous techniques (TLS and photogrammetry), a 3-D ultrasonic tomography in a sector of great interest of the pillar was planned and carried out. The test on the pillar was designed to determine the size and location of internal potential defects, to detect cracks, and cavities which may be empty or filled with materials with different density or other physical-mechanical properties compared to the surrounding materials.
Ultrasonic measurements were carried out according to the ISRM (1978) and using a portable Ultrasonic Non-Destructive Digital Indicating Tester (PUNDIT Lab plus) device (Proceq-Switzerland) coupled to an oscilloscope (Fluke 96B) for the acquisition of the digital signals to be displayed and processed. The transducers were piezoelectric with a frequency of 54 kHz. The silicone snug sheets were used as the best coupling agent (Concu and Fais, 2003). Four measurements were performed at each transducer position. Therefore, the mean of measurements was computed not considering values with a deviation higher than 4 %.
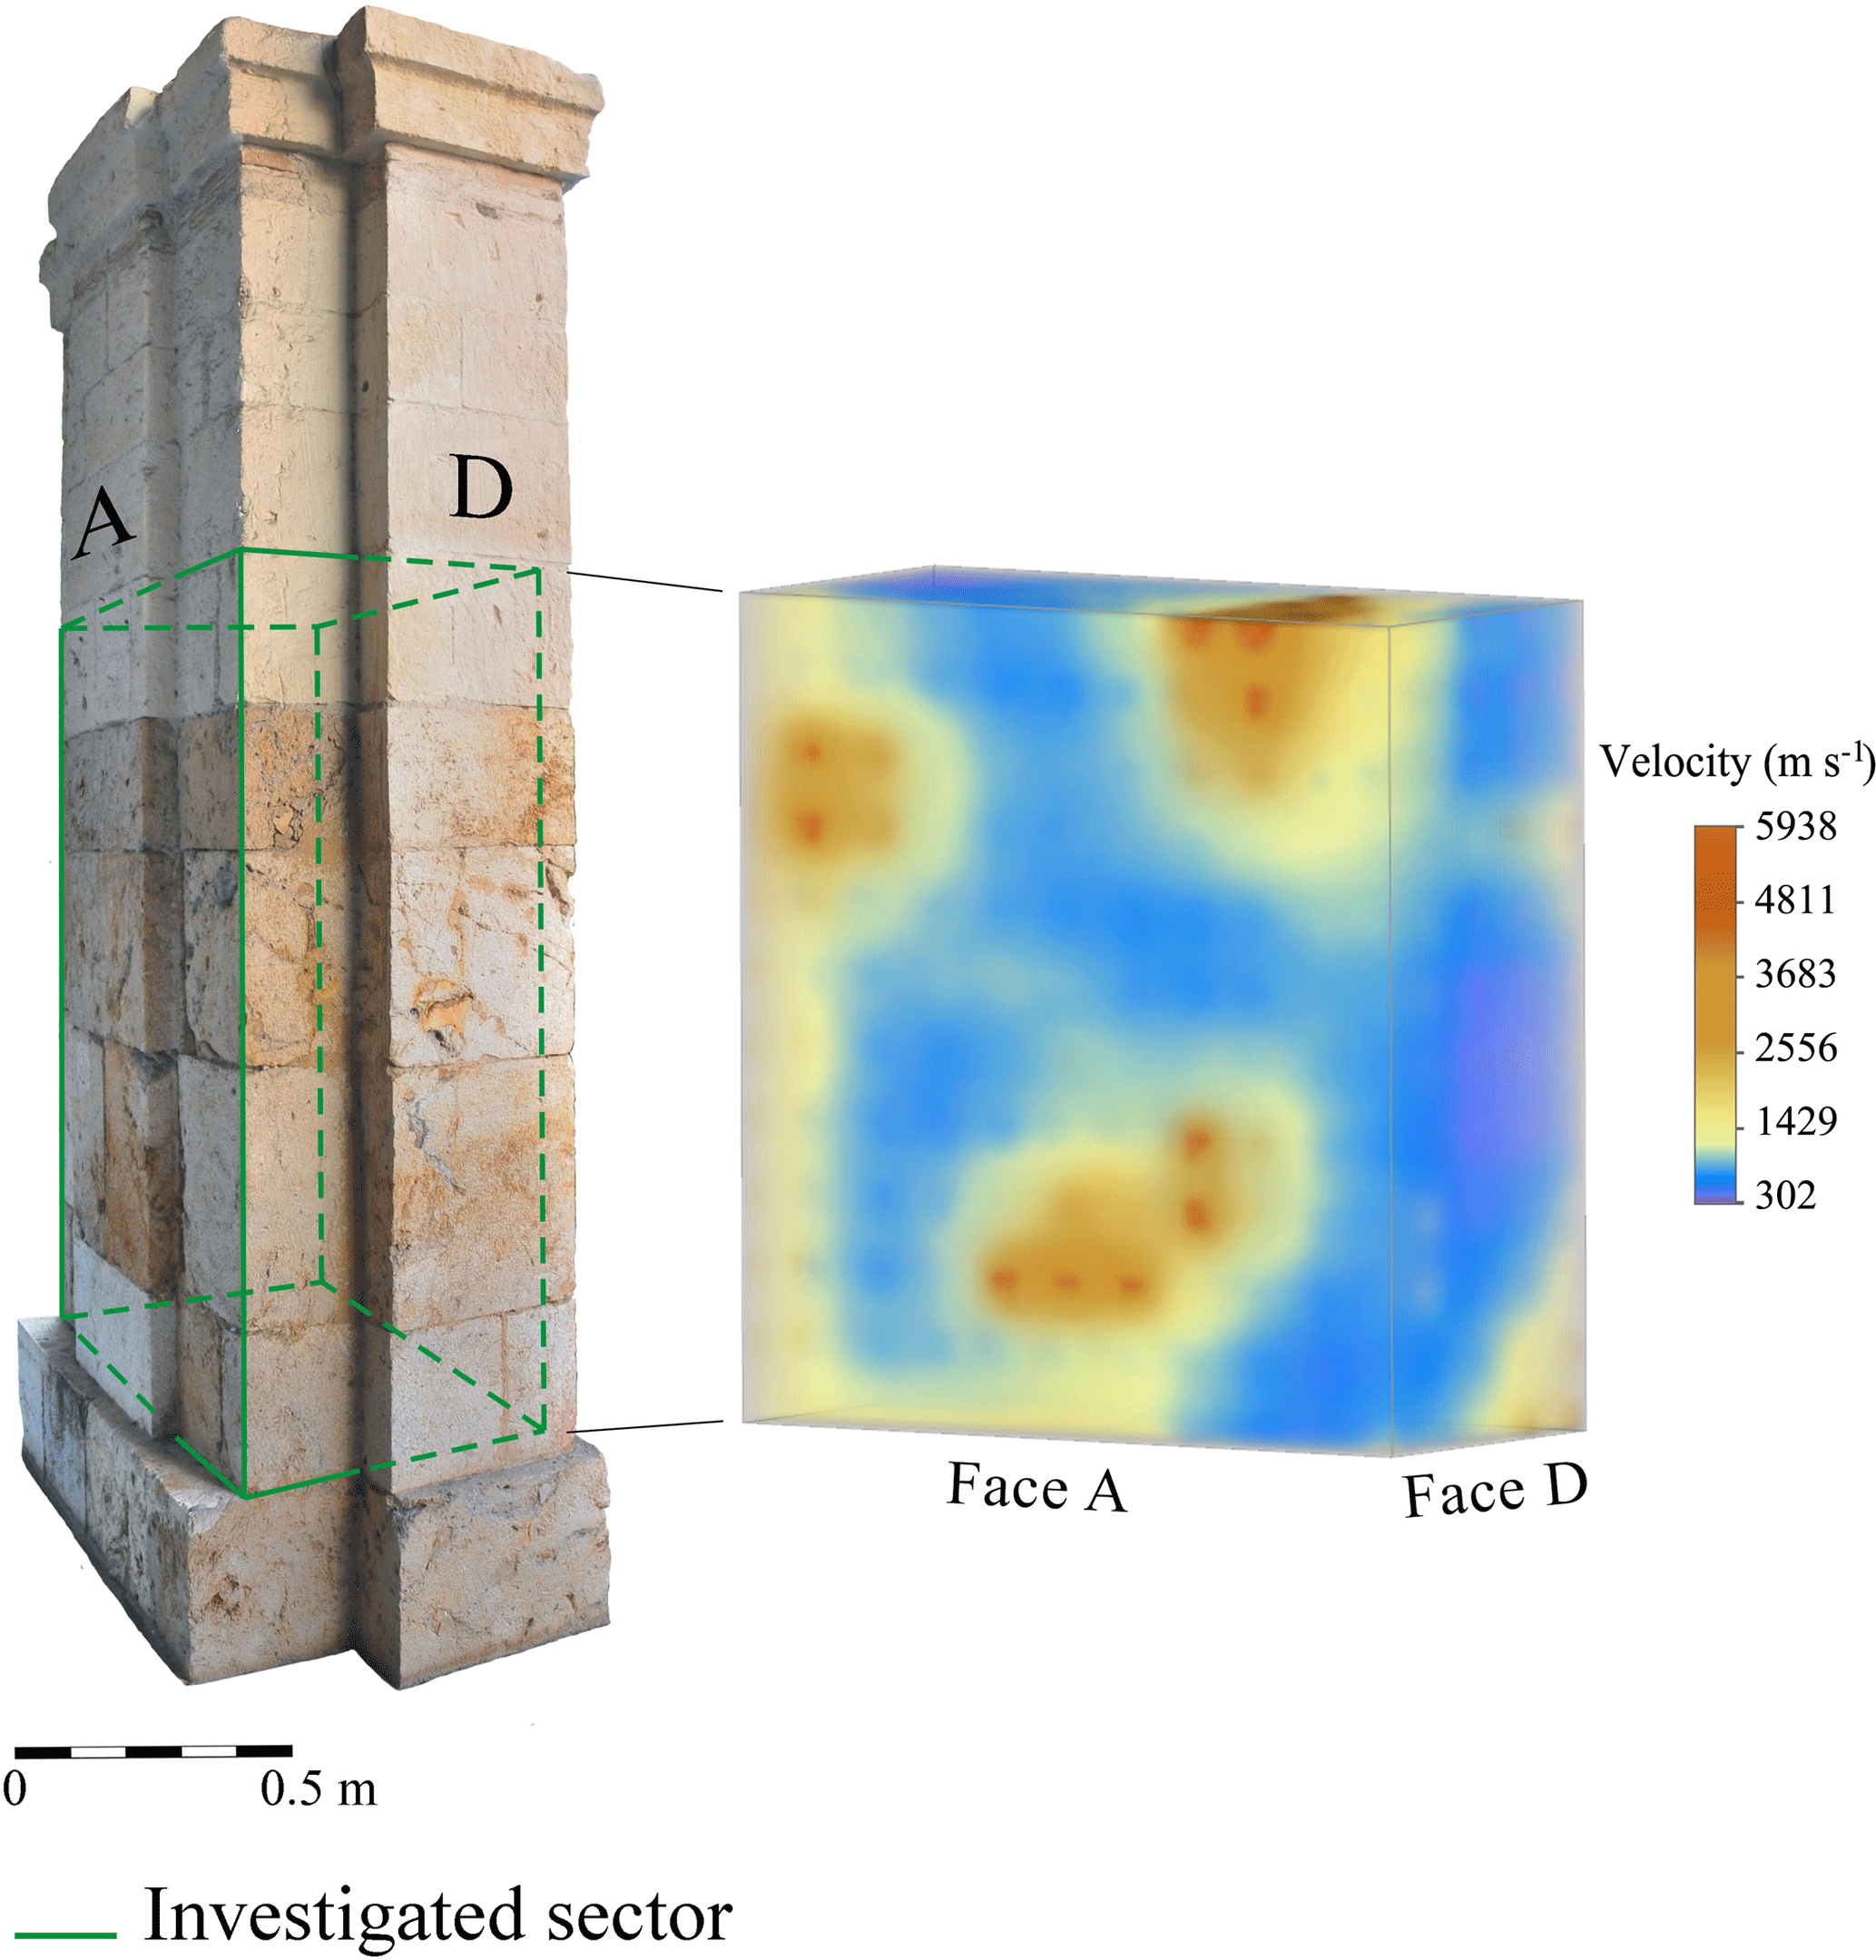
Travel time of the longitudinal elastic waves was measured along a great number of measurement paths between stations located on the perimeter of the investigated sector of the pillar. Each station was alternatively used as a transmitter and a receiver. The sector of the pillar to be imaged was criss-crossed by a great number of discrete rays (1512). Each ray between stations was divided in small segments, each corresponding to a pixel element. The size of the pixels was determined by experimental conditions, such as the number of source-receiver paths. The travel time of the longitudinal ultrasonic signals along the ray paths (source-receiver paths) was recorded together with the relative position and orientation of each ray in the investigated area. The ultrasonic data volume was processed by a specific software (Fais and Casula, 2010) exploiting appropriate reconstruction algorithms to obtain a 3-D representation of the distribution of the longitudinal wave velocity inside the investigated sector of the pillar. Thanks to the 3-D tomographic image the results are extremely convenient to analyze.
Thanks to the TLS survey and high resolution photogrammetry it was possible to obtain accurate 3-D models that show geometrical anomaly maps with interesting analogies (Fig. 6). The reflectivity map together with the computed map of the geometrical anomalies allowed to highlight the irregularity and the characteristics in the shallow building materials and to locate restoration works performed in different periods in the past. The results of the TLS reflectivity and the RGB texturized surveys can be examined also considering the results of the SEM and optical microscopy analyses. In particular, as highlighted by the white boxes and arrows in Fig. 6, many defective areas (shown in yellow/red in the figure) are present in the surface of the pillar both in correspondence of the junctions of the stone blocks and macroporosity in the Pietra Forte ashlars and where fissures are visible. These irregularities are evident both in the TLS anomaly map and in the photogrammetric map post-processed with Cloud Compare software (Fig. 6).
The 3-D ultrasonic tomography (Fig. 7) gives images of the interior of the pillar built with the same carbonate materials as the outer ashlars. The ultrasonic longitudinal velocity in the investigated inner sector presents a great variability between 350 and 5900 m s−1 denoting a wide variability in the elastic characteristics of the carbonate building materials. The differences in the elastic characteristics of the investigated materials are in part due to the significant differences in their textural and petrophysical features. The elastic characteristics proved to be heterogeneous and generally poor due to the presence of macropores (e.g. small karst cavities) and fractures in the Pietra Forte ashlars and to alteration in the Pietra Cantone. Furthermore, considering that the pillar is a compression element and that the longitudinal velocity increases as compression increases (Knight and Endres, 2005), from the analysis of the 3-D tomography results it cannot be excluded that the variability in the velocity distribution in the interior of the pillar, could also be influenced by a non-homogeneous load distribution.
The acquisition of 3-D data on architectural monumental structures by means of different methodologies, when combined, can highlight the characteristics of the shallow and inner stone building materials with efficiency. The result is a three-dimensional imaging of different physical properties that can be analyzed and interpreted more objectively and accurately than the conventional two-dimensional ones. The different nature of the 3-D data volume provides a less ambiguous image of the materials and contributes in efficiency by increasing both fidelity and resolution in the non-destructive diagnostic process of architectural structures.
Data are available upon request by conctacting the corresponding author.
SF and GC conceived the new integrated methodology; SF performed ultrasonic test with the collaboration of PL and FC; FC and GC processed photogrammetric data; GC and MGB processed and interpreted TLS data; CF contributed to the analysis of the materials. All the authors analysed the results, contributed to the manuscript drafting and to prepare the figures. All authors reviewed the manuscript.
The authors declare that they have no conflict of interest.
This article is part of the special issue “European Geosciences Union General Assembly 2018, EGU Division Energy, Resources & Environment (ERE)”. It is a result of the EGU General Assembly 2018, Vienna, Austria, 8–13 April 2018.
The authors would like to thank the Consorzio Camù for their
kind permission to work on the monument.
Edited by: Michael Kühn
Reviewed by: two anonymous referees
Concu, G. and Fais, S.: In time analysis of a viscous coupling agent effect in ultrasonic measurements, in: Proceedings of the 3rd International Conference on NDT: Organized by Hellenic Society of NDT (HSNT), edited by: Prassianakis, I. N., NDT in Antiquity and Nowadays Skill Application Innovation, Chania, Crete, Greece, 15–18 October, 104–108, 2003.
Costanzo, A., Minasi, M., Casula, G., Musacchio, M., and Buongiorno, M. F.: Combined Use of Terrestrial Laser Scanning and IR Thermography Applied to a Historical Building, Sensors, 15, 194–213, https://doi.org/10.3390/s150100194, 2015.
Cuccuru, F., Fais, S., and Ligas, P.: Dynamic elastic characterization of carbonate rocks used as building materials in the historical city centre of Cagliari (Italy), Q. J. Eng. Geol. Hydroge., 47, 259–266, https://doi.org/10.1144/QJEGH2013-061, 2014.
Dunham, R. J.: Classification of carbonate rocks according to depositional texture, in: Classification of carbonate rocks, edited by: Ham, W. E., AAPG Memoirs Special Volumes, 108–121, 1962.
Fais, S. and Casula, G.: Application of acoustic techniques in the evaluation of heterogeneous building materials, NDT & E Int., 43, 62–69, https://doi.org/10.1016/j.ndteint.2009.10.004, 2010.
Fais, S., Cuccuru, F., Ligas, P., Casula, G., and Bianchi, M. G.: Integrated ultrasonic, laser scanning and petrographical characterisation of carbonate building materials on an architectural structure of a historic building, B. Eng. Geol. Environ., 76, 71–84, https://doi.org/10.1007/s10064-015-0815-9, 2017.
Fais, S. Casula, G., Cuccuru, F., Ligas, P., and Bianchi, M. G.: An innovative methodology for the non-destructive diagnosis of architectural elements of ancient historical buildings, Sci. Rep., 8, 4334, https://doi.org/10.1038/s41598-018-22601-5, 2018.
ISRM (International Society for Rock Mechanics): Suggested Method for Determining Sound Velocity, Int. J. Rock. Mech. Min., 15, 53–58, 1978.
Knight, R. J. and Endres, A. L.: 3. An Introduction to Rock Physics Principles for Near-Surface Geophysics, Near-Surface Geophysics, 13, 31–70, https://doi.org/10.1190/1.9781560801719.ch3, 2005.
Montuori, A., Costanzo, A., Gaudiosi, I., Vecchio, A., Pannaccione Apa, M. I., Gervasi, A., Falcone, S., La Piana, C., Minasi, M., Stramondo, S., Buongiorno, M. F., Doumaz, F., Musacchio, M., Casula, G., Caserta, A., Speranza, F., Bianchi, M. G., Guerra, I., Porco, G., Compagnone, L., Cuomo, M., and De Marco, M.: The MASSIMO system for the safeguarding of historic buildings in a seismic area: operationally oriented platforms, Eur. J. Remote Sens., 49, 397–415, https://doi.org/10.5721/EuJRS20164922, 2016.
Van Balen, K.: Structural Analysis of Historical Constructions: Anamnesis, Diagnosis, Els Verstrynge, 2017.