 | 21 Nov 2018
Monitoring military landscapes and detection of underground man-made critical infrastructures in Cyprus using Earth Observation
George Melillos
Athos Agapiou
Silas Michaelides
Diofantos G. Hadjimitsis
This paper aims to explore the importance of monitoring military landscapes in Cyprus using Earth Observation. The rising availability of remote sensing data provides adequate opportunities for monitoring military landscapes and detecting underground military man-made structures. In order to study possible differences in the spectral signatures of vegetation so as to be used for the systematic monitoring of military landscapes that comprise underground military structures, field spectroscopy has been used. The detection of underground and ground military structures based on remote sensing data could make a significant contribution to defence and security science. In this paper, underground military structures over vegetated areas were monitored, using both ground and satellite remote sensing data. Several ground measurements have been carried out in military areas, throughout the phenological cycle of plant growth, during 2016–2017. The research was carried out using SVC-HR1024 ground spectroradiometers. Field spectroradiometric measurements were collected and analysed in an effort to identify underground military structures using the spectral profile of the vegetated surface overlying the underground target and the surrounding area, comprising the in situ observations. Multispectral vegetation indices were calculated in order to study their variations over the corresponding vegetation areas, in presence or absence of military underground structures. The results show that Vegetation Indices such as NDVI, SR, OSAVI, DVI and MSR are useful for determining areas where military underground structures are present.
- Article
(1671 KB) - Full-text XML
- BibTeX
- EndNote


Underground structures are critical elements in the military arsenal of many countries. The importance of these structures is becoming an increasingly important part of the defence establishments, protecting critical governmental and military functions, thus contributing to victory during war, or at least make it more difficult for the adversary to destroy critical military capabilities (Sepp, 2000). During the 1960s, some of the remote sensing instruments originally developed for military reconnaissance and classified as defence secrets were released for civilian use as more advanced designs became available for military application (Campbell and Wynne, 2011). These instruments extended the reach of aerial observation outside the visible spectrum into the infrared and microwave regions. It was in this context that the term remote sensing was first used (Campbell and Wynne, 2011). Therefore, Remote Sensing is a rapidly developing scientific field that is applied in various fields of science, including the Military.
Remote sensing relies on observed spectral differences in the energy reflected or emitted from features of interest. Expressed in everyday terms, one might say that we look for differences in the “color” of objects, even though remote sensing is often conducted outside the visible spectrum, where “color”, in the usual meaning of the word, does not exist. This principle is the basis of multispectral remote sensing, the science of observing features at varied wavelengths, in an effort to derive information about these features and their distributions (Campbell and Wynne, 2011). The term spectral signature has been used to refer to the spectral response of a feature, as observed over a range of wavelengths (Parker and Wolff, 1965).
During the last decade, the improvement of sensor characteristics, such as higher spatial resolution and hyperspectral data, as well as technological achievements in space technology, offer new opportunities for future applications (Giardino, 2011). In this context, it should be noted that, in some cases, researchers seek to find not the target itself but rather to identify symptoms related to the topography (relief), crop characteristics (crop marks), soil characteristics (soil marks) or even changes in snow cover (Winton and Horne, 2010). For instance, archaeological structures buried beneath the soil (i.e., still un-excavated sites) can be detected through remote sensing images as stressed vegetation (crop marks) which can be used as proxies for the buried archaeological relics. Crop marks may be formed in areas where vegetation grows over near-surface archaeological remains. These features modify the moisture retention compared to the rest of the crop coverage of an area. Depending on the type of feature, crop vigor may be enhanced or reduced by buried archaeological features (Winton and Horne, 2010).
Underground constructions such as military structures, military bunkers, military bases, tunnel networks and archaeological remains can affect their surrounding landscapes in different ways, including changes in thermal inertia (Gunn et al., 2008), localized soil moisture content and drainage rates (Lasaponara and Masini, 2006), soil composition and vegetation vigor (Milton and Rollin, 2006); however, such changes could just be a sign which could also be attributed to other reasons (e.g., such as plant diseases). Vegetation vigor is often observed on the ground as a crop mark, a spot which can be used to denote the presence of underground structures. Crop marks can be formed both as negative marks above wall foundations and as positive marks above the damper and more nutritious soil of buried pits and ditches (Themistocleous et al., 2015).
This paper aims to study underground military structures over vegetated areas using both ground and satellite remote sensing data. Results obtained from a ground spectroradiometric campaign carried out at a specific area in Cyprus using a SVC-HR1024 field spectroradiometer are presented. Field spectroradiometric measurements were collected and analyzed in order to identify underground structures using the spectral profile of the vegetated surface over the underground target and the surrounding area for in situ observations, throughout the plants' development, with regard to its phenological cycle. Healthy vegetation shows an increase in reflectance in the visible region and a decrease of reflectance when the vegetation is under stress (Melillos et al., 2016b).
2.1 Test area
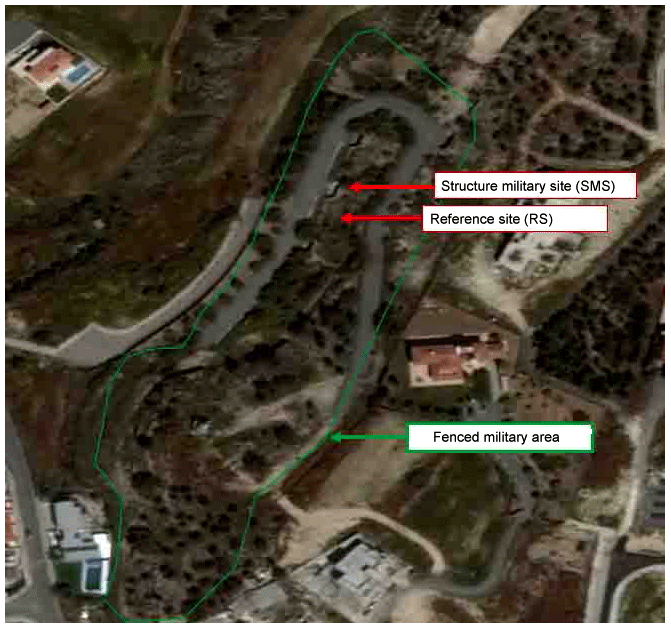
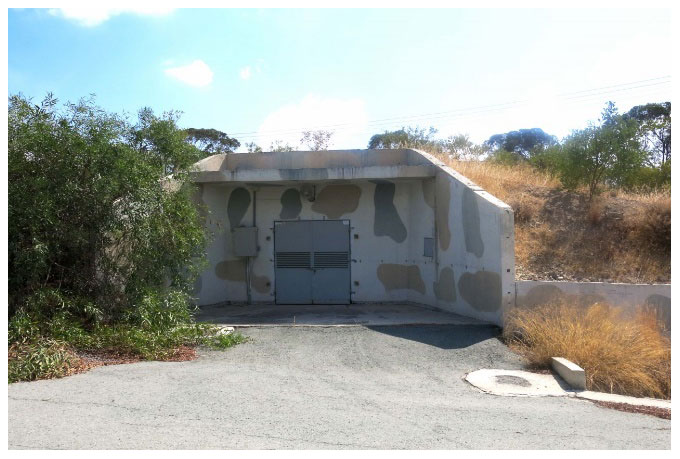
The test sites are located in a specific geographical area in Cyprus. The test sites are located within a fenced military area; due to security and confidentiality issues, the specific area cannot be reported herein (see Fig. 1). Figure 2 shows a military storage bunker similar to what is targeted in the study. The horizontal dimensions of the underground structure are 13 m × 5 m; it is a concrete storage bunker, located approximately 2 m below the ground surface. In-situ measurements were taken at two test sites: (a) vegetation area covered with barley crop, in the presence of an underground military structure – hereafter, denoted as Structure Military Site (SMS) – and (b) vegetation area also covered with barley crop, in the absence of an underground military structure – hereafter, denoted as Reference Site (RS).
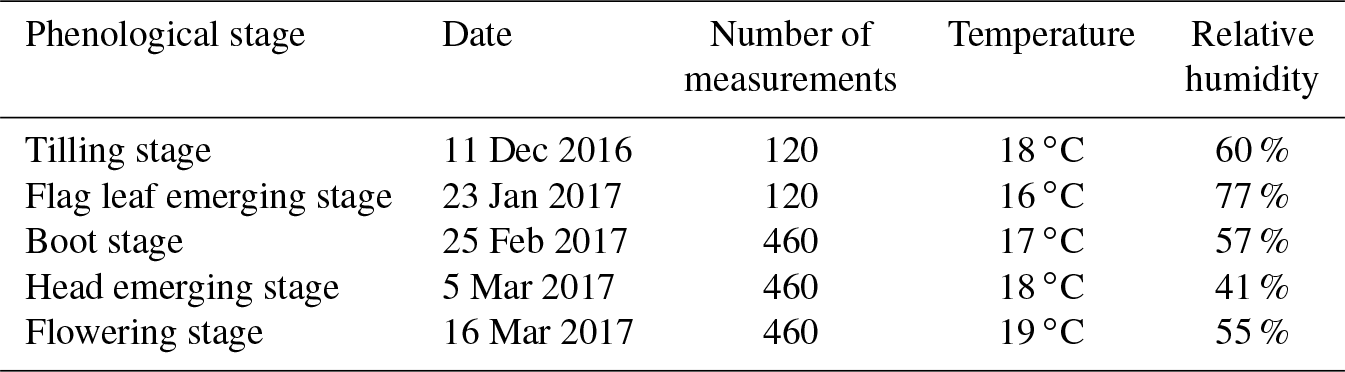
Table 1Dates of each phenological stage and number of measurements taken in each phenological stage. The temperature and relative humidity recorded are also shown.
2.2 Dataset
The basis of this methodology exploits the study of the vegetation phenology as a proxy for military underground structures of defence significance. For this study, remote sensing data was collected for two test sites showing a variety of differences: one is where an underground structure exists and the other, located nearby, where no underground structure exists.
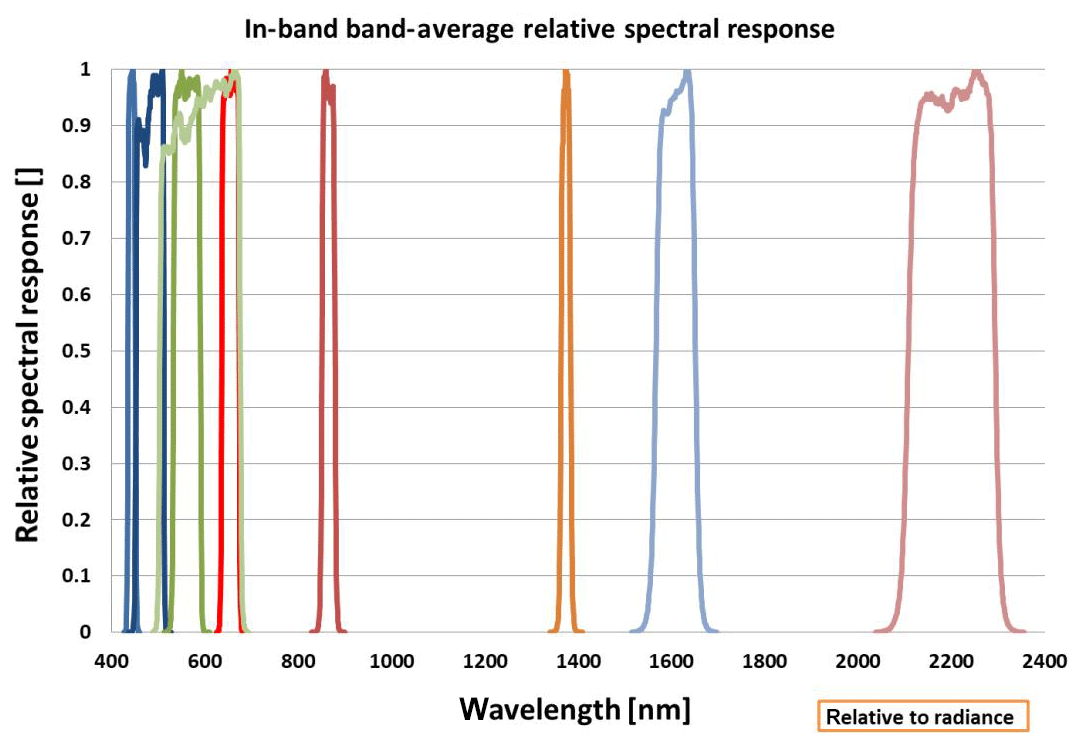
Figure 4Band average relative spectral response filters for Landsat 8 OLI sensor (USGS, 2018).
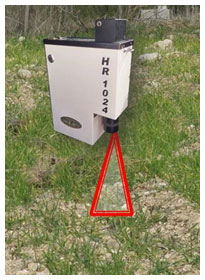
The data was collected using the SVC HR-1024 field spectroradiometer (see Fig. 3) which has a spectral range of 350–2500 nm. The measurements were taken between 11:00 and 13:00 LT (local time). The measurements carried out with a calibrated spectralon panel (with reflectance ≈ 100 %) are considered as reference quantities, while the measurements over the crops as the target (Papadavid et al., 2011). During the campaign, 1620 measurements were taken using a SVC HR-1024 field spectroradiometer for determining the averaged spectral reflectance values. Some details of the five campaigns (random sampling) undertaken throughout the crop's phenological cycle are given in Table 1.
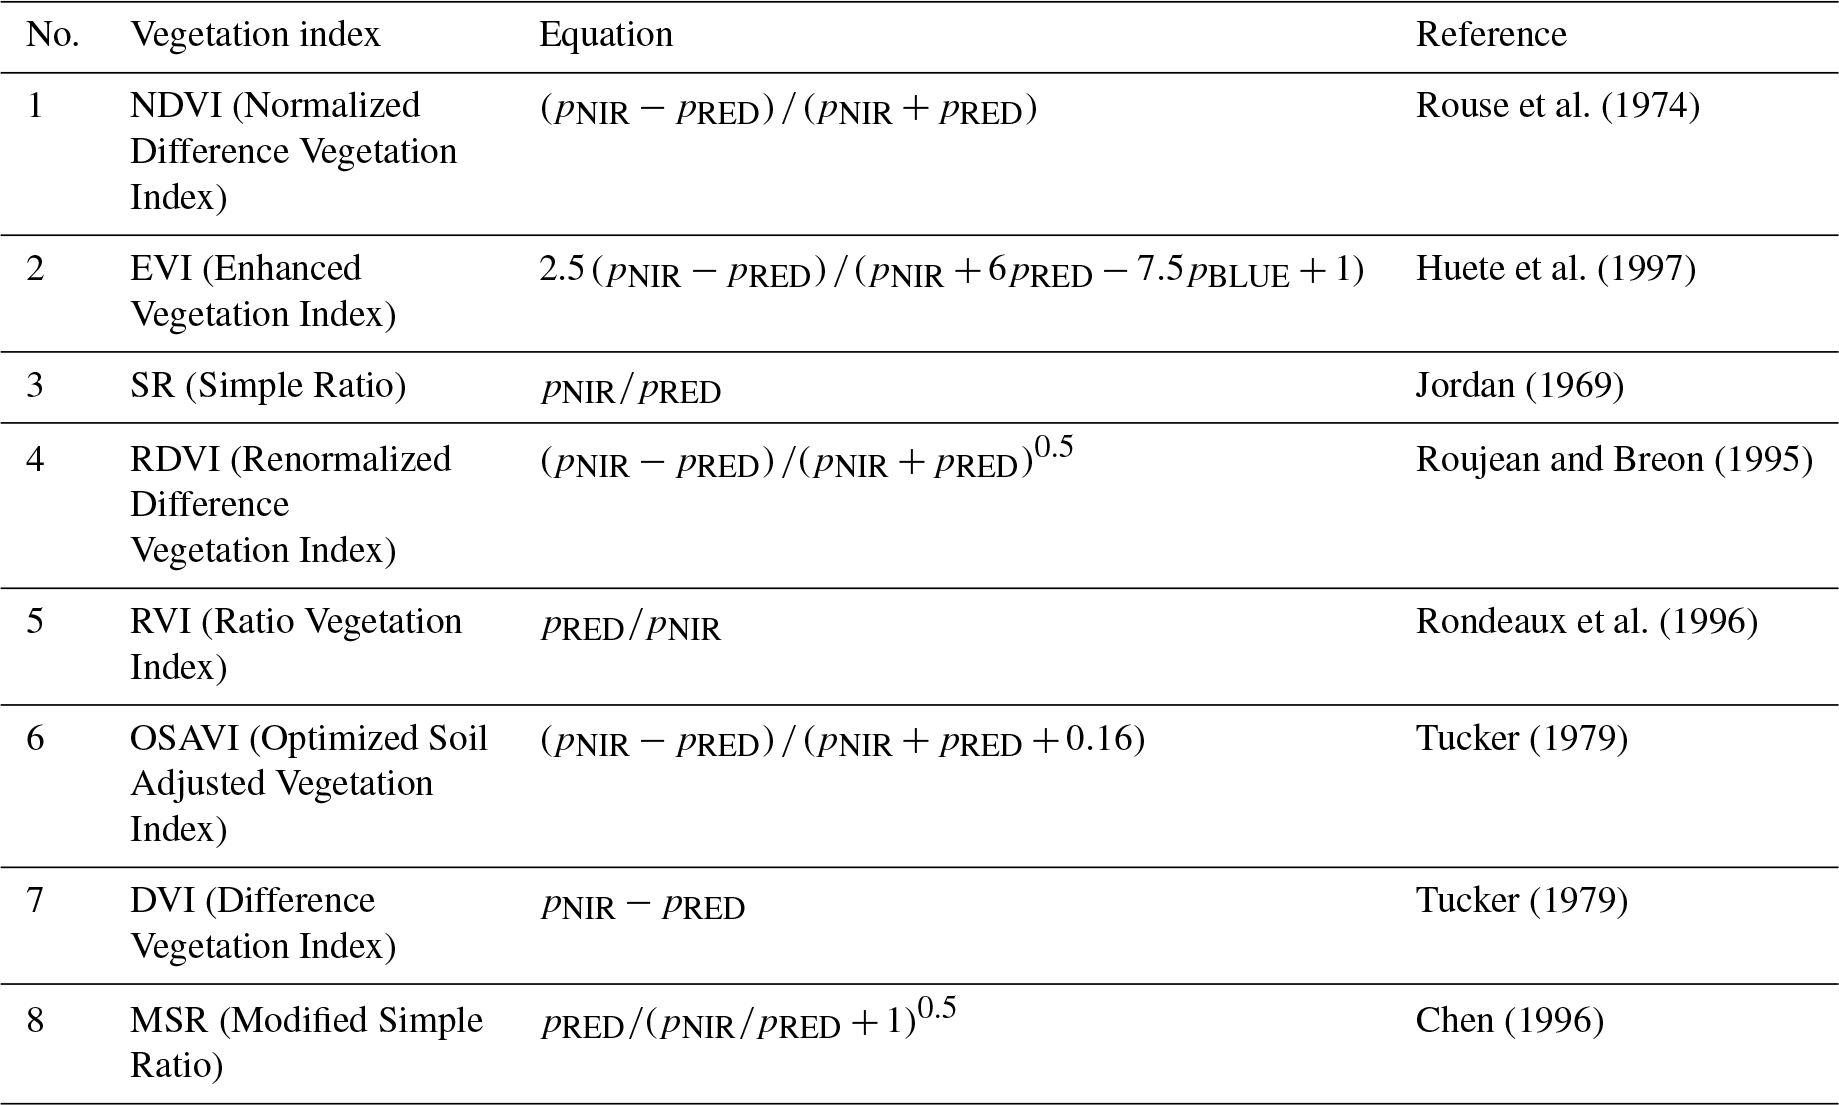
Table 2Vegetation indices: pNIR, pRED, pBLUE and pGREEN represent the atmospherically or partially atmospherically corrected surface reflectance values of the near-infrared (NIR), red (RED), blue (BLUE) and green (GREEN) wavelengths, respectively (Agapiou et al., 2012).
2.3 Methodology
Hyperspectral measurements recorded with the SVC HR-1024 instrument needed to be recalculated according to the characteristics of a specific multispectral satellite sensor. The hyperspectral measurements from the Landsat 8 satellite imagery were upscaled via the Relative Spectral Response (RSR) filters. RSR filters describe the instrument's relative sensitivity to radiance in various parts of the electromagnetic spectrum (Wu et al., 2010). These spectral response values range from 0 to 1 and are dimensionless, since they are relative to the peak response (see Fig. 4). RSR filters are used in the same way in spectroradiometers in order to transmit a certain wavelength band and block others. The reflectance from the spectroradiometer was calculated on the basis of the wavelength corresponding to each sensor and the RSR filter as follows (Agapiou et al., 2013):
where Rband = reflectance at a range of wavelength (e.g., Band 4), Ri = reflectance at a specific wavelength (e.g., R 640 nm) and RS = relative response value at the specific wavelength.
The waveband reflectance values were used to calculate the following vegetation indices (VIs): Normalized Difference Vegetation Index (NDVI), Enhanced Vegetation Index (EVI), Simple Ratio (SR), Renormalized Difference Vegetation Index (RDVI), Ratio Vegetation Index (RVI), Optimized Soil Adjusted Vegetation Index (OSAVI), Difference Vegetation Index (DVI) and Modified Simple Ratio (MSR). The mathematical expressions of all VIs are given in Table 2. The vegetation indices were plotted and compared between the two sites in order to evaluate their performance (see Agapiou et al., 2012) for the purpose of detecting military underground structures.
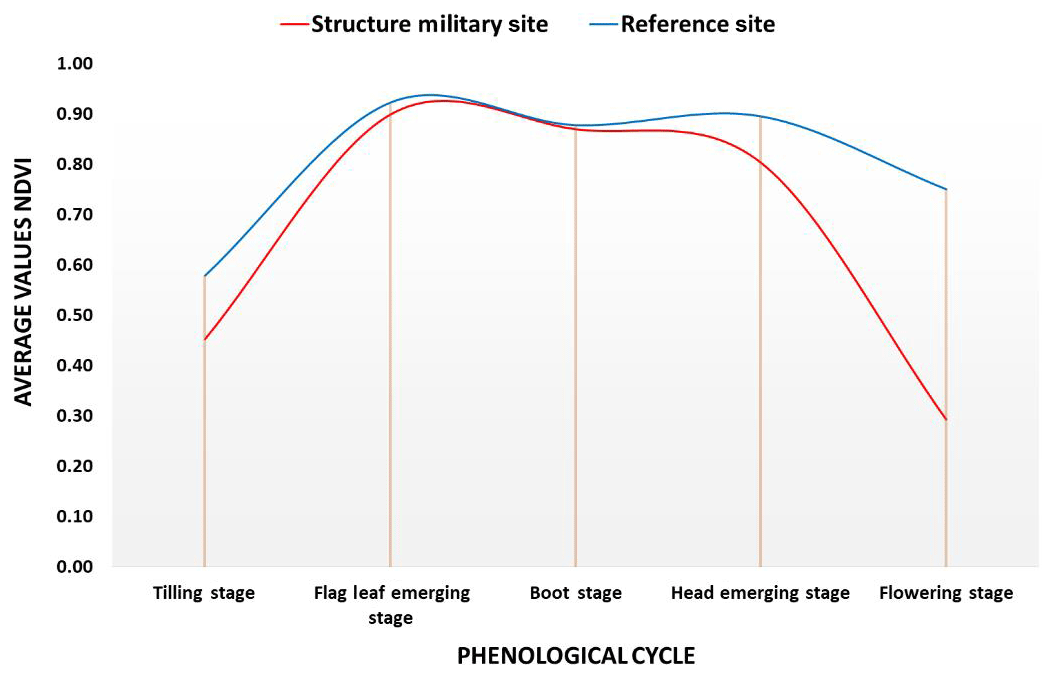
Figure 5Average Values of NDVI were applied to the barley crop Structure Military Site (SMS) and Reference Site (RS) during the phenological cycle.
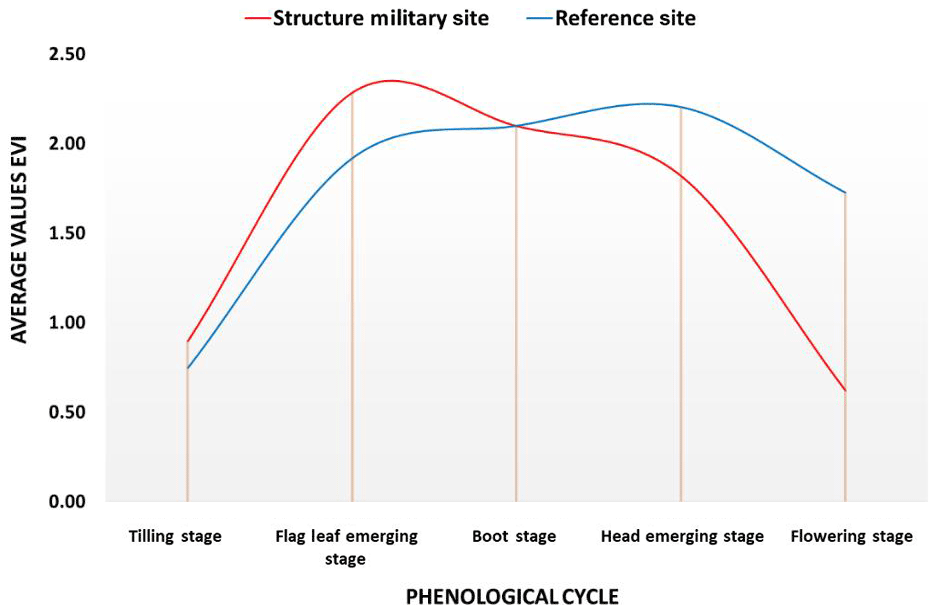
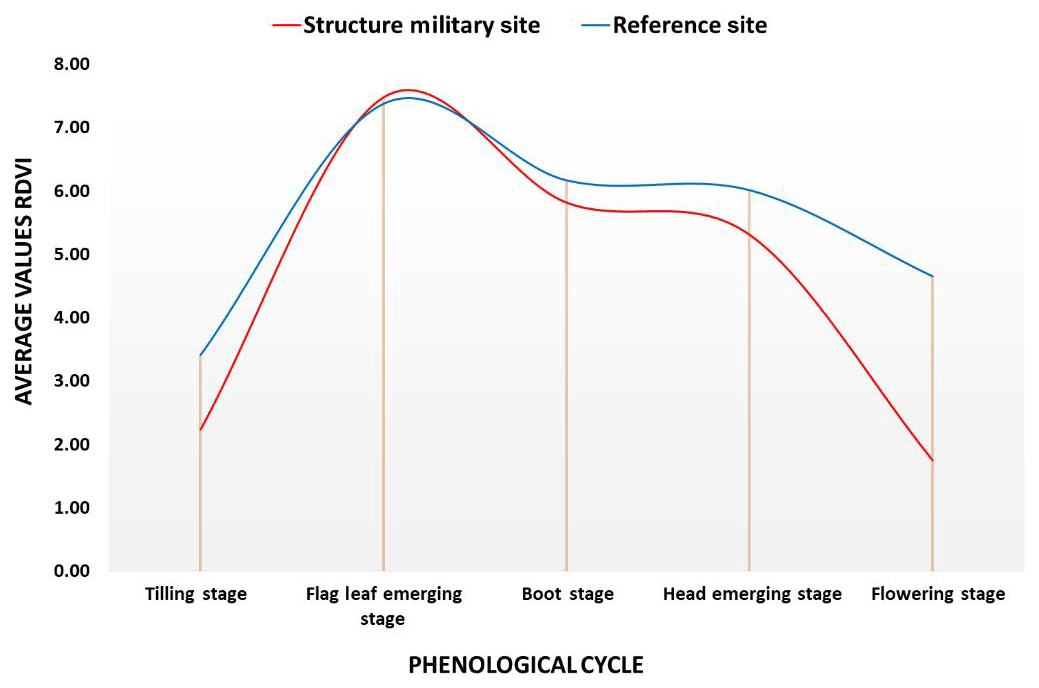
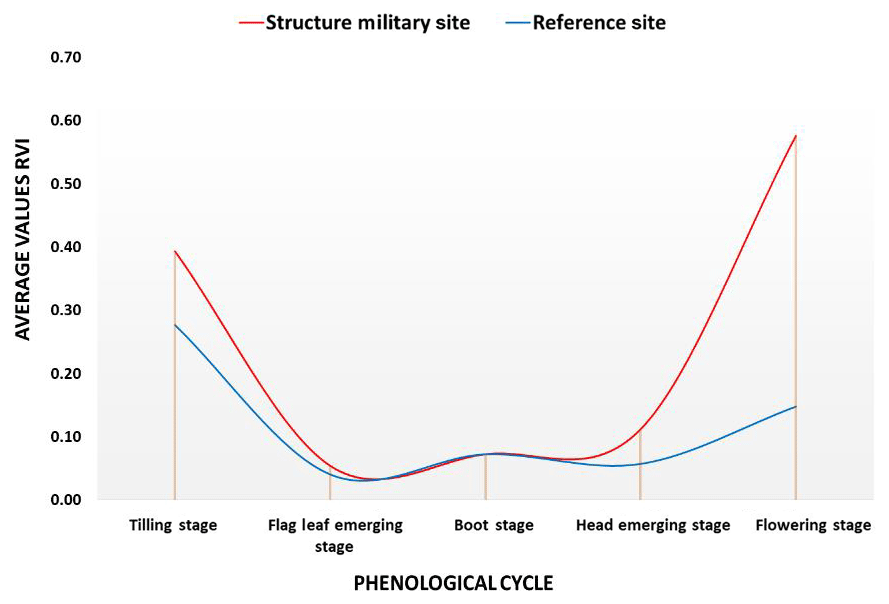
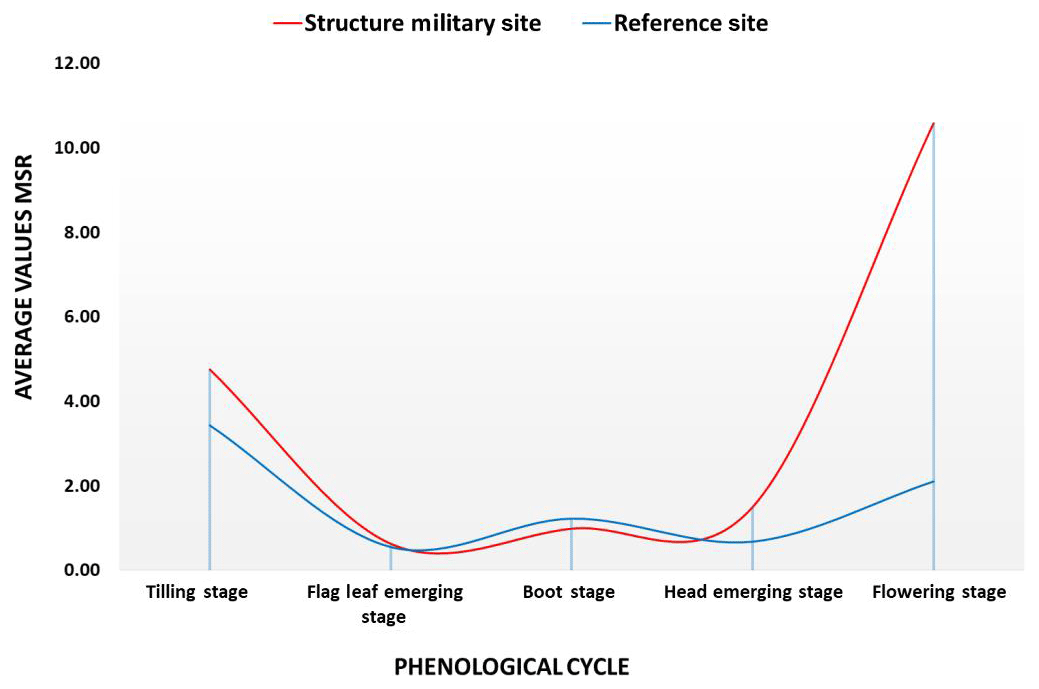
Figures 5–12 show the average values of the VIs, as these are mathematically shown in Table 2, during the crop's phenological cycle. In these figures, the VIs of the barley crop over the Structure Military Site (SMS) are shown by the red curves and over the Reference Site (RS) by the blue curves. The response of the VIs with respect to barley growth was comparatively evaluated in an effort to reveal significant differences between the above-mentioned two test areas. Indeed, the findings presented briefly below demonstrate that the eight VIs adopted in this research exhibit distinct differences, corresponding to barley development and between the two sites. They could be used as cultivar-independent phenological indicators. Indeed, VIs values could be used as single thresholds in field spectroscopy for the detection of military underground structures.
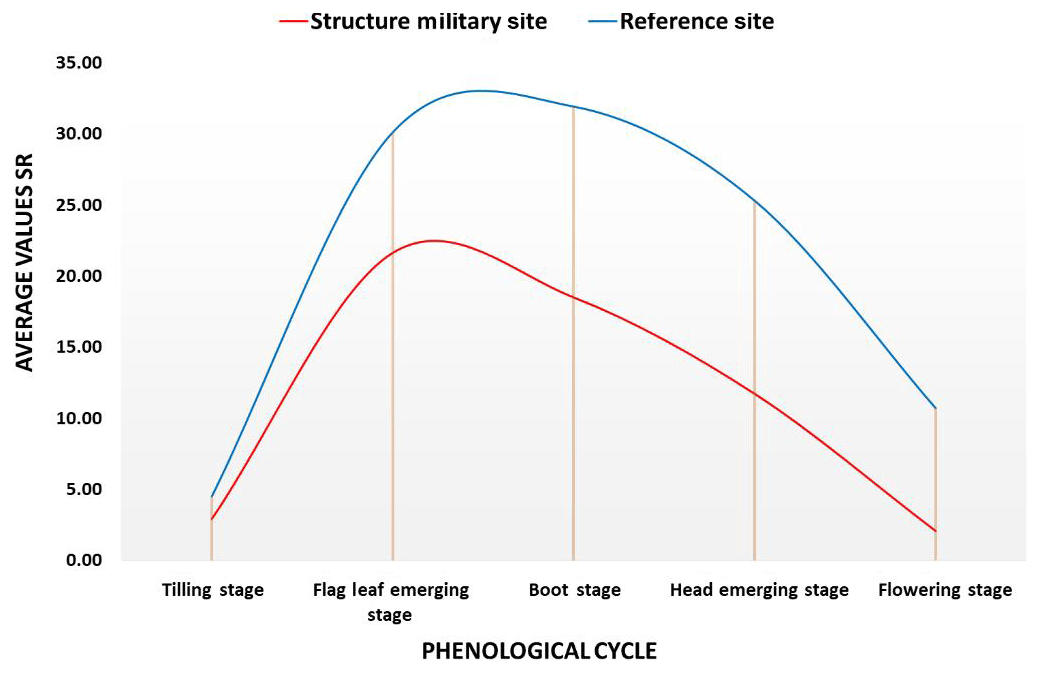
The use of more than one VIs for the detection of crop marks is recommended as it is considered to augment the final results (Agapiou et al., 2012). This procedure allowed to compare all VIs by applying the same reference (Mróz and Sobieraj, 2004). Using the VIs of Table 2, it may be seen clearly that there is a distinction between SMS and RS, in the head emerging and flowering stages (red and blue curves, respectively). Furthermore, for each phenological stage the results show that the most remarkable VIs during the phenological cycle from the tilling to the flowering stage are NDVI (Fig. 5), SR (Fig. 7), OSAVI (Fig. 10), DVI (Fig. 11) and MSR (Fig. 12).
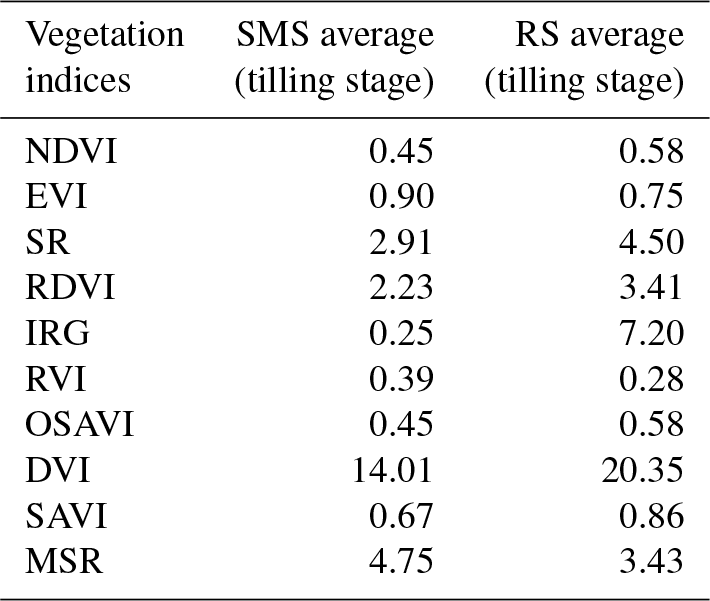
Table 3Average Values of Vegetation Indices for the Structure Military Site (SMS) and Reference Site (RS) during the tilling stage.
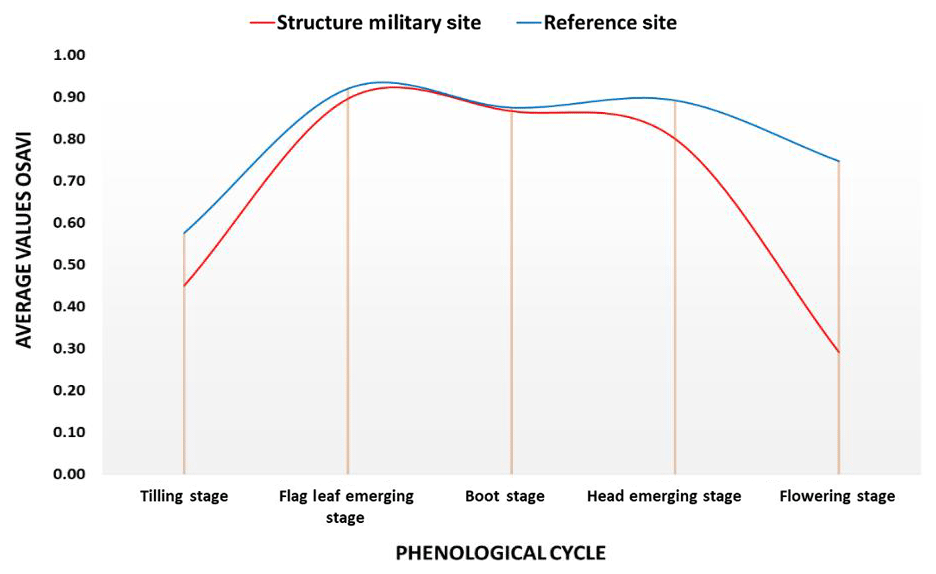
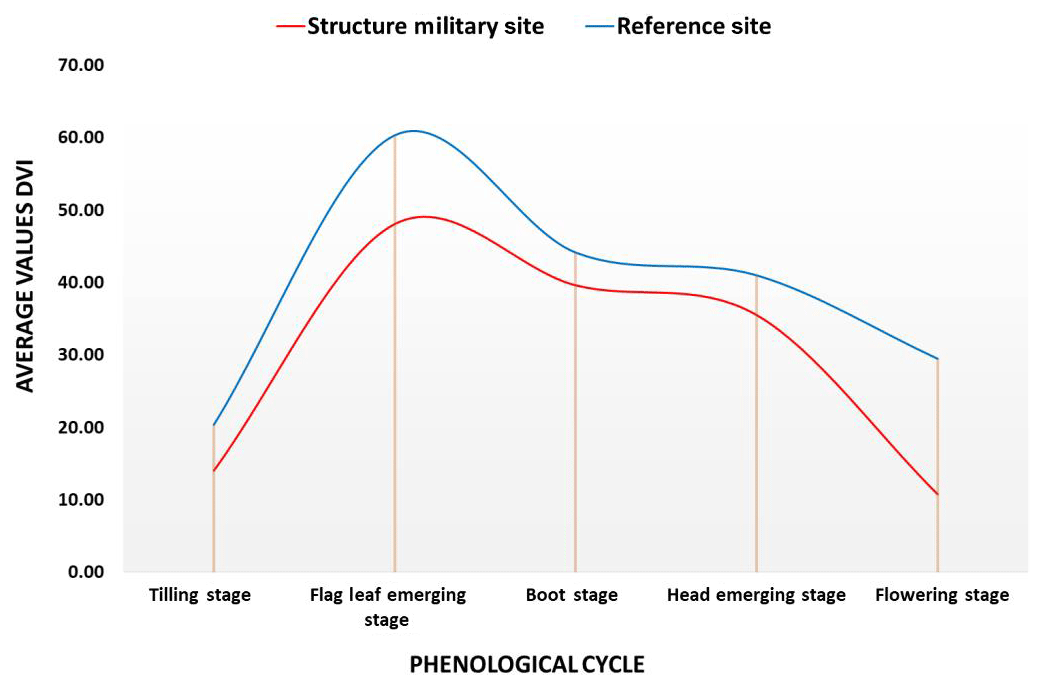
Summarising the findings that can be deduced from Figs. 5–12 regarding the contrasting differences between the two sites at different phenological stages:
-
In the tilling stage (Table 3), NDVI (Fig. 5) obtained higher average values for RS (blue line) compared to SMS (red line). A similar situation was observed for SR (Fig. 7), RDVI (Fig. 8), OSAVI (Fig. 10) and DVI (Fig. 11). On the contrary, regarding the remaining VIs, SMS (red line) exhibited higher values compared to RS.
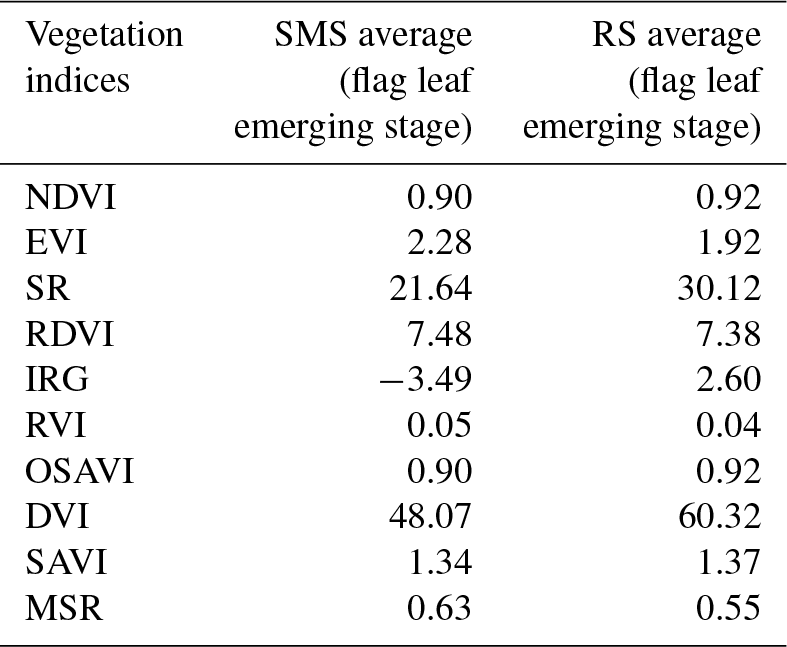
-
In the flag leaf emerging stage (Table 4), the values of NDVI (Fig. 5), SR (Fig. 7), OSAVI (Fig. 10) and DVI (Fig. 11) were higher for RS (blue line). In contrast, SMS (red line) exhibited higher values using EVI (Fig. 6), RDVI (Fig. 8), RVI (Fig. 9) and MSR (Fig. 12).
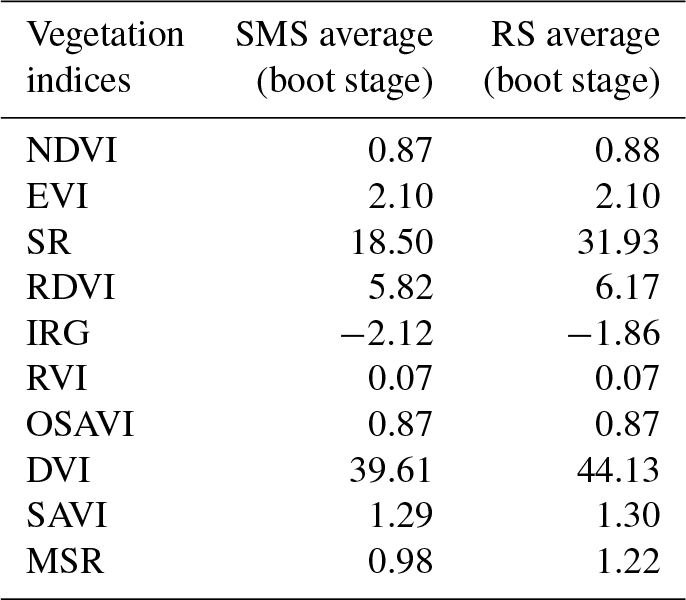
-
In the boot stage (Table 5), RS (blue line) was associated with higher values for the following VIs: NDVI (Fig. 5), SR (Fig. 7), RDVI (Fig. 8), OSAVI (Fig. 10), DVI (Fig. 11) and MSR (Fig. 12). At the start of this stage, EVI (Fig. 6) had similar average values for both SMS and RS, however afterwards RS (blue line) achieved higher values. Moreover, at this stage, RVI (Fig. 9) had similar average values in both test sites but subsequently, at the end of the boot stage, the average values of RS (blue line) were lower than SMS (red line).
-
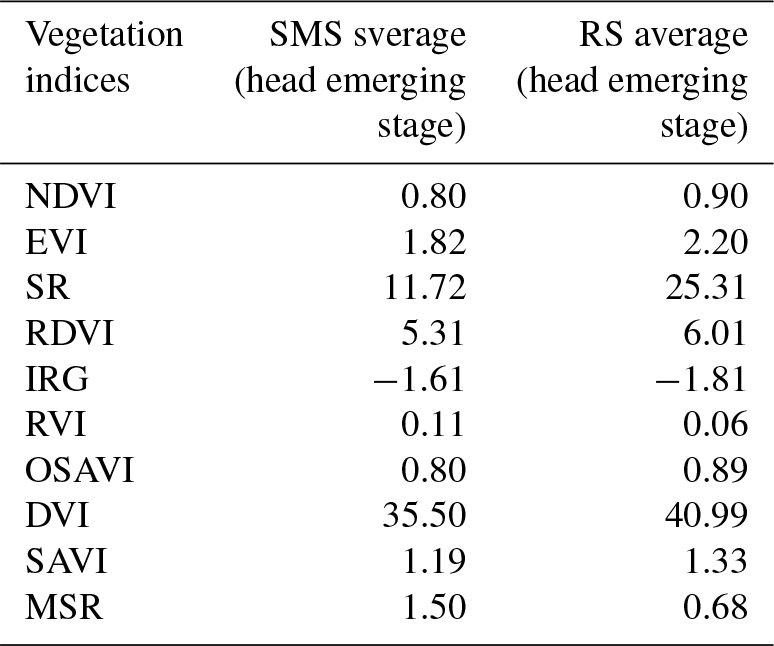
In the head emerging stage (Table 6), RVI (Fig. 9) and MSR (Fig. 12) exhibited lower average values for SMS (red line). The values of the other indices NDVI (Fig. 5), EVI (Fig. 6), SR (Fig. 7), RDVI (Fig. 8), OSAVI (Fig. 10) and DVI (Fig. 11) were quite higher for RS (blue line).
-
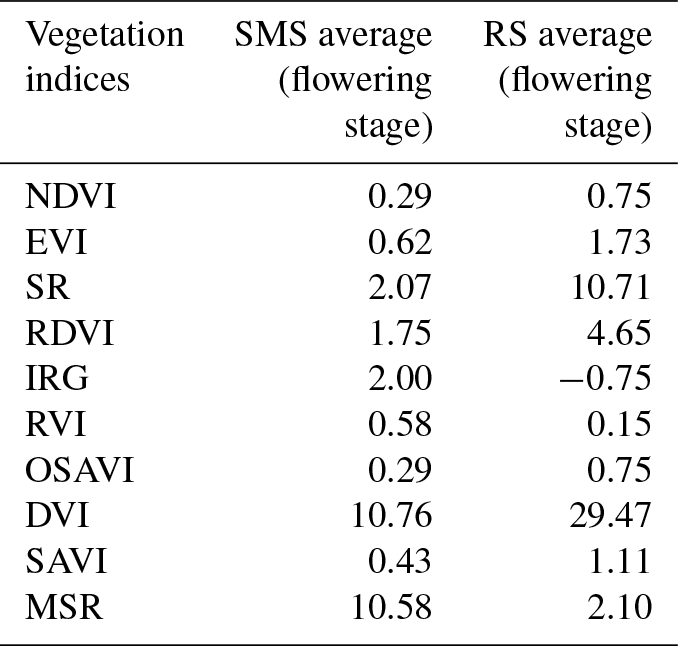
In the flowering stage (Table 7), the characteristics of the VIs are similar to those of the emerging stage. Larger values were noted for NDVI (Fig. 5), EVI (Fig. 6), SR (Fig. 7), RDVI (Fig. 8), OSAVI (Fig. 10) and DVI (Fig. 11) for RS (blue line) but lower values using RVI (Fig. 9) and MSR (Fig. 12). In this stage, the most interesting index was MSR (Fig. 12), enabling to distinguish clearly between the two test sites. Another feature in this stage was the differentiation between the two sites using all VIs, implying that all VI's are equally important and useful (Mróz and Sobieraj, 2004).
Based on these results, the appropriateness of various VI's in different stages, are summarised as follows:
-
in the tilling stage, it is preferable to use NDVI, SR, RDVI, IRG and DVI;
-
in the flag leaf emerging stage, it is preferable to use SR and DVI;
-
in the boot stage, SR, RDVI and DVI seem to be more appropriate to use;
-
in the head emerging stage, SR, RDVI and DVI appear to be more suitable;
-
in the flowering stage, NDVI, EVI, RDVI, OSAVI, DVI and MSR seem to be more correct to adopt.
In this paper, an approach is proposed for detecting military underground structures throughout the phenological cycle of plant growth by using vegetation indices. Indeed, vegetation indices can corroborate areas of possible military underground structures. The advantages of using vegetation indices as proxy variables for inter-calibration among existing sensors are the low sensitivity to the uncertainties in atmospheric correction and the variation in the satellite viewing angle (Steven et al., 2003). In comparing the two test areas, the findings (Figs. 7 and 8) reveal substantial differences between them. The results show that the VIs in Table 2 are useful for determining areas where military underground structures are present. Spectroradiometric measurements can be used as an alternative approach to identify underground military structures, since they can provide accurate spectral signatures for a wide spectral region. Anomalies in the crop spectral signatures resulting from an existing underground structure can be recorded using spectroradiometer (Melillos et al., 2016b).
Within the framework of this research, the authors plan to expand this study by using additional techniques, such as surveying suitable areas with an unmanned aerial vehicle (UAV) with visible and near-infrared cameras, in order to generate
VIs for comparison with the in-situ spectroradiometric measurements (Melillos et al., 2016a). Also, the authors plan to investigate the response of the VIs by cultivating other crops and carry out a similar measurement scheme in an effort to reveal significant differences between the above-mentioned two test areas.
This paper is part of an ongoing Doctoral dissertation commissioning, the underlying data on which it is based are copyrighted for a certain period of time.
This paper is the outcome of collaborative teamwork. GM contributed to the conceptualization, methodology, experimental set-up, investigation, formal analysis of results and writing of the paper; AA and DGH contributed to the supervision, methodology and design of the research. SM contributed to the investigation, writing, editing and finalisation of the paper. All authors read and approved the final manuscript.
Silas Michaelides is the Guest Editor of the Special Issue.
This article is part of the special issue “Earth surveillance and space-based monitoring of the environment: integrated approaches”. It is not associated with a conference.
This research did not receive any specific grant from funding agencies in the
public, commercial, or not-for profit sectors.
Edited by: Haris Kontoes
Reviewed by: three anonymous referees
Agapiou, A., Hadjimitsis, D. G., and Alexakis, D. D.: Evaluation of broadband and narrowband vegetation indices for the identification of archaeological crop marks, Remote Sens., 4, 3892–3919, 2012.
Agapiou, A., Themistocleous, K., Alexakis, D. D., Kourtis, N., Sarris, A., Perdikou, S., and Hadjimitsis, D. G.: Variations of spectral signature profiles of wet and dry targets for supporting the detection of water-leakages using satellite data, in: Remote Sensing for Agriculture, Ecosystems, and Hydrology XV, edited by: Neale, C. M. U. and Maltese, A., SPIE, Bellingham, USA, https://doi.org/10.1117/12.2029289, 2013.
Campbell, J. B. and Wynne, R. H.: Introduction to remote sensing, Guilford Press, New York, USA, 2011.
Chen, J. M.: Evaluation of vegetation indices and a modified simple ratio for boreal application, Can. J. Remote Sens., 22, 229–242, 1996.
Giardino, M. M.: A history of NASA remote sensing contributions to archaeology, J. Archaeol. Sci., 38, 2003–2009, 2011.
Gunn, A. D., Marsh. H. S., Gibson, A., Ager, G. J., McManus, K. B., Caunt, S., and Culshaw. G. M.: Remote thermal IR surveying to detect abandoned mineshafts in former mining areas', Eng. Geol. Hydrogeol., 41, 357–370, 2008.
Huete, A. R., Liu, H. Q., Batchily, K., and Van Leeuwen, W.: A comparison of vegetation indices over a global set of TM images for EOS-MODIS, Remote Sens. Environ., 59, 440–451, 1997.
Jordan, C. F.: Derivation of leaf area index from quality of light on the forest floor, Ecology, 50, 663–666, 1969.
Lasaponara, R. and Masini, N.: Identification of archaeological buried remains based on Normalized Difference Vegetation Index (NDVI) from Quickbird satellite data, IEEE Geosci. Remote Sens., 3, 325–328, 2006.
Melillos, G., Themistocleous, K., Papadavid, G., Agapiou, A., Michaelides, S., Prodromou, M., and Hadjimitsis, D. G.: Integrated use of field spectroscopy and satellite Remote Sensing for defence and security applications in Cyprus, in: Proceedings of SPIE – The International Society for Optical Engineering, Bellingham, USA, 2016a.
Melillos, G., Themistocleous, K., Papadavid, G., Agapiou, A., Prodromou, M., Michaelides, S., and Hadjimitsis, D. G.: Importance of using field spectroscopy to support the satellite remote sensing for underground structures intended for security reasons in the eastern Mediterranean region, Electro-Opt. Remote Sens., 9988, 99880S, https://doi.org/10.1117/12.2240714, 2016b.
Milton, E. J. and Rollin, E. M.: Estimating the irradiance spectrum from measurements in a limited number of spectral bands, Remote Sens. Environ., 100, 348–355, 2006.
Mróz, M. and Sobieraj, A.: Comparison of several vegetation indices calculated on the basis of a seasonal SPOT XS time series, and their suitability for land cover and agricultural crop identification, Technical Sciences, 7, 39–66, 2004.
Papadavid, G., Hadjimitsis, D., Fedra, K., and Michaelides, S.: Smart management and irrigation demand monitoring in Cyprus, using remote sensing and water resources simulation and optimization, Adv. Geosci., 30, 31–37, https://doi.org/10.5194/adgeo-30-31-2011, 2011.
Parker, D. C. and Wolff, M. F.: Remote Sensing, Int. Sci. Technol., 43, 20–31, 1965.
Rondeaux, G., Steven, M., and Baret, F.: Optimization of soil-adjusted vegetation indices, Remote Sens., Environ., 55, 95–107, 1996.
Roujean, J. L. and Breon, F. M.: Estimating PAR absorbed by vegetation from bidirectional reflectance measurements, Remote Sens. Environ., 51, 375–384, 1995.
Rouse, J. W., Haas, R. H., Schell, J. A., Deering, D. W., and Harlan, J. C.: Monitoring the Vernal Advancements and Retrogradation (Greenwave Effect) of Nature Vegetation, Carbohyd. Polym., 32, 65–72, https://doi.org/10.1016/s0144-8617(96)00105-1, 1974.
Sepp, E. M.: Deeply Buried Facilities Operations: Implications for Military Operations, Center for Strategy and Technology, Air War College, Montgomery, Alabama, USA, 38 pp., available at: https://apps.dtic.mil/dtic/tr/fulltext/u2/a425461.pdf (last access: November 2018), 2000.
Steven, M. D., Malthus, T. J., Baret, F., Xu, H., and Chopping, M. J.: Intercalibration of vegetation indices from different sensor systems, Remote Sens., Environ., 88, 412–422, 2003.
Themistocleous, K., Agapiou, A., and Hadjimitsis, D. G.: Unmanned aerial systems and spectroscopy for remote sensing applications in archaeology, in: Proc. 36th International Symposium on Remote Sensing of Environment, XL-7/W3, Berlin, 2015.
Tucker, C. J.: Red and photographic infrared linear combinations for monitoring vegetation, Remote Sens. Environ., 8, 127–150, 1979.
USGS: What are the band designations for the Landsat satellites? Landsat Missions, available at: https://landsat.usgs.gov/using-usgs-spectral-viewer, last access: 5 June 2018.
Winton, H. and Horne, P.: National archives for national survey programmes: NMP and the English heritage aerial photograph collection, in: Landscapes through the Lens, Aerial Photographs and Historic Environment, Aerial Archaeology Research Group, edited by: Cowley, D. C., Standring, R. A., and Abicht, M. J., Oxbow Books, Oxford, Oakville, UK, 7–18, 2010.
Wu, X., Sullivan, J. T., and Heidinger, A. K.: Operational calibration of the Advanced Very High Resolution Radiometer (AVHRR) visible and near-infrared channels, Can. J. Remote Sens., 36, 602–616, 2010.