 | 04 Sep 2018
Surface deformation study for a geothermal operation field
Wenli Wang
Julia Diessl
Michael S. Bruno
GeoMechanics Technologies has investigated the surface deformation that occurred at a geothermal field operation located in New Zealand. The thermal area associated with this field has extensive surface infrastructures that are in close proximity to a lake. Geothermal operations initially began in 1997 while surface subsidence has been observed since early 2004. We were contracted by the client to review and analyze the impact of future development plans on ground level changes in hopes to mitigate further compaction and subsidence in the area. There is significant concern that continued surface subsidence may cause the lake to flood the surrounding area. An integrated 3-D geological model, geomechanical model, and fluid and heat flow model were developed for this study. To ensure accuracy, a history match and calibration was performed on the geomechanical model using historical subsidence survey data and on the fluid and heat flow simulation using historical injection and production data. The calibrated geomechanical model was then applied to simulate future scenarios to predict surface subsidence and provide a guideline to optimize field development plans.
Please read the corrigendum first before continuing.
-
Notice on corrigendum
The requested paper has a corresponding corrigendum published. Please read the corrigendum first before downloading the article.
-
Article
(4371 KB)
-
The requested paper has a corresponding corrigendum published. Please read the corrigendum first before downloading the article.
- Article
(4371 KB) - Full-text XML
- Corrigendum
- BibTeX
- EndNote


Surface subsidence caused by conventional geothermal operations has been observed and studied over many decades. Surface subsidence can negatively impact the construction of facilities, such as buildings, pipelines, and other infrastructure. It can also interrupt the balance of nearby ecosystems. Carefully monitoring the surface level and corresponding management during geothermal operations will reduce the risk of subsidence and other related effects. A location map of the field analyzed in this study is shown in Fig. 1. Operations started in 1997 while surface subsidence has been observed since early 2004 and is expected to continue into the future. The maximum subsidence rate observed was 22 mm year−1 and the average subsidence rate was 6 mm year−1 at a production rate ranging from 60 000 to 65 000 t day−1. This was the primary motivation to review and analyze the impact of development plans on ground level changes. Since produced water from the geothermal operation was re-injected into the reservoir at a colder temperature, both pressure and temperature impacts were studied to evaluate their effects on surface subsidence.
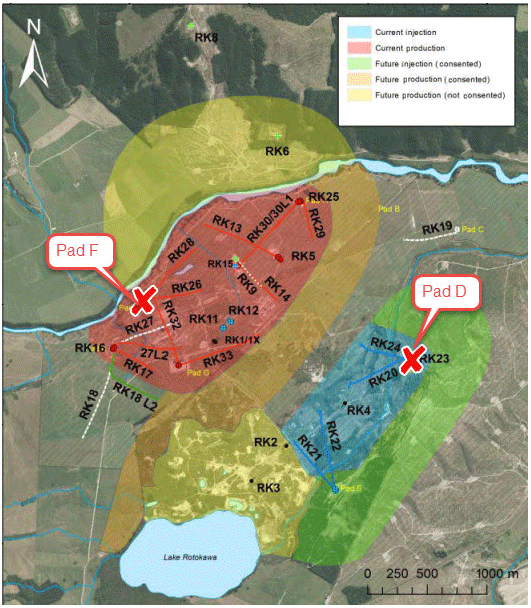
Figure 1System management plan overview showing wells in production area (red) and injection area (blue); Pad F and D are marked well top areas that are used for reference in the result plots.
The sediments overlying the reservoir are supported by both rock matrix and pore pressure in the rock. When pore pressure decreases due to fluid withdrawal, more of the load will be transferred to the rock matrix, resulting in formation compaction. Conversely, when pore pressure increases due to fluid injection, less of the load is carried by the rock matrix, resulting in formation expansion (Bruno, 1992). When the temperature of fluid injected is different than the target formation, the formation temperature will also change, causing induced stresses.
In general, the stresses induced and the resulting damage risk should be determined through 3-D geomechanical modelling and numerical simulation, especially when the geology is complex so that analytical solutions or simplified 2-D approaches are not applicable. However, it is important to consider the underlying physics and fundamental analytical solutions upon which such analyses are based to gain further insight into the important mechanisms and parameters that influence compaction and subsidence.
The surface compaction or expansion induced by pore pressure and temperature changes due to injection or production at a specific point can be estimated through the following expression (modified after Bruno, 1992, and Bruno et al., 2014):
Where H denotes the original reservoir thickness, ΔH is the change in thickness, Cm denotes the material uniaxial compaction coefficient, and α is the linear coefficient of thermal expansion. ΔP and ΔT are the changes in reservoir pressure and temperature, respectively. Note that both pore pressure increase and temperature increase induce expansion. Conversely, a pore pressure decrease and a temperature decrease induce contraction.
If the injection formation was completely free to expand or contract in all directions, there would be no induced stresses. The surrounding formations, however, constrain this deformation. The result is that stresses are induced both within the reservoir and within the surrounding material, including the cap-rock. Considering only an increase in pore pressure, for example, compressive stresses are induced within the injection zone and both tensile and shear stresses are induced in the cap-rock. Cooling has the opposite effect. During cooling, tensile stresses are induced within the injection zone and compressive and shear stresses are induced in the cap-rock. Since temperature and pressure changes both impact the induced stress, the magnitude of each influence will depend on the rock properties (thermal coefficient and compaction coefficient) (Bruno et al., 2014).

Figure 2Workflow procedures developed by Geomechanics Technologies to create consistent and integrated modeling of geological conditions, geomechanical processes, and fluid and heat flow processes.
A general workflow developed by Bruno et al. (2014) was applied in this study. An integrated 3-D model was developed from an existing 3-D geological as well as a fluid and heat flow model, which were provided by the operator of the geothermal field. Using in house procedures to transfer parameters and properties between numerical models – see Fig. 2 – a 3-D geomechanical model was developed. This 3-D grid structure formed the basis of the fluid and heat flow and the geomechanical model. Production and injection scenarios were modelled by applying the fluid and heat flow model. Due to the available interfaces in the workflow, the models can be developed and run independently in different simulators and then coupled to each other. As in this study, the fluid and heat flow model was run by the operator of the geothermal plant and the results were integrated into the workflow. The pressure and temperature output from the fluid and heat flow simulation were transferred to the 3-D geomechanical model to estimate the surface deformation. A history match was first performed on the geomechanical model using historical subsidence survey data. In a final step, the calibrated model was applied to simulate future scenarios to predict surface subsidence and provide a guideline to optimize field development plans.
Primary rock mechanical properties (i.e. Young's modulus, Poisson's ratio, etc.) were provided by the field operator based on core measurements from a nearby field, or were estimated from publically available data (Siratovich et al., 2014), Thermal expansion coefficient data were also estimated based on a nearby geothermal field. As seen from Eq. (1), the uniaxial compaction coefficient and coefficient of thermal expansion are important factors influencing the subsidence and compaction of a formation. These are the parameters that were used to calibrate the model during the history match.
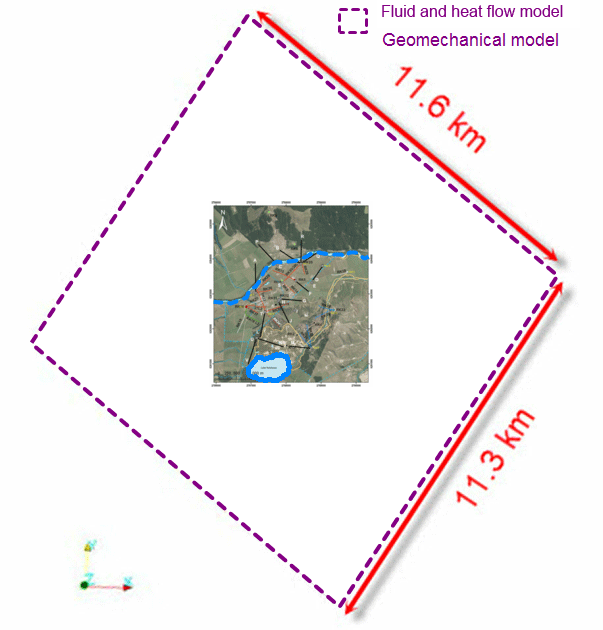
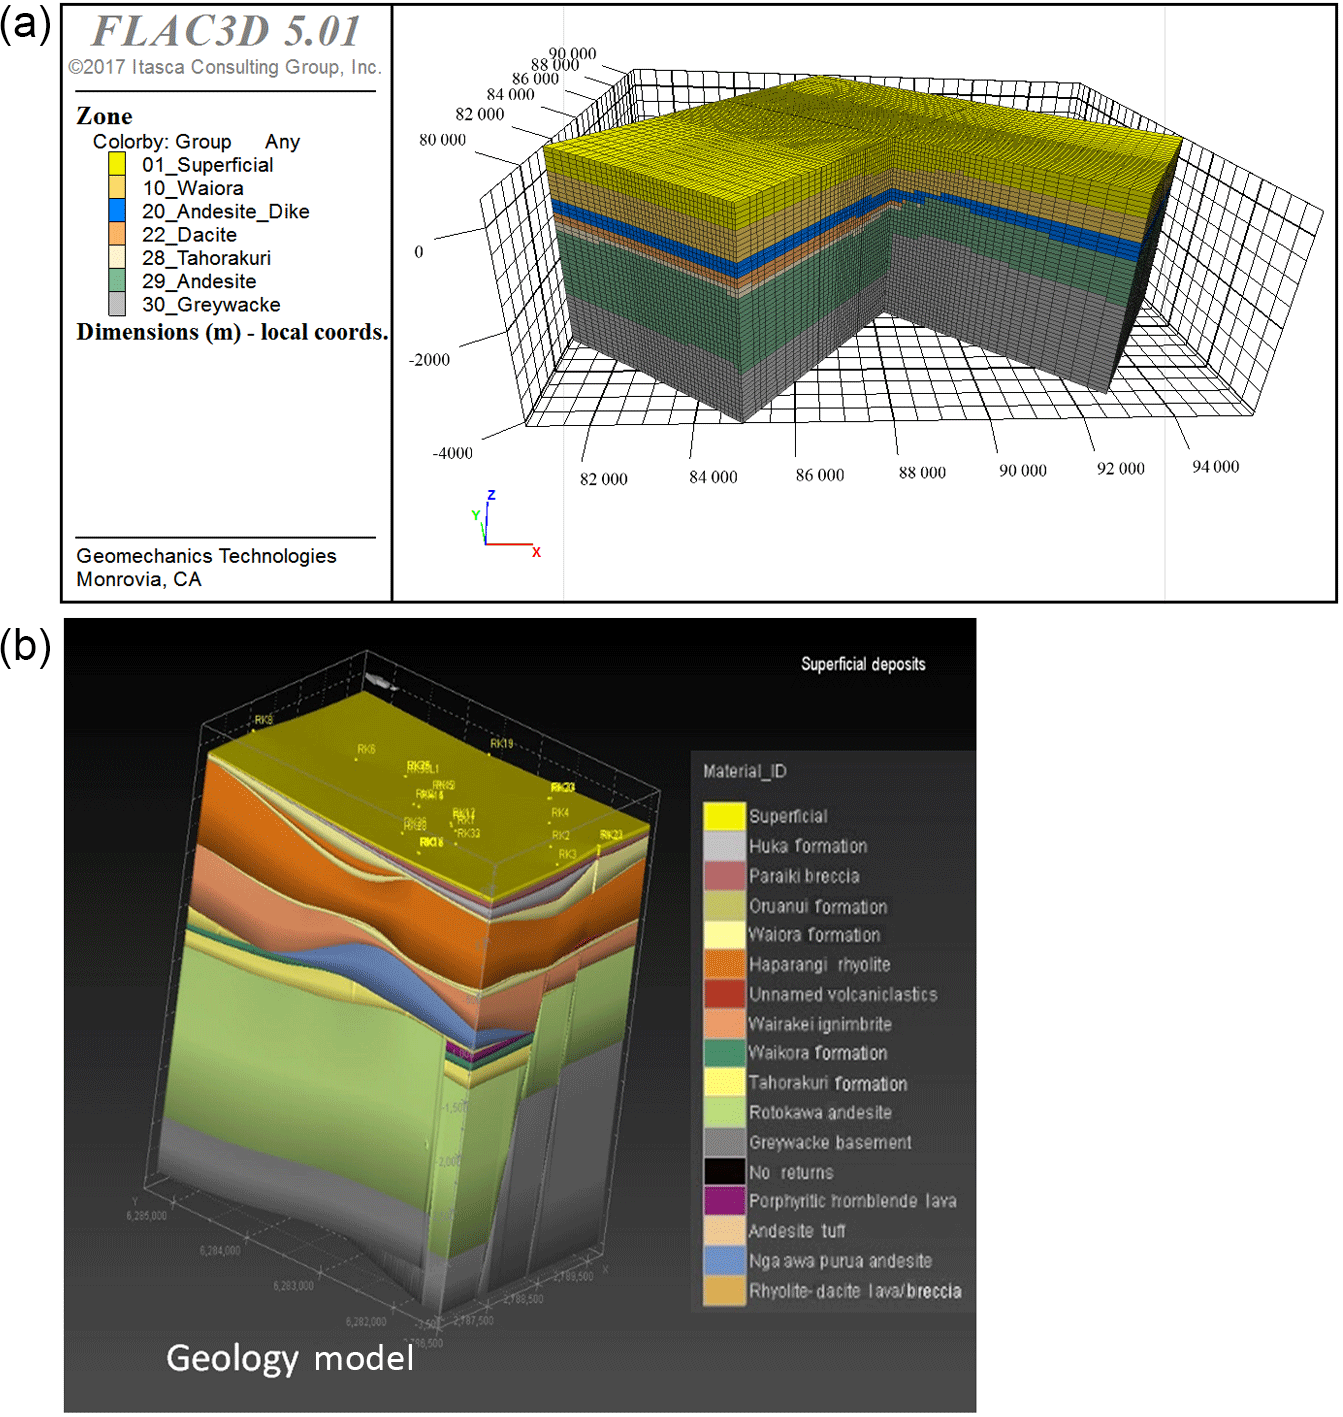
Figure 4Integrated geological (a) and geomechanical model (b) – some geological layers were combined, due to coarser resolution of the geomechanical model compared to the geological model.
The 3-D geomechanical model is based on input from the 3-D geological model, and integrated with the output from the fluid and heat flow model. The geomechanical model was constructed using the FLAC3D software package (Itasca Consulting Group, 2012). In Fig. 3, the numerical modelling boundaries are shown in comparison with the area of interest. We determined that the areal extent of the numerical model is large enough to exclude boundary effects. The geomechanical model grid was created independently with regards to the geological and fluid flow models. However, the model did capture the main structural horizons constructed in the geological model. Pressure and temperature changes, which induced stress changes in the geomechanical model, were modelled using the Tough2 (Pruess et al., 1999) simulator. This model was setup by the field operator and the output for different production/injection scenarios was provided and used as input for the geomechanical model.
The 3-D geomechanical model boundary is the same as for the fluid and heat flow model. It covers an area of about 11 600×11 300 m in lateral extent, and about 4600 m in vertical extent. The grid resolution is highest in the reservoir section with a minimum cell size of 1.03×10⁶ m3. The mesh consisted of 263 250 cells. Roller boundary conditions were used on the bottom and sides and free movement was used on the top of the model. The integrated geological and geomechanical model is shown in Fig. 4.
6.1 History matching results
The 3-D geomechanical model described above was applied to estimate historical surface deformation over the four years of field observation. The time period from 2009–2013 was selected for the history match due to the limited surface survey data prior to 2009 and because injection and production locations for future operations should be similar to those during that time period. The resulting pressure and temperature values were obtained from the Tough2 simulation for that same period. The pressure change observed ranged from −27 bar (in the production area) to +24 bar (in the injection area). The greatest cooling observed is −85 ∘C. The bulk modulus and shear modulus values were assigned to each formation layer based on the rock properties provided. The uniaxial compaction coefficient (Cm) and thermal expansion (α) material properties were adjusted until the resulting maximum surface deformation matched the observed maximum subsidence of about 50 mm over the simulated historical period.
After the adjustment, a revised value for Cm and α was obtained based on the best history match. From the history matching results, the Cm for each layer was reduced from the value assumed. The range of reduction is between 48 % and 68 % of the original value. The reduction in uniaxial compaction coefficient from original assumed values to final history match values may be caused by two factors: first, the geothermal operations in the current field occur deeper than in the field from which the original data was obtained; and second, the observed subsidence rates for the current field are lower than observations from the offset field.
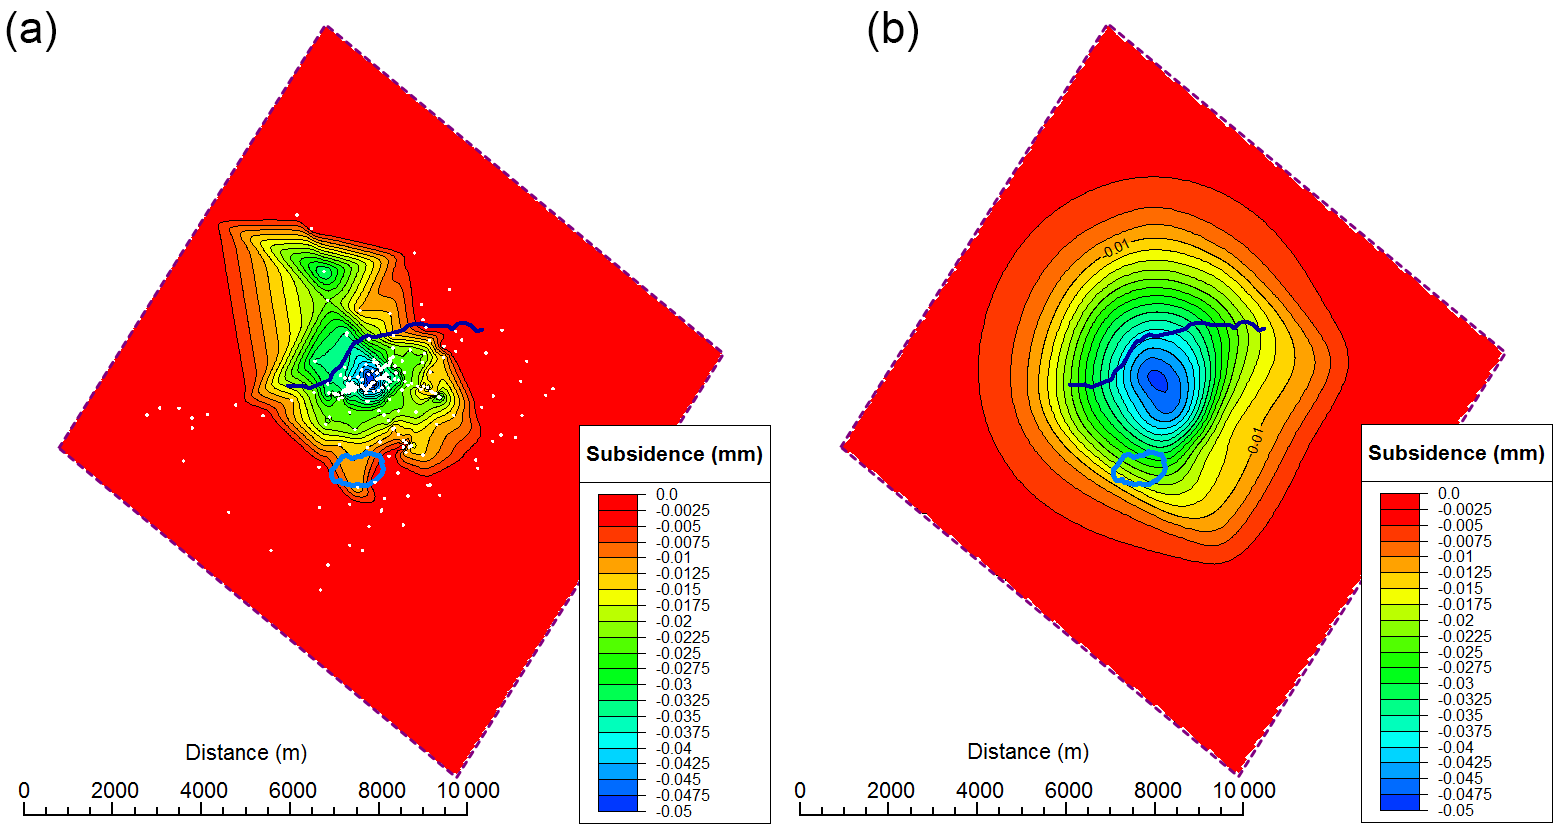
Figure 5Comparison of surface displacement between measured data in mm (a) and history match result in m (b) for 2009–2013 – white dots in the left plot show the locations of the measurement points.
Figure 5 presents a comparison of 3-D geomechanical model results and field observations for surface deformation over the four year observation period. The left figure on the plot is the field measured data, and the right figure is the history match result. The limited availability of benchmarks in the field, combined with limited data interpolation and extrapolation in plotting, leads to some unrealistic distortion of the surface subsidence pattern.
The results from the history match indicate a reasonable match for the measured maximum subsidence value and location, but the model results indicate a more smooth and less distorted surface deformation pattern than that based on measured benchmarks. Other than issues with limited benchmarks, it is also possible that the field data shows localization and elongation of subsidence due to fault and fracture movement, which is currently not included in the model.
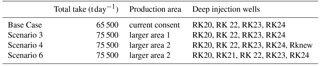
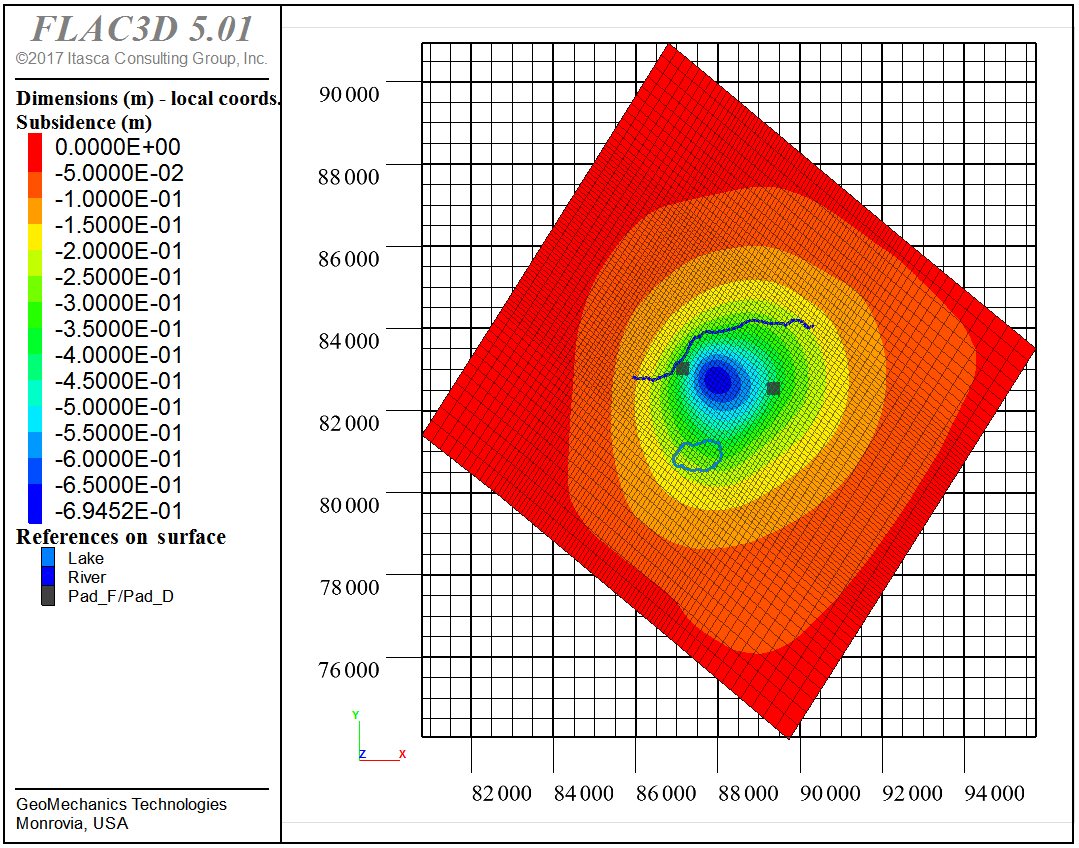

Figure 7Future prediction of surface subsidence and tilt for all scenarios over period years 2015–2064.
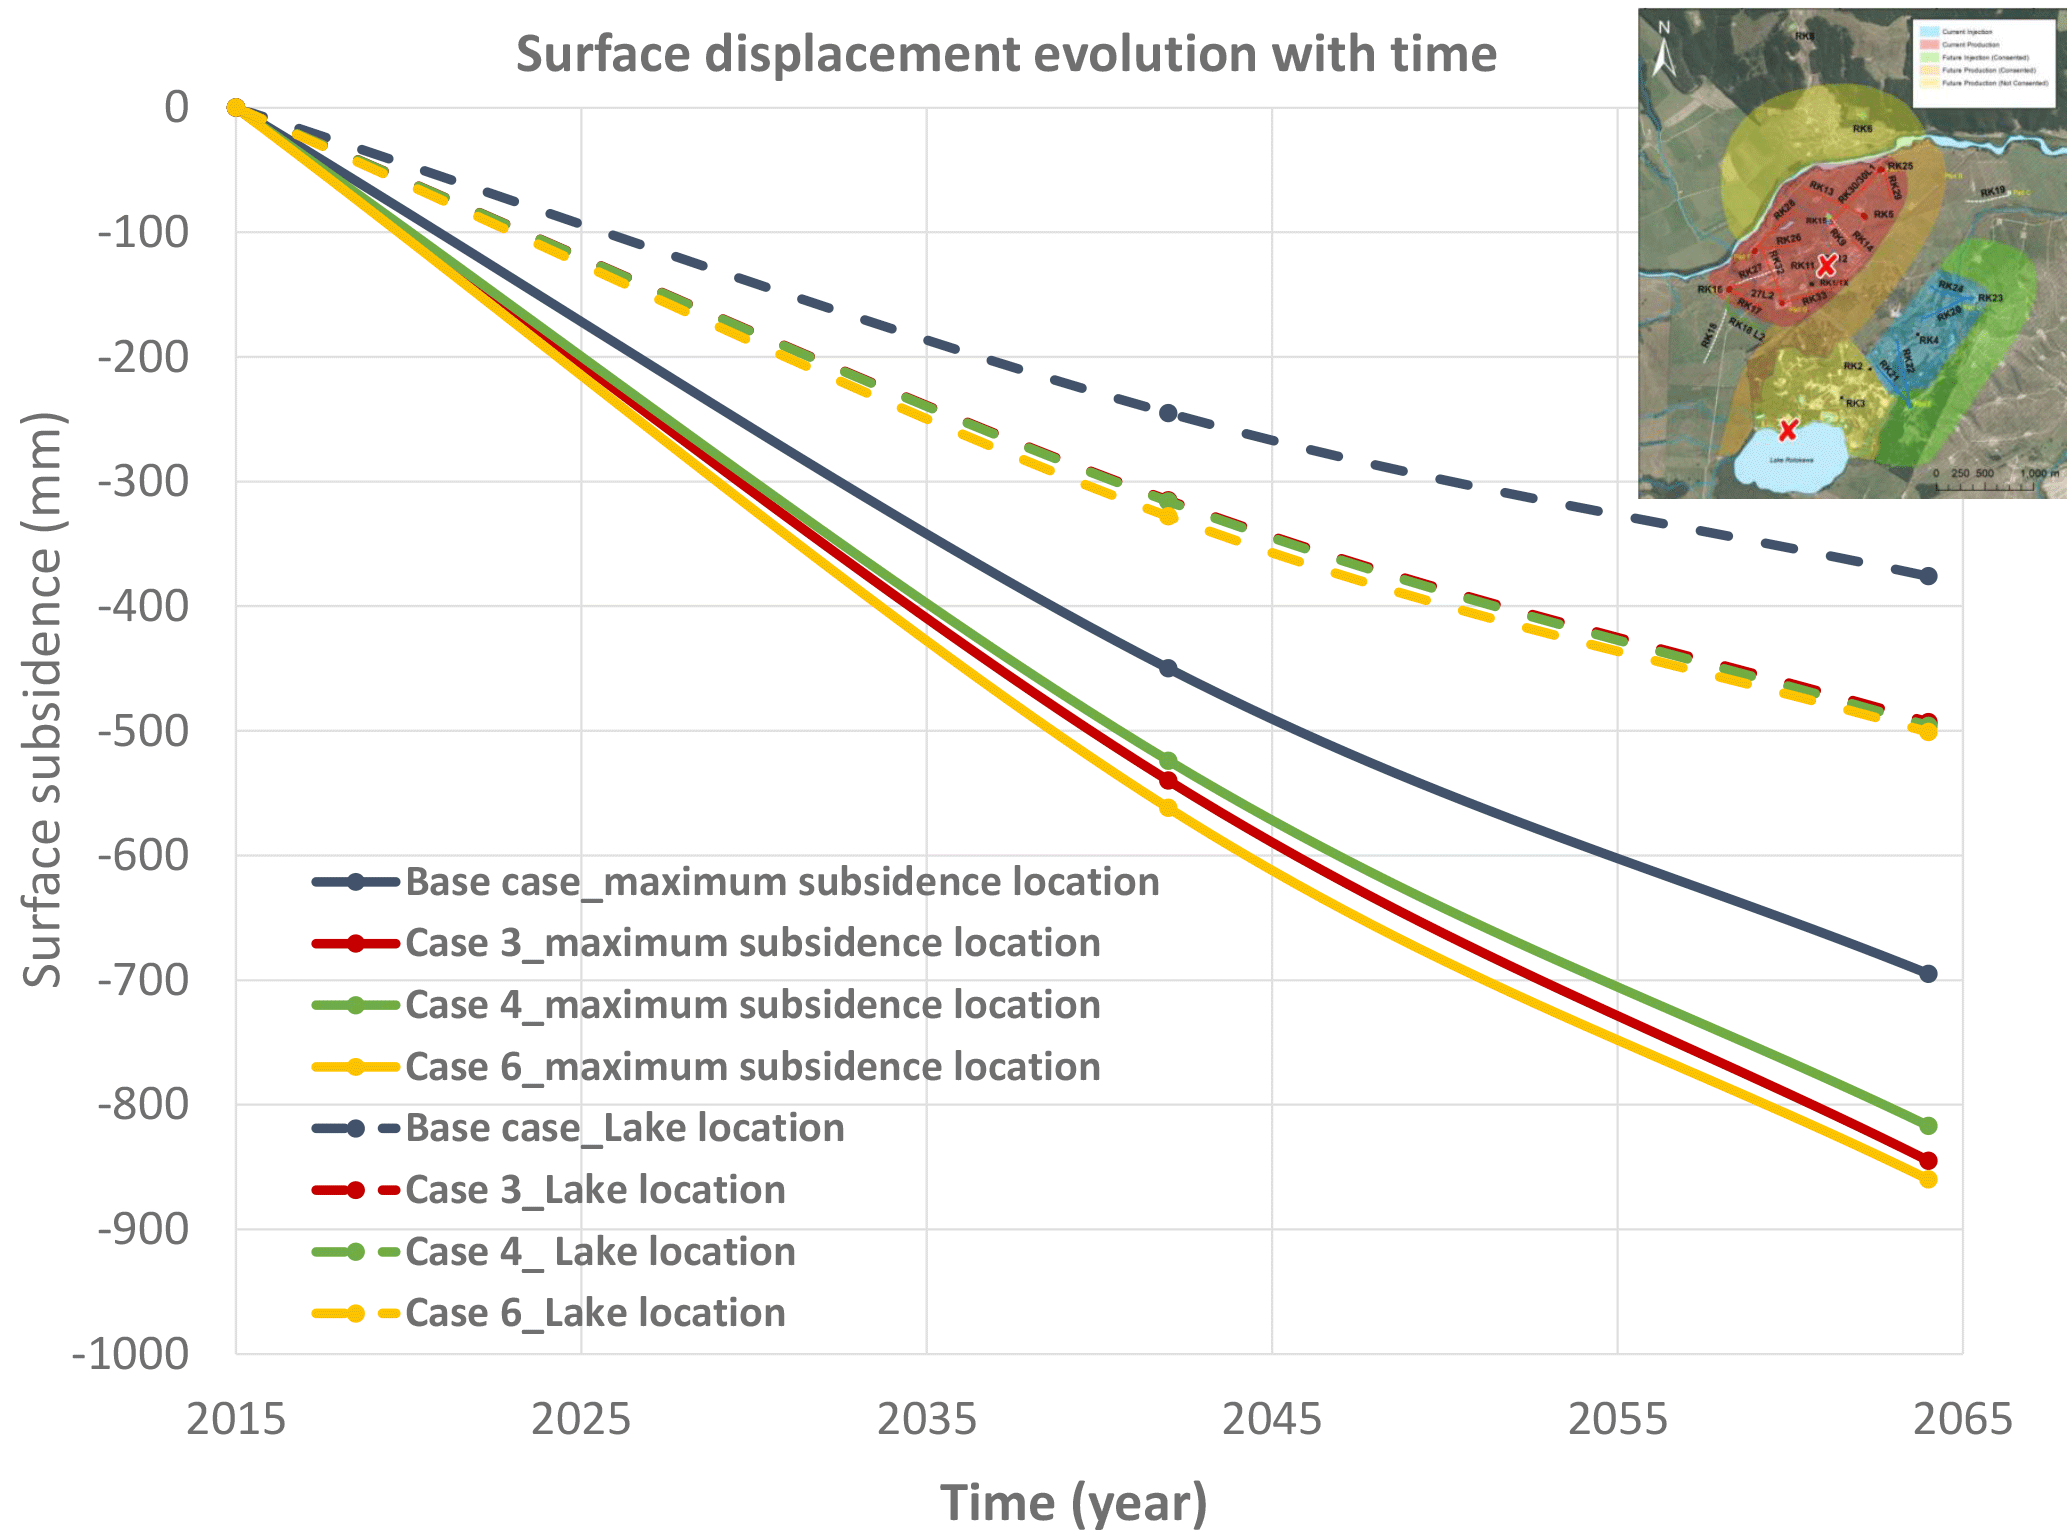
Figure 8Surface displacement evolution with time at lake location and maximum subsidence location (see red marks in overview map) for all scenarios.
6.2 Future prediction results and discussion
Using the history matched geomechanical model, several scenarios (as listed in Table 1) were simulated to predict future subsidence and the anticipated level of surface tilt (differential movement). The cases mainly varied by the amount of water produced and the number and position of injectors. The change in pressure remained in the same order of magnitude as during the history match period in the production area. In the injection area, a maximum temperature decrease of about 160 ∘C was estimated, which was also accompanied by a local pressure decrease of about 100 bar due to the higher density of cooler water.
These results assisted our client to evaluate the risk of surface deformation to determine whether any surface structures or features would be damaged due to ongoing geothermal operations (in this case, whether a potential higher water level may develop in a lagoon/lake where the outlet of the lake will experience less subsidence than the overall area of the lake). The results from such future prediction simulation provide guidance to choose the appropriate production rate and injection rate for future operations in order to not cause any surface infrastructure problems.
The results indicating surface subsidence for the base case over the next 50 years production are shown in Fig. 6. A maximum subsidence of 0.7 m is estimated for the scenario of producing 65 500 t day−1. A North-South profile of the surface subsidence and the corresponding surface tilt is presented in Fig. 7 along with the results for the other scenarios modelled. It is observed that an increase of 10 000 t day−1 in production would increase the maximum subsidence to 0.85 m.
To better illustrate the surface subsidence evolution with time, surface deformation at two locations (one is close to the maximum subsidence location and the other one is close to the lake as shown at the red star locations) are plotted in Fig. 8. As can be seen in the plot, subsidence rate tends to decrease over time. The pronounced change in subsidence rate is due to a limited amount of data output during the simulation.
The above analyses indicate that subsidence will be distributed over a relatively large area, resulting in very little differential movement (surface tilt). The anticipated levels of surface tilt – maximum of 60 mm/1000 m – are relatively small and are not expected to cause damage to any surface structures or features.
Over a 50 year period, the difference in subsidence between the lake outlet and the lagoon area is about 100 mm. This may have an impact on the northern edge of the lake, resulting in an increase in mean-water level.
The results and findings from the investigation support the following set of conclusions:
-
Integrated 3-D geology, fluid flow, heat flow and geomechanical models can be applied to the geothermal industry to resolve geomechanics issues.
-
A reasonable history match of simulated surface subsidence from integrated 3-D models to field measurements was obtained.
-
A modest amount of subsidence for various future scenarios can be expected. Based on the reservoir simulation and geomechanical modeling results, we anticipate that over the next 50 year period the surface will continue to subside in this geothermal field due to the continuing decline in pressure and temperature caused by geothermal operations. Nevertheless, the rate of subsidence will begin to decline over the years.
-
More subsidence is expected for scenario 3 and 4 than that of the base case. The additional take of 10 000 t per day will have a relatively small impact on future subsidence relative to the base case scenario. These are relatively modest amounts of subsidence, about 16 mm year−1 for scenarios 3 and 4 and 14 mm year−1 for the base case.
-
The difference in subsidence (surface tilt) between the lake outlet and the lagoon area is relatively large and this might result in an increase in mean-water level on the northern edge of the lake.
-
Operational guidelines (i.e. production/injection rate and location) were recommended based on the simulation results.
Since this the work is based upon a study for a company, the data sets are not available publicly due to confidentiality agreement with the client. Workflow procedures for transferring data between the modeling codes are proprietary. Geomechanical modeling software is available under https://www.itascacg.com/software/flac3d, last access: 20 August 2018 (Itasca Consulting Group, 2018); Fluid and heat flow modeling software is available under https://tough.lbl.gov/, last access: 20 August 2018 (Lawrence Berkeley National Laboratory, 2018).
WW and JD prepared the manuscript based on the study performed. MSB supported the study and article with technical advice.
The authors declare that they have no conflict of interest.
This article is part of the special issue “European Geosciences Union General Assembly 2018, EGU Division Energy, Resources & Environment (ERE)”. It is a result of the EGU General Assembly 2018, Vienna, Austria, 8–13 April 2018.
This study is based upon work provided to Mercury. The authors are grateful
for their support and permission to publish this work.
Edited by: Kristen Mitchell
Reviewed by: Sandra Schumacher and one anonymous referee
Bruno, M. S.: Subsidence-Induced Well Failure, SPE Drilling Engineering, 7, 148–152, https://doi.org/10.2118/20058-PA, 1992.
Bruno, M. S., Lao, K., Diessl, J., Childers, B., Xiang, J., White, N., and van der Veer, E.: Development of Improved caprock Integrity Analysis and Risk Assessment Techniques, Enrgy. Proced., 63, 4708–4744, https://doi.org/10.1016/j.egypro.2014.11.503, 2014.
Itasca Consulting Group: FLAC3D – Fast Lagrangian Analysis of Continua in 3 Dimensions – Theory and Background, Itasca Consulting Group Inc., Minnesota, 2012.
Itasca Consulting Group: 3D geomechanical & geotechnical continuum numerical modeling software, available at: https://www.itascacg.com/software/flac3d, last access: 20 August 2018.
Lawrence Berkeley National Laboratory: TOUGH, available at: https://tough.lbl.gov/, last access: 20 August 2018.
Pruess, K., Oldenburg, C., and Moridis, G.: TOUGH2 User's Guide, Earth Sciences Division, University of California Berkeley, CA 94720, 1999.
Siratovich, P. A., Heap, M. J., Villenueve, M. C., Cole, J. W., and Reuschlé, T.: Physical property relationships of the Rotokawa Andesite, a significant geothermal reservoir rock in the Taupo Volcanic Zone, New Zealand, Geothermal Energy, 2, 10, https://doi.org/10.1186/s40517-014-0010-4, 2014.
The requested paper has a corresponding corrigendum published. Please read the corrigendum first before downloading the article.
- Article
(4371 KB) - Full-text XML