 | 30 Aug 2018
Investigation of the influence of earthquakes on the water level in the geothermal reservoir of Waiwera (New Zealand)
Michael Kühn
Tim Schöne
The water level of the Waiwera geothermal reservoir is mainly governed by the production operations due to a commonly strong pumping signal. However, in the hours and days after the Kaikoura earthquake on 14 November 2016, it increased by more than 0.5 m, indicating that seismic events can have an influence as well. In a continuous time series consisting of monthly means of water level data and pumping rates starting in 1986, we tried to determine if events above a certain strength alter groundwater dynamics at Waiwera in general. We applied an empirical equation and calculated the on-site seismic energy density from earthquake magnitudes and distances. All recorded earthquakes with a magnitude above 4 within a radius of about 1500 km around New Zealand have been taken into account. A clear correlation cannot be proven but none of the recorded earthquakes led to such a high energy density in Waiwera as the Kaikoura event did. For the future, it is recommended to increase the resolution of the metred water production rates to daily averages to improve the detectability of water level changes following earthquakes.
- Article
(2752 KB) - Full-text XML
- BibTeX
- EndNote


The warm water reservoir of Waiwera on the North Island of New Zealand has been known to the indigenous people, the Maori, for many centuries. It is located about 40 km north of Auckland below the village (Fig. 1a). The area of interest covers the township and the estuary of the Waiwera River (Fig. 1b). Increased water temperatures are observed of up to 50 ∘C in an area of approximately 1 km2 (Fig. 1c). The reservoir is located at a depth of up to 400 m, and the geothermal water enters it via a fault at the base (Kühn and Stöfen, 2005).
Its commercial and private use for hotels and spas by the European immigrants began in 1863. Until 1969, the installed wells were all artesian (ARWB, 1980). As a result of overproduction, the warm water has to be pumped from the reservoir since then (Kühn and Stöfen, 2005). Therefore, in the 1980s, a water management plan was adopted by the Auckland Council to protect the reservoir and preserve its historic and tourist location (Rose and Zemansky, 2013). In order to better examine the behaviour of the reservoir, a monitoring well (400 m deep; Fig. 1c) was drilled in the 1980s (Kühn and Altmannsberger, 2016). Since then, the water level has been registered (Kühn et al., 2016). It is influenced by the vertical flow component of the geothermal water entering from the bottom of the reservoir; therefore, varying densities of the water due to differing temperatures and salinities exist. Other factors controlling the water level are drawdown from nearby geothermal water production wells, precipitation of rain, tidal influence of the nearby ocean and barometric pressure. Review of water level data on a long-term mean basis outlined the latter three factors are not relevant (Chapman, 1998). Water levels in the monitoring well generally appear to be inversely related to the total production rate with a strong pumping signal but there are unexplained anomalies to be found (Kühn and Schöne, 2017).
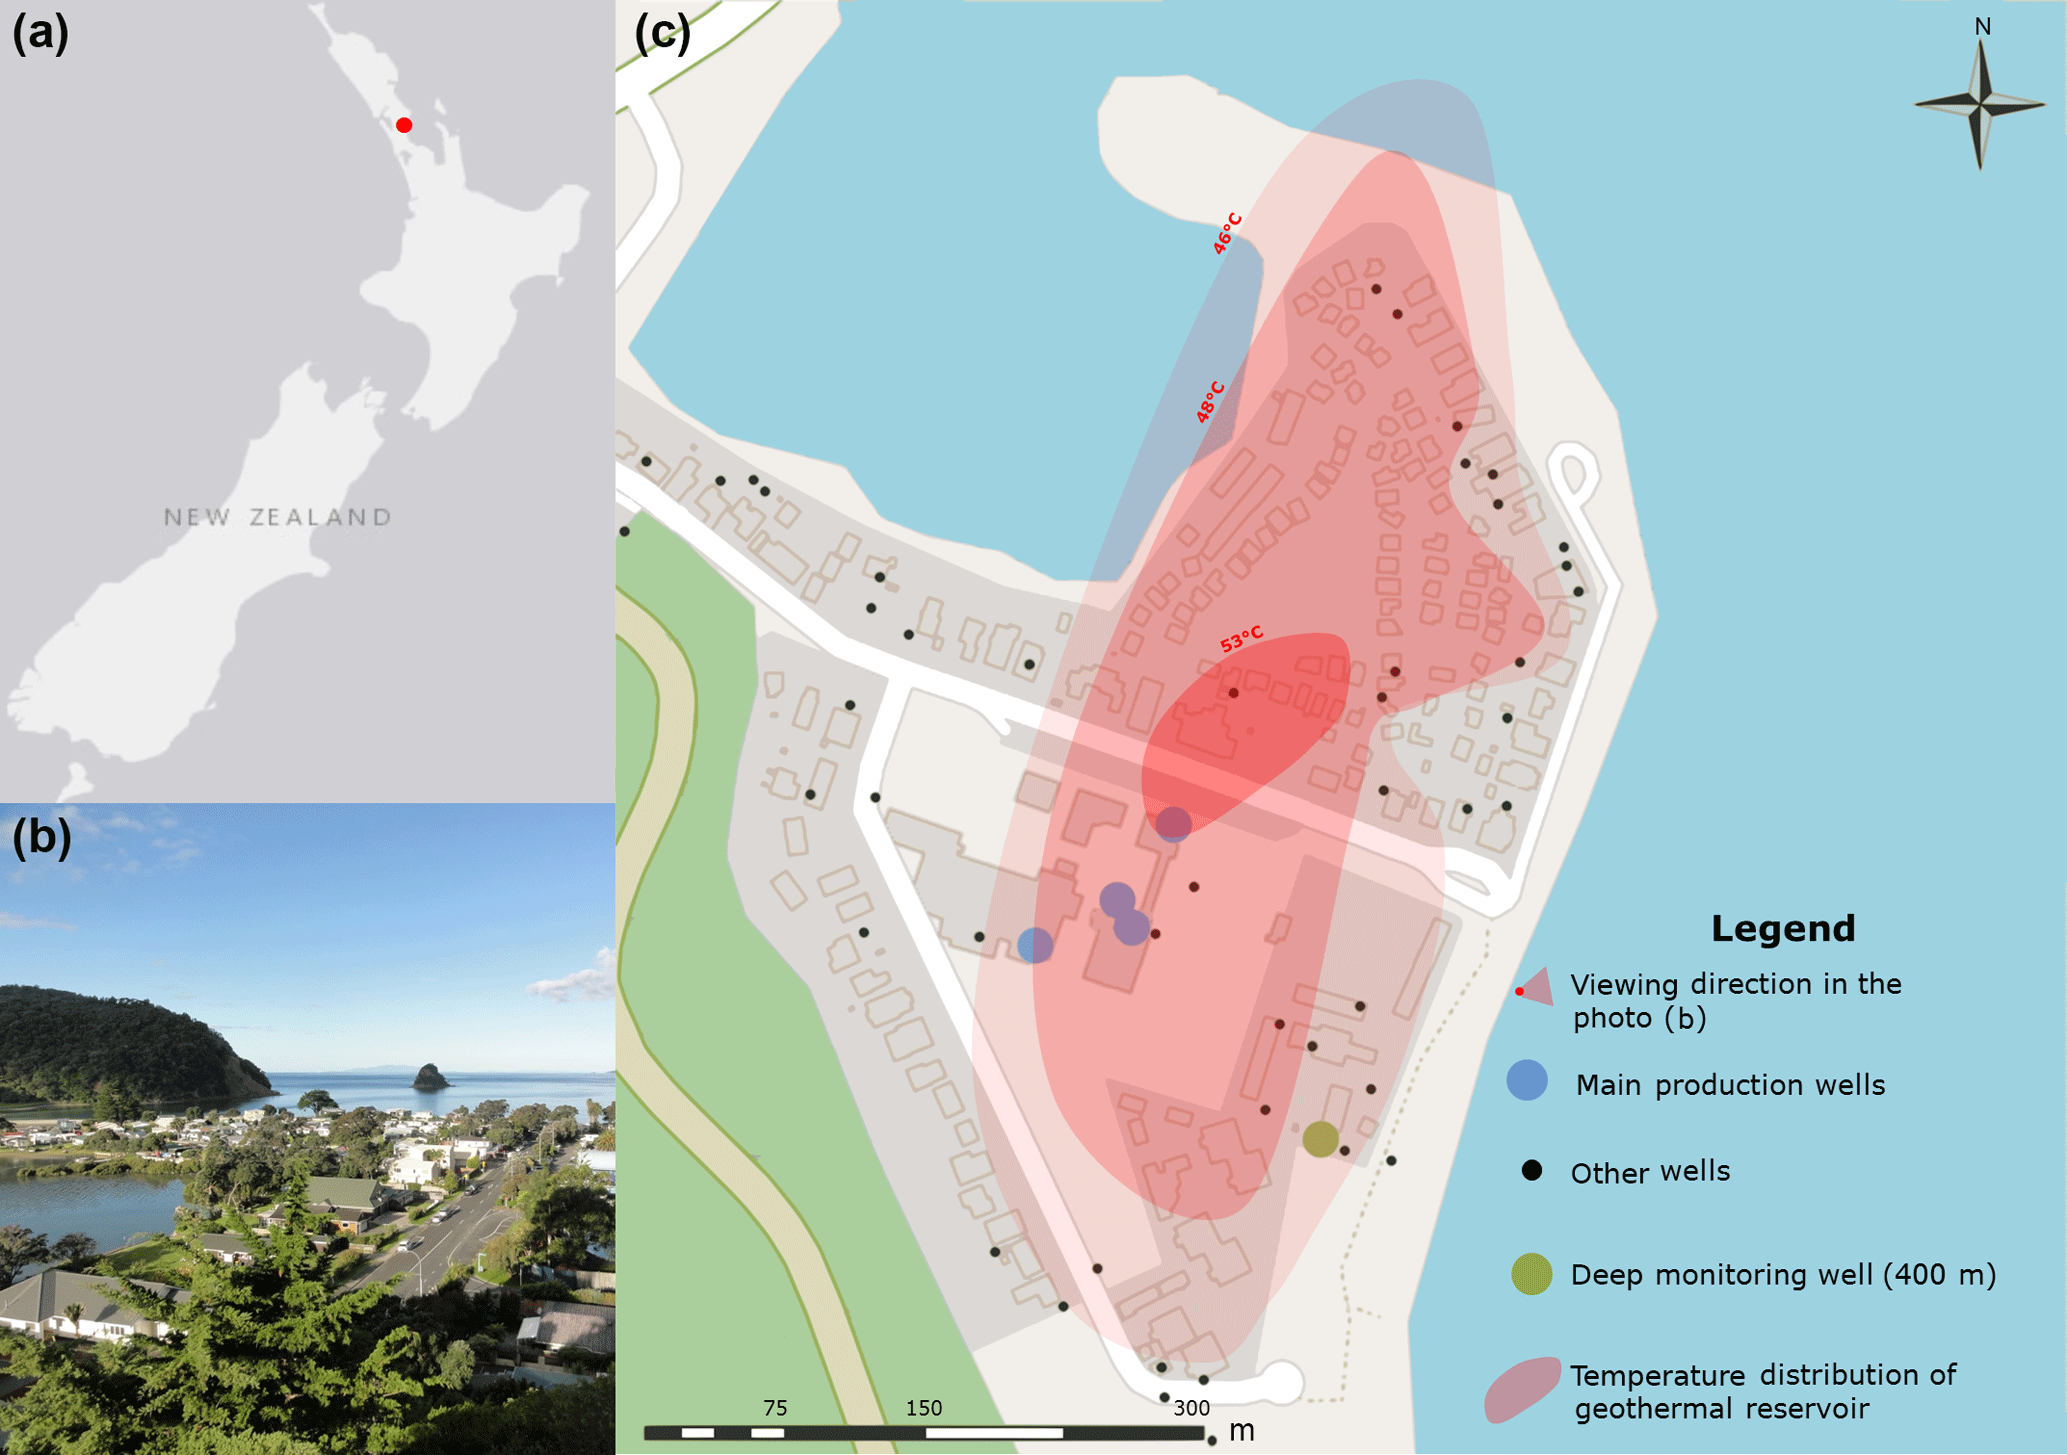
Figure 1Location of Waiwera on the Northern Island of New Zealand (a). Photograph of the village (b). Map of Waiwera (c) showing locations of the main production wells (blue dots), smaller wells of mainly private users (black dots), the monitoring well (green dot) and the approximate temperature distribution of the geothermal reservoir.
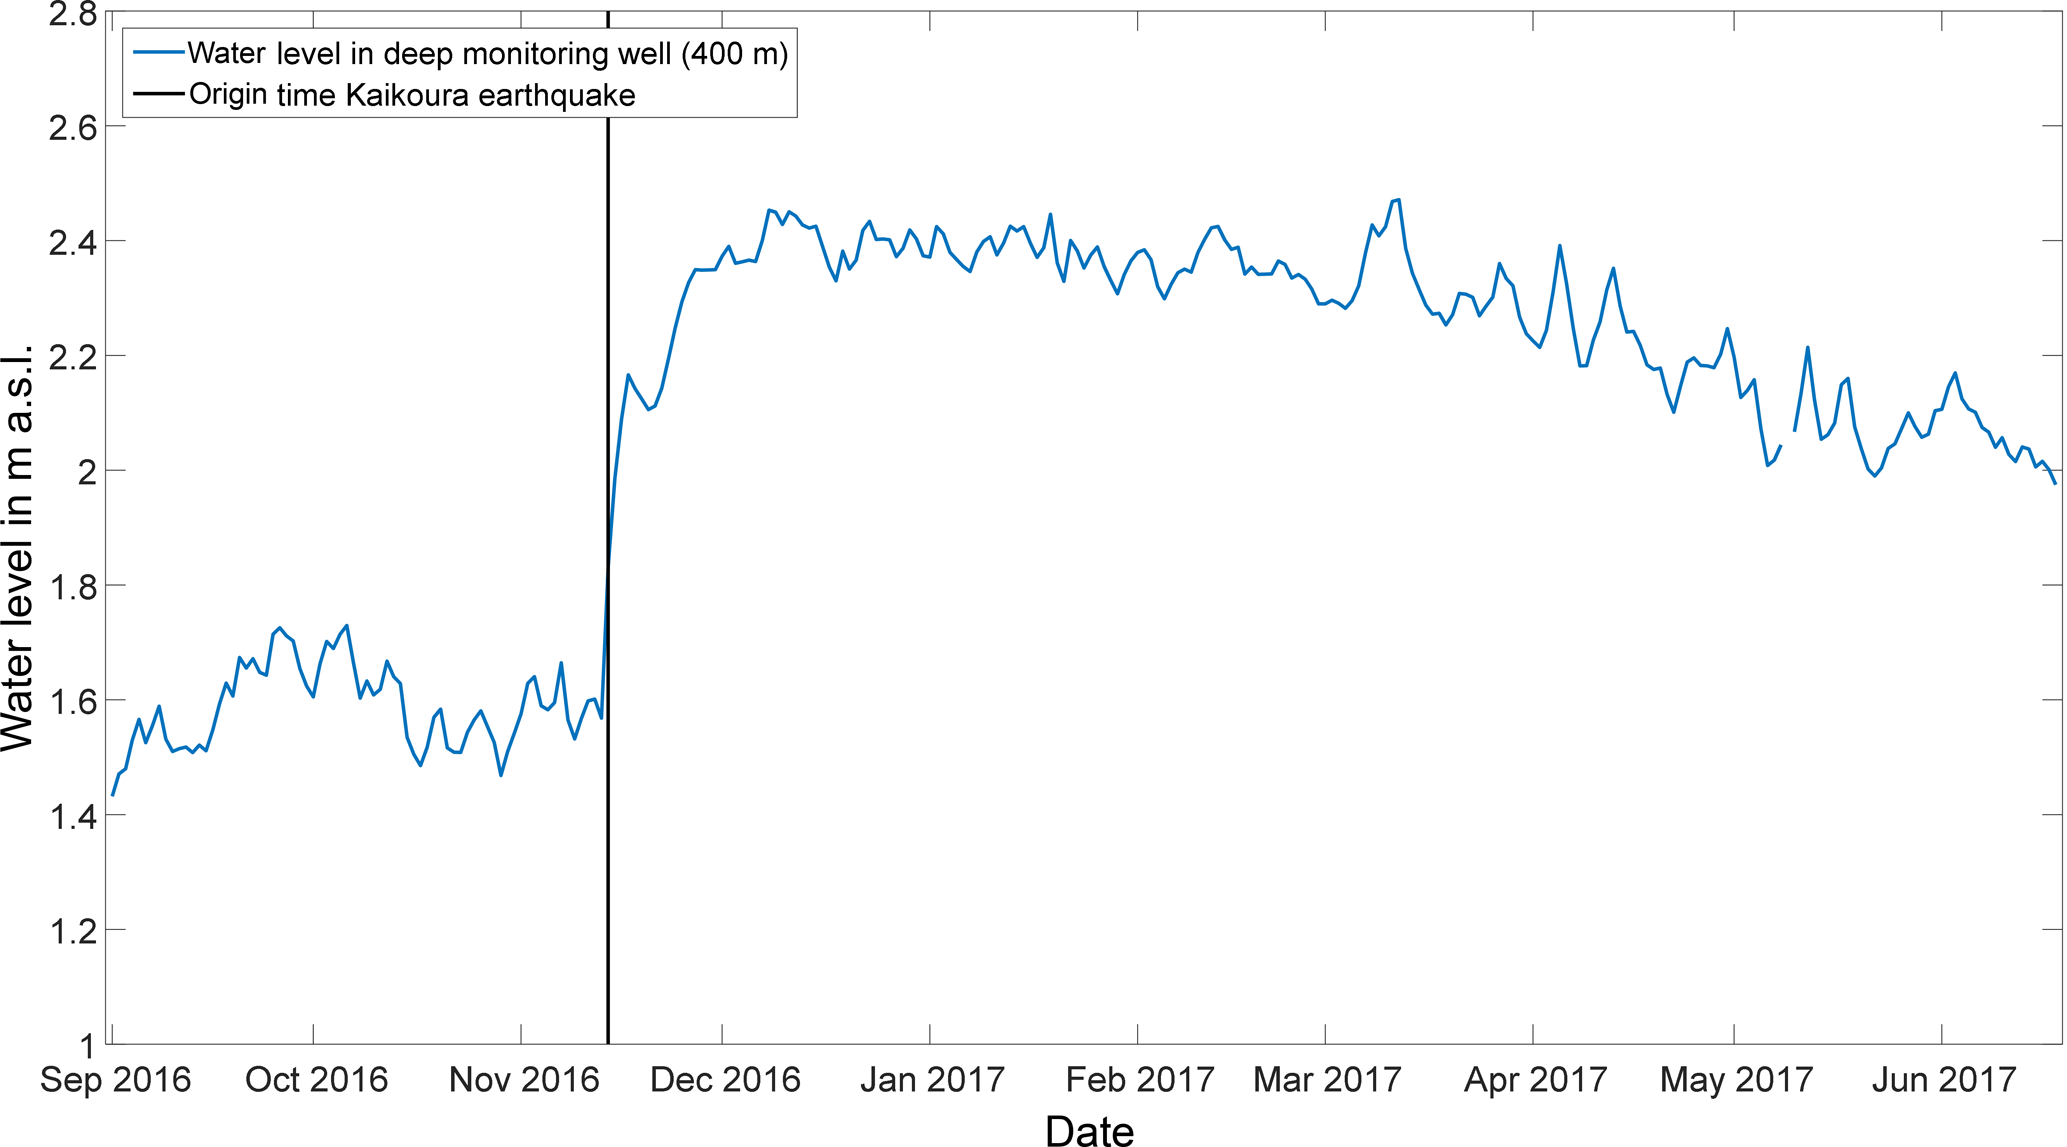
Figure 2Water level, given as a daily mean, in the monitoring well rises by more than 0.5 m during the days and weeks after the Kaikoura earthquake of 14 November 2016 and reduces only slowly during months towards the level of origin.
A hypothesis to explain those anomalies is water level changes due to and during earthquakes. Wang and Manga (2010) compiled and documented observed hydrologic changes of this kind and showed that they occur mostly in the shallow subsurface (< 1 km depth). However, they state that the triggering mechanism still remains intriguing and the underlying processes enigmatic. As a result, Wang and Manga (2010) concluded that field monitoring is needed to assess far-field hydrologic responses to earthquakes in particular.
Because the water level in the monitoring well at Waiwera increased by more than 0.5 m in the hours and days after the Kaikoura earthquake on 14 November 2016 (Fig. 2) and artesian flow was temporarily observed from various production wells, as reported by residents, we decided to explore the existing data sets of water level and production rates again. The question was if previously observed anomalies can be correlated to any earthquake event. The quantity we considered is the seismic energy density, which can be empirically calculated from the earthquake magnitude and the distance of the hydrogeological event to the earthquake epicentre (Wang and Chia, 2008). For the investigations presented here, we took into account all recorded earthquakes with a magnitude above 4 since 1986 around New Zealand, consistent with the available data sets of water level measurement and metred production rates.
The water allocation and management plan of the Auckland Council obligates that abstraction rates from the geothermal reservoir are metred since 1986 (ARWB, 1987). Measurements of the reservoir water level date back even longer. However, for the correlation of the water level data with the production rates, we were therefore restricted to the period from May 1986 to June 2017. Nevertheless, three decades of data are available. The water level is measured every 15 min but unfortunately production rates are only given with monthly means. Because consistent and complete data sets are the fundament for correlations, we work with monthly means for both. We calculate the Pearson correlation coefficient (PCC) which describes strength and direction of the linear relationship between production rate and water level quantified between −1 (strong negative) and +1 (strong positive).
The data basis for the investigations has been the water level time series measured in the monitoring well of the geothermal reservoir (Fig. 1c), the metred total production rate of the main production wells (Fig. 1c) and all earthquakes above a magnitude of 4 within a search area of 5000 km by 3000 km around New Zealand, all for the period from May 1986 until June 2017. The water level time series comprises a data gap between October 2015 and August 2016 due to problems with the device. The total number of earthquakes considered has been 17 500 (http://quakesearch.geonet.org.nz). In general, 93 % of the earthquakes are within a radius of 1000 km to Waiwera. The ones with higher magnitudes are generally further away, which can be deduced as well by a higher occurrence density of earthquakes in the vicinity of the alpine fault.
Hydrological impacts of earthquakes on water levels in wells of reservoirs have been documented for a long time (Wang and Manga, 2010). They seem to be associated with seismic waves and can be estimated empirically for the near and intermediate field from the on-site seismic energy density, which is defined as the maximum energy e available in a unit volume to do work on rocks or sediments calculated from magnitude M and distance r from the earthquake epicentre to the observed event as given in Eq. (1), published by Wang and Chia (2008):
The relation in Eq. (1) is entirely empirical and can only be regarded as a first-order approximation (Wang and Manga, 2010). Nevertheless, magnitude and distance of an earthquake are two parameters that are easily available. In the absence of similar relations for other geologically specific locations, Wang et al. (2008) assume it may also be applicable elsewhere.
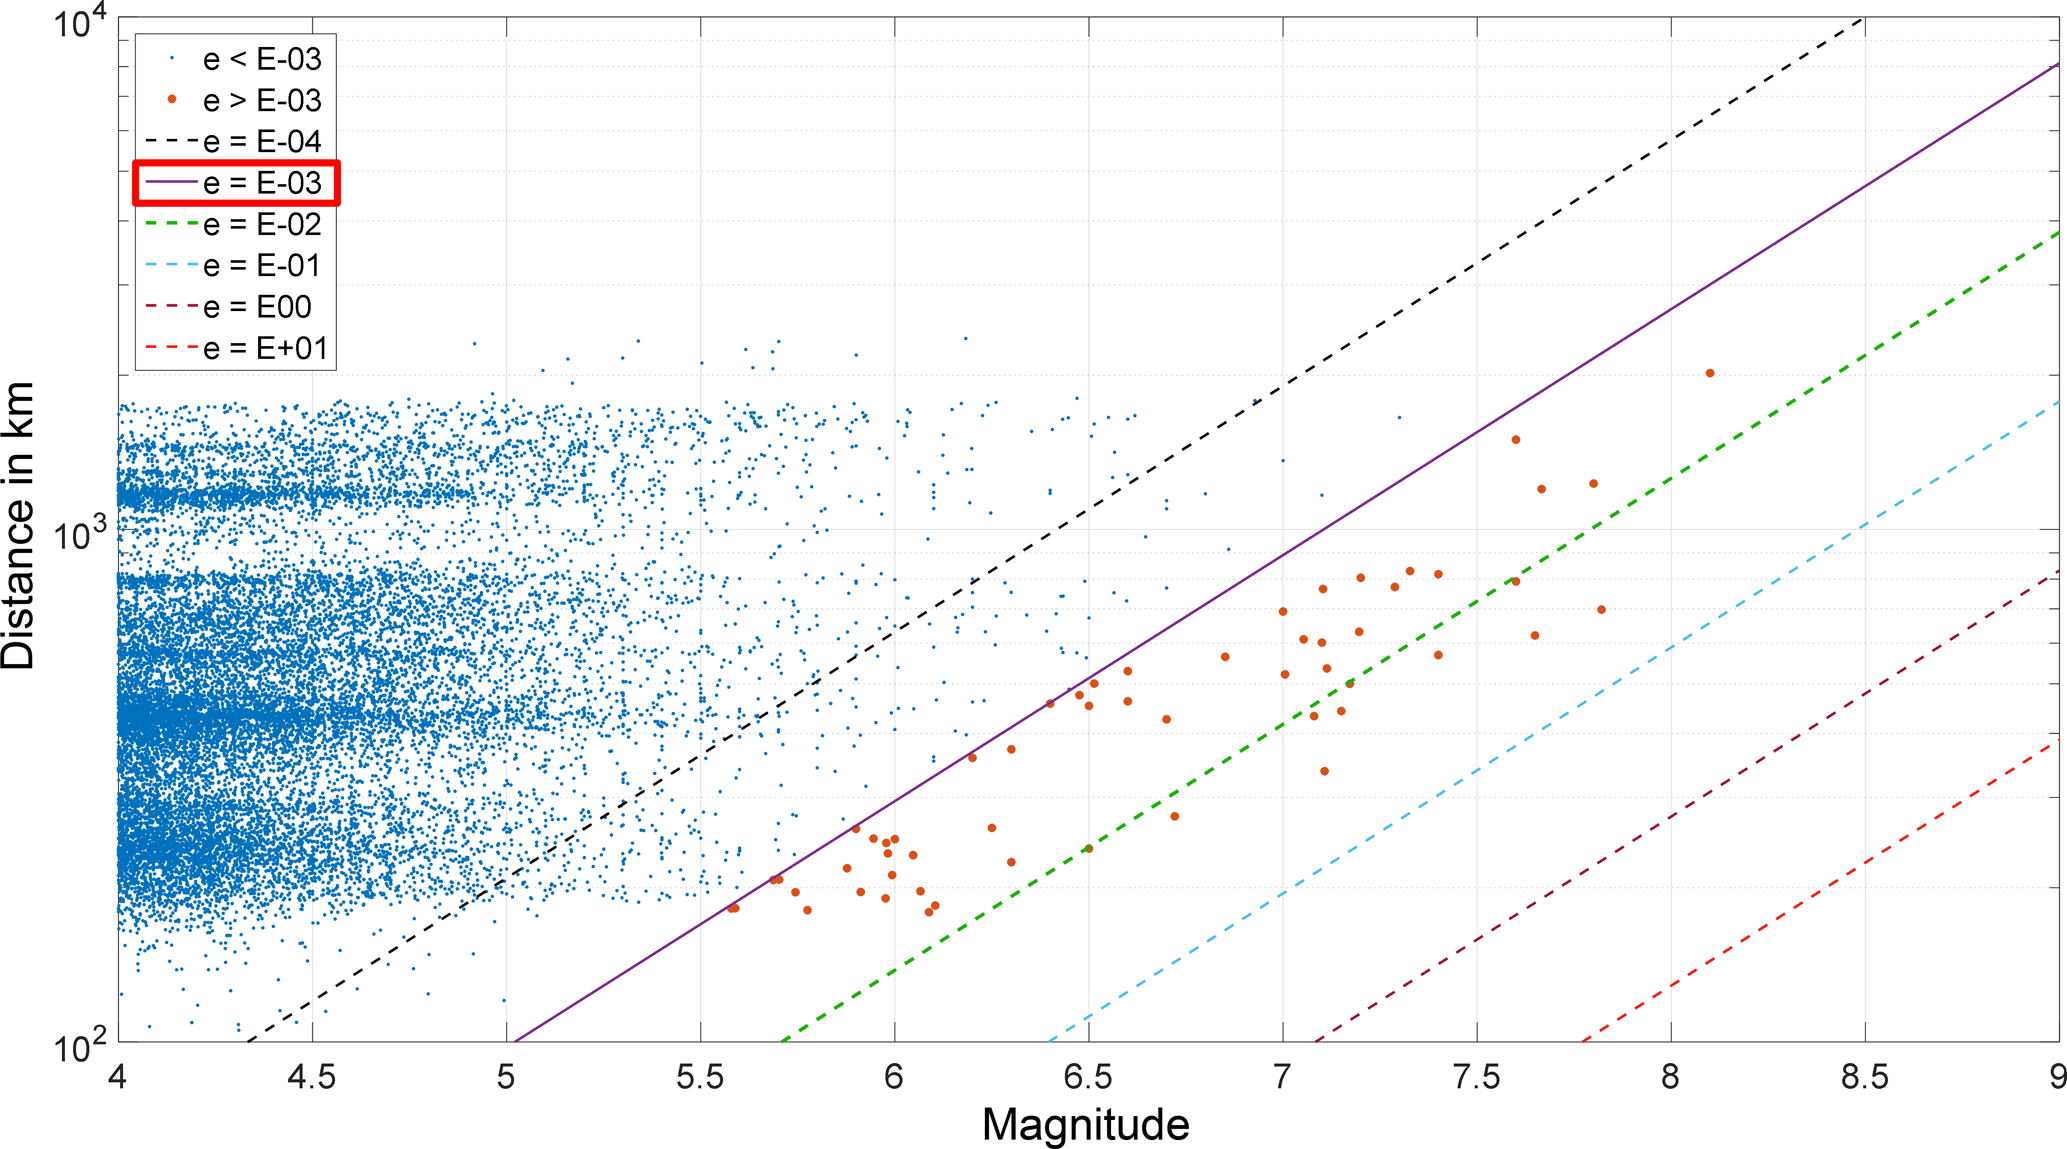
Figure 3Distances of all earthquakes with a magnitude above 4 vs. their semi-logarithmic magnitude. The diagonals are lines of equal seismic energy density. About 0.3 % of all recorded earthquakes (n=56) are above the threshold for potential water level changes with e > 0.001 J m−3 (red dots).
All earthquake epicentre coordinates are imported into a geographic information system and their distances determined to the monitoring well at Waiwera. With Eq. (1), the respective seismic energy density is calculated. To produce measurable water level changes, an approximate threshold of 10−3 J m−3 must be exceeded (Wang and Manga, 2010).
Figure 3 displays the distances of all earthquakes with a magnitude above 4 semi-logarithmically vs. their magnitude. The diagonals of equal seismic energy density indicate that about 0.3 % of all recorded earthquakes (n=56) are above the threshold for water level changes with e = 10−3 J m−3 (red dots). Earthquakes with a seismic energy density above 10−2 J m−3 all have magnitudes larger than 6.5. The highest recorded magnitude within the time period is 8.1 but with a distance of 2000 km from Waiwera.
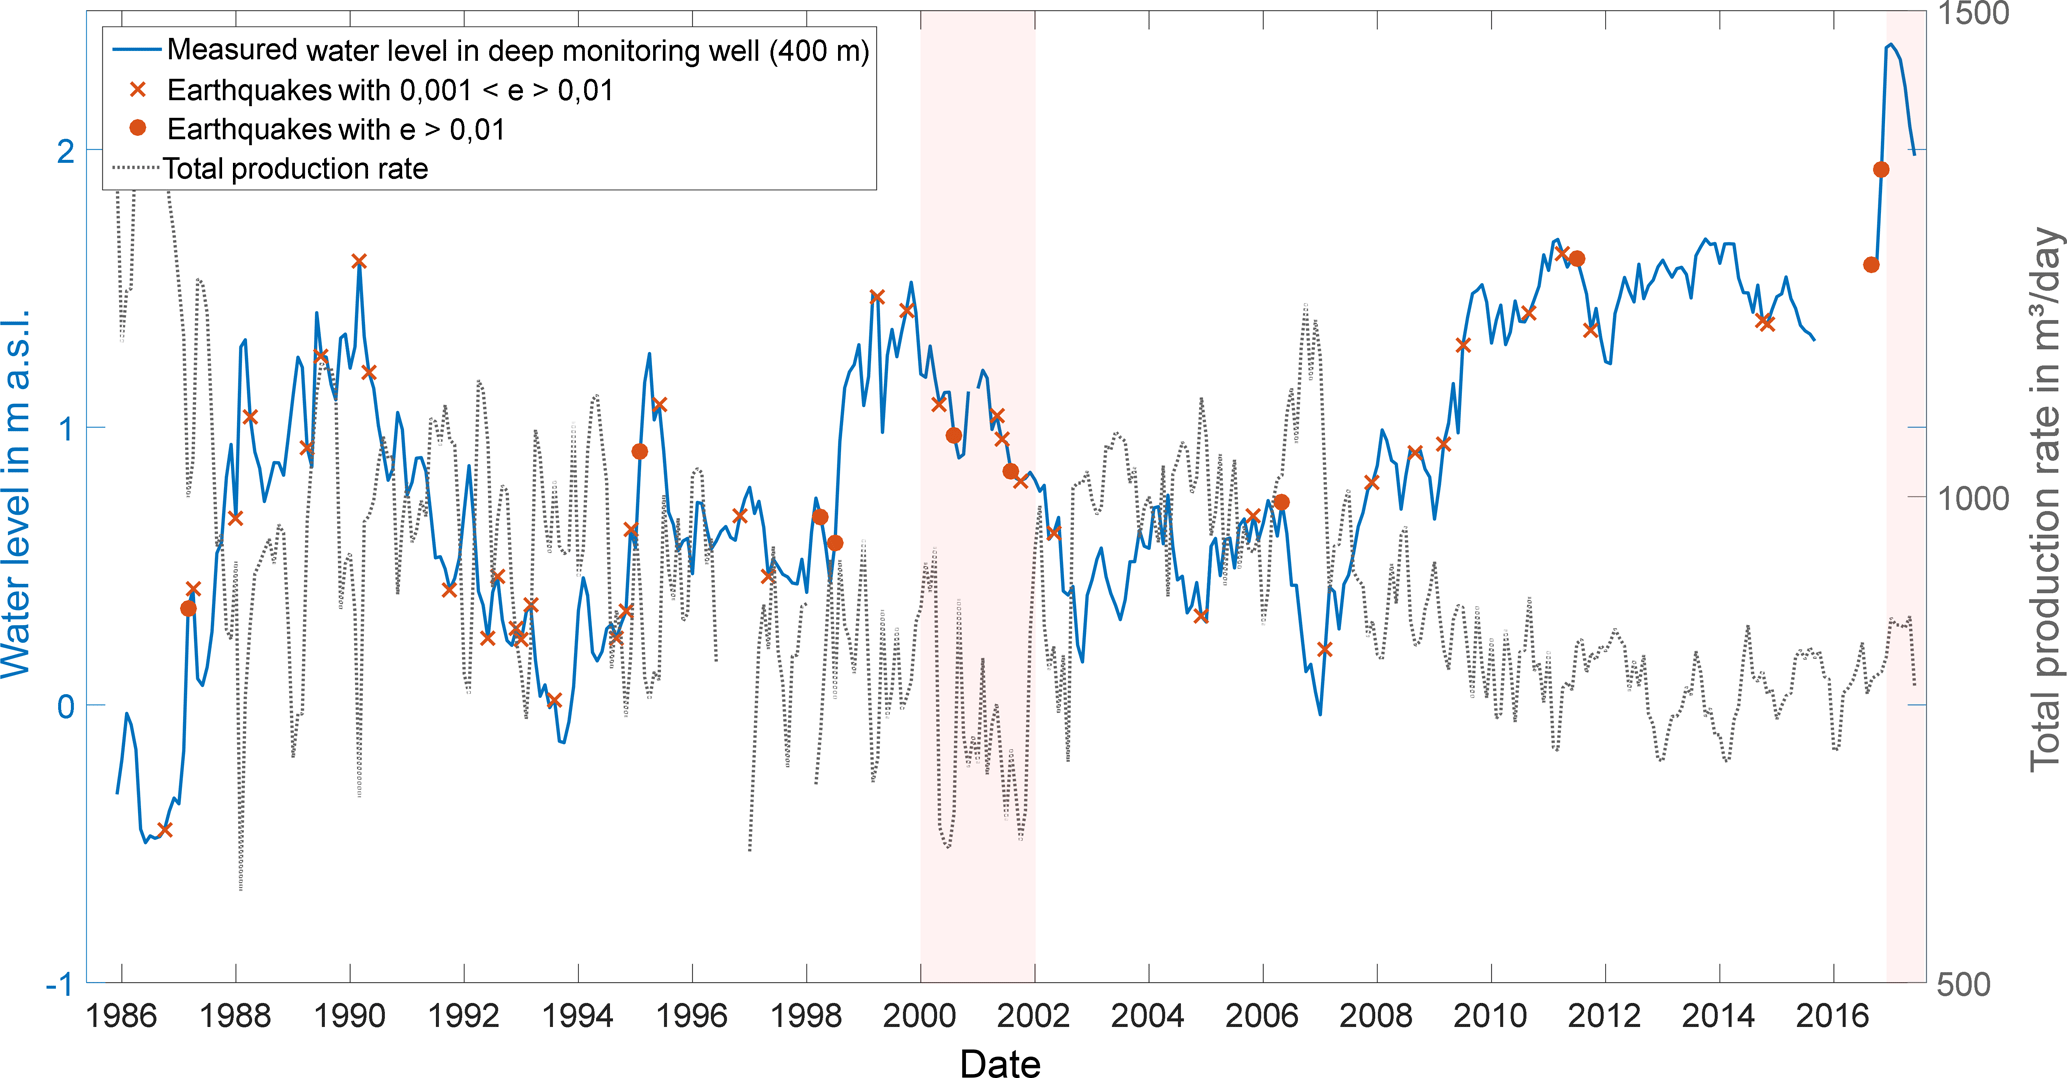
Figure 4Water level (blue) and production rate (grey), given as monthly means, show, with a few exceptions (e.g. red boxes), an inversely proportional correlation over the three-decade time series (Fig. 5). Strong (red crosses) and very strong earthquakes (red dots) are superposed on the water level curve.
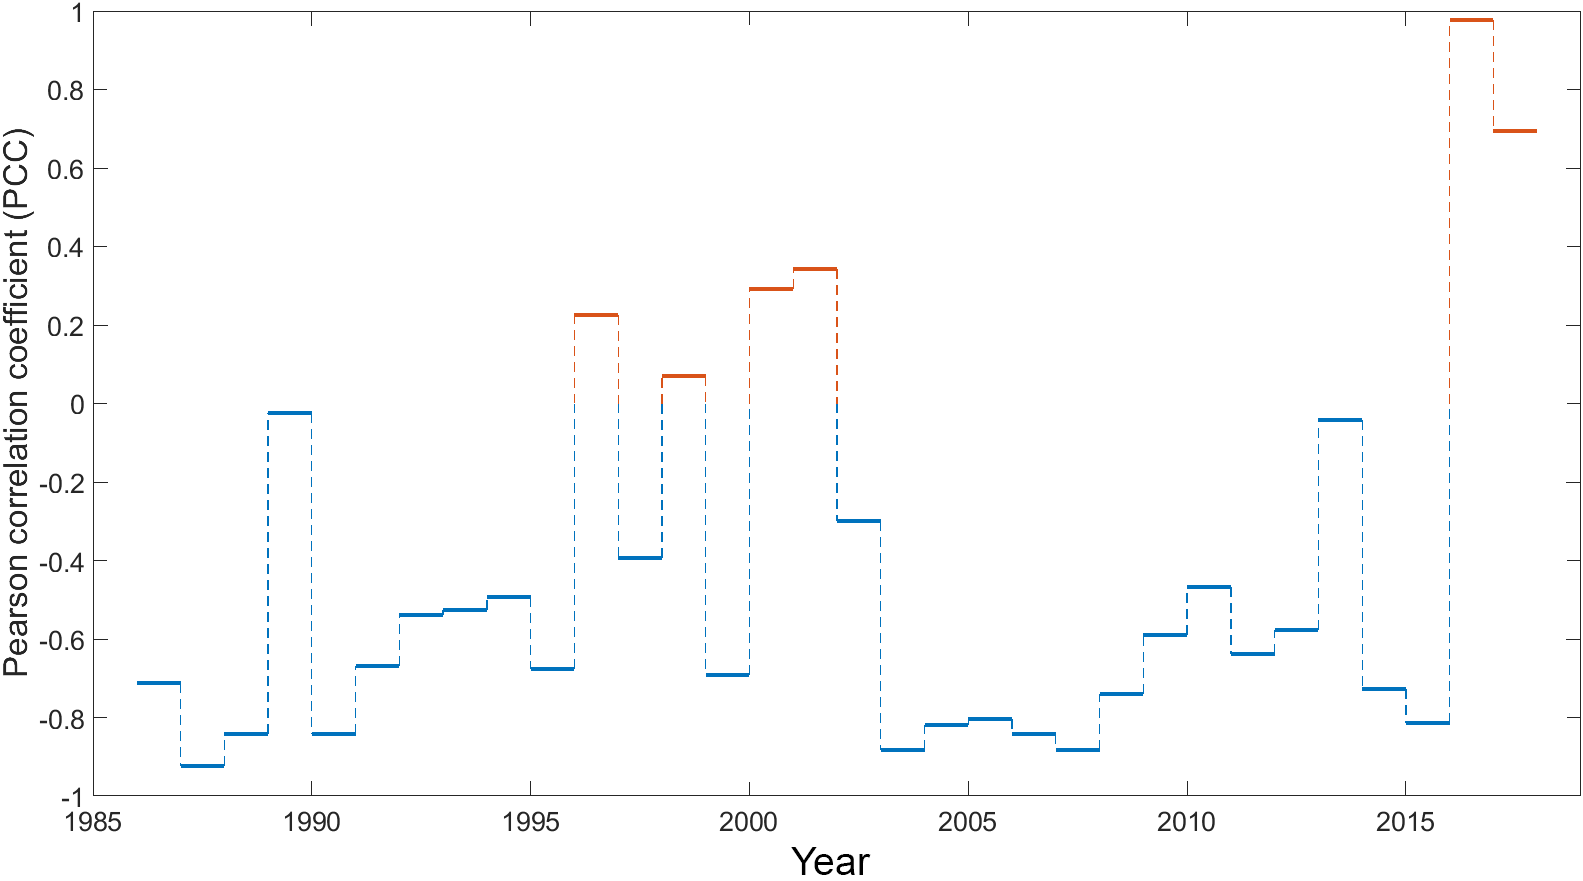
Figure 5Pearson correlation coefficient between water levels and total production rates of each individual year of the time series. Generally, an inverse proportional correlation is obvious with an overall average for the whole time series of −0.67. However, there are also years where a weakly to very strong positive correlation is present, especially in the time interval after the Kaikoura earthquake.
The Kaikoura earthquake on 14 November 2016 had a magnitude of 7.8, followed in strength by earthquakes with the next higher energy densities on 21 August 2001 with magnitude of 7.1 and 15 August 2000 with a magnitude of 7.6, with corresponding distances of 697, 337 and 621 km, respectively.
In Fig. 4, the earthquakes above the thresholds e > 10−3 J m−3 (strong) and e > 10−2 J m−3 (very strong) are superposed onto the time series of the reservoir water level in blue and shown together with the total production rate in grey with red crosses and dots, respectively. The anti-correlated relation between water level and production rate is obvious. During time periods with high production rates, the water level is low, and vice versa. We have deduced an insight into the temporal evolution of this correlation by calculating the PCC between the water levels and production rates for each individual year of the time series (Fig. 5). For most parts of it, the expected negative correlation is present with an overall average of −0.67. However, especially in two interesting cases, the correlation is proportional with weakly positive values in 2000 and 2001 (0.29 and 0.34, respectively) and a strong positive correlation in 2016 and 2017 (0.97 and 0.69, respectively), which is accompanied by two visually recognizable anomalies in the time series (Fig. 4, red boxes). Because a changed correlation between water level and production rate after the Kaikoura earthquake was therefore expected in the PCC, the positive values in 2000 and 2001 might be an indication of the influence of those two other mentioned very strong earthquakes.
However, a clear and comprehensive correlation could not be verified between earthquakes around New Zealand above thresholds of on-site seismic energy densities of e > 10−3 J m−3 or even e > 10−2 J m−3 and the monitored reservoir water level at Waiwera within the time period of May 1986 to June 2017. However, it has to be taken into account that none of the recorded earthquakes led to such a high energy density in Waiwera as the Kaikoura earthquake did with e = 0.032 J m−3. Maybe all the other earthquakes were just too weak or too far away to cause such an effect (Fig. 4).
On the one hand, in general, the water level within the Waiwera reservoir depends strongly on the production rate. On the other hand, a significant offset of the water level caused by earthquakes can be expected within a range of centimetres to a few decimetres (Brodsky et al., 2003). This might be too small a change to distinguish from water level changes due to varying production rates in such a utilized aquifer.
A further challenge is interpreting the data given the difference in the temporal resolutions of water level measurements (15 min or daily mean) and production rates (monthly mean). With such disparity, it might be challenging to prove statistically that a peak in water level is due to an earthquake. Here, we tested if the reduction of the water level data to the monthly mean could work anyway. Due to the fact that the water level increase after the Kaikoura earthquake lasted for months (Fig. 2), we were optimistic to detect changes at least for strong and very strong earthquakes. However, it could happen that signals triggered by an earthquake would be averaged out because the duration of the triggered water level change might be proportional to the magnitude of an earthquake as well. What is required are production rates with higher temporal resolution, at least on a daily basis to allow comparison with the water level using statistical approaches.
Nevertheless, an interesting observation is that two earthquakes in August 2000 and 2001 were the second and third strongest events at Waiwera after Kaikoura (e = 0.026 and e = 0.027). While there is no clear evidence for a direct impact visible in the time series (Fig. 4), the Pearson correlation coefficient between water level and total production rate for the corresponding years gives a hint as mentioned in the section above. It could be speculated that these earthquakes also had a long-term effect on the water level in the geothermal reservoir comparable to that of the Kaikoura earthquake, resulting in a changed, positive linear correlation. To detect and prove the influence of earthquakes, a monitoring well independent of the productions rates, maybe outside the reservoir area but still in the vicinity of Waiwera, could be helpful.
To overcome the problem that only monthly averaged production rates are available, we performed an additional test. For the earthquakes above the seismic energy density values of e > 10−3 J m−3 and e > 10−2 J m−3, we took a closer look at the water level time series immediately after those strong and very strong earthquakes in regard to Waiwera. Water levels were displayed for a variable number of months after the event, and visually we tried to determine if specific patterns, possibly similar to that observed after the Kaikoura earthquake, are recognizable. In addition, we calculated if the correlation coefficient between water level, here taken with daily means, and production rate, taken with the monthly mean which is only available, shows noticeable changes taking into account varying time periods after any event from 1 to 30 days within different calculations. Assuming that the correlation might be similar to the Kaikoura event, we investigated if the water level changed without changes observed in the production rate, which could be an indication for the effect of an earthquake on the water level. Still, we could not detect a clear difference in the correlations immediately after earthquakes and undisturbed parts of the time series.
Nevertheless, it is promising that Wang and Manga (2010) outlined in particular for the shallow subsurface that their empirical equation is able to work in the near- to intermediate-field range. In our case, maybe all relevant earthquakes have been in the too-far-field range of Waiwera. However, the Kaikoura earthquake, the strongest so far, showed that the water level can be significantly influenced by such events. For the future, we recommend to take daily mean metre data of the production rates to increase the resolution and with that to be able to determine as well smaller changes in the water level due to earthquakes with less seismic energy density at the location. Wang and Manga (2010) state as well that much remains to be explored in the hydrologic responses to earthquakes. For that, we are planning to deploy a seismology station in Waiwera itself to be able to compare calculated seismic energy densities with measured once.
Data are available via the Auckland Council (New Zealand).
MK provided the idea and the background for the investigation of the influence of earthquakes on the water level in the geothermal reservoir of Waiwera. He led the discussions and wrote the manuscript. TS checked the available data sets and did all the calculations.
The authors declare that they have no conflict of interest.
The authors would like to thank the Auckland Council for provision of
information and data and two anonymous reviewers for their fruitful comments
and suggestions. The article processing charges for
this open-access
publication were covered by a Research
Centre of the Helmholtz Association.
Edited by: Luke Griffiths
Reviewed by: two anonymous referees
ARWB: Waiwera water resource survey – Preliminary water allocation/management plan, Auckland Regional Water Board, Technical Publication No. 17, Auckland, New Zealand, 1980.
ARWB: Waiwera thermal groundwater allocation and management plan 1986, Auckland Regional Water Board, Technical Publication No. 39, Auckland, New Zealand, 1987.
Brodsky, E. E., Roeloffs, E., Woodcock, D., Gall, I., and Manga, M.: A mechanism for sustained groundwater pressure changes induced by distant earthquakes, J. Geophys. Res., 108, 2390, https://doi.org/10.1029/2002JB002321, 2003.
Chapman, M. G.: Investigation of the dynamics of the Waiwera geothermal groundwater system, New Zealand, Master thesis, University of Waikato, 1998.
Kühn, M. and Altmannsberger, C.: Assessment of data driven and process based water management tools for the geothermal reservoir Waiwera (New Zealand), Energy Proced., 97, 403–410, https://doi.org/10.1016/j.egypro.2016.10.034, 2016.
Kühn, M. and Schöne, T.: Multivariate regression model from water level and production rate time series for the geothermal reservoir Waiwera (New Zealand), Energy Proced., 125, 571–579, https://doi.org/10.1016/j.egypro.2017.08.196, 2017.
Kühn, M. and Stöfen, H.: A reactive flow model of the geothermal reservoir Waiwera, New Zealand, Hydrogeol. J., 13, 606–626, https://doi.org/10.1007/s10040-004-0377-6, 2005.
Kühn, M., Altmannsberger, C., and Hens, C.: Waiweras Warmwasserreservoir – Welche Aussagekraft haben Modelle?, Grundwasser, 21, 107–117, https://doi.org/10.1007/s00767-016-0323-2, 2016.
Rose, J. L. and Zemansky, G.: Updated Hydrogeological Evaluation of the Waiwera Geothermal Aquifer, GNS Scientific Consultancy Report 2013/67, GNS Institute of Geological & Nuclear Science, 2013.
Wang, C.-Y. and Chia, Y.: Mechanism of water level changes during earthquakes: Near field versus intermediate field, Geophys. Res. Lett., 35, L12402, https://doi.org/10.1029/2008GL034227, 2008.
Wang, C.-Y. and Manga, M.: Hydrologic responses to earthquakes and a general metric, Geofluids, 10, 206–216, https://doi.org/10.1111/j.1468-8123.2009.00270.x, 2010.