 | 21 Aug 2018
The scaling effect on rock behaviour by comparing compressional wave velocities measured in the lab and field
Mahdi Sehizadeh
Mohammad H. B. Nasseri
R. Paul Young
A careful comparison of rock behaviour at different scales is essential to determine if laboratory experiments can be useful for understanding the field scale. This research aims to investigate the scaling effect on rock behaviour by comparing P-wave velocities passing through rock at different scales in field and laboratory experiments. Field P-wave velocity was measured at specific ray paths in a fairly homogenous pegmatitic zone located at the third experimental hole ONK-EH3 of the POSE tunnel at OLKILUOTO site, Finland. Three true-triaxial experiments were carried out on pegmatite samples taken from the POSE niche to duplicate the stress path that was believed to exist at the most critical region around the ONK-EH3. Ultrasonic surveys were carried out during these experiments. Initially, reproducibility of the true-triaxial experiments was investigated and a good match was observed among the three samples. The evolution of the stress tensor around the ONK-EH3 was calculated and used in an ellipsoidal model to estimate P-wave velocities for all the points located on the ray paths in the field. Calculated field P-wave velocities along the ray paths were in reasonable agreement with those measured in the field. A linear trend was observed between absolute error per unit length of a ray path and it's average distance to the highest stress zone. This study corroborates the stress path dependency of rock behavior at different scales and the usefulness of the true-triaxial experiments in this regards.
- Article
(6101 KB) - Full-text XML
- BibTeX
- EndNote


Figure 1Lithology of the POSE niche along with the location of ONK-EH1, ONK-EH2, and ONK-EH3 experimental holes. Red colour indicates PGR rock around the POSE niche. Turquoise colour depicts the VGN intrusions around the experimental holes. Fractures mapped around the niche are shown by black lines. Green dots and purple dots indicate the location where pegmatitic granite rock and veined gneiss samples were taken respectively (after Valli et al., 2014).
Safe disposal of spent nuclear waste is a recent concern of many countries. Olkiluoto, an island on the southwest coast of Finland, has been selected for Finland's nuclear waste disposal. Since 1995, Posiva Oy has carried out extensive research to ensure the long-term safety of the Finland-based repository. This research included characterization of the host rock. To better understand rock mechanics processes in the complex geologic setting that exists at Olkiluoto, the ONKALO underground research facility was constructed. To investigate the in situ spalling strength of the host rock and for the prediction-outcome (P-O) exercise, the POSE niche (Posiva Olkiluoto Spalling Experiment) was excavated at a depth of 345 m in the ONKALO facility at a chainage of 3620 m. The layout of the ONKALO facility and the location of the POSE niche is demonstrated in Hakala and Valli (2013). The POSE experiment has three phases where each is well explained in Hakala and Valli (2013). The POSE phase 3 was designed to reduce geology complexity and, therefore, experimental hole 3 (ONK-EH3) was excavated in a relatively homogenous Pegmatitic Granite Rock (PGR) intrusion. Moreover, unlike the other two phases, to reduce the near field stress state, the ONK-EH3 was heated symmetrically from inside to simulate the decay of buried nuclear waste. This research focuses on this phase which is well detailed in Valli et al. (2014), Reyes-Montes et al. (2014) and Nasseri Behrestaghi et al. (2018).
To better understand the rock failure mechanism in the complex lithological setting, a number of true-triaxial experiments were performed on the samples taken from the POSE niche (Fig. 1). This research focuses on the results of three of these true-triaxial experiments performed on the PGR. These true-triaxial experiments followed a unique stress path that represented a complete stress history that the most critical zone around the ONK-EH3 would experience. As shown in Fig. 2, this stress path was due to a deviation from the in situ stress, excavation, and heating that was numerically obtained by considering different scenarios using ITASCA 3DEC software (Hakala and Valli, 2013; Nasseri Behrestaghi et al., 2016). Note that of the most criticized limitations of laboratory experiments, in general, is the non-uniform stress distribution at sample-platen interfaces. The true-triaxial experiment is not an exception in this regard, however, its discussion is not in the scope of this research but is discussed further in Young et al. (2012) and Kwasniewski et al. (2012).
The primary goal of the true-triaxial experiments was to better explain the discrepancies that were observed between the numerical simulations and the in situ experiment (Nasseri Behrestaghi et al., 2018). Of the major questions that arise are: To what extent are the laboratory results reliable? How well can the lab results represent the rock behaviour on a larger scale? Assignment of laboratory test results to field has been debatable for centuries. A detailed investigation of rock response at different scales is required to consider the laboratory experiments as a good representative of the field scale.
Elastic waves are among the most reliable sources which are well correlated with rock medium behaviour. This research investigates the scaling effect on rock behaviour by comparing the compressional wave velocities passing through rock medium at different scales; field and laboratory experiments. Recordings of the AE monitoring and velocity surveys performed by Reyes-Montes et al. (2014) during the heating phase of the POSE 3 were considered as the in situ source of data in this research. The sensors used in situ were single component sensors and thus S-wave determination from the field data was limited. Consequently, the P-wave was chosen in this research as it had more clear arrival time compared to the shear waves. With better S-wave field data this work could be extended. The POSE 3 experimental setup is well detailed in Valli et al. (2014), Reyes-Montes et al. (2014) and Nasseri Behrestaghi et al. (2018).
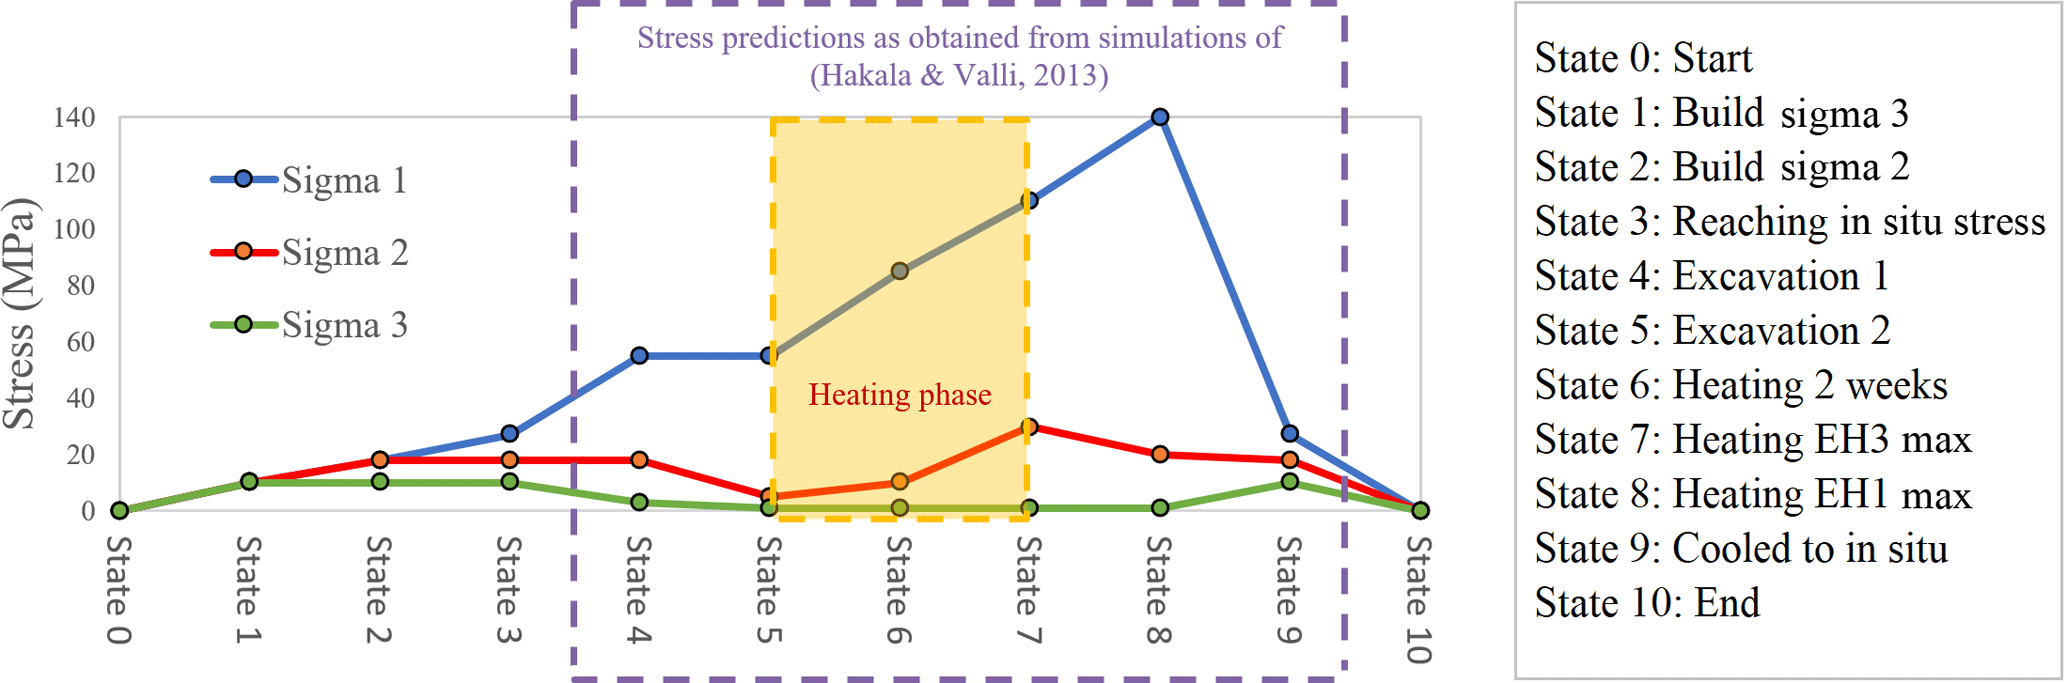
Figure 2Evolution of the principal stresses at the highest stress zone around the POSE experimental holes. This stress path is the reference stress path imposed on specimens in true-triaxial testing.
The structure of this research is formed as four key elements: (1) The POSE 3 as the field experiment, (2) the three true-triaxial experiments on PGR samples as the laboratory experiments, (3) the process involved in making the field and laboratory data comparable, and (4) comparing the results between the two sources, investigating the scaling effect, and the parameters affecting the velocity estimations. Of these four elements, the first one is not discussed thoroughly in this research but is addressed from time to time within the content of the other three elements. It is detailed in previous papers cited.
Frequency dependency of the seismic wave velocity and its dispersion in heterogeneous media is well addressed in the literature. This heterogeneity includes variation in pore space, lithology, saturation, temperature, and existence of cracks. Seismic waves travel with different speeds at different frequencies in heterogeneous media. Although homogeneity is a relative concept that is measured with respect to a reference, however, this research defines a homogenous media as not having visible fractures or major foliated planes. Accordingly, to minimize the uncertainties involved with anisotropic media, a relatively homogenous zone of PGR is interpreted to be in the POSE niche at a depth of 1.5 to 2.5 m around the ONK-EH3 experimental hole. This interpretation was based on surface mapping of the ONK-EH3 and GPR measurements that is further confirmed by the 3-D geological model of POSE niche done by Koittola (2014). This zone is named as Target Zone and is chosen as the zone of interest in this research. Five ray paths passing at a depth of 2 m in the target zone are labeled in Fig. 3. All of these ray paths travel through the PGR material. Only ray path 2–4 was passing close to the veined gneiss (VGN). The data for individual ray path used in this research is extracted separately from the raw data provided by Reyes-Montes et al. (2014).
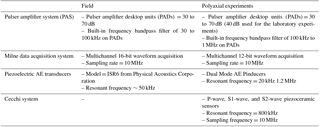
By targeting a homogeneous zone of PGR in the lab and the field, efforts have been made to reduce the uncertainties introduced by heterogeneities media. The high similarity between the sensors and data acquisition system used in both in the lab and field would also increase the compatibility of the results. Table 1 compares different features of the two systems.
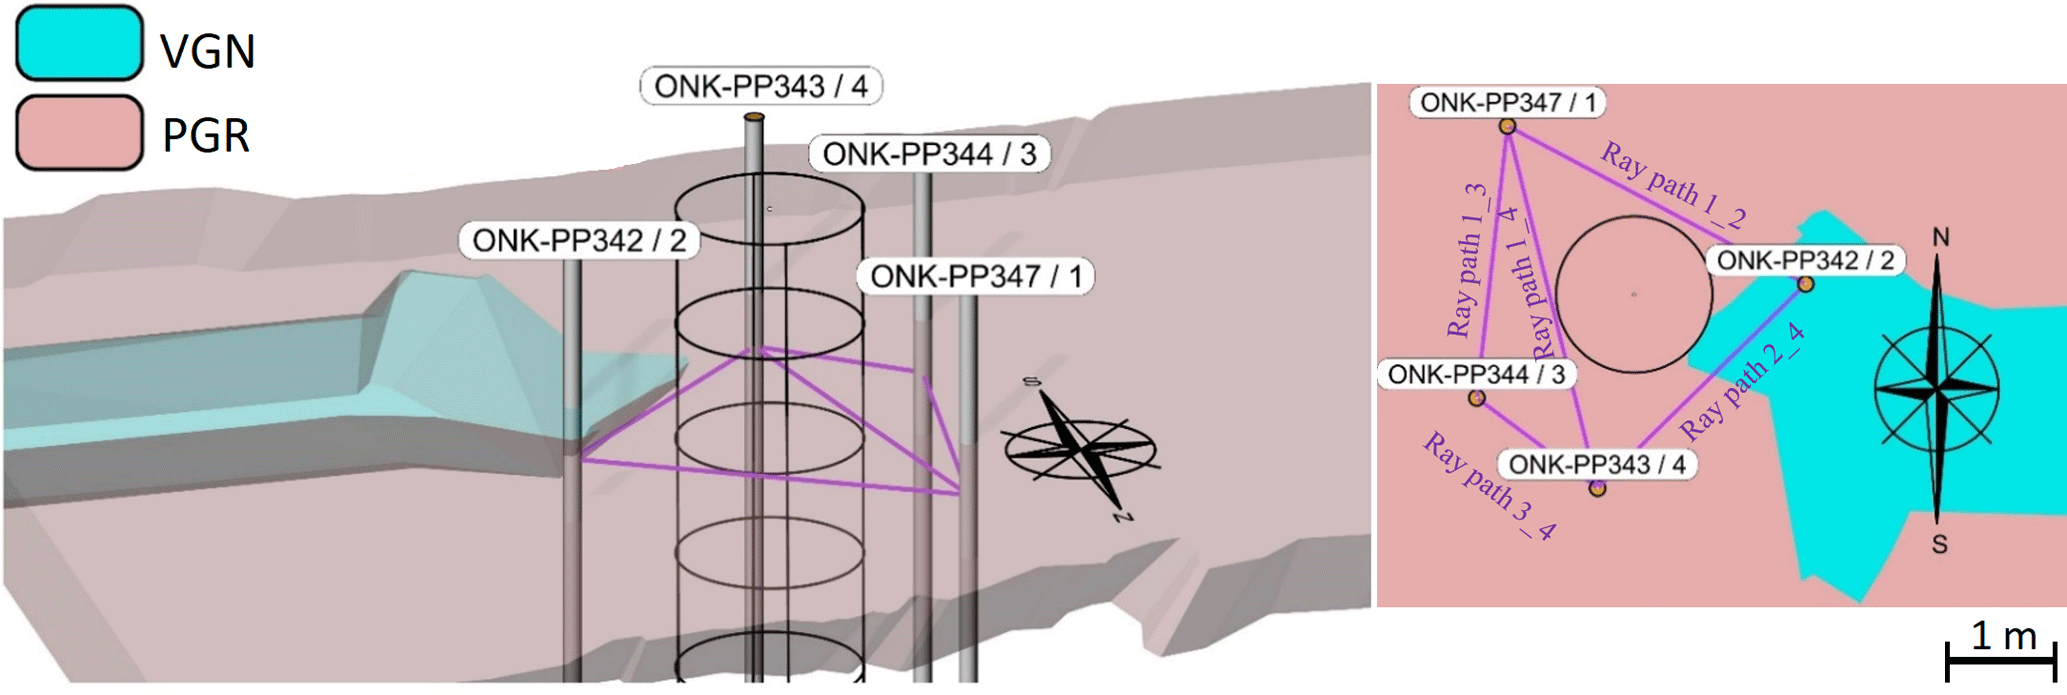
Figure 3A 1 m thick section of the 3-D POSE geological model, with ray path 2–4 close to VGN (Nasseri Behrestaghi et al., 2018).
Three mm cubic samples taken from the POSE niche (Fig. 1) were oven dried for 24 h at 80 ∘C and tested under dry conditions. The laboratory experiments were carried out in a very unique True-Triaxial Geophysical Imaging Cell (TTGIC) at the University of Toronto, capable of simulating the 3-D stress conditions wherein each principal stress is different.
The TTGIC is equipped with three dual mode AE transducers on each of six platens that can receive the AE signals or act as an active pulser receiver in the sensor to sensor velocity surveys. As well, a piezoceramic transducer embedded in each platen that is capable of measuring the P-wave and two orthogonal shear wave velocities in orthogonal directions. Three Linear Variable Differential Transformers (LVDTs) are positioned on each pair of platens to measure the sample deformation along each principal direction (Fig. 4). The TTGIC system and experimental setup are detailed in Young et al. (2012), Nasseri Behrestaghi et al. (2016, 2018) and Nasseri et al. (2016). Cubic samples were subjected to the stress path listed in Fig. 2. Acoustic emission monitoring and velocity surveys were carried out during these experiments.
In Sects. 5 and 6, we will provide the groundwork of reconstructing the P-wave velocity profile from the laboratory velocity measurements which could be comparable to the field velocity measurements of POSE Phase 3, where many of the complexities associated with heterogeneous anisotropic Olkiluoto rock could be avoided. Prior to that, it is essential to know the factors that made this comparison possible and logical. The homogenous PGR zone was one of these factors and many others are listed in Sect. 4.
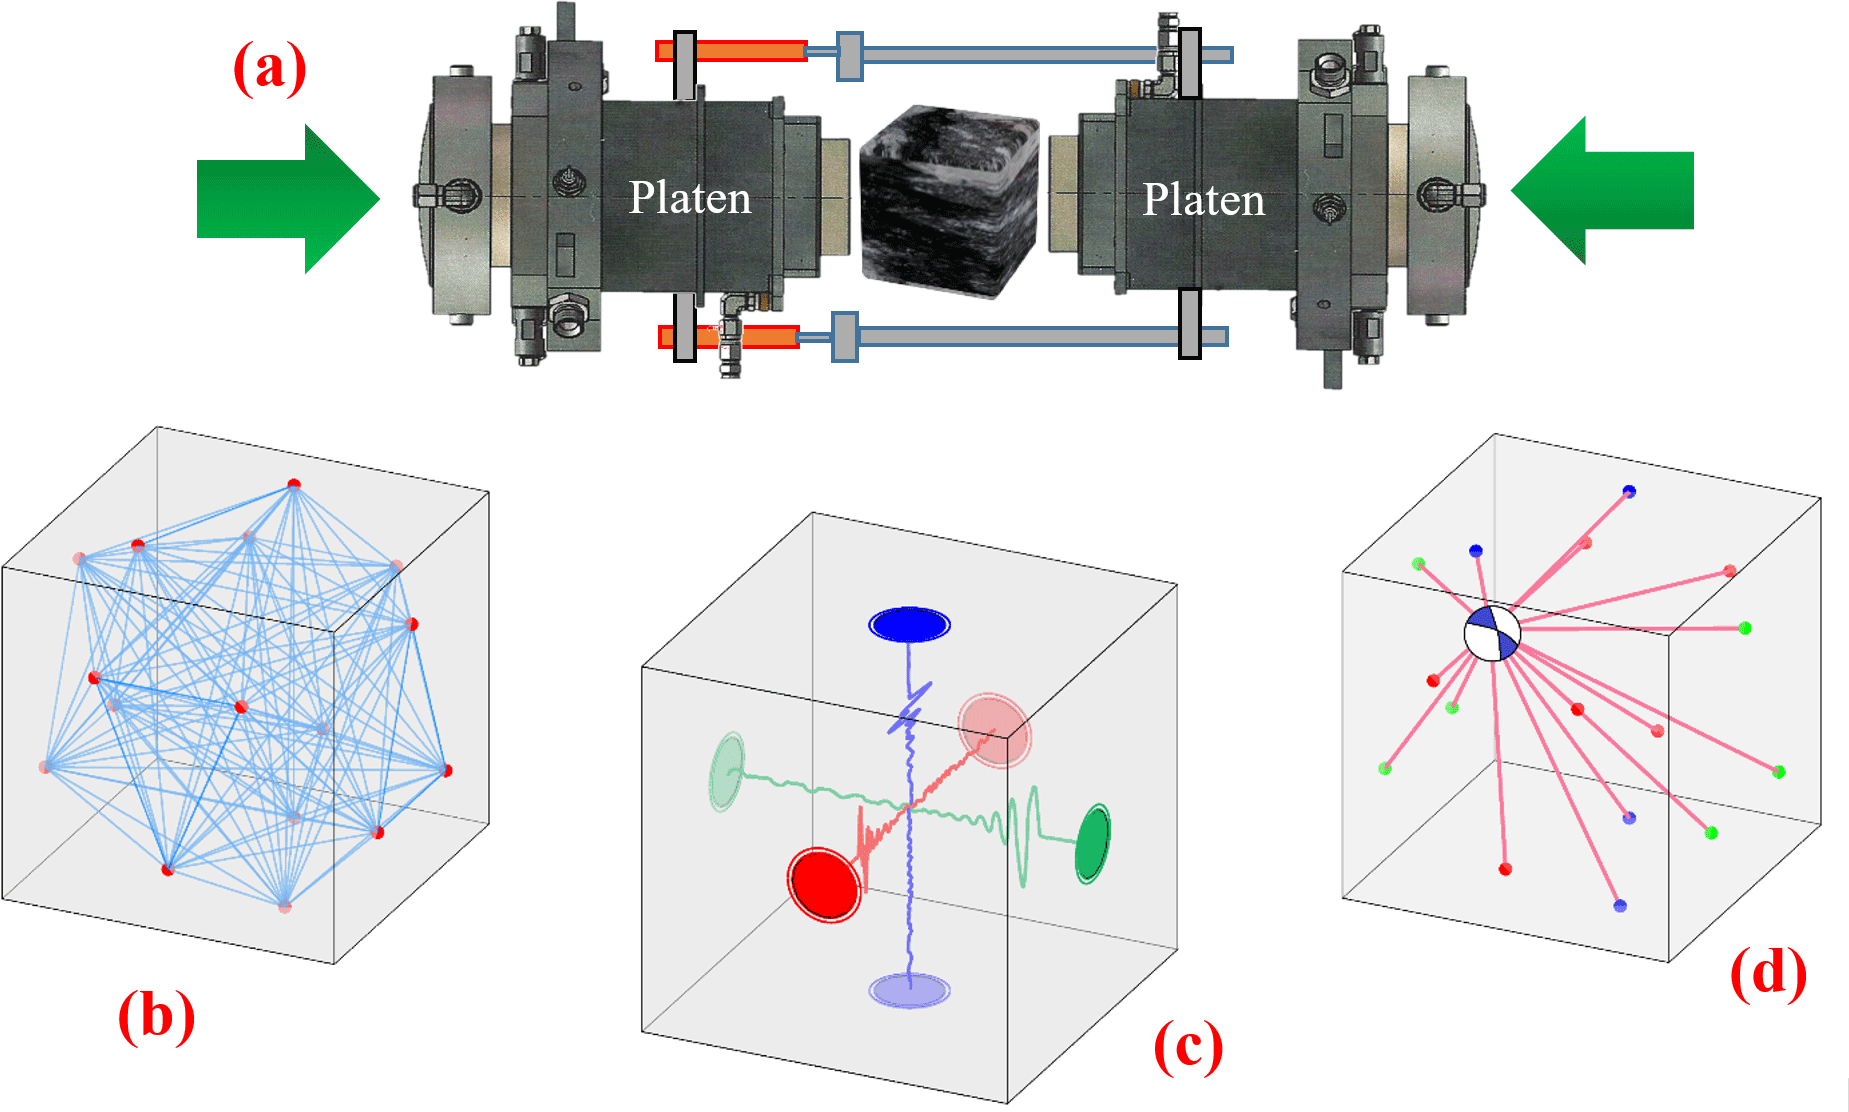
Figure 4(a) Position of LVDTs on each pair of platens; (b) Active sensor to sensor velocity measurements; (c) P-S1-S2 piezoceramics for velocity surveys; (d) Acoustic Emission Monitoring.
A reasonable comparison requires the consistency within each side of the comparison in the first place. For example, it is necessary to confirm if all of the similar lab samples and under similar testing conditions exhibit the same behaviour. Therefore, the consistency in the behaviour of three polyaxial samples is investigated. Figure 5 shows the coarse grain pegmatitic granite samples (PGR samples) taken from POSE niche as shown in Fig. 1. The reproducibility of the laboratory experiments indicates that these PGR samples could be representative of the PGR at a bigger scale in situ.
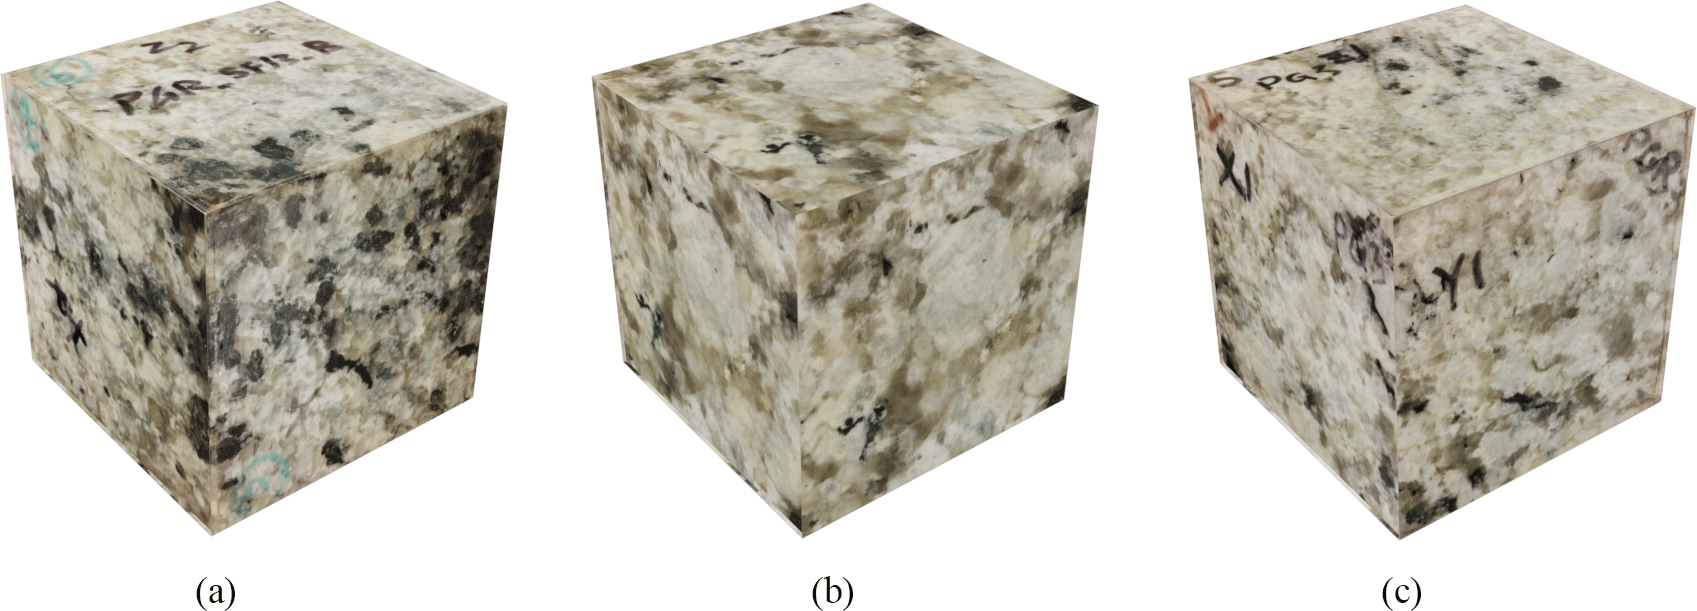
Figure 5Three mm cubic PGR samples tested under the true-triaxial experiment. From (a) to (c): PGR1, PGR2, PGR3.
4.1 Mechanical response of laboratory samples
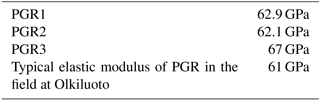
Displacement measurements of the temposonic sensors where converted to the strain and corrected to eliminate the machine compliance from the strain measurements. The strain-stress results and the method used for the strain correction are presented in Nasseri Behrestaghi et al. (2018). The strain-stress results of the three PGR samples reveal similar mechanical responses to the POSE 3 stress path. Among the three PGR samples, PGR2 followed the complete stress path as tabulated in Fig. 2. On the other hand, after completing step 7–8, PGR1 and PGR3 were subjected to extra loading along the maximum principal stress to approach their peak strength. As soon as a significant nonlinearity in the stress-strain curves was observed, these two samples were unloaded. A common point between all the PGR samples is the linear elastic response of the samples up to the end of step 6–7, which corresponds to the end of the heating phase in POSE 3 (where σ1=110 MPa, σ2=30 MPa, σ3=1 MPa). On the other hand, comparison of the elastic modulus calculated at the 50 % of the peak strength matches well among all the three true-triaxial laboratory samples and also to those measured in the field at Olkiluoto (Table 2).
Table 2Comparison of elastic modulus of the true-triaxial Pegmatitic samples and average elastic modulus measured in the field.
4.2 Pegmatite AE activity
Laboratory experiments of PGR under the true-triaxial stress path revealed a similar AE signature between the lab and the field. Here first we investigate the consistency of the pegmatite laboratory samples regarding their AE activity. Later, we demonstrate the similarity of the AE signature between pegmatite at the field scale and the laboratory experiments.
Table 2 demonstrate change in principal stress components over time overplotted with the AE histogram. The stress levels and AEs related to the heating phase are shaded in red. It is clear from this figure that all three polyaxial experiments represent a similar AE signature commencing approximately at loading step 5–6, which is the loading step that corresponds to the in situ heating at POSE third phase.
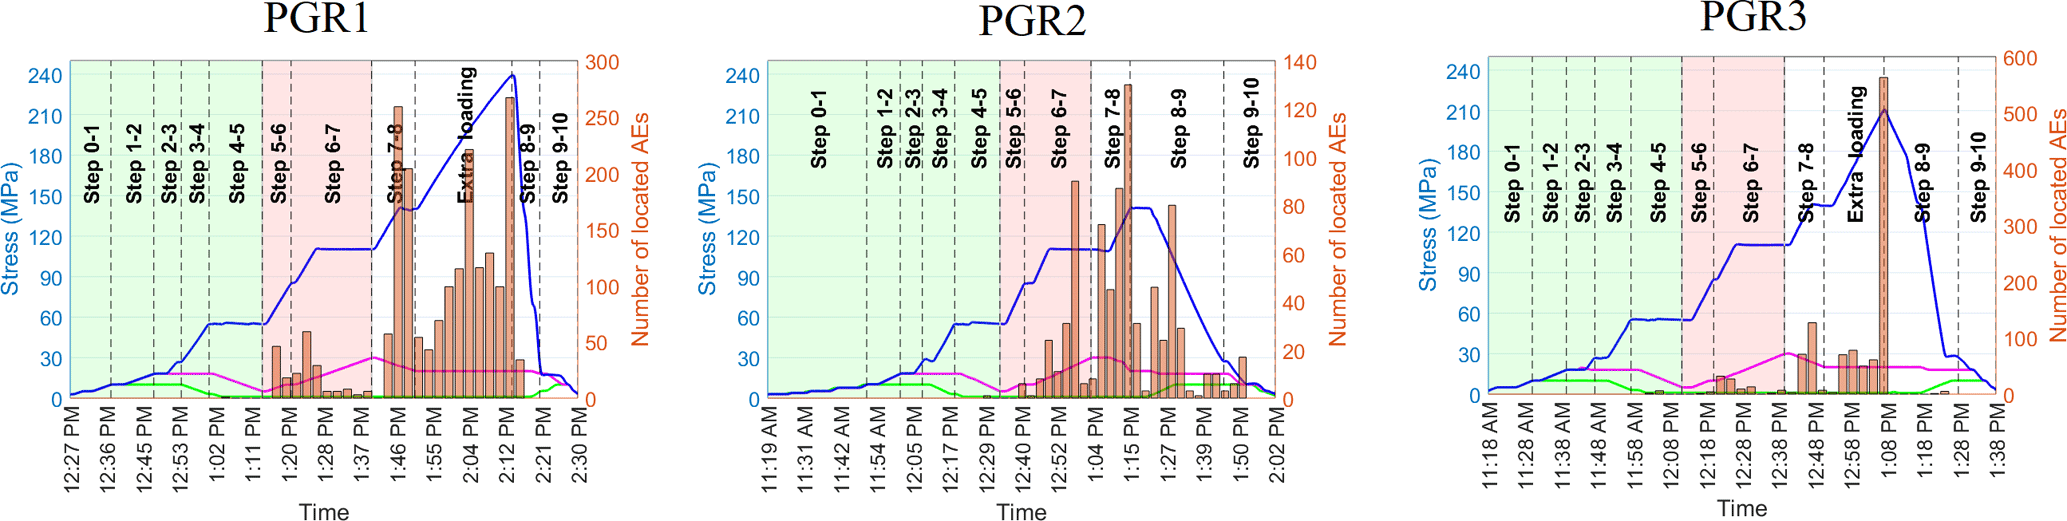
Figure 6The AE signature in the PGR laboratory samples tested under the state of the true-triaxial experiments. Blue, purple, and green lines represent the maximum, intermediate, and minimum principle components respectively.
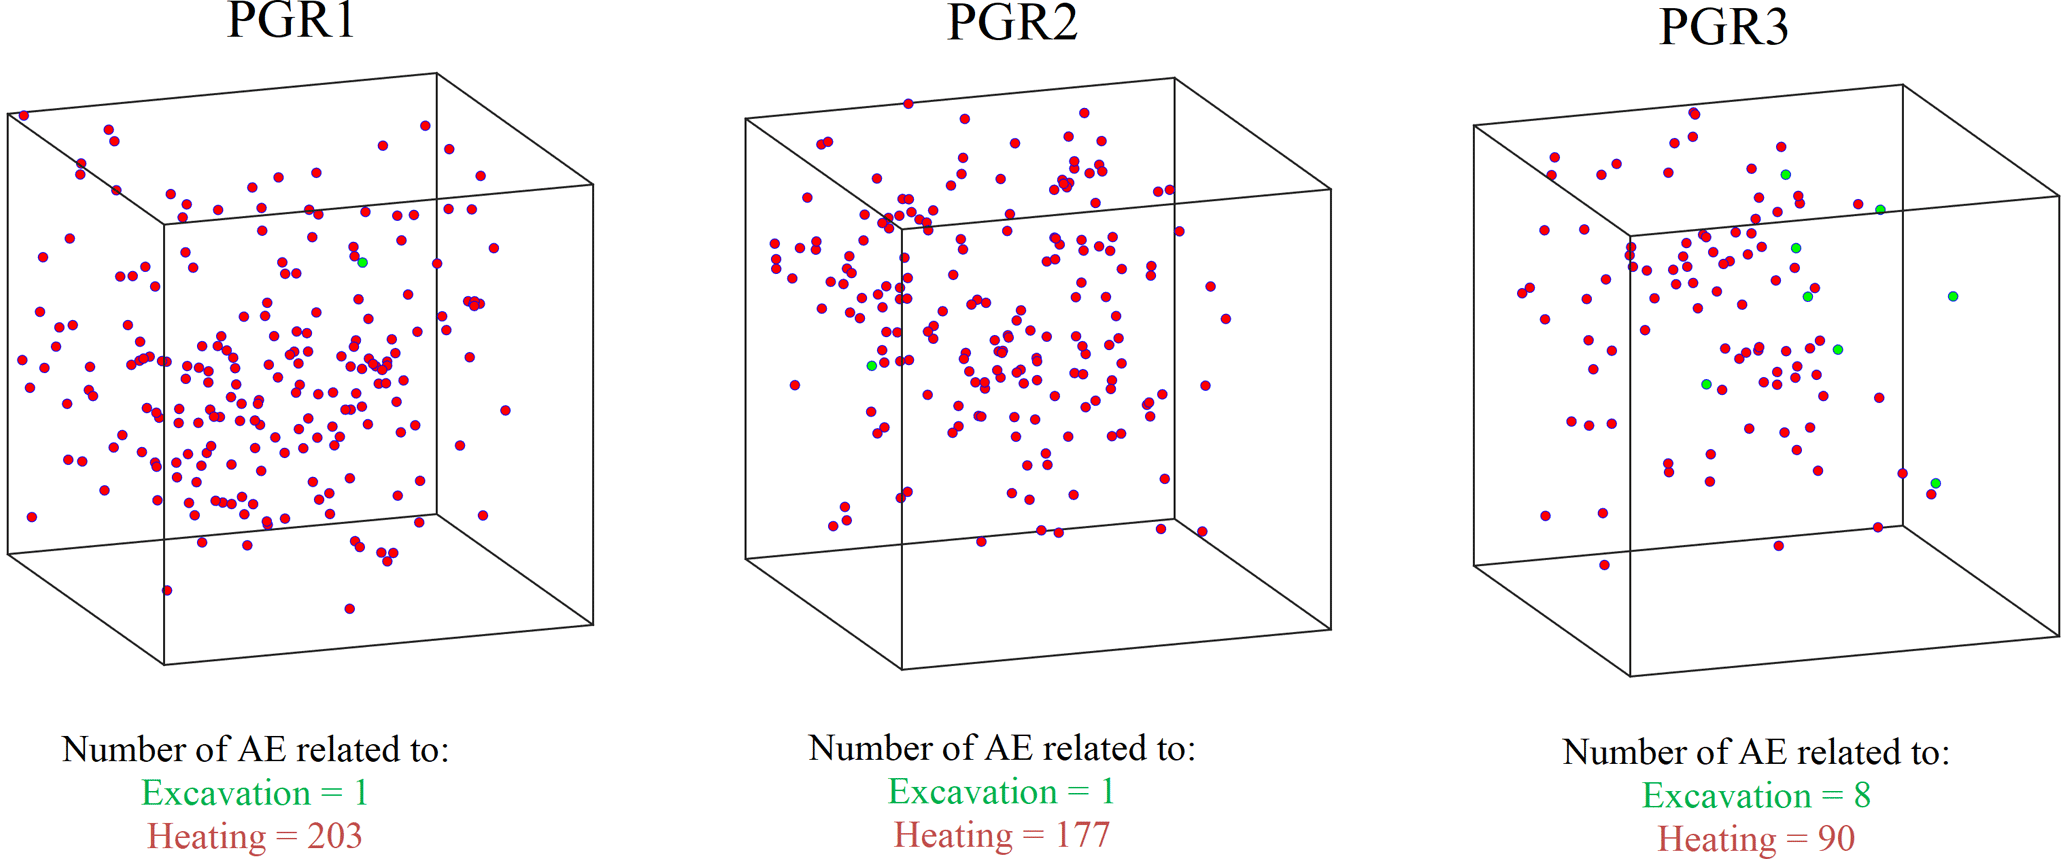
Figure 7AE activity in PGR specimens generated in accordance with the excavation and heating stages in green and red, respectively.
Figure 7 shows the location of AE activities in the three PGR specimens tested in the laboratory for the stress levels corresponding to stress levels before the initiation of the heating phase (marked in green) and also for the stress levels associated with the in situ heating (marked in red). This figure demonstrates that in all the pegmatite samples, the AE activities are mainly due to intra-granular and trans-granular fractures without coalescence to a clear fracture plane. Thin-section analysis of the PGR2 sample as detailed in Nasseri Behrestaghi et al. (2018) and Nasseri et al. (2018) and the linear response of the PGR samples further corroborates this finding.
Using 24 AE sensors, Reyes-Montes et al. (2014) monitored AE activities around ONK-EH3 before heating, during heating and cooling of the POSE phase 3. As explained in Nasseri Behrestaghi et al. (2018) and Reyes-Montes et al. (2014), acoustic emission events were initiated during the heating phase of the POSE phase 3 in situ where the majority of the AE activities were interpreted to be within the PGR. In a similar way to the laboratory experiment, the highest rate of AE activity was interpreted to be at the end of the heating phase where over 85 % of the AE events occurred within this period.
Combining the results from the true-triaxial laboratory experiment and the observation from the field experiment at POSE 3 indicates that the AE signature of the PGR cubic samples is robustly matched with the AE activities recorded in the field.
4.3 Evolution of compressional wave velocity
As shown in Fig. 8, the wave velocities demonstrate a close match among the three pegmatite samples especially along the maximum principal stress so that enough coupling between the sensors and the rock surface is available.
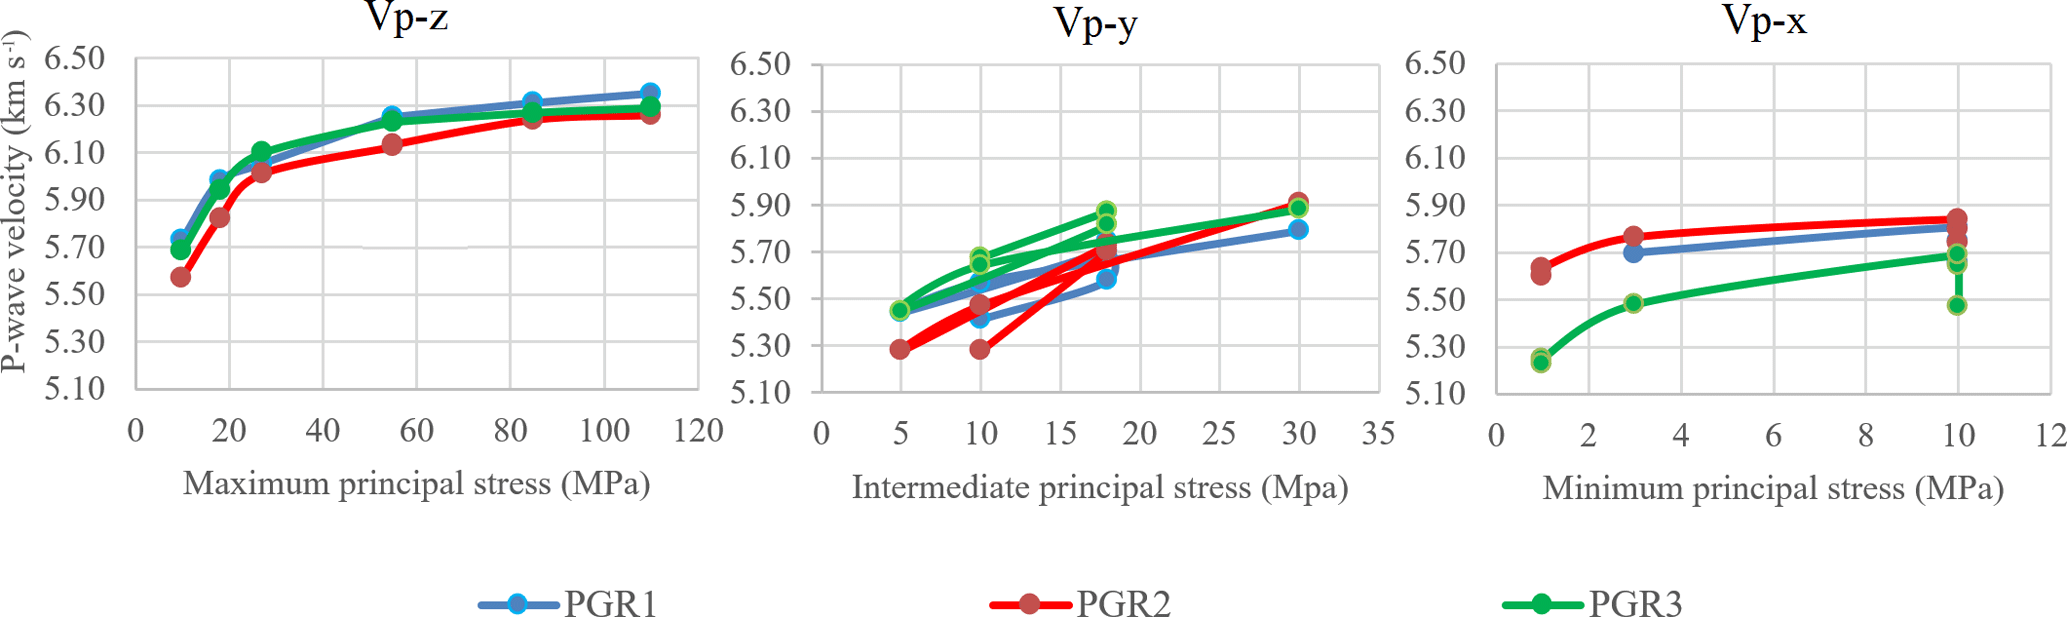
Figure 8Comparison of compressional wave velocity among the three PGR samples while under a state of true-triaxial stresses (after Nasseri et al., 2016, 2018).
All the PGR samples indicate a velocity increment due to the closure of the pre-existing microcracks when they are exposed to the loading steps that correspond to the heating phase at POSE 3.
For the comparison between different scales in the field and the laboratory, it was a necessity to calculate the stress tensor for all the grid points in the zone of influence around ONK-EH3 as the field experiment evolves. Therefore, the evolution of the stress tensor around ONK-EH3 from the in situ stress to excavation to the end of heating at POSE 3 were calculated in three steps. First, the analytical hoop stress formulation of Hiramatsu (1962) and Schmitt et al. (2012) was used to calculate the evolution of stress tensor regarding excavation of ONK-EH3. Second, thermo-elastic formulation of an infinite conducting medium around a cylindrical thermal inclusion (Voight and Stephens, 1982; Ritchie and Sakakura, 1956) was adapted to calculate the change in the stress state induced by temperature variation as a function of the time around the ONK-EH3 borehole. Third, Stress tensor obtained from the two steps were superimposed to estimate the evolution of stress tensor beyond excavation and up to the end of the heating phase (Figs. 7 and 9). All of these analytical methods are based on the material linear elastic behaviour which is valid for the PGR around the OKN-EH3 before and during the heating phase.
It is worth to note that from the two available in situ stress interpretations near the ONK-EH3, the in situ stress interpretation from the EDZ tunnel (maximum horizontal stress trend of σH=166∘) is considered in the hoop stress calculations of the first step. Moreover, the thermal boundary condition of Hakala and Valli (2013) is implemented in the thermal stress calculations. The calculated stress tensor around the borehole is in good agreement with the stress prediction of Hakala and Valli (2013) using ITASCA 3DEC software.
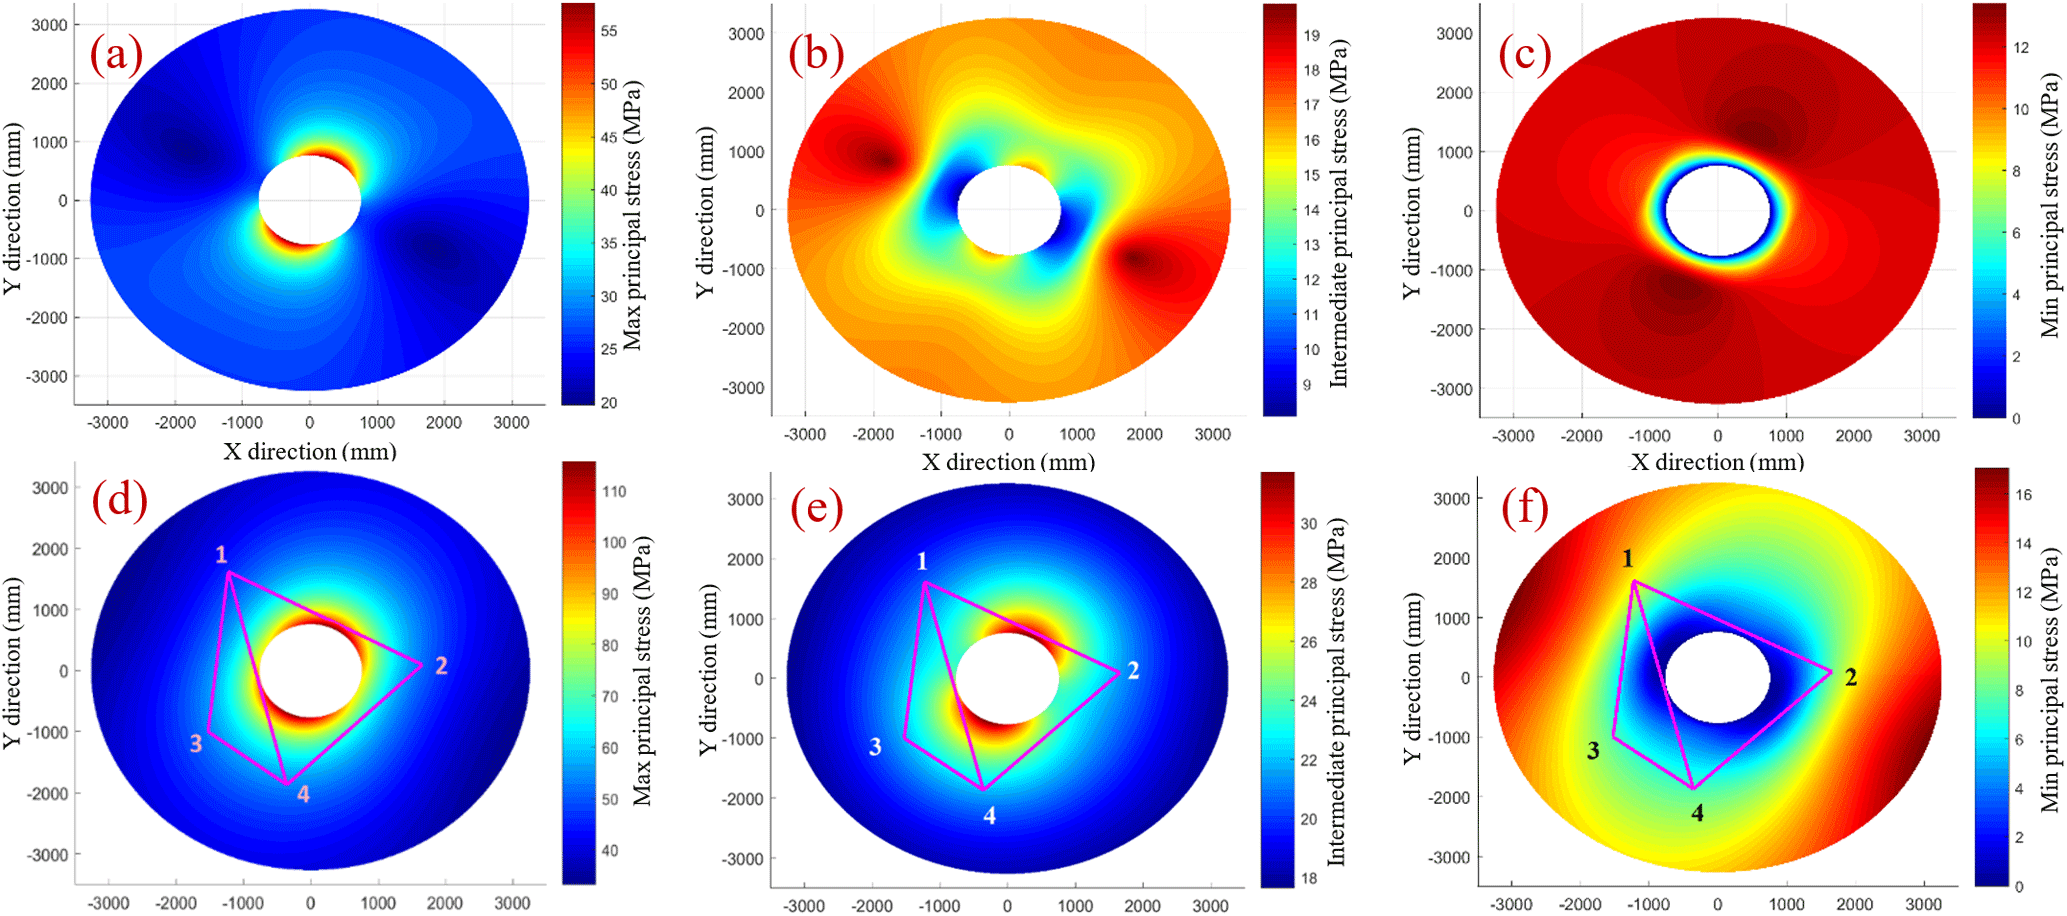
Figure 9Ray paths plotted over the calculated principal stress components around the ONK-EH3. The first row) after excavation and before heating; the second row) at the end of 12 weeks of heating, the ray paths are over plotted.
Estimation of the compressional wave velocities along the five targeted ray paths requires information regarding the change in both the magnitude and orientation of the principal stress components along the ray path. Therefore, the stress profile components including the magnitude and orientation of the principal stress components along the five ray paths are extracted at different heating timestamps that were similar to the time of velocity measurement during the heating phase of POSE 3.
To approximate the field P-wave velocity from the stress tensor and the velocity from the lab, it is essential to know not only the magnitude but also the corresponding orientation of the principal stress components at each point and at each time step. Eigenvectors were calculated for three principal stress components around the ONK-EH3.
The framework in this research is to assign a proper velocity vector to the discrete points along the ray paths surrounding the ONK_EH3 using the stress tensor calculated for those points. These velocity vectors are estimated from the recording of ultrasonic velocity measurements during the laboratory experiments.
A 3-D ellipsoidal model was employed to calculate the velocity at each point along the ray paths. In this model, for each grid point along a ray path, a 3-D ellipsoid is generated with radiuses equal to the principal stress components at that point. Normal eigenvectors define the orientation of principal axis. Later these principal stresses are converted to velocity using the velocity data from the polyaxial laboratory experiments. As a result, the 3-D ellipses of the principal stresses were converted to the 3-D ellipses of velocities along those principal stresses (Fig. 10). By projecting the three velocity components of the 3-D ellipsoidal model along the specific ray path, one can approximate the corresponding velocity along the ray path for that specific point and the specific stress conditions.
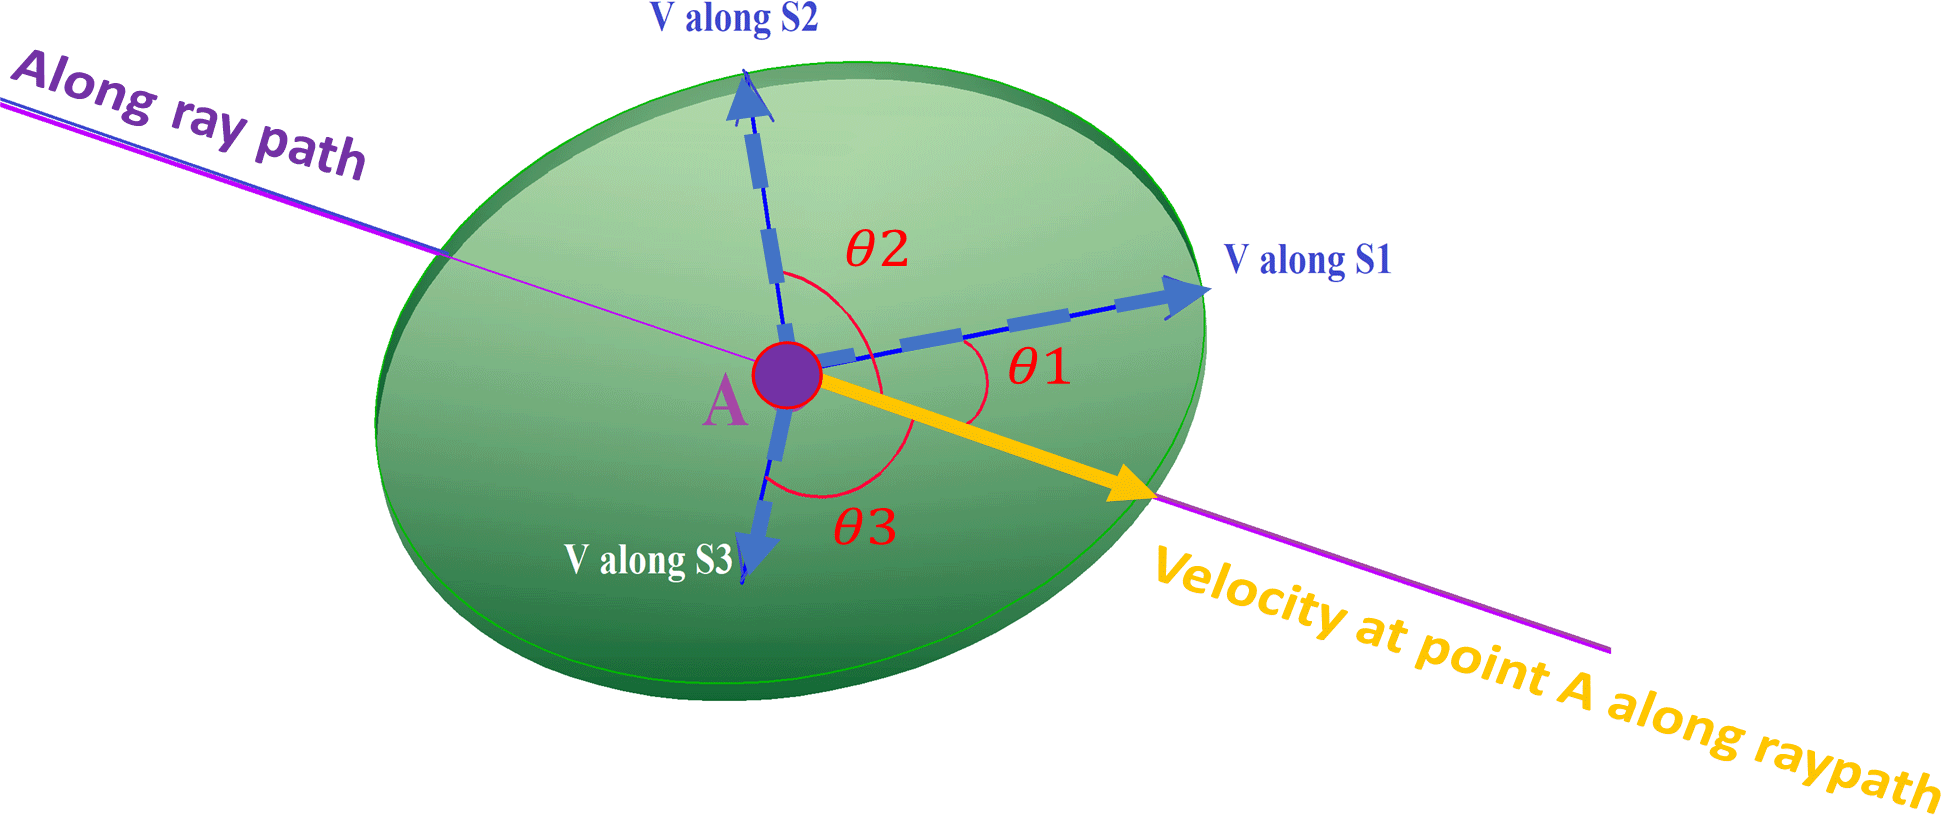
Figure 10The ellipsoidal model used to approximate the velocity of each point along the ray path by combining the calculated stress field and the velocity data from the true-triaxial experiments (Nasseri Behrestaghi et al., 2018).
Calculated velocities at the grid points along a specific ray path at a specific time stamp is then used in Eq. (1) to obtain an overall velocity along the ray path which could be comparable to one single velocity survey along that ray path in the field at the corresponding time stamp (Fig. 11).
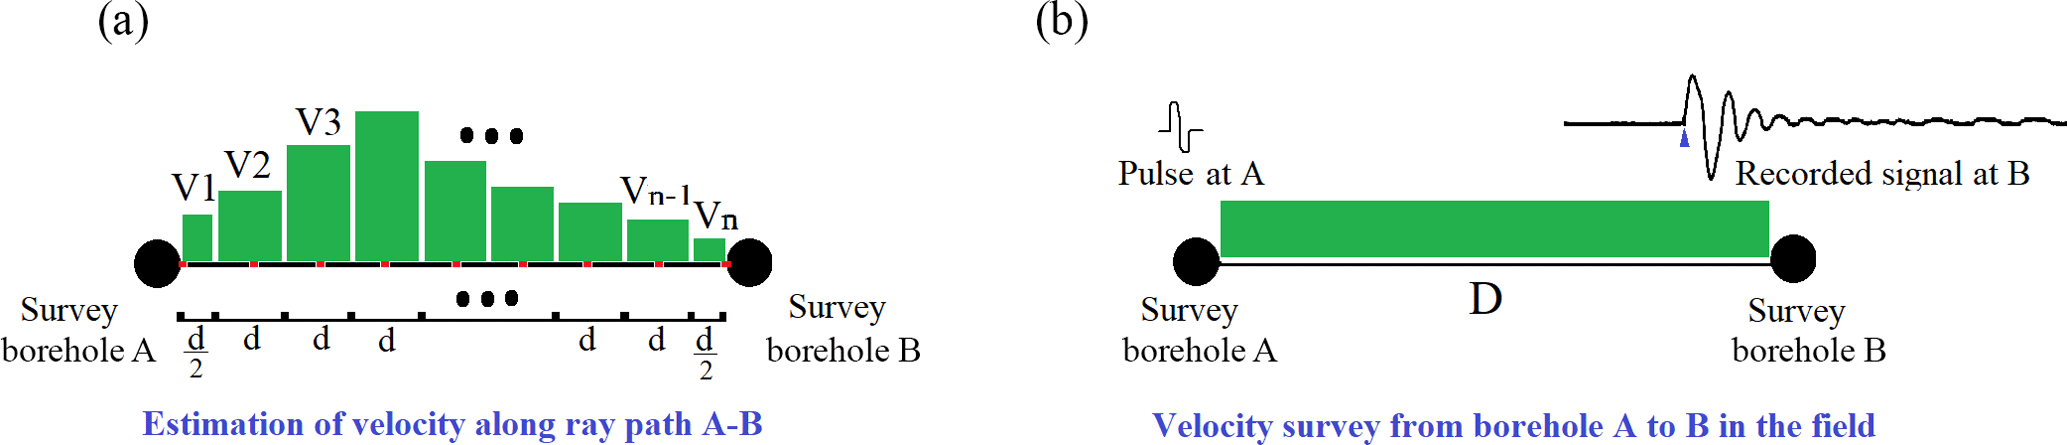
Figure 11(a) Schematic concept of calculating a ray path velocity from approximated velocities at grid points (Marked with the red squares) located on the ray path. (b) A conceptual velocity survey performed along ray path A–B in the field.
Where n is the number of grid points along ray path. Vi is the estimated velocity at grid point i using the ellipsoidal model.
The ultrasonic velocities reported by in Reyes-Montes et al. (2014) are either averaged over all the ray paths at each depth or averaged over each ray path from all the depths. Therefore, the velocity survey data from field experiment was reprocessed to extract the velocity measurements along the individual target ray paths. These measurements are shown in Fig. 12a where the scatter plot with square markers represents the result of the field P-wave velocity measurements along the individual targeted ray paths and during the heating phase of ONK-EH3 and the continuous dashed line shows the reconstructed velocity from the laboratory data. Figure 12b represents the average P-wave velocities over all of the targeted ray paths for both velocity sources.
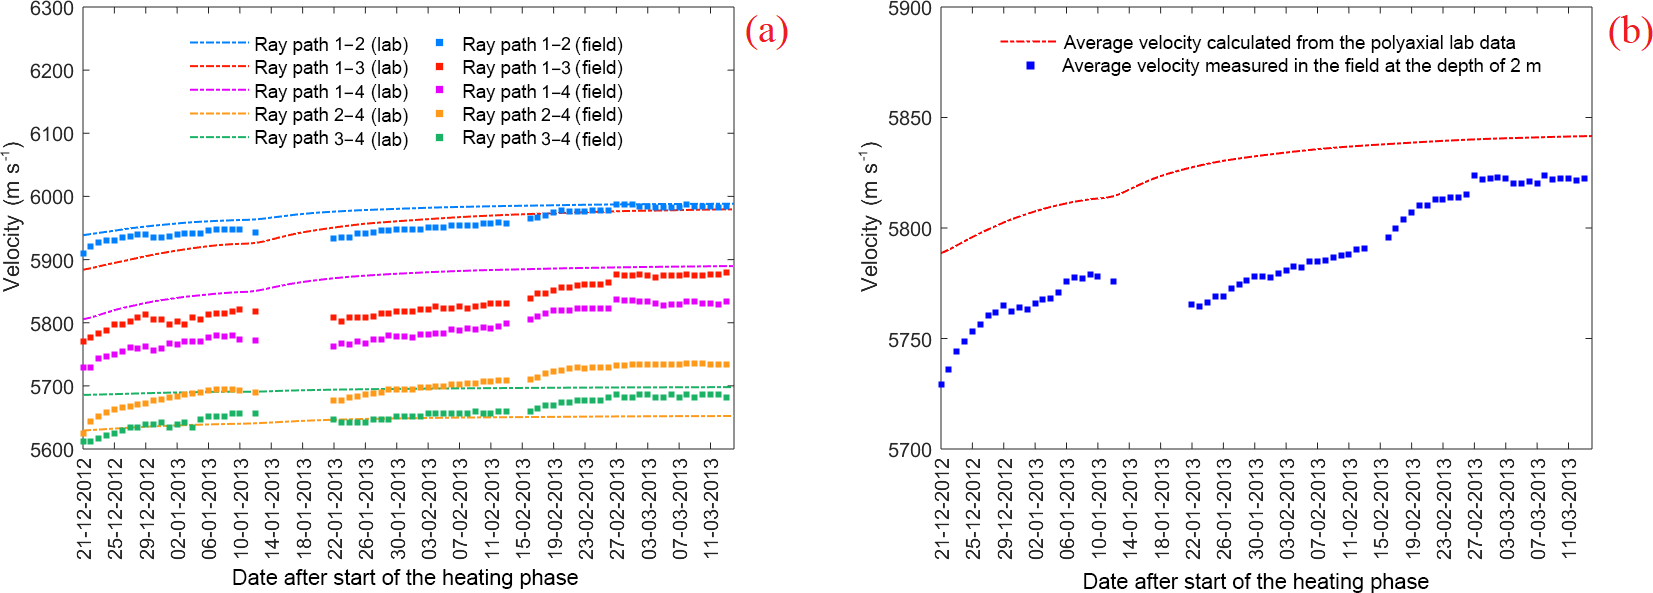
Figure 12A comparison of the field and laboratory P-wave velocities; (a) Along the individual ray paths; (b) averaged over all the ray path at a depth of 2 m (after Nasseri Behrestaghi et al., 2018).
Figure 13 tabulates the error in terms of the velocity deviation between the two sources (Eq. 2).
Max, min, and average errors are defined as the highest, lowest, and mean velocity deviations between the two velocity profiles of each ray path throughout the heating period, respectively. To separate the influence of ray path's length and uncertainties induced by ray path's distance from the ONK-EH3 wall, we normalize the error to the length of the ray path and to the average distance of grid points located on the ray path from the highest stress zone around the experimental hole.
As shown in Fig. 12a and Fig. 13a–d, the best match between the field velocity measurement and calculated velocity from the lab data is attributed to the ray path 1–2. This is interpreted to be due to the fact that the longer length of this ray path travels through the highest stress zone around the ONK-EH3 with the magnitude and orientation of the principal stresses closer to the one used in the true-triaxial experiments (Fig. 9). In another word, it has the least average distance to the highest stress point around the ONK-EH3 (Table 3).
Ray path 1–4 also passes close to ONK-EH3 but shows higher error values compared to ray path 1–2. This is interpreted to be due to the orientation of ray path 1–4 with respect to the orientation and magnitude of principal stresses and the fact that ray path 1–2 more likely to travel through a higher stress zone. The comparison between the results of these two ray paths highlights the importance of the principal stresses orientation with respect to the ray path direction.
Table 3Information of ray paths surrounding ONK-EH3 at the depth of 2 m.
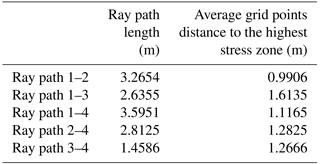
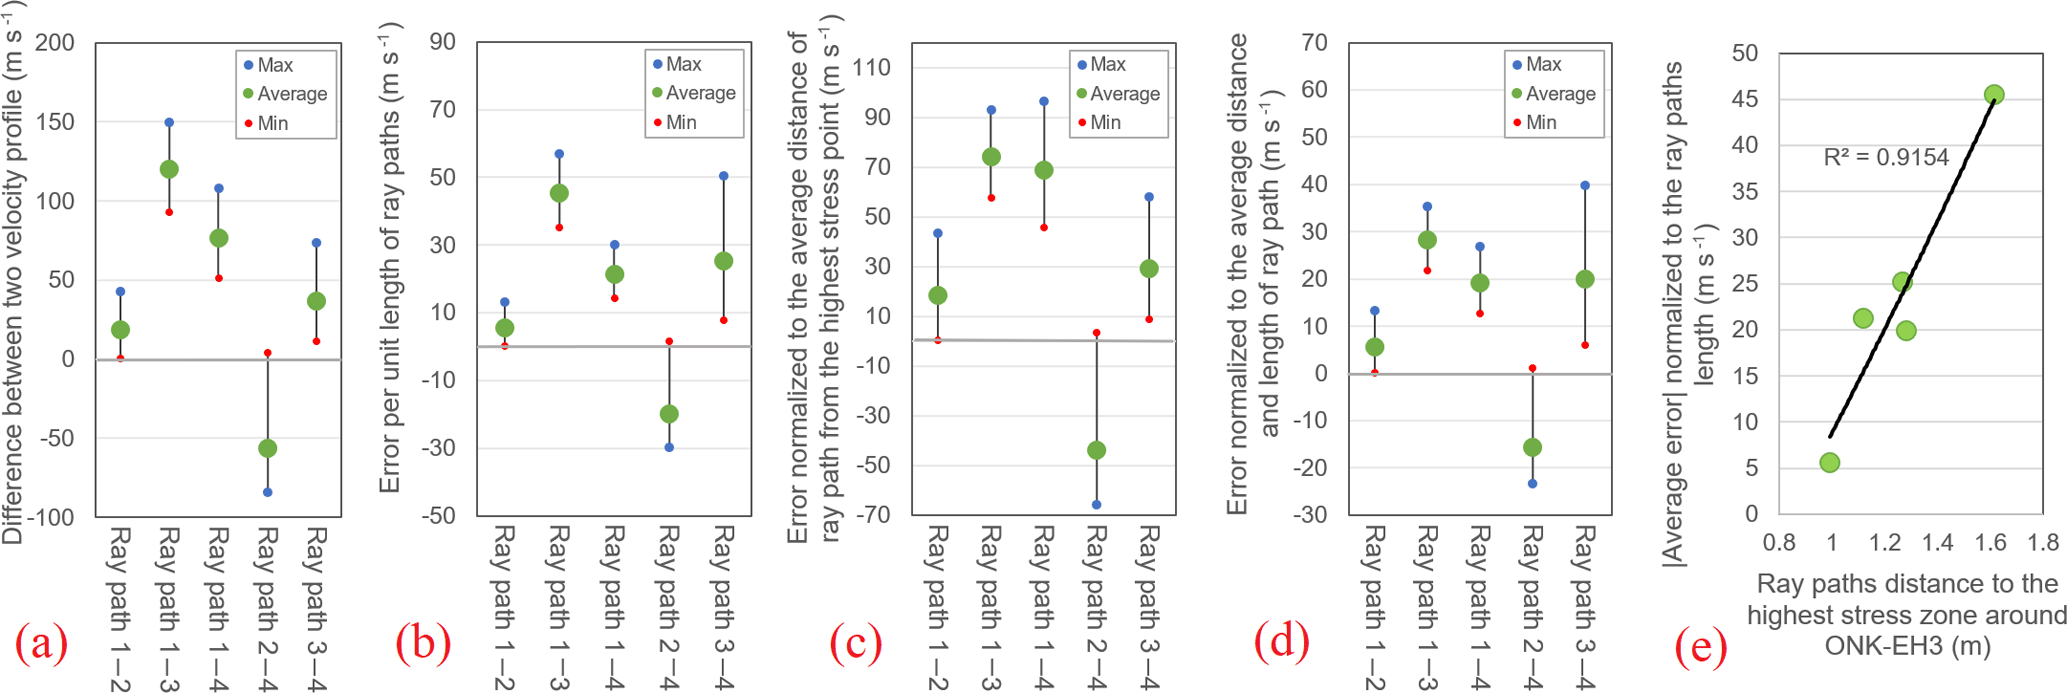
Figure 13Error plots as the difference between two velocity profiles of each ray path. (a) Non-normalized; (b) normalized to the length of ray paths (c) normalized to the averaged grid points distance located on each ray path from the highest stress zone around the experimental hole; (d) normalized to both length and average distance of ray paths; (e) the average error normalized to the ray path length as a function of the ray path distance (average distance of grid points) to the highest stress zone around ONK-EH3.
Inferring from the Fig. 13e, in general, the absolute normalized error per length of a ray path increases as the ray path travels farther away from the highest stress points around ONK-EH3. There could be two major explanations for this behaviour. Being farther from the highest stress zone means: (1) the stress path that each point along a ray path experiences, deviates more from the stress path used in the true-triaxial experiments. This explanation further corroborates the importance of stress path on rock behavior and the fact that extending the rock behavior under a specific stress path to other points subjected to different stress path is an approximation that comes with limitations. (2) Since the visual observation from the ONK-EH3 surface and the ground penetration radar (GPR) measurements (Johansson et al., 2014) were the basis of interpreting the target zone as a fairly homogenous PGR zone, being farther from the ONK-EH3 wall indicates higher uncertainty in having a homogenous PGR environment. These two factors combined explain the high error values of ray path 1–3, ray path 3–4, and ray path 2–4.
The maximum difference between the calculated and measured velocity profiles is observed to be limited to 150 m s−1 for the ray path 1–3 while the maximum normalized to unit length error is limited to 57 m s−1 (Fig. 13a and b). In general, with the exception of ray path 2–4, P-wave velocities measured in the field were slower than those calculated from the laboratory test data (positive error values). This can be related to the presence of larger flaws and more discontinuities in the rock mass in situ which is unlikely to be encountered in laboratory specimens used in true-triaxial testing. The exception of ray path 2–4 is interpreted to be due to its closeness to the VGN zone as addressed in Fig. 3. The comparison indicates a reasonable level of confidence for using true-triaxial laboratory measurements to confirm P-wave velocities at the field scale when dealing with a relatively homogeneous environment such as the PGR target zone.
Three true-triaxial experiments have been carried out in a unique geophysical imaging cell at the University of Toronto to duplicate the stress path that was believed to exist at the most critical point around the ONK-EH3. Pegmatite samples taken from the POSE niche and near the experimental hole were used in these true-triaxial experiments. Ultrasonic surveys have been performed during these experiments. At the initial stage of this report, reproducibility of these polyaxial experiments was verified by comparing the evolution of the compressional wave velocity along three principal stresses as a function of the corresponding principal stresses, the AE activity signature, and the mechanical responses of the samples. In this regard, a very good agreement was observed between the three samples. The true-triaxial experiments revealed that although PGR experiences the crack initiation, however, it is not prone to crack coalescence nor the strain localization, and it exhibits the linear elastic behaviour at the stress levels posed during the heating phase of the ONK-EH3.
During the third phase of the POSE experiment, velocity surveys were performed at specific ray paths around ONK-EH3. Those located at a depth of 2 m were chosen as the target ray paths. The reason for choosing those ray paths was the fairly isotropic pegmatitic environment surrounding the ray paths.
The analytical hoop stress solution and the thermo-elastic formulation were used to calculate the evolution in both orientation and the magnitude of principal stresses around ONK-EH3. Results are in a good agreement with those of the 3DEC performed by Hakala and Valli (2013). The velocities measured along the three principal stress directions in the laboratory were used to calculate the corresponding velocities at each point along the field ray path. An ellipsoidal model was implemented to estimate the velocities at any other angle from the principal stress directions. With this approach, the velocity profile was reconstructed for all five ray paths so that they could be compared to the field velocity measurements. Indeed, assigning the velocity data from the true-triaxial experiments (which experienced a specific stress path) to all points of the ray paths (which experienced different stress paths) was an approximation, nonetheless, a reasonable agreement was observed between the results at the two scales (with the error limited to 150 m s−1). A linear trend was observed between the error per length of the ray path as a function of its distance to the highest stress point. This is interpreted to be due to: (1) the higher deviation from the stress path used in the true-triaxial experiments and (2) higher uncertainty in having a homogenous PGR by going farther away from the experimental hole.
There are inevitable uncertainty sources involved in the proposed method that are to be minimized. Some of which are uncertainties in precise arrival time pickings of the lab and field data, accurate lithological information beyond the GPR measurement limits, in situ stress interpretations, and extending the linear elastic assumption to the whole target zone.
Comparing the velocity profile obtained for PGR at the two scales (field and lab) reveals the importance of 3-D stress path on rock behaviour which further corroborates the usefulness of the true-triaxial experiments. Rock material can represent very close behaviour at the laboratory to field scale if the lithological complexities are avoided and correct assumptions and methods are taken into consideration.
The datasets used in the current study belongs to Posiva Oy and are available in Posiva Oy data repository (http://www.posiva.fi/, last access: 17 August 2018). The datasets generated during the current study are available from the corresponding authors on reasonable request.
The authors declare that they have no conflict of interest.
This article is part of the special issue “European Geosciences Union General Assembly 2018, EGU Division Energy, Resources & Environment (ERE)”. It is a result of the EGU General Assembly 2018, Vienna, Austria, 8–13 April 2018.
We gratefully acknowledge Posiva Oy, Finland for their financial support of
this project. We would also like to thank William Sheng Hua Ye for his
significant contribution in helping with the laboratory experiments.
Additionally, we would like to thank Mehdi Ghofrani Tabari for his help in
sample preparation.
Edited by: Sonja
Martens
Reviewed by: two anonymous referees
Hakala, M. and Valli, J.: ONKALO POSE Experiment-Phase 3: 3DEC Prediction: Working Report 2012-58, Posiva Oy, Finland, 2013.
Hiramatsu, Y.: Stress around a shaft or level excavated in ground with a three-dimensional stress state, Memoirs of the Faculty of Engineering, Kyoto University, 1962.
Johansson, E., Siren, T., Hakala, M., and Kantia, P.: ONKALO POSE Experiment – Phase 1&2: Execution and Monitoring: Working Report 2012-60, Posiva Oy, Finland, 2014.
Koittola, N.: Geological 3D Model of the Investigation Niche in ONKALO Olkiluoto Southwestern Finland, Working Report 2014-35, Posiva Oy, Finland, 2014.
Kwasniewski, M., Li, X., and Takahashi, M. (Eds.): True triaxial testing of rocks, CRC Press, Taylor and Francis Group London, UK, Vol. 4, 2012.
Nasseri Behrestaghi, M. H., Young, R. P., and Suikkkanen, J.: ONKALO POSE Experiment – Strength, Deformation and Siesmic Response of Alkiluoto Isotropic Pegmatiteic Granite and Anisotropic Migmatitic Gneiss Under the State of True Triaxial Stress: Working Report 2016-41, Posiva Oy, Olkiluoto, Finland, 2016.
Nasseri Behrestaghi, M. H., Sehizadeh, M., and Young, R. P.: ONKALO POSE Experiment – Integrated analyses of true-triaxial tests: Working Report 2018-14, Posiva Oy, Eurajoki, Finland, in press, 2018.
Nasseri, M. H. B., Sehizadeh, M., Sheng Hua, Y., Young, R. P., Flynn, J. W., Suikkanen, J., and Siren, T.: Strength Deformation and Seismic Responses of OLKILUOTO Migmatitic Gneiss under Laboratory True-Triaxial Stress, ISRM- ISRS International Symposium on In-Situ Rock Stress, 10–12 May, Tampere, Finland, 2016.
Nasseri, M. H. B., Sehizadeh, M., and Young, R. P.: X-ray CT imaging and petrofabric analysis of Olkiluoto rock specimens tested under true-triaxial stresses, American Rock Mechanics Association (ARMA), 17–20 June, Seattle, USA, in press, 2018.
Reyes-Montes, J. M., Flynn, W., and Huang, J.: ONKALO POSE Experiment – Phase 3: Acoustic and Ultrasonic Monitoring: Working Report 2013-39, Posiva Oy, Finland, 2014.
Ritchie, R. and Sakakura, A.: Asymptotic expansions of solutions of the heat conduction equation in internally bounded cylindrical geometry, J. Appl. Phys., 27, 1453–1459, 1956.
Schmitt, D. R., Claire, C. A., and Zhang, L.: Crustal stress determination from boreholes and rock cores: Fundamental principles, Tectonophysics, 580, 1–26, 2012.
Valli, J., Hakala, M., Wanne, T., Kantia, P., and Siren, T.: ONKALO POSE Experiment – Phase 3: Execution and Monitoring: Working Report 2013-41, Posiva Oy, Finland, 2014.
Voight, B. and Stephens, G.: Hydraulic fracturing theory for conditions of thermal stress, Int. J. Rock Mech. Min., 19, 279–284, 1982.
Young, R. P., Nasseri, M., and Lombos, L.: Imaging the effect of the intermediate principal stress on strength, deformation and transport properties of rocks using seismic methods, CRC Press/Balkema, Leiden, the Netherlands, 4, 167–179, 2012.
- Abstract
- Introduction
- Homogeneous zone of PGR in situ
- Laboratory experimental Setup
- PGR laboratory reproducibility
- Calculating the 3-D stress tensor around the ONK-EH3
- Approximation of the field wave velocity
- Comparison of the P-wave velocity in PGR at field and laboratory scales
- Summary and discussion
- Data availability
- Competing interests
- Special issue statement
- Acknowledgements
- References