 | 09 Dec 2025
Waiwera: evolving understanding for management of a New Zealand shallow and low enthalpy geothermal system
Graham Paul D. Viskovic
Tim Schöne
Melissa Präg
Charlotte Ribacki
Leonard Grabow
Thomas Kempka
Waiwera in New Zealand is a small coastal village with a 50 °C warm reservoir of 400 m thickness directly underneath. Hydrogeological models support water management by providing insights into sustainable extraction from the system. It is artesian and the geothermal water is of meteoric origin percolating down to sufficient depth getting heated. It rises through a fault zone into the shallow and leaky aquifer. Therein the geothermal water mixes with cold fresh groundwater and sea water. The aim of the presented study is to summarise the scientific work over the past decades and the knowledge and progress in process understanding. New radiocarbon dating shows the geothermal water entering the reservoir to be >20 000 years old and underlines the topography driven recharge model. Water management plans helped curbing overproduction. Most recently the springs have restarted discharging geothermal water on the beach.
- Article
(3173 KB) - Full-text XML
- BibTeX
- EndNote


Waiwera is a small east coastal township, north of Auckland, New Zealand, which has developed mainly as a resort area (Fig. 1). A low temperature geothermal reservoir is located underneath the township, which was first recognised from the presence of hot springs emanating on the local beach front. The proximity to the sea is an important feature of the geothermal aquifer. Water of approximately 50 °C is feeding into the reservoir, which is a unique and important balneological asset to the people of the region.
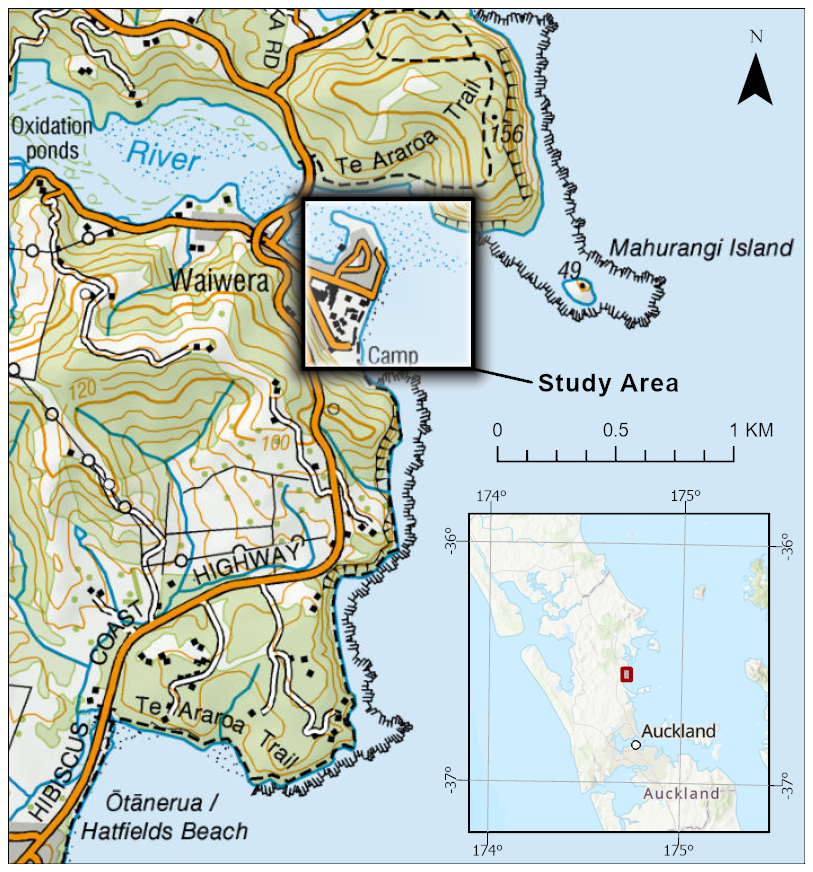
Figure 1Waiwera study area north of Auckland (New Zealand). Insert: Topographic information supplied by Land Information New Zealand (2024).
The investigated geothermal reservoir in Waiwera with its natural hot springs has been known for centuries (ARWB, 1980). Due to overproduction during the 1960s and 1970s the reservoir has suffered significant pressure losses, which resulted in the aquifer no longer being artesian and led to the desiccation of the hot springs between 1975 and 1976 (ARWB, 1987). For a sustainable geothermal reservoir management, the extensive knowledge of structural geology, rock properties, heat transfer mechanisms, and resulting physical and chemical interactions is crucial. This knowledge enables the creation of geological models which describe the processes within the reservoir. It is the basis for numerical simulations and in that way an important prerequisite for all production and management plans that aim to preserve the natural resource.
As a consequence of the adopted “Waiwera Thermal Groundwater Allocation and Management Plan” (ARWB, 1987), the geothermal system slowly recovered. However, the reduced production rates did not allow the return to artesian conditions or the reactivation of the hot springs in the first place (Kühn and Stöfen, 2005). But, shortly after the primary user (Waiwera Thermal Resort & Spa) shut down its operation in 2018, locals reported overflowing boreholes to the Auckland Council. This indicates a progressing recovery of the geothermal system including the return to artesian conditions, which has been confirmed in council monitoring boreholes and the springs have restarted discharging geothermal water (Viskovic et al., 2025).
Major previous works on the geothermal reservoir in Waiwera includes the “Geothermal Groundwater Resource Statement and Allocation Plan” (ARC, 1991), the “Waiwera Geothermal Water Resource Assessment Report” (ARC, 1999), the “Hydrogeological Evaluation of the Waiwera Geothermal Aquifer” (Zemansky, 2005), the “Geothermal reservoir characterisation of faulted and folded turbidite sequences, Waiwera, New Zealand” (Präg, 2020), “Numerical simulation of spatial temperature and salinity distribution in the Waiwera geothermal reservoir, New Zealand” (Kempka and Kühn, 2023), and “New data for a model update of the Waiwera geothermal reservoir in New Zealand” (Kühn et al., 2024). From the wealth of publications and reports and results therein, the understanding of the geothermal system evolved along the line, and we discuss and present here the current and most recent conceptual geoscientific view.
The springs, and the Maoris' use of them, were described as early as 1841: “At the mouth of a creek about five miles south of Mahurangi the main spring gushes out from a high cliff […]. When any person wishes to bathe, he digs himself a pool in the sand, sufficiently deep to allow of his lying down […]. He may then enjoy a comfortable bath”. […] “The attempt to create spas, either for New Zealanders or for overseas visitors, began in the first half of the nineteenth century, with Robert Graham's purchase of Waiwera […]” (Rockel, 1986). Similar artesian springs at Hot Water Beach in the Coromandel attract ∼700 000 tourists a year (490 000 being domestic visitors and 210 000 international; Barns and Luketina, 2011).
Concern over declining geothermal water levels prompted the Auckland Regional Water Board (ARWB) in 1977 to initiate an exhaustive study of the geothermal resource. In 1980, the ARWB published the findings under the title “Waiwera Water Resource Survey and Preliminary Water Allocation and Management Plan” (ARWB, 1980). The aim of this study was to comprise all data available on the system and to improve the understanding to adequately protect the reservoir from over-production. Besides others, mainly water level and temperature data were collected, and a network of monitoring boreholes was established to measure water level trends. Part of that was a newly constructed 400 m deep monitoring borehole near the beach front and close to the centre of the geothermal area. Based on this first comprehensive survey and the resulting data set, preliminary water permits were granted.
Involved in the reservoir characterisation work at Waiwera was the Geothermal Institute from the University of Auckland. In 1986 two student reports became available. Gonzalez (1986) did a thermal field survey and interpreted the resulting downhole temperature profiles from fourteen boreholes. The locations included the township, as well as areas north and south of it and outside the centre. Alvarez (1986) tested the concept based on a two-dimensional numerical model parametrised with the collected data to simulate the effects of water production on the pressure and temperature distribution in the Waiwera geothermal field. The overall aim was to assess the feasibility of predicting the reservoir behaviour in the future and quantifying a suitable production rate for water production.
A new “Waiwera Thermal Groundwater Allocation and Management Plan” (ARWB, 1987) was adopted in 1987 and water permits were granted accordingly. This report summarises the monitoring programme on production, water levels, temperatures, and chemical compositions to revise and update the previous allocations. Conditions that allow cold seawater or non-thermal groundwater with higher hydraulic head to flow into the thermal aquifer must be avoided (Fig. 2). The variations are caused by changes in the total abstraction rates, which increase or decrease depending on the main user, the hot pools facilities. Therefore, part of the report (ARWB, 1987) was the evaluation of future demands for geothermal water and challenges associated with the utilisation of this resource. The main issues at that time related to the use of the Waiwera reservoir were challenges in regard to heat wastage, high abstraction rates, methods of increased borehole production temperatures, and improving thermal conservation.
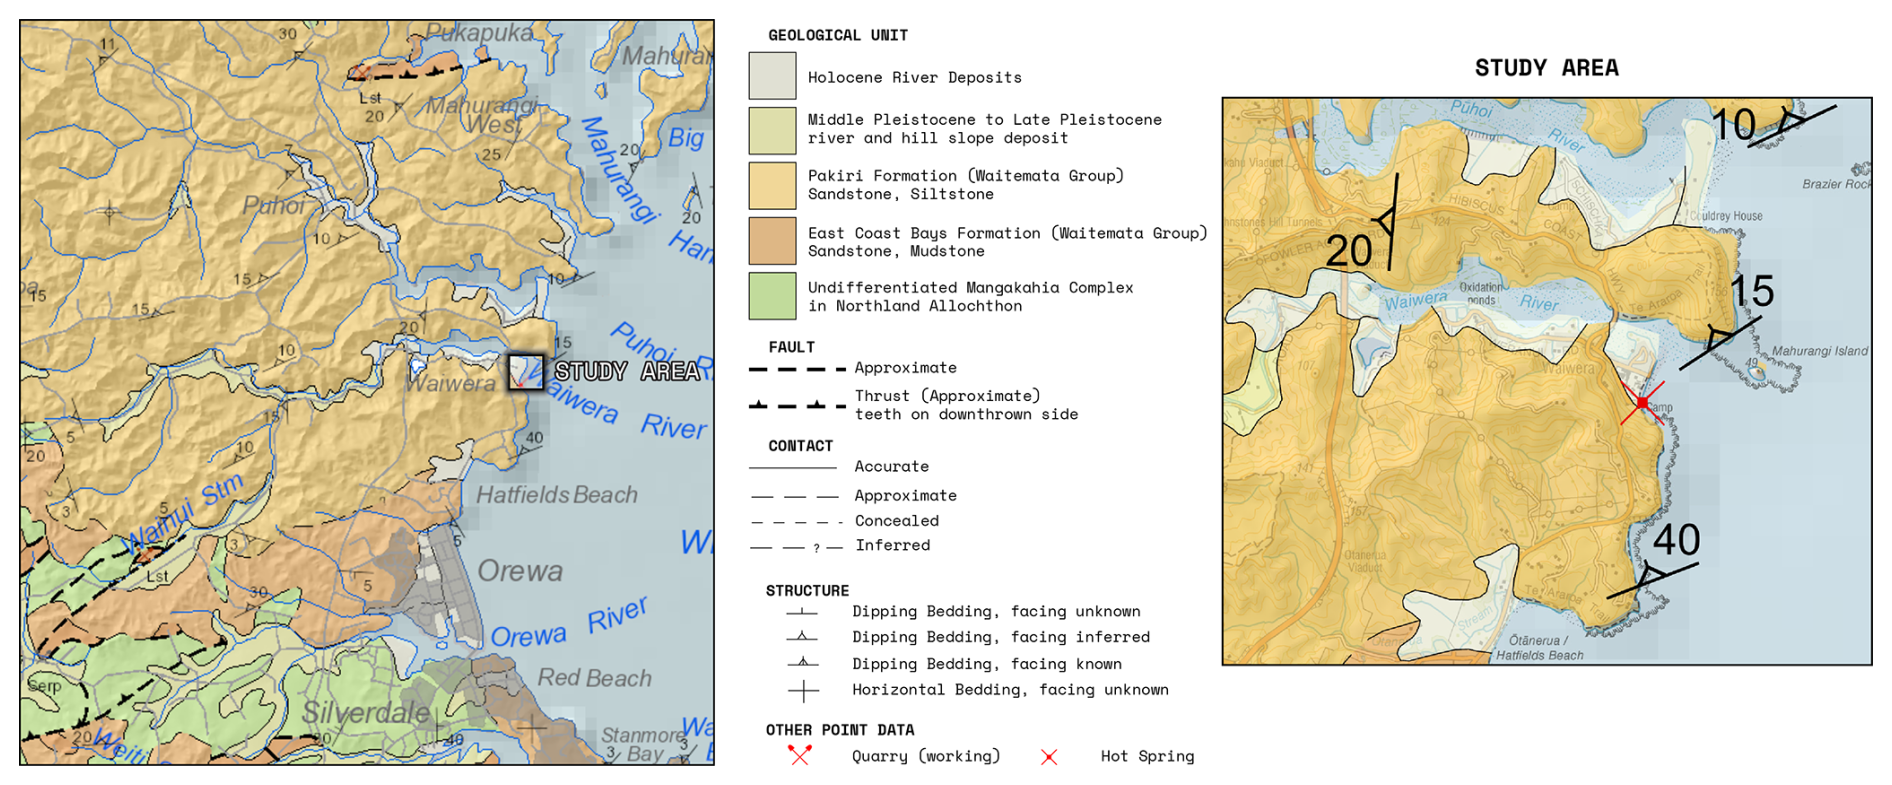
Figure 2Geological map of the study area at Waiwera. Insert: Topographic information supplied by Land Information New Zealand (2024) and geological information by Edbrooke (2001).
The next step followed the introduction of the Resource Management Act to promote sustainable use of natural and physical resources. The “Waiwera Geothermal Groundwater Resource Statement and Allocation Plan” (ARC, 1991) provided a mechanism by which the intent of the Act was implemented through a system of permits for geothermal water usage. As part of the Auckland Regional Council (ARC) restructuring in 1989, the Auckland Regional Water Board (ARWB) became the Environmental Management Department of the ARC, although the responsibilities remained very much the same. Information on the nature of the geothermal field and its response to use was updated. The geothermal water is used for recreational purposes, i.e., swimming pools. The previous management plan and water rights granted in 1987 were reviewed and applications for replacement water permits approved.
An “Investigation of the dynamics of the Waiwera geothermal groundwater system” was done by the University of Waikato (Chapman, 1998) to estimate the yield from the aquifer to support a sustainable reservoir management. The primary objective of the study was to develop a model capable of explaining borehole water level fluctuations, and one that could be developed as a tool in a predictive sense. This work builds on the first attempt of a linear univariate regression model (ARC, 1991). Chapman (1998) fitted a standard multi-well Theis regression model and evaluated its usefulness as a predictor of monitoring borehole water levels. More specifically, the study intended to identify the parameters with the greatest effect on geothermal groundwater levels, including an evaluation of recharge mechanisms, and the effects of hot water abstraction on the system. Here, the aim was to estimate the required water level in the ARC monitoring borehole to maintain the reservoir pressure.
The last of four larger reports by the water board, respectively Auckland Council, was issued in 1999 (ARC, 1999). A significant amount of information on the Waiwera geothermal system has been presented in the previous three (ARWB, 1980, 1987; ARC, 1991) with a comprehensive description on the geothermal aquifer based on hydrogeological, water chemistry, and temperature data. Therefore, the new report focused especially on the newly drilled deep borehole of the largest user, the “Waiwera Thermal Resort & Spa”. Since the commissioning of the new production well, water levels in the ARC monitoring borehole rose significantly. Regardless of the mechanisms for change, recovering water levels are contrary to what has been predicted by the models of Chapman (1998). In other wells, it was observed that the proportion of seawater decreased, which is ascribed to increased geothermal water levels. A summary of previous findings, highlights, and understanding of the system is given (ARC, 1999).
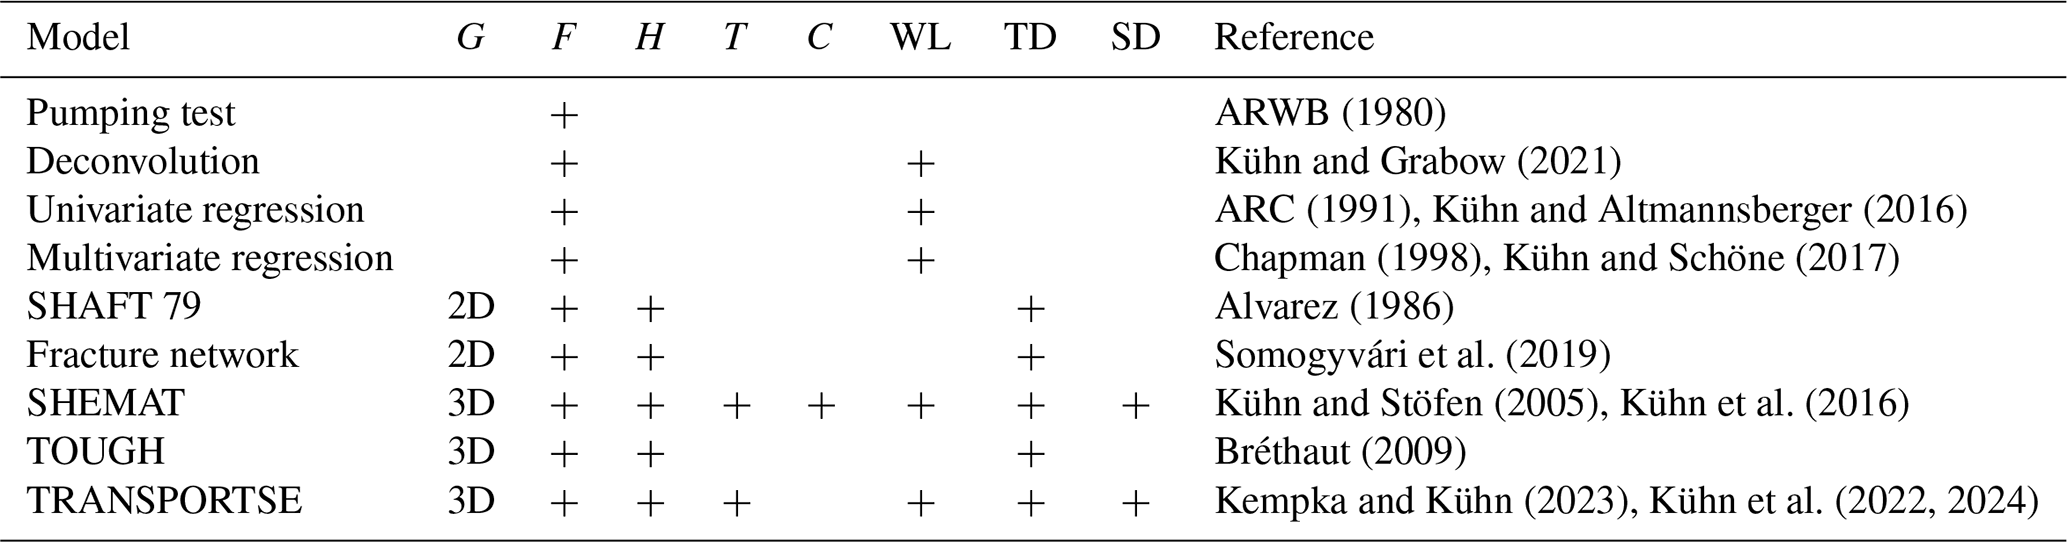
Table 1Comparison of the models created and used for Waiwera. The geometry (G) of the system under consideration, the processes taken into account (F = flow, H = heat, T = transport, C = chemistry) and the resulting outcomes (WL = water level, TD = emperature distribution, SD = salinity distribution) are indicated (adapted from Kühn et al., 2016).
All readily available information about the Waiwera geothermal aquifer was manually compiled and reviewed by GNS Science. Zemansky (2005) concluded that the potential of the resource and the usage at that time was at its maximum, while still meeting ARC's management objective of an annual average water level above the mean sea level in the reservoir. Additionally, recommendations for further groundwater sampling and especially age dating were provided. It has been suggested to update the available information on aquifer water quality, so that changes since 1980 could be considered and provide new information and insights. A couple of years later, GNS Science re-evaluated the system to conclude that a newly drilled well for minor usage would influence the water level within the ARC monitoring borehole only to a small extent (Rose and Zemansky, 2013). However, they state that greater certainty would be gained with a newly performed aquifer test.
Sustainable water management of a geothermal system makes it is necessary to develop a hydrogeological model that is capable to describe the actual hydraulic and thermal states. Models of varying complexity have been created since the 1980s (e.g. Alvarez, 1986; Chapman, 1998). These and others are summarised and presented in Kühn et al. (2016). Hydrogeological models of a water catchment area can, but do not have to be computer-based. In general, the main aim is to compare water abstraction with natural groundwater recharge in view of the groundwater mass balance. For the Waiwera reservoir, the focus is on the question of how much geothermal water is continuously available. Table 1 shows a comparison of the complexity of the various models.
Nine larger and more comprehensive models of different types have been applied to characterise the reservoir. Four of the models are not directly related to the geometry of the area (ARWB, 1980; ARC, 1991; Chapman, 1998; Kühn and Altmannsberger, 2016; Kühn and Schöne, 2017; Kühn and Grabow, 2021). Two models depict the reservoir in a two-dimensional one-layer fashion horizontally (Alvarez, 1986) and vertically (Somogyvári et al., 2019) and three are three-dimensional representations (Kühn and Stöfen, 2005; Bréthaut, 2009; Kempka and Kühn, 2023). Four models depict only the flow process (ARWB, 1980; ARC, 1991; Chapman, 1998; Kühn and Schöne, 2017; Kühn and Grabow, 2021), three combine flow and heat transport (Alvarez, 1986; Bréthaut, 2009; Somogyvári et al., 2019), one covers flow, as well as heat and species transport (Kempka and Kühn, 2023) and one coupled flow, heat and species transport, and chemical reactions (Kühn and Stöfen, 2005). The coupled models provide detailed information about the processes taking place in the reservoir and are able to produce spatial temperature distributions on the one hand and salinity distributions on the other (Table 1). Five of the models provide changes in water level that are decisive for water management and can be compared with field measurements (ARC, 1991; Chapman, 1998; Kühn and Altmannsberger, 2016; Kühn and Schöne, 2017; Kühn and Grabow, 2021) or can be derived from them (Kühn and Stöfen, 2005; Kempka and Kühn, 2023; Kühn et al., 2022, 2024). Overall, it should be noted that all various modelling approaches (Table 1) provide answers only to specific aspects for the resource management of the geothermal reservoir.
In Waiwera, almost 100 boreholes have been drilled in the past to provide hot water. They are mainly private and tap the reservoir down to a maximum depth of 400 m b.m.s.l. (below mean sea level). The area of the town consists of flat land immediately adjacent to the Waiwera River mouth (Fig. 2). It is composed of unconsolidated alluvial and marine sands, silts, and clays of Holocene age that are around 10 m thick (Zemansky, 2005). These are underlain by the early Miocene age Waitemata Group hosting the geothermal reservoir within compacted and cemented sandstones and siltstones (ARWB, 1987). The shallow geothermal system is sealed at the bottom by Mesozoic Waipapa (composite) Terrane greywacke rocks (Edbrooke, 2001).
Deposition within the Waitemata Basin took place in an active tectonic setting and mainly consists of bathyal turbiditic sediments (Ricketts et al., 1989). The reservoir within the Pakiri Formation is part of the Waitemata Group (Schofield, 1989), which is the dominant rock type around Waiwera (Fig. 2). The Waitemata Basin was formed during a major marine transgression and as response to the southward's propagation of the New Caledonia subduction zone (Ricketts et al., 1989; Schellart et al., 2006). It represents a short phase of marine depression (ca. 23–17 Ma) with a length of ca. 130 km, a lateral extent of ca. 60 km and a maximum sediment thickness of around 1 km (Ballance, 1974; Hayward, 2004). An unconformity separates the Waitemata Group from the three major underlying bedrock formations, which are Oligocene platform carbonates and sands in the south, the Northland Allochthon in the west and centre, and a Permian-Jurassic metagreywacke of the Waipapa Group in the east (Raza et al., 1999; Ricketts et al., 1989). The deposits of the Waitemata Group are in general poorly consolidated and mostly slightly dipping or horizontal. However, there are local zones of intense folding and faulting, which indicate syn-depositional and post-depositional deformation (Raza et al., 1999).
The shallow low-enthalpy geothermal system at Waiwera is driven by the meteoric water cycle. The origin of the water is deduced by its chemical composition and the enclosed gases (mainly nitrogen, carbon dioxide is only present in traces, no hydrogen sulphide), which precludes a volcanic source (ARWB, 1980). It is further assumed that the thermal water is sourced by rainwater from farther inland (Fig. 2), which percolates to a depth between 1200 and 2200 m (indicated by the silica content of the thermal water) and flows seawards, while being heated by a fairly average temperature gradient of about 30 °C km−1 (ARWB, 1987; ARC, 1999). Vertical migration of the maximum 50 °C warm water is inferred to be facilitated by faults. Hochstein (1988) proposed that warm spring systems often develop at the intersection of two deep fracture zones driven by thermal upwelling. A major feature of the horst-graben structure is the W–E striking Waiwera fault (Alldred, 1980) complemented by a N–S trending fracture within the greywacke basement rock of the Waipapa Group (Fig. 3). The existence of this fracture has been further supported to be highly likely (Präg, 2020). Bréthaut (2009), succeeded in simulating a topography-driven deep convection cell between the surrounding hills and the rising up-flow along the faults under the Waiwera township in a deeper model.
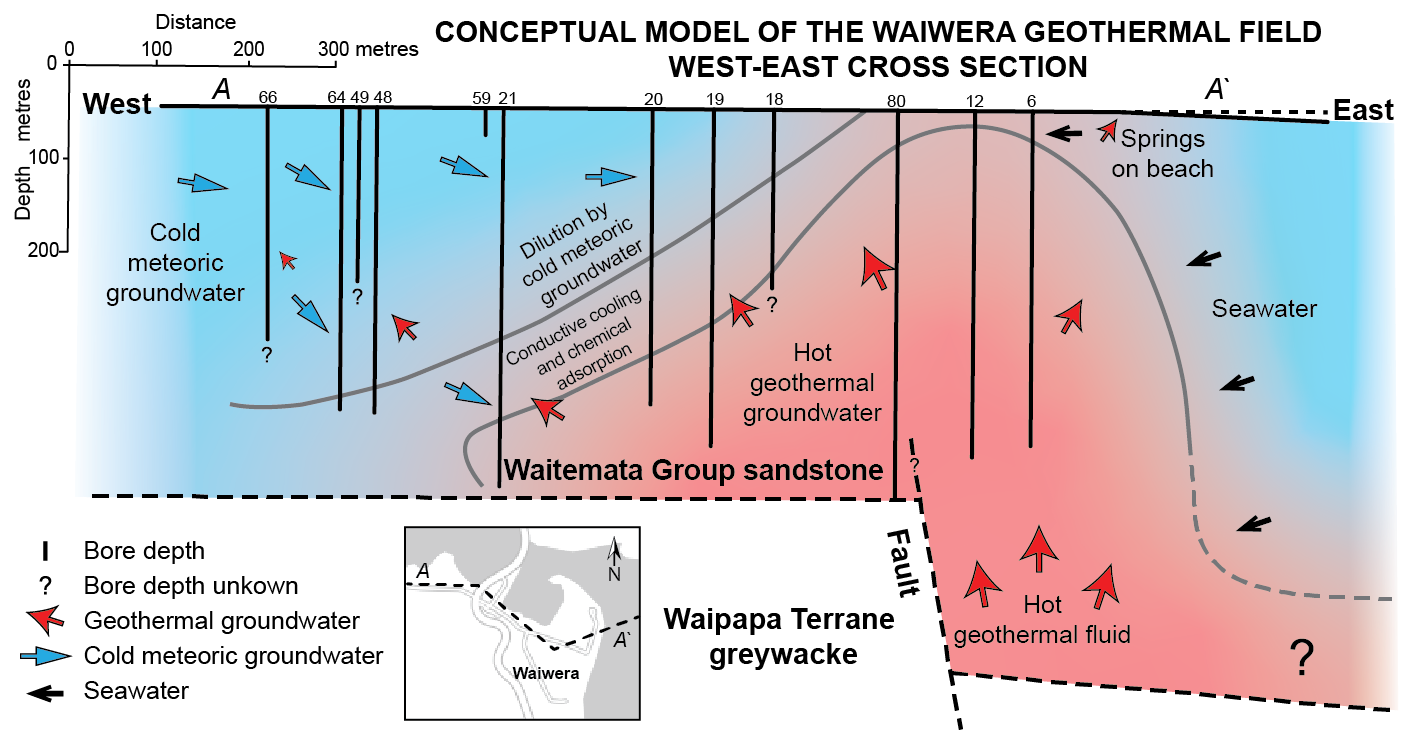
Figure 3Conceptual cross-section of the geothermal area at Waiwera. The reservoir is fed by three different waters. The fault zone at the base of the reservoir is thought to be the thermal source (from Kühn et al., 2024).
In addition to the geothermal water that recharges the aquifer from below, two more types of water enter the reservoir (Fig. 3) altering its hydraulic, thermal, and chemical conditions. An influx of cold (ambient temperatures), fresh, near-surface groundwater comes from the west, while seawater intrudes from the foreshore in the east (ARWB, 1980; Kühn and Stöfen, 2005). The intruding cold groundwater and seawater have the potential to alter the hydraulic conditions of the geothermal reservoir by suppressing the rising thermal water. Therefore, the abstraction rates from the reservoir have been managed with allocation plans to maintain a minimum water level in the observation well of the Auckland Council (ARWB, 1987; ARC, 1991, 1999).
The long-standing conceptual model for the Waiwera geothermal system shows hot water migrating up the fault zone (Fig. 3). The indicated downthrow of the fault to the east was determined to be 180 m (Viskovic et al., 2023). Based on that finding, most recent simulations are able to better explain the slightly colder part of the reservoir to the west, along the major N–S trending structure (Fig. 3). Simulated and observed temperature profiles show a very good and improved agreement in the near field due to the newly characterised reservoir base (Kühn et al., 2024). However, the extent of the fault beyond the Waiwera township is not well constrained, yet, and future field campaigns should help to delineate the system further.
The chemical constituents provide information about the origin of thermal, cold non-thermal, and seawater within the studied area. Geothermal groundwater from Waiwera displays a considerable variation in chemical composition, particularly in chloride concentrations. Recent water sampling undertaken by Viskovic et al. (2023) confirmed previous findings. Total dissolved solids, chloride, and sodium all decrease significantly from the main beach to the west (Fig. 2). An increasing percentage of seawater is intruding into the geothermal system closer to the beach. Boron and potassium in the Waiwera geothermal waters are of higher concentrations than in seawater. The concentrations decrease in both directions away from the fault, away from the geothermal source, in support of earlier conclusions (ARC, 1999; Kühn and Stöfen, 2005).
Geochemical simulations of the fresh, the geothermal, and the estuary water underline thermodynamic equilibrium with calcite as mineral. Due to mixing of the different water types as well as temporal and spatial changes in temperature, calcite precipitation occurs. It has been found that the Waitemata sandstone is partly cemented by calcite (ARWB, 1980; ARC, 1999). Calcite precipitations on fault planes and in the form of veins are relatively common within the Waitemata Group rocks and on the outcrops at the beachfront (Präg, 2020). Calcite precipitation is an indicator for hot water up-flow regions. Overall, water level, temperature, and chemistry characterise the conditions and processes within the geothermal reservoir.
Most researchers believe that the geothermal waters at Waiwera are not of volcanic origin but rather rainfall percolates downward until heating by the background geothermal gradient causes temperature driven upwelling (ARWB, 1987; ARC, 1999). At Waiwera vertical migration of the hot water is inferred to be facilitated by a fault zone (Kühn et al., 2024). Fault bounded low temperature meteoric geothermal systems are common throughout New Zealand such as: Parakei, Whitford, Miranda and Ohinewai (Reyes et al., 2010; Reyes, 2015) and internationally (Hurter and Schellschmidt, 2003; Reed et al., 1983). Waiwera is however unique in that it is one of the better documented geothermal systems in New Zealand. Auckland Council has high-quality long-term borehole monitoring and the major user abruptly stopped production providing the almost unique context to understand how fast and how effectively degraded surface geothermal features can be recovered. This is particularly relevant as internationally many exploited geothermal systems have had natural surface features degrade after development such as Long Valley caldera, Coso Hot Springs and Amadee Hot Springs in California and Steamboat Springs Nevada (Sorey, 2000).
The question if the Waiwera system is hydraulically confined or unconfined has been debated (Fig. 4). ARWB (1980) assumed that a cap layer must exist because of the artesian flow from the reservoir. Further, the water level is not influenced by rainfall recharge (Chapman, 1998). In the contrary, it is affected by tidal and barometric pressure changes (Alvarez, 1986) indicating unconfined conditions. Nevertheless, quaternary clays and silts overlie the Waitemata Group rocks and together with the weathered part of the Waitemata sandstones, have been considered to form confining layers on top of the aquifer. However, weathered sandstones are usually permeable as the cement surrounding the grains is often dissolved. The alluvium deposits are certainly of a lower permeability, yet they are relatively thin and restricted to a small area, unlikely to confine the whole reservoir. Beyond that, the artesian behaviour was explained by topographically-driven convective movement (Bréthaut, 2009; Fig. 4). A deconvolution well test analysis applied to the decades long data set of Waiwera gave indication for a leaky flow boundary of the system which was a priori presumed as confined (Kühn and Grabow, 2021). Finally, there is evidence on the one hand that the system is confined, but shows unconfined components on the other.
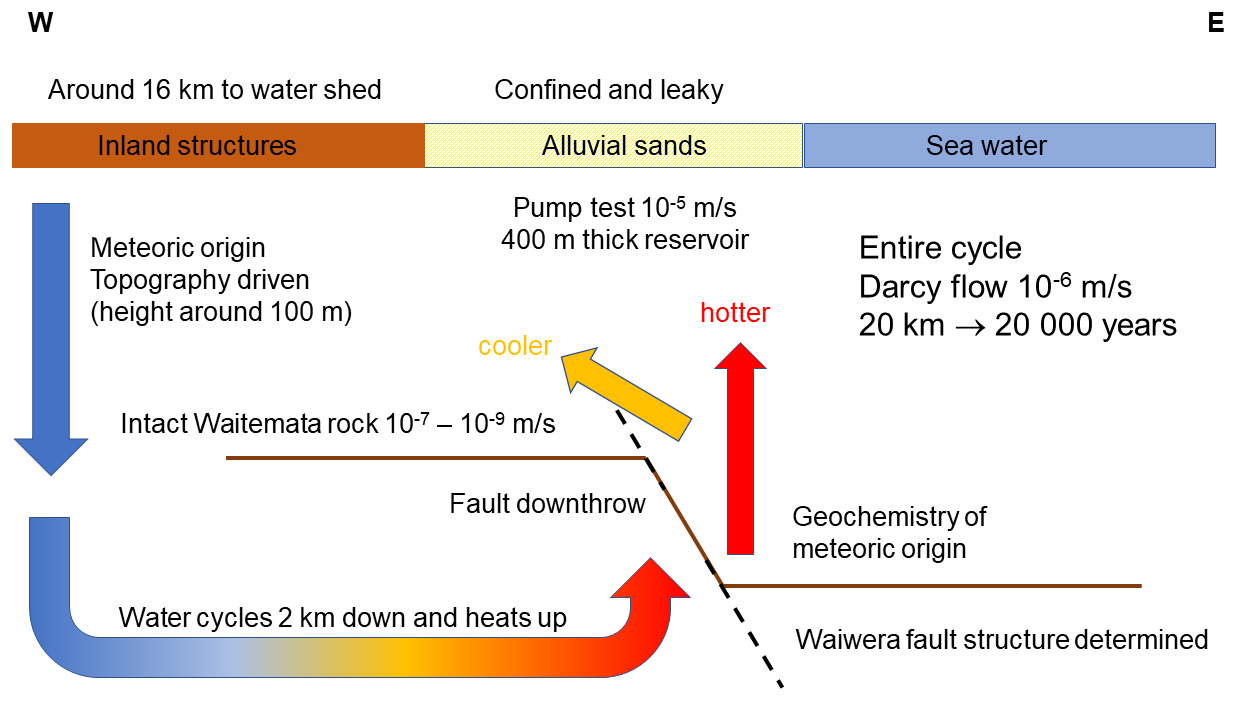
Figure 4Larger region around the geothermal area at Waiwera (not to scale, compare Fig. 3). The geothermal water is of meteoric origin and topographically driven into the reservoir from below via a fault system. Radiocarbon dating outline an age of 20 000 years. This would allow the water to cycle 20 km under the assumption of a Darcy flow regime with intermediate hydraulic conductivity between the intact Waitemata rock and the highly fractured reservoir.
Faults and fractures were identified as main hydraulic features and important as fluid pathways for the geothermal system at Waiwera (Präg et al., 2020). The stratified reservoir rock has been tilted, folded, faulted, and fractured by tectonic movement (ARC, 1991, 1999). The measured high transmissivity of the reservoir (Table 1; ARWB, 1980) is only possible through the presence of open faults and fractures in combination with individual lithologies conductive for fluid flow (Präg, 2020). The water level of the reservoir is mainly governed by production operations due to a commonly strong pumping signal. However, in the hours and days after the Kaikoura earthquake on 14 November 2016, it increased, indicating that seismic events can have an influence as well. Despite this observation made, Kühn and Schöne (2018) could not find a clear connection between water level, respectively geothermal source capacity, and seismicity because most of the recorded earthquakes at the Waiwera area probably had a too low energy density compared to the strong Kaikoura event. Somogyvári et al. (2019) tested discrete fracture network models (DFN) to identify the inherent geological structures of the system in more detail. A major limitation of this approach is that the results are strongly dependent on the model parametrisation. Finally, it needs to be recognised, that DFN inversion cannot compete yet with complex three-dimensional continuum models. At least, they indicate areas of the aquifer where fracturing plays a strong role (Somogyvári et al., 2019). A step forward in that regard was the new geological model provided by Präg (2020). The outcrops around Waiwera (Fig. 2), as part of a horst and graben structure, serve as analogues for the reservoir below the town. Petrophysical and petrographic analysis determined reservoir quality. Präg (2020) outlined that the tectonic setting at Waiwera represents a local zone of intense deformation within the Waitemata Group. Unmanned aerial vehicles (UAVs) were used to carry out structural and lithological mapping, allowing photogrammetric analyses that were compared to manual measurements.
Repeated aerial thermal infrared (TIR) surveys at Waiwera finally monitored recovery of artesian flow in the low-enthalpy system (Präg et al., 2020; Viskovic et al., 2025). There is now evidence of the geothermal system rapidly recovering pressure and causing boreholes to overflow after the shutdown of its primary user (Waiwera Thermal Resort & Spa) in 2018. TIR surveying has confirmed that springs have restarted discharging geothermal water. The springs have increased in temperature between October 2019 (Präg et al., 2020) and May 2022 (Viskovic et al., 2025). Controlling overflowing boreholes may allow the coastal artesian springs to return to their historic recreational use.
Age dating of the geothermal water supports the topography-driven flow model (Fig. 4). Water samples were taken and treated with the radiocarbon method as part of a recent field survey (Viskovic et al., 2023). The measurements showed that the geothermal fluids have effectively no so-called modern component (fraction modern ∼5 %) with an age of >20 000 years. The system seems to be recharged from below by meteoric water at a very low rate. The entire length of the potential flow path can be summed up to around 20 km considering the approximate distance of 16 km to the watershed to the West from Waiwera (Fig. 1) and 2 km depth of the convection model inferred from the temperature induced water composition (Bréthaut, 2009). Based on Darcy's law, an overall hydraulic conductivity of around 10−6 m s−1 can be estimated for the water to pass through the system. This is intermediate to values determined by the pumping test (ARWB, 1980) and petrophysical investigations (Präg, 2020). The pumping test was conducted in April 1979 and revealed a fairly homogeneous composition of the aquifer with a transmissivity of 320 m2 d−1. Taking into account the reservoir thickness of 400 m this relates to a hydraulic conductivity on the order of 10−5 m s−1. This is a comparably high value for the Waitemata Group attributed to groundwater flow given by fractures rather than pores (ARWB, 1980). In contrast, petrophysical measurements of intact Waitemata sandstone from the Waiwera Hill Scenic Reserve cliff showed porosities of around 20 % with permeabilties in the range of 0.1 to 10 mD, equivalent to 10−7 to 10−9 m s−1 (Präg, 2020). Flow path length and average hydraulic conductivity of the system support the meteoric water cycle assumption (Fig. 4).
Management tools are required to regulate water abstraction and ensure sustainable reservoir utilisation. It was shown by Kühn et al. (2016) that data driven models (Table 1), which are based on experience (monitoring), can provide better prognoses than process-based simulations, because their calibration with water production rates from and resulting water levels in the reservoir can be done with higher accuracy. This was proven by a quantitative quality assessment based on the deviation between monitoring data and modelling results (Kühn and Altmannsberger, 2016). The multivariate regression model (Chapman, 1998; Kühn and Schöne, 2017) provides significantly better results than the univariate version (ARC, 1991; Kühn and Altmannsberger, 2016). Advantages of data-based models are their accuracy and robustness. In that way they are suitable to implement conservation programs. However, one disadvantage is that they are “black box” models and do not inform us about system-inherent processes. In case significant changes occur, like newly installed major production wells, as was the case at Waiwera, they have to be deduced anew. In contrast, three-dimensional fully coupled process simulations (Kühn and Stöfen, 2005; Bréthaut, 2009; Kempka and Kühn, 2023) are more flexible and the only tool to study processes within the geothermal system, e.g., analysis regarding the base flux of geothermal brine into the reservoir or chemical water-rock-interactions (Table 1). The quality of a three-dimensional model requires a substantial amount of spatially resolved information, which sometimes may not be available. However, there is still no mathematical model that can be used for an overall management, i.e. for forecasting that integrates all available observation data and quantifies the resulting temperature and salinity distributions for various utilisation scenarios based on the exact geometry and location of the boreholes.
The aim of the presented study is to summarise the scientific work over the past decades and the knowledge and progress in process understanding. The most recent view on the Waiwera system in New Zealand confirms that the geothermal water is of meteoric origin and that the rainwater percolates down and gets heated. With its increased temperature it rises from depth through fault zones into the shallow and leaky reservoir. Our new hypothesis is that the hydraulic system might as well be just topographically driven. So far thermal upwelling is assumed to be the major factor. This concept is derived from a wealth of studies and publications since the 1980s (ARWB, 1980, 1987; ARC, 1991, 1999; Zemansky, 2005; Kühn et al., 2016, 2024; Viskovic et al., 2025) and provides the basis for understanding the geothermal resource. New radiocarbon dating shows the geothermal water entering the reservoir to be >20 000 years old and underlines the topography driven recharge model. Decades of development of water management plans helped curbing overproduction. Main objective is an annual average water level above the mean sea level in the reservoir. Most recently, the springs have restarted discharging geothermal water on the beach after the major user abruptly stopped production, providing the almost unique context to understand how fast and how effectively degraded surface geothermal features can be recovered.
A couple of open questions remain. The extent of the fault beyond the Waiwera township is not well constrained. A more detailed geological model of the structure has to be implemented to account for the complex flow paths in the fractured reservoir and the faulted basement. Therefore, further field investigations are recommended. New combined pressure, temperature, and salinity logs are required and, if possible, tomographic and geophysical investigations of the reservoir as well as a new pumping test.
Codes are all available as cited within the text: SHAFT 79 (Alvarez, 1986), SHEMAT (Clauser, 2003), TOUGH (Pruess et al., 2012), and TRANSPORTSE (Kempka, 2024).
For access to the raw data contact the corresponding author.
MK led the research work and assembled and prepared the manuscript with contributions from all co-authors. GPDV and MP were responsible for field work and provided data in that way. TS, CR, LG, and TK did data analyses, model development and simulation work. MK wrote and finalised the manuscript. All co-authors contributed with reviews and editing.
The contact author has declared that none of the authors has any competing interests.
Publisher's note: Copernicus Publications remains neutral with regard to jurisdictional claims made in the text, published maps, institutional affiliations, or any other geographical representation in this paper. While Copernicus Publications makes every effort to include appropriate place names, the final responsibility lies with the authors. Views expressed in the text are those of the authors and do not necessarily reflect the views of the publisher.
This article is part of the special issue “European Geosciences Union General Assembly 2025, EGU Division Energy, Resources & Environment (ERE)”. It is a result of the EGU General Assembly 2025, Vienna, Austria & Online, 27 April–2 May 2025.
The research reported in this paper has been continuously supported by the Auckland Council over the past years. We appreciate the constructive comments from Giorgia Stasi, Jessica Maria Chicco and the anonymous reviewer.
The article processing charges for this open-access publication were covered by the GFZ Helmholtz Centre for Geosciences.
This paper was edited by Giorgia Stasi and reviewed by Jessica Maria Chicco and one anonymous referee.
Alldred, H. B.: Sedimentology and structure of the Waitemata Group Wenderholm & Orewa Section North Auckland, 1980 (unpublished).
Alvarez, J.: A reservoir model of the Waiwera warm water system, Report no. 86.02, Geothermal Institute, University of Auckland, 1986 (unpublished).
ARC: Waiwera geothermal groundwater resources statement and allocation plan, Technical Publication No. 112, Auckland Regional Council, 1991 (unpublished).
ARC: Draft Waiwera geothermal groundwater resource assessment report, Technical publication 115, Auckland Regional Council, Auckland, NZ, p. 65, 1999 (unpublished).
ARWB: Waiwera water resource survey – Preliminary water allocation/management plan, Technical Publication No. 17, Auckland Regional Water Board, 1980 (unpublished).
ARWB: Waiwera thermal groundwater allocation and management plan 1986, AWRB technical publication 39, Auckland Regional Water Board, Auckland, NZ, p. 85, 1987 (unpublished).
Ballance, P. F.: An Inter-Arc Flysch Basin in Northern New Zealand: Waitemata Group (Upper Oligocene to Lower Miocene), J. Geol., 82, 439–471, https://doi.org/10.1086/627993, 1974.
Barns, S. and Luketina, K.: Valuing uses of the Waikato regional geothermal resource, Technical report 2011/15, Waikato Regional Council, 2011 (unpublished).
Bréthaut, D.: Numerical modelling of the Waiwera geothermal systems. Postgraduate Certificate in Geothermal Energy Technology, Project report – GEOTHERM 689, University of Auckland, New Zealand, 2009 (unpublished).
Chapman, M. G.: Investigation of the Dynamics of the Waiwera Geothermal Groundwater System, New Zealand, MS thesis, University of Waikato, 1998 (unpublished).
Clauser, C: Numerical simulation of reactive flow in hot aquifers—SHEMAT and Processing SHEMAT, Springer, Berlin, Heidelberg, New York, 332 pp., https://doi.org/10.1007/978-3-642-55684-5, 2003.
Edbrooke, S. W.: Geology of the Auckland area [map], scale 1:250 000, Institute of Geological & Nuclear Sciences,Lower Hutt, NZ, 1 map + p. 74, ISSN: 0028-8306 (Print) 1175-8791 (Online), 2001.
Gonzalez, C. N.: Interpretation of downhole temperature survey at Waiwera thermal area. Geothermal Institute, Report no. 86.07, University of Auckland, 1986 (unpublished).
Hayward, B. W.: Foraminifera-based estimates of paleo-bathymetry using modern analogue technique, and the subsidence history of the early Miocene Waitemata Basin, New Zeal. J. Geol. Geophys., 47, 749–767, https://doi.org/10.1080/00288306.2004.9515087, 2004.
Hochstein, M. P.: Assessment and modelling of geothermal reservoir (small utilization schemes), Geothermics, 17, 15–49, 1988.
Hurter, S. and Schellschmidt, R.: Atlas of geothermal resources in Europe, Geothermics, 32, 779–787, 2003.
Kempka, T.: TRANSPORTSE - TRANSPORT Simulation Environment, GFZ Data Services, Potsdam, https://doi.org/10.5880/GFZ.3.4.2024.004, 2024.
Kempka, T. and Kühn, M.: Numerical simulation of spatial temperature and salinity distribution in the Waiwera geothermal reservoir, New Zealand, Grundwasser, 28, 243–254, https://doi.org/10.1007/s00767-023-00551-8, 2023.
Kühn, M., Altmannsberger, C., and Hens, C.: Waiweras Warmwasserreservoir – Welche Aussagekraft haben Modelle?, Grundwasser, 21, 107–117, https://doi.org/10.1007/s00767-016-0323-2, 2016.
Kühn, M. and Altmannsberger, C.: Assessment of data driven and process based water management Tools for the Geothermal Reservoir Waiwera (New Zealand), Energy Proced., 97, 403–410, https://doi.org/10.1016/j.egypro.2016.10.034, 2016.
Kühn, M. and Grabow, L.: Deconvolution well test analysis applied to a long-term data set of the Waiwera geothermal reservoir (New Zealand), Adv. Geosci., 56, 107–116, https://doi.org/10.5194/adgeo-56-107-2021, 2021.
Kühn, M. and Schöne, T.: Multivariate regression model from water level and production rate time series for the geothermal reservoir Waiwera (New Zealand), Energy Proced,, 125, 571–579, https://doi.org/10.1016/j.egypro.2017.08.196, 2017.
Kühn, M. and Schöne, T.: Investigation of the influence of earthquakes on the water level in the geothermal reservoir of Waiwera (New Zealand), Adv. Geosci., 45, 235–241, https://doi.org/10.5194/adgeo-45-235-2018, 2018.
Kühn, M. and Stöfen, H.: A reactive flow model of the geothermal reservoir Waiwera, New Zealand, Hydrogeol. J., 13, 606–626, https://doi.org/10.1007/s10040-004-0377-6, 2005.
Kühn, M., Präg, M., Becker, I., Hilgers, C., Grafe, A., and Kempka, T.: Geographic Information System (GIS) as a basis for thenext generation of hydrogeological models to managethe geothermal area Waiwera (New Zealand), Adv. Geosci., 58, 31–39, https://doi.org/10.5194/adgeo-58-31-2022, 2022.
Kühn, M., Stagpoole, V., Viskovic, G. P. D., and Kempka, T.: New data for a model update of the Waiwera geothermal reservoir in New Zealand, Adv. Geosci., 65, 1–7, https://doi.org/10.5194/adgeo-65-1-2024, 2024.
Land Information New Zealand (LINZ), New Zealand Topo50 series : AZ31. Scale: 1:50 000, Land Information New Zealand, 2024.
Präg, M.: Geothermal reservoir characterization of faulted and folded turbidite sequences, Waiwera, New Zealand, MS thesis, KIT – Karlsruhe Institute of Technology, Institute of Applied Geosciences, 2020 (unpublished).
Präg, M., Becker, I., Hilgers, C., Walter, T. R., and Kühn, M.: Thermal UAS survey of reactivated hot spring activity in Waiwera, New Zealand, Adv. Geosci., 54, 165–171, https://doi.org/10.5194/adgeo-54-165-2020, 2020.
Pruess, K., Oldenburg, C., and Moridis, G., TOUGH2 User’s Guide, Version 2.1, Report LBNL-43134, Lawrence Berkeley National Laboratory, Berkeley, California, https://tough.lbl.gov/assets/docs/TOUGH2_V2_Users_Guide.pdf (last access: 3 December 2025), 2012.
Raza, A., Brown, R. W., Ballance, P. F., Hill, K. C., and Kamp, P. J. J.: Thermal history of the early Miocene Waitemata Basin and adjacent Waipapa Group, North Island, New Zealand, New Zeal. J. Geol. Geophys., 42, 469–488, https://doi.org/10.1080/00288306.1999.9514856, 1999.
Reed, M. J., Mariner, R. H., Brook, C. A., and Sorey, M. L.: Selected data for low-temperature (less than 90 degrees C) geothermal systems in the United States; reference data for US Geological Survey Circular 892 (No. 83-250), US Geological Survey, https://pubs.usgs.gov/of/1983/0250/report.pdf (last access: 3 December 2025), 1983.
Reyes, A. G.: Low-temperature geothermal reserves in New Zealand, Geothermics, 56, 138–161, 2015.
Reyes, A. G., Christenson, B. W., and Faure, K.: Sources of solutes and heat in low-enthalpy mineral waters and their relation to tectonic setting, New Zealand, J. Volcanol. Geoth. Res., 192, 117–141, 2010.
Ricketts, B. D., Ballance, P. F., Hayward, B. W., and Mayer, W.: Basal Waitemata Group lithofacies: rapid subsidence in an early Miocene interarc basin, New Zealand, Sedimentology, 36, 559–580, https://doi.org/10.1111/j.1365-3091.1989.tb02086.x, 1989.
Rockel, I.: Taking the waters – Early spas in New Zealand, typeset by Wordset Enterprises Limited, Wellington and printed and bound by Wright and Carman, Upper Hut, Government Printing Office Publishing, p. 195, ISBN 10: 0477013694 / ISBN 13: 9780477013697, 1986.
Rose, J. L. and Zemansky, G.: Updated hydrogeological evaluation of the Waiwera geothermal aguifer, Consultancy Report 2013/67, GNS Science, Lower Hutt, NZ, Prepared for Waiwera Geothermal Resort Ltd, Waiwera Water NZ Ltd, 26 pp., 2013 (confidential report).
Schellart, W. P., Lister, G. S., and Toy, V. G.: A Late Cretaceous and Cenozoic reconstruction of the Southwest Pacific region: Tectonics controlled by subduction and slab rollback processes, Earth-Sci. Rev., 76, 191–233, https://doi.org/10.1016/j.earscirev.2006.01.002, 2006.
Schofield, J. C.: Geological Map of New Zealand – Helensville and Whangaparaoa, https://kura.aucklandlibraries.govt.nz/digital/collection/maps/id/3846/ (last access: 3 December 2025), 1989.
Somogyvári, M., Kühn, M., and Reich, S.: Reservoir-scale trans dimensional fracture network inversion, Adv. Geosci., 49, 207–214, https://doi.org/10.5194/adgeo-49-207-2019, 2019.
Sorey, M. L.: Geothermal development and changes in surficial features: Examples from the western United States, in: Proceedings of the world geothermal congress, 705–711, 2000 (unpublished).
Viskovic, G. P. D., Stagpoole, V. M., and Morgenstern, U.: Results of microgravity survey and ground water sampling, Waiwera, Auckland, GNS Science Report 2023/33, GNS Science, 2023 (unpublished).
Viskovic, G. P. D., Macdonald, N., and Kühn, M.: Thermal infrared surveying of reactivated geothermal springs using an unmanned aerial vehicle at Waiwera, Auckland, New Zeal. J. Geol. Geophysi., https://doi.org/10.1080/00288306.2025.2464026, 68, 507–517, 2025.
Zemansky, G.: Hydrogeological evaluation of the Waiwera geothermal aquifer, Client Report 2005/131, Institute of Geological & Nuclear Science Limited, Lower Hutt, NZ, prepared for Waiwera Infinity Limited, 56 pp., 2005 (confidential report).
- Abstract
- Introduction to the Waiwera site
- Reported works over time and development of the water management plan
- Geological setting of the Waiwera geothermal system
- Discussion of the current understanding of the hydrogeothermal system
- Conclusions and outlook
- Code availability
- Data availability
- Author contributions
- Competing interests
- Disclaimer
- Special issue statement
- Acknowledgements
- Financial support
- Review statement
- References