 | 27 Sep 2024
Quantification of scalings in dynamic environments using a combination of Quartz Crystal Microbalance and Raman Microscopy
Lilly Zacherl
In Bavaria, the exploration of geothermal energy from the carbonates in the Upper Jurassic reservoir is a promising and growing field, but the efficiency is seriously affected by scaling, i.e., the precipitation of CaCO3. Predictive maintenance tools aim to reduce service intervals and unexpected downtimes based on measurements and a prediction of the state of the installations. With regard to scaling, this requires forward modeling of carbonate precipitation. However, standard models overpredict the amount of precipitates, and data required for localized process parametrization under dynamic flow conditions is scarce. For hybrid multiphase models, this data has to include local hydrogeochemistry, shear forces, and interaction forces of the precipitates with the matrix. Our new experimental approach combines the quantitative measurement of the amount of precipitates using a highly sensitive quartz crystal microbalance (QCM) measurement with the qualitative analysis of the individual crystals with Raman microspectroscopy. The setup consists of a microfluidic flow channel in which NaOH solution and Munich tap water (carbonate-rich) were injected and allowed to mix under varying flow conditions. The increase in the pH value caused nucleation and precipitation, which was monitored in real-time. The experiments showed many newly formed carbonate particles, but only some of the particles were actually deposited on the QCM crystal. The remaining particles were not able to settle at the given flow velocities and flushed out of the microfluidic channel. The stability of the signal degraded in long-term experiments. Therefore, quantitative measurements are limited to shorter times (up to 1 day in our case) with semi-quantitative data beyond that time. For those short time frames, the combination of Raman microscopy and QCM allows to quantify the process of scaling formation under very controlled dynamic conditions.
- Article
(2263 KB) - Full-text XML
- BibTeX
- EndNote


The very promising geothermal energy sector in the North Alpine Foreland Basin (NAFB) has to deal with performance issues due to scaling, which is mostly the precipitation of CaCO3 (Köhl et al., 2020). The economic and technical penalties are caused by the disruption of hydrogeochemical equilibria in the production well. The precipitation of calcium carbonate can be described with the carbonic acid system (Appelo and Postma, 2005), which mainly depends on the partial pressure of CO2 in the system, the pH, the temperature, and the total pressure of the system. It has been shown that gas bubbles play a key role in the scaling process (Wanner et al., 2017; Zacherl and Baumann, 2023). In geothermal systems, the equilibrium is disrupted due to the pressure changes from the reservoir (gradually decreasing) at the pump inlet (sharp drop) and from the pump to the surface (gradually decreasing). If the pressure gets below the bubble point of the gas phases, even if only locally, the formation of gas bubbles causes stripping of CO2, which would be soluble otherwise. This causes an increase in the pH value and an oversaturation with regard to calcite, followed by precipitation. Köhl et al. (2020) investigated the parameters that affect scaling and provided correlation equations and field data for scaling rates, which are in the range of 1.50–4.10 µmol m−2 s−1. Even though derived from a huge data set from samples across the NAFB, the results are site-specific and provide no data to parametrize the process-based hydrogeochemical models. Ueckert et al. (2020) and Zacherl and Baumann (2023) have shown that microcrystals can reduce the oversaturation in geothermal systems and remain mobile in the geothermal fluid. This reduces the amount of precipitates on the surfaces of the installations. Based on their current mode of operation (run until failure), operators of existing geothermal plants would unfortunately not benefit from new data and a modeling framework for monitoring and predictive maintenance optimization. However, since the geothermal energy sector is still growing and there is an insatiable demand for renewable energy, future sites could benefit from a hydrogeochemical model, including the scaling process's thermodynamics and kinetics under dynamic circumstances.
Hydrogeochemical models for predictive maintenance should include the kinetics of the precipitation. Therefore, it is necessary to investigate which CaCO3 polymorph forms: calcite, aragonite, or vaterite. The polymorphs differ in their rate constants (Plummer et al., 1978; Plummer and Busenberg, 1982; Chou et al., 1989). Calcite is the most thermodynamically stable, and vaterite is the least stable. Apart from foreign ions like magnesium (Berner, 1975; Gutjahr et al., 1996) influencing the scaling process, shear forces also affect crystallization and the crystals' settlement on the surfaces.
To differentiate which polymorph forms, Raman microscopic analysis can be used as a non-invasive technique (Dandeu et al., 2006). However, a second analysis technique is necessary for a quantitative approach and investigation of shear forces. In previous studies, quartz crystal microbalance (QCM) was used to study the CaCO3 adhesion on the sensor surface immersed into a solution vessel: it was found that the rate of adhesion and the morphology of CaCO3 was controlled mainly by the supersaturation of the solution, and the rate and amount of scale was controlled by the stirring rate and by the inclination angle of the sensor surface to the solution flow (Abdel-Aal et al., 2002). QCM was also used for the investigation of electrochemical calcium carbonate scaling under ambient conditions (Gabrielli et al., 1998) and the quantification of the macroscopic calcite crystal growth rate under close-to-equilibrium conditions (Cao et al., 2018). Raman microscopy was added to the electrochemical QCM experiment (Gabrielli et al., 2003; Tlili et al., 2003). To simulate scalings in hot fluids and pipes, the QCM was heated to 30–55 °C: above 45 °C the deposition rate increased sharply (Gabrielli et al., 2005). However, their experiments suffered from the evolution of gas bubbles and lack of reproducibility. The measured scaling acquired by electrochemical QCM is not representative of industrial circuits since the scaling from carbonically pure solutions is forced by an electrochemical reaction on the sensor surface due to the reduction of the dissolved oxygen in water inducing a local pH increase (Chao et al., 2014). McPherson et al. (2022) showed the deposition of CaCO3 by optical microscopy (on glass) and QCM (on Au sensor) combined with in-situ IR measurements. While very close to our target, it does not combine simultaneous optical microscopy, morphological speciation, and mass adsorption during one experiment.
In our approach, we combined QCM with Raman microscopy to investigate the formation of carbonates under laminar flow conditions. The new microfluidic setup allows the quantification of the precipitation in real-time while providing full access to the shear forces in the system and the polymorphs formed. The QCM-sensor can be coated with different surfaces (gold, steel (SUS316L, SUS304), carbon, SiO2, aluminum) to parametrize the effect of adhesive forces.
2.1 Experimental set-up
A microfluidic channel was designed and milled in polyether ether ketone (PEEK, see Fig. 1a). The mixing cell had a diameter of 5 mm and a depth of 1.15 mm. The observation of the flow regime and the precipitation process directly on and above the sensor in the cell via Raman was possible through a cover glass (depth of cover glass: 0.13–0.16 mm). The QCM sensor was placed in the cell between two O-rings (inner diameter: 5 mm, thickness: 0.5 mm). Two tubes (inner diameter 0.8 mm each) were connected via pressure screws to the syringes and the flow cell inlets. The cell had one outlet, which was also connected to a tube (inner diameter: 1.3 mm) with a pressure screw. The flow rate was controlled with syringe pumps (LA-110, Landgraf Laborsysteme HLL GmbH, Langenhagen, Germany).
The flow inside of the microfluidic cell was recorded using fluorescent carboxylate-modified latex beads (Fluospheres™, yellow-green (505/515), diameter: 1 µm, dilution: 1:100 000; ThermoFisher Scientific, Massachusetts, USA) with a fluorescence microscope (BX60, Olympus, Tokyo, Japan; Olympus UPlanFl objective x10, NA = 0.3). Images were taken for focal planes with a depth resolution of 5–10 µm, a shutter speed of the camera of 100 ms, and at a volumetric flow rate of 5 and 10 mL h−1 respectively. At these flow rates, the particles leave streaks on the image, which were then evaluated using ImageJ to measure the flow velocity and to track the flow paths through trajectory analysis. Based on the experimentally determined flow velocity, the particle flow velocity and shear forces were simulated by CFD (Ansys, Pennsylvania, USA).
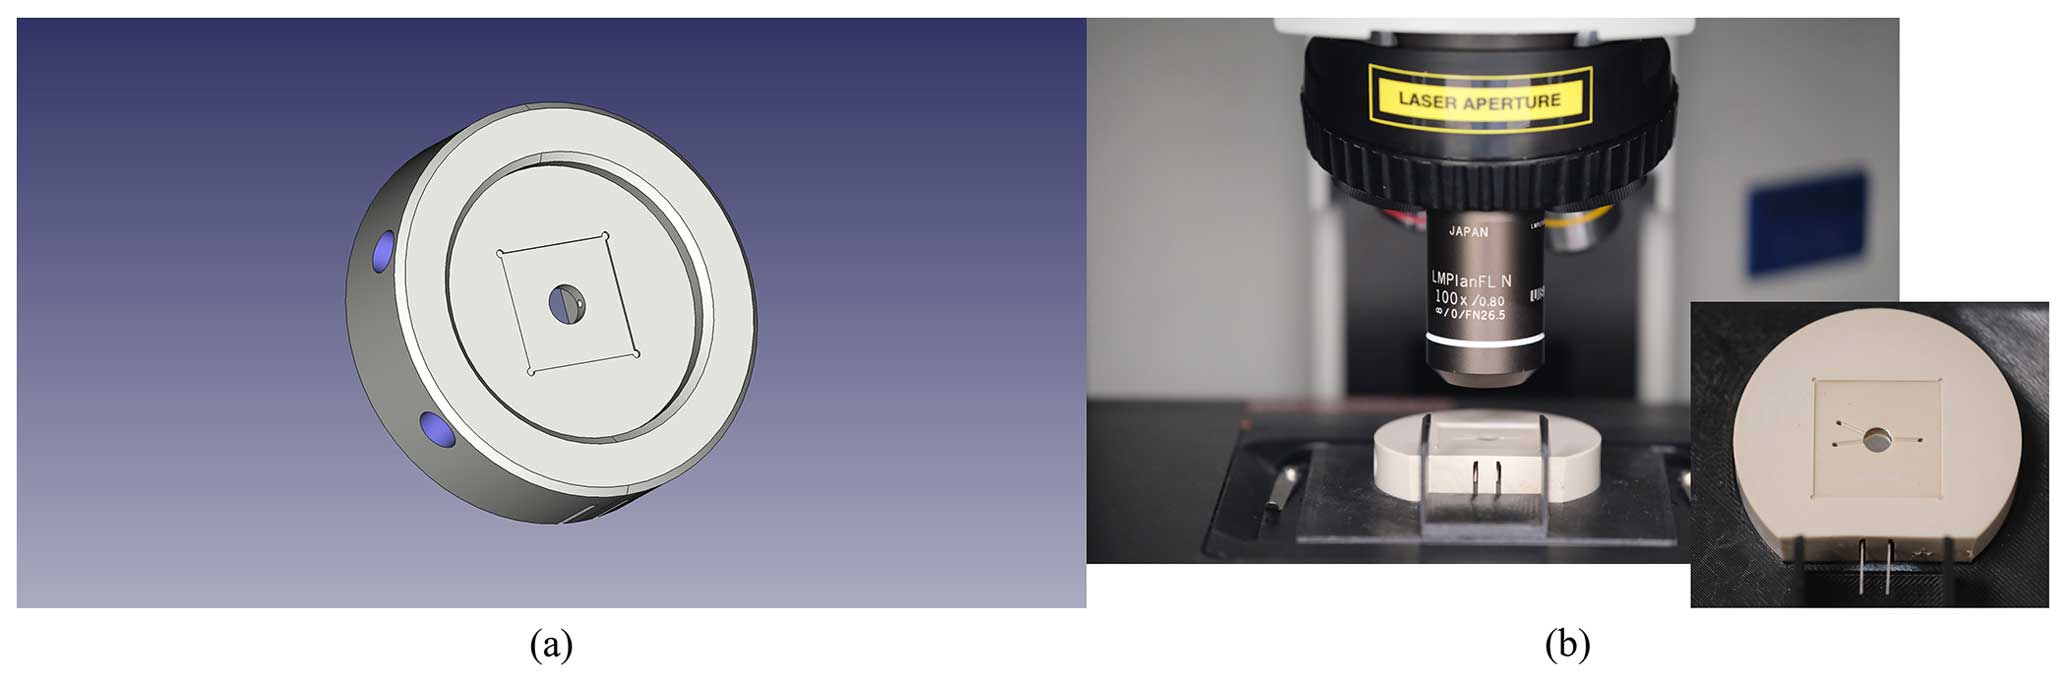
Figure 1Details on the experimental set-up of the QCM-Raman approach. (a) 3D-Drawing of QCM-Flow-Channel in which the sensor is placed from below (figure by Holger Schürle). (b) Experimental set-up of flow cell under Raman microscope.
All scaling experiments were run with Munich tap water, which was injected with a syringe pump through inlet A. The second syringe pump fed 0.1 N NaOH (CarlRoth, Karlsruhe, Germany) into inlet B to increase the pH in the mixing zone and to shift the lime-carbonic acid equilibrium. When the experiment was finished, the microfluidic channel was flushed with 0.1 N HCl (CarlRoth, Karlsruhe, Germany) and ultra-pure water (degassed for 15 min in an ultrasonic bath prior to use) to remove all precipitates. The volumetric flow rate was identical for both inlets and between 0.5–10 mL h−1.
The frequency of the quartz sensor placed in the flow cell was measured continuously by QCM (QCM 922A, Princeton Applied Research). The sensor coating was SiO2 and steel to mimic different materials of technical installations. Prior to the start of each experiment, the cell was flushed with deionized water, and the frequency was measured until the signal became steady. This frequency was used as the resonant frequency of the sensor. The mass precipitated on the sensor was calculated with the Sauerbrey equation based on the change of the measured frequency (Sauerbrey, 1959). Simultaneously to the QCM measurements, the crystal growth was investigated in real-time to observe the polymorphic form with Raman Spectroscopy (XploRA PLUS, HORIBA, Horiba France SAS; Olympus MPlan N objective x10, NA = 0.25, Olympus, Tokyo, Japan; Laser: 532 nm, filter: 25 %, accumulations: 7, acquisition time: 1 s; Mapping: 12 spots, measured every 30 min) and the shape and size optically (with the Olympus Microscope included in the Raman instrument; Fig. 1b shows a picture of the experimental set-up).
To check not only the reproducibility but also the quality of the QCM measurement, the energy dissipation and quality of the signal were measured during a scaling experiment with the software provided by Princeton Applied Research (QCM922A Admittance Data Acquisition).
3.1 Geometry of the model: Determination of hydrodynamic conditions
At a combined flow rate of 10 mL h−1 (5 mL h−1 at each inlet), the measured particle flow velocity was between 0.139 and 1.07 mm s−1 (see Fig. 2). The particle flow velocity was the lowest (0.139 and 0.143 mm s−1) close to the surfaces (bottom: QCM quartz, top: cover glass) and had a maximum at about the midpoint depth of 0.511 mm (1.07 mm s−1). The velocity data shows a parabolic flow profile between the QCM crystal and cover glass, which are no-slip boundaries. The values calculated with CFD fit very well to the measured data (overall deviation of 8.96 %).
At a combined flow rate of 20 mL h−1, the measured particle flow velocity was between 0.205 mm s−1 close to the surfaces and 2.18 mm s−1 at a height of 0.639 mm in the cell (see Fig. 2). The CFD calculation showed slightly lower values. While the CFD simulation shows a symmetric flow profile in z direction, the recorded streaks showed a slight shift of the maximum to deeper parts of the microfluidic channel. The overall deviation between measured and calculated velocities was 9.75 %.

Figure 2Particle flow velocity in the microfluidic channel at flow rates of (a) 5 mL h−1 each inlet, and (b) 10 mL h−1 each inlet. Comparison of measured (black) and modeled (blue) data.
In contrast to previous experiments in very thin microfluidic channels (Zhang et al., 2010), the design of our microfluidic channel results in a 3-dimensional mixing and 3-d trajectories. This provides indirect access to the particle sizes nucleated because only those particles could accumulate on the QCM crystal, which are large enough to settle in the time frame they are in the channel. This particle size, therefore, also depends on the flow rates in the channel. Figure 3a shows the particle flow velocities from entering the channel to leaving as a function of the depth plane of the flow cell at a flow rate of 2 mL h−1 (each syringe pump). The critical diameter of the calcium carbonate particles (calcite) was calculated using Stokes's law:
with vp the particle flow velocity (m s−1), r the radius of the particle (in m), g the gravity acceleration (9.81 m s−2), ρp the density of the particle (ρCalcite = 2710 kg m−3), ρf the density of the fluid (ρwater = 998 kg m−3, at 20 °C), and η the viscosity of the liquid (ηwater = 0.001 kg m, at 20 °C). To determine the required particle size, Eq. (1) is solved for the radius r.
Figure 3b shows the required particle size in dependence of the particle flow velocity measured: at a flow rate of 5 mL h−1 of each syringe pump, the critical particle size was 16.5 µm, and at a flow rate of 10 mL h−1 of each syringe pump it was 23.5 µm. These values are in the range of recently published data for calcite crystals in bubble columns (Zacherl and Baumann, 2023). Therefore, the maximum flow rate was limited to 2 mL h−1 to ensure that the newly formed crystals can reach the sensor.

Figure 3(a) Particle flow velocities in the microfluidic channel (flow rate 2 mL h−1 each syringe pump) in dependence of the depth and distance from the inlet. (b) Measured particle flow velocity at different flow rates (blue: 5 mL h−1, and red: 10 mL h−1 each syringe pump) and calculated required particle size for the particles to sink to the bottom (i.e., the QCM sensor) according to Stokes law.
3.2 Scaling experiments
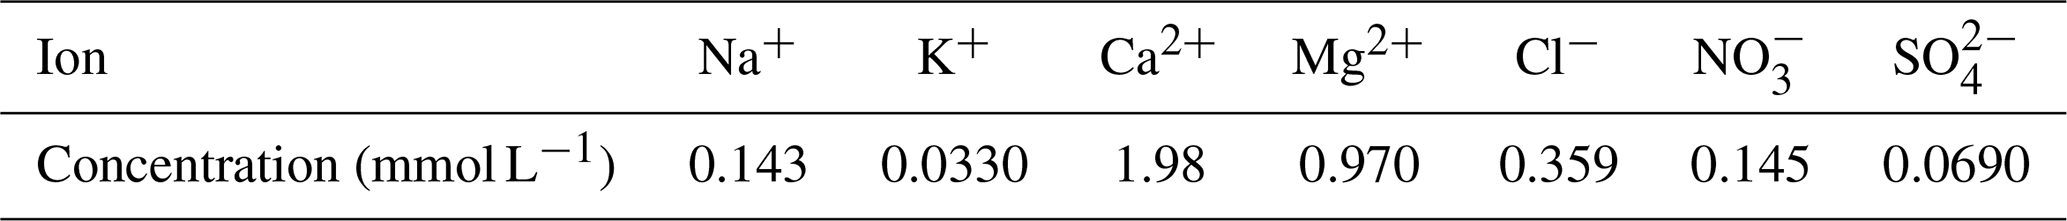
Munich tap water is carbonate-rich with a Ca2+ concentration of approx. 2 mmol L−1 (ion analysis of the tap water is given in Table B1). Figure 4a shows the evolution of the frequency of a factory new steel sensor over time: the frequency decreases and indicates precipitation of newly formed carbonate crystals. With a calculated sensitivity of the QCM, Δf=1 Hz corresponds to 1.07 ng or a surface cover of 5.68 ng cm−2. Figure 4b shows the mass change over time at a volumetric flow rate of 2 mL h−1 each syringe pump. During the first 10 h of injection, 0.114 µg precipitated on the sensor (606 ng cm−2, this corresponds to a rate of 1.68 × 10⁻¹³ mol cm−2 s−1). Despite the massive supersaturation with respect to calcite, this is only 0.003 % of the amount of CaCO3, which can theoretically precipitate. This points to the formation of particles smaller than 10 µm, and negligible aggregation on the sensor. After the pump stopped, the QCM signal remained constant. This indicates that no further particles were in the solution.
To test if more precipitation can be achieved by a stop-flow approach, the syringes were re-filled, and the pump was started again after 1080 min. The running time was between 20 and 80 min, and the stop time was between 10 and 70 min: after 80 min running time (i.e. 1160 min total running time of the experiment), the pumps were stopped for about 30 min, and then started again for 60 min, and stopped for 60 min. These intervals were repeated until the end of the experiment. After 1530 min (injection time 450 min), 1.09 µg precipitated on the sensor. This is about ten times higher compared to continuous flow. There are two possible explanations for this behavior: first, one could assume that formed particles are settling in the channel during the stopped flow, but this is contradicted by the constant mass during the longer stop periods. The formation and presence of seed crystals, on the other hand, would also show an elevated precipitation rate. This assumption is further supported by an increasing mass change in subsequent steps. After minute 1530, the pumps were run continuously with a flow rate of 2 mL h−1, and the precipitated mass on the sensor increased to 3.73 µg after 1790 min and finally remained stable at 3.88 µg after 1810 min.
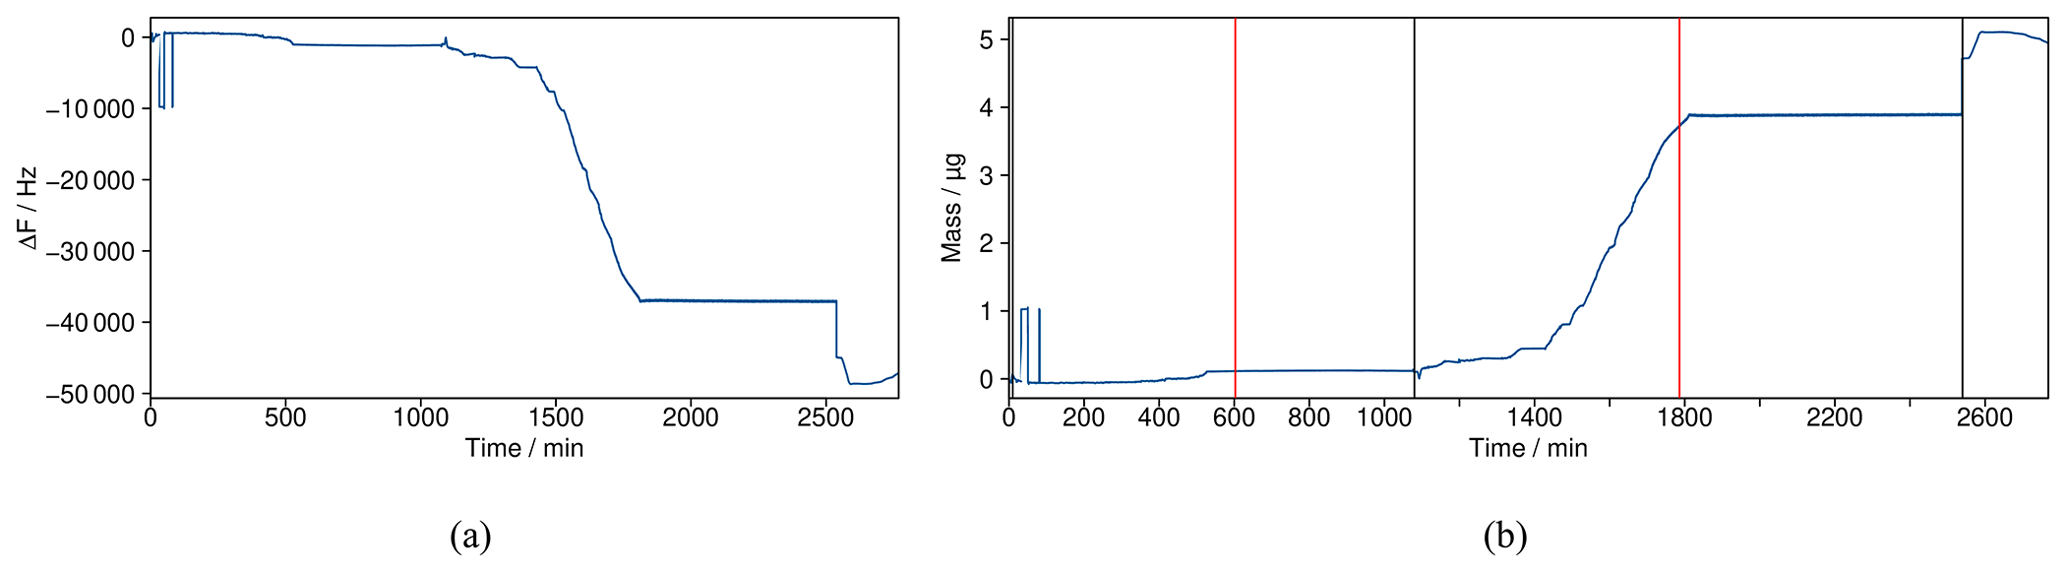
Figure 4Development of QCM measurement signal during the scaling experiment. (a) Frequency change of the QCM steel sensor due to the precipitation of CaCO3. (b) Calculated mass of CaCO3 precipitated on a QCM steel sensor over time. Black lines mark the initial start of the syringe pumps (flow rates: 2 mL h−1 each), and red lines represent the long-term stop of the syringe pump.
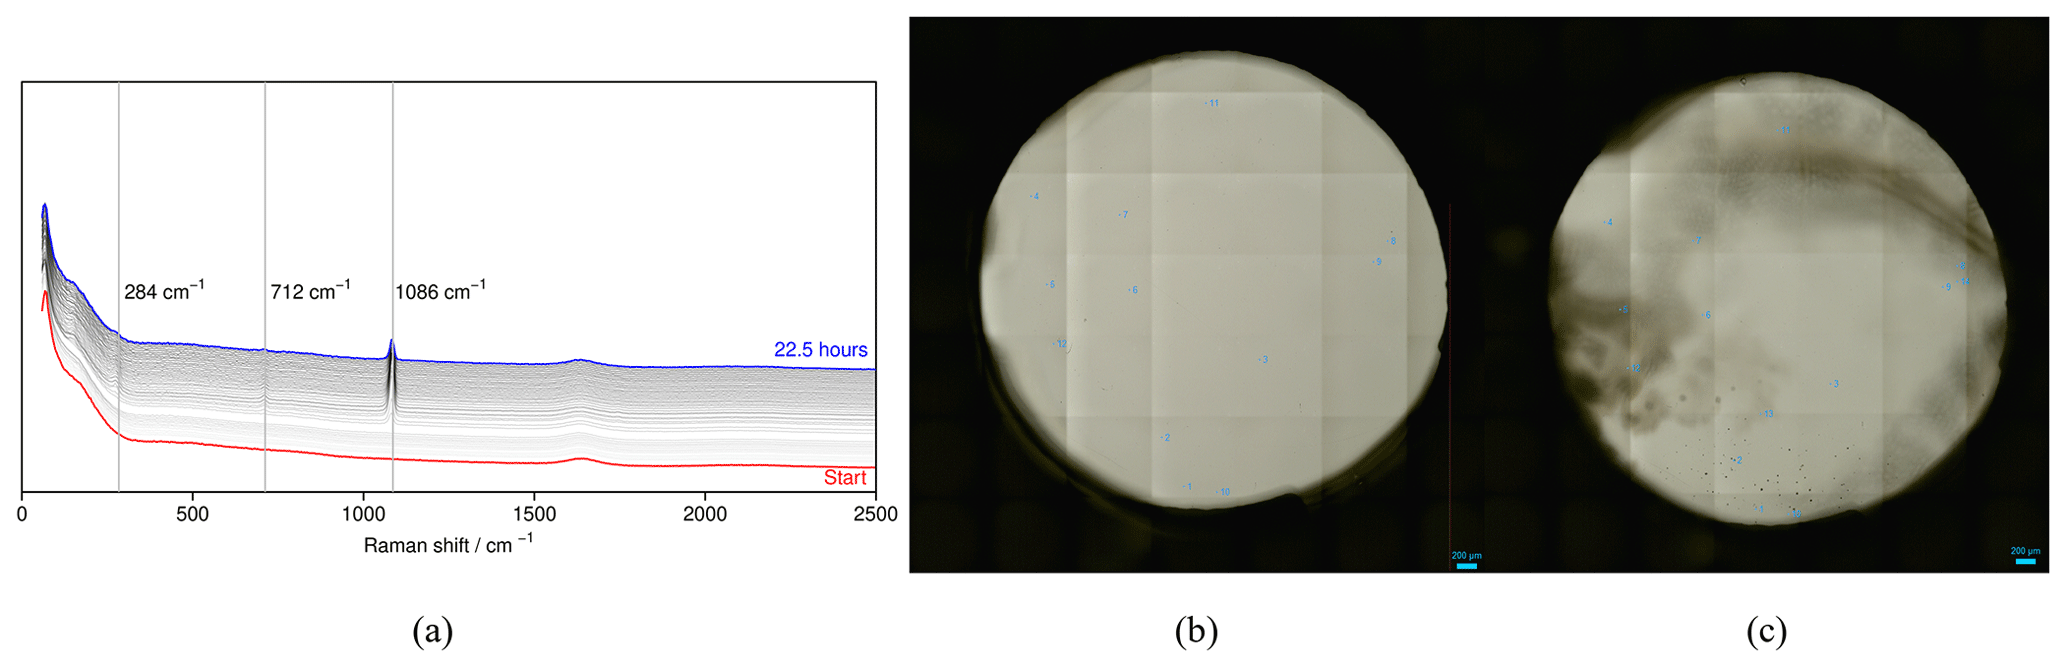
Figure 5(a) Raman spectra over time, after 22.5 h, the peaks match the ones of calcite. (b) Microscopic image of the QCM sensor at the start of the experiment. (c) Microscopic image of the QCM sensor after 22.5 h running time of the experiment.
To check the effect of low ionic strength and possible remobilization of the particles which have already precipitated in the flow cell and the sensor, both syringes were filled with deionized water (pre-treated with ultrasonic for degassing): directly after the start at 2540 min, a high frequency shift occurred, which would correspond to a mass change of 0.90 µg during seconds, which is unlikely. This is rather caused by the change of pressure in the very sensitive system due to the re-start of pumps. Then the mass increased continuously until minute 2590 to 5.99 µg. This increase makes sense because the tubes were not flushed and were still filled with the tap water and NaOH solution. The mass then slowly decreased, indicating a dissolution/mechanical shear on the precipitated crystals: after 2770 min, the mass was at 4.94 µg. But, because of the rapid frequency change at minute 2540, these values are only reliable if they were reproducible. The experiment was stopped for reproducibility tests, and the system was flushed with acid (HCl) and ultra-pure water.
To check the reproducibility of the experimental procedure, the experiment was repeated. Here, the mass change was 3.93 µg after 645 min (see Fig. A1). After the pump stopped, the signal became steady at 3.70 µg. This corresponds to 0.46 % of the possible scaling and indicates that still a large fraction of the oversaturation is compensated by very small crystals. However, this amount of scaling is in accordance with the scale-related decrease of the calcium ion concentration observed by Köhl et al. (2020) in the production pipe of a geothermal plant, which was between 0.5 % and 4 %.
Raman measurements were conducted every 30 min until minute 1400. Each Raman measurement causes a tiny spike in the sensor signal due to the energy added to the system. The Raman spectra showed peaks of the calcite-specific Raman shifts (see Fig. 5a). Microscopic images of the QCM sensor also showed precipitated particles (Fig. 5c) in comparison to the sensor at the start of the experiment (Fig. 5b). Figure 5c shows precipitates above the sensor inside the cell and on the cover glass appearing as cloudy shadows in the optical image. The formed precipitates in the cell enhance the precipitation directly on the sensor because more seed crystals are present.
The experiment was continued with the already partially coated sensor, and the syringes were filled with tap water and NaOH solution, respectively. We saw a decrease of the mass on the sensor to 3.04 µg, which can be attributed to sudden pressure changes in the system while connecting the syringes. The pumps were restarted at 3122 min. A fast and steady increase of the mass occurred during 336 min to 18.6 µg (corresponds to 1.95 % of the theoretical scaling amount). However, immediately afterward, the mass plummets to negative values during an hour. At this time, the Raman measurements still showed calcite crystals on the sensor. After 3720 min, the pumps were stopped, and the mass remained steady at −0.331 µg. However, the crystals did not disappear, according to the Raman measurements and microscopic images. After 4480 min, the pumps were re-started with a flow rate of 2 mL h−1, and the syringes filled with hydrochloric acid. The frequency showed some erratic behavior and eventually remained steady at −0.560 µg. After 4710 min, the pumps were stopped. The sudden drop of the QCM signal might be due to precipitates that form at the O-ring, which connects the QCM crystal to the microfluidic channel and changes the vibrational properties of the QCM crystal. Another explanation is the formation and disruption of a denser fluid layer on the QCM crystal. As both effects are very specific to the experiment, we would not expect that these disruptions are reproducible. Numerous repetitions of the experiment and variations of the experimental set-up (different coated sensor, lower flow rates) showed similar results but never the exact same behavior.
The sensor's resonance frequency, the resonance resistance, and the quality factor over time are shown in the Fig. A2 in the Appendix. After 210 min, the resistance increased by 235 Ω, and the frequency decreased by 7650 Hz (i.e., a mass change of 8.17 µg). The quality factor decreased from 846 to 751. Here, a lower quality factor translates into a less reliable signal. For another 100 min, the frequency continuously decreased by 19200 Hz, but the resistance also increased by 3130 Ω, and the quality factor decreased to 114, i.e. a decline of 86.4 %. Such a huge decline leads to a big uncertainty of the results. Additionally, the signal became very noisy after it, representing the reduced quality. There was no correlation between quality factor, resonance resistance, and frequency that could be used to correct the experimental data. This limits the experimental setup presented to short to medium-term kinetic studies.
Published data is generally on a shorter time frame, e.g., Cao et al. (2018) investigated the calcite seed crystal generation and growth in solutions over a duration of about 853 min and a flow rate of 7.5 mL h−1 (CaCl2, NaHCO3) with stable signals of QCM-D measurements. Here, mixing took place immediately before injection into the QCM-D chamber, and the sensors were coated with OH-terminated self-assembled monolayers. No additional spectroscopic measurement was performed simultaneously in real-time. The time frame of Gabrielli et al. (2003) experiments was 840 min, and they covered the sensor with 2 mm of solution. As stated above, electrochemical scaling is not representative of industrial circuits.
The combination of QCM to record mass changes with Raman microscopy to identify the precipitates and optical microscopy allows to elucidate the processes of scaling formation under very controlled conditions. While the flow velocities seem low compared to the average flow velocities in geothermal systems (few m s−1), they are in the range of the flow velocities in reservoirs and aquifers. A direct simulation of the conditions in boreholes and pipes, however, was never intended because turbulent flow conditions are hard to achieve in microfluidic channels. The extended time frame of our experiments shows that long-term investigations are not possible with the current setup due to a deterioration of the signal. Since published data is on a shorter time frame, we cannot compare the behavior of our setup with published data to elucidate whether this is a systematic error of the QCM. On a practical note, the results also show that the mobile crystal nuclei have to be considered a significant factor in models to predict the amount of scalings on surfaces. While the experiments showed conclusive results for shorter time frames, long-term stability has to be improved.
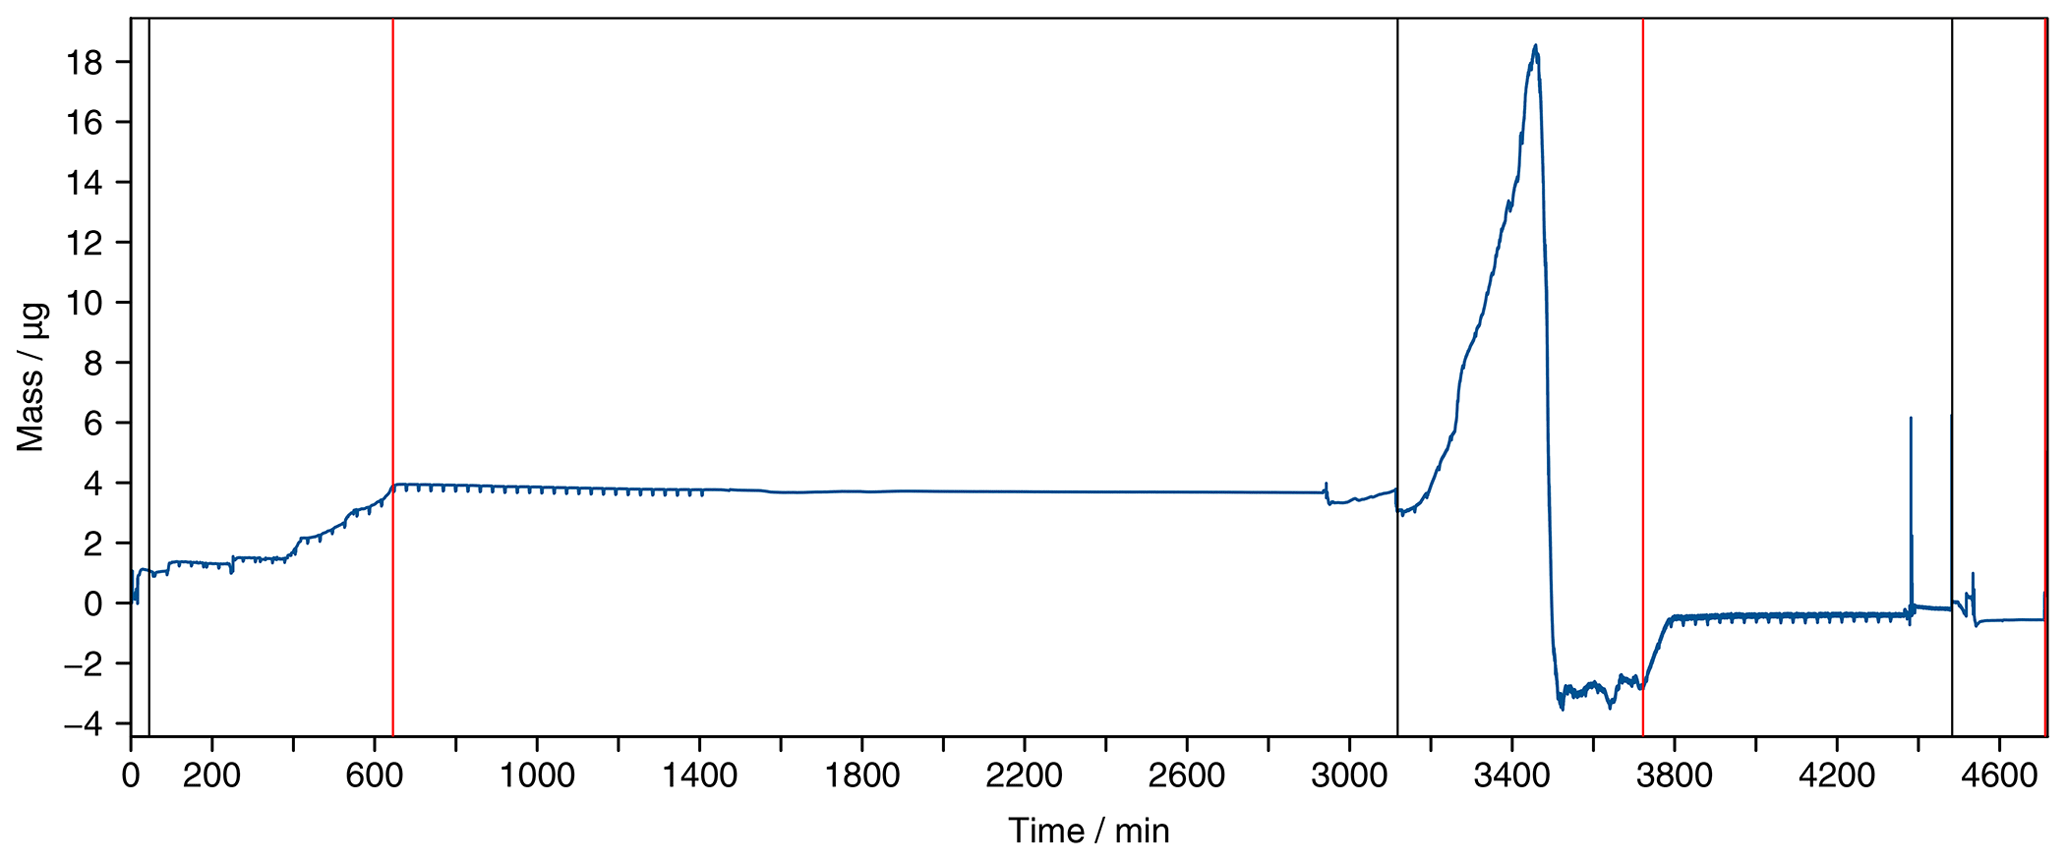
Figure A1Mass of CaCO3 precipitated on a QCM steel sensor over time. Black lines mark the initial start of the syringe pump (flow rate: 2 mL h−1 for each syringe pump), and red lines represent the long-term stop of the syringe pump.

Figure A2Evolution of frequency, resonance resistance, and quality factor during the scaling experiment.
Table B1Relevant ion concentrations of Munich tap water, measured by IC.
Data is available from the corresponding author on request.
TB had the idea and designed the first version of the micromodel. LZ performed all the laboratory experiments. Based on the experiments, TB and LZ discussed the re-design and optimization of the microfluidic channel. LZ evaluated the obtained data and discussed it with TB. LZ wrote the first draft of the manuscript. Both authors read and contributed to the final version of the manuscript.
The contact author has declared that none of the authors has any competing interests.
Publisher’s note: Copernicus Publications remains neutral with regard to jurisdictional claims made in the text, published maps, institutional affiliations, or any other geographical representation in this paper. While Copernicus Publications makes every effort to include appropriate place names, the final responsibility lies with the authors.
This article is part of the special issue “European Geosciences Union General Assembly 2024, EGU Division Energy, Resources & Environment (ERE)”. It is a result of the EGU General Assembly 2024, Vienna, Austria, 14–19 April 2024.
We dearly thank Holger Schürle for his support and the time and effort he has invested in optimizing the micromodel. Also, sincere thanks to Seoung-En Kim for the CFD calculations.
Financial support by the Bavarian State Ministry of Science and Art in the framework of Geothermal-Alliance Bavaria is gratefully acknowledged.
This paper was edited by Sonja Martens and reviewed by two anonymous referees.
Abdel-Aal, N., Satoh, K., and Sawada, K.: Study of the adhesion mechanism of CaCO3 using a combined bulk chemistry/QCM technique, J. Crystal Growth, 245, 87–100, https://doi.org/10.1016/S0022-0248(02)01657-3, 2002. a
Appelo, C. and Postma, D.: Geochemistry, Groundwater and Pollution, A.A. Balkema Publishers, Amsterdam, 2 Edn., https://doi.org/10.1201/9781439833544, 2005. a
Berner, R. A.: The role of magnesium in the crystal growth of calcite and aragonite from sea water, Geochim. Cosmochim. Ac., 39, 489–504, https://doi.org/10.1016/0016-7037(75)90102-7, 1975. a
Cao, B., Stack, A. G., Steefel, C. I., DePaolo, D. J., Lammers, L. N., and Hu, Y.: Investigating calcite growth rates using a quartz crystal microbalance with dissipation (QCM-D), Geochim. Cosmochim. Ac., 222, 269–283, https://doi.org/10.1016/j.gca.2017.10.020, 2018. a, b
Chao, Y., Horner, O., Hui, F., Lédion, J., and Perrot, H.: Direct detection of calcium carbonate scaling via a pre-calcified sensitive area of a quartz crystal microbalance, Desalination, 352, 103–108, https://doi.org/10.1016/j.desal.2014.08.004, 2014. a
Chou, L., Garrels, R. M., and Wollast, R.: Comparative study of the kinetics and mechanisms of dissolution of carbonate minerals, Chem. Geol., 78, 269–282, https://doi.org/10.1016/0009-2541(89)90063-6, 1989. a
Dandeu, A., Humbert, B., Carteret, C., Muhr, H., Plasari, E., and Bossoutrot, J. M.: Raman Spectroscopy – A Powerful Tool for the Quantitative Determination of the Composition of Polymorph Mixtures: Application to CaCO3 Polymorph Mixtures, Chem. Eng. Technol., 29, 221–225, https://doi.org/10.1002/ceat.200500354, 2006. a
Gabrielli, C., Keddam, M., Khalil, A., Maurin, G., Perrot, H., Rosset, R., and Zidoune, M.: Quartz Crystal Microbalance Investigation of Electrochemical Calcium Carbonate Scaling, J. Electrochem. Soc., 145, 2386–2396, https://doi.org/10.1149/1.1838648, 1998. a
Gabrielli, C., Jaouhari, R., Joiret, S., Maurin, G., and Rousseau, P.: Study of the Electrochemical Deposition of CaCO3 by In Situ Raman Spectroscopy, J. Electrochem. Soc., 150, C478, https://doi.org/10.1149/1.1579482, 2003. a, b
Gabrielli, C., Perrot, H., Rousseau, P., Belghazi, A., Chevrot, T., Colin, J. M., and Simonet, C.: Heated quartz microbalance to study thermally deposited calcareous scale, Rev. Sci. Instrum., 76, 124102, https://doi.org/10.1063/1.2126573, 2005. a
Gutjahr, A., Dabringhaus, H., and Lacmann, R.: Studies of the growth and dissolution kinetics of the CaCO3 polymorphs calcite and aragonite II. The influence of divalent cation additives on the growth and dissolution rates, J. Crystal Growth, 158, 310–315, https://doi.org/10.1016/0022-0248(95)00447-5, 1996. a
Köhl, B., Elsner, M., and Baumann, T.: Hydrochemical and operational parameters driving carbonate scale kinetics at geothermal facilities in the Bavarian Molasse Basin, Geotherm. Energy, 8, 26, https://doi.org/10.1186/s40517-020-00180-x, 2020. a, b, c
McPherson, I. J., Peruffo, M., and Unwin, P. R.: Role of Mass Transport in the Deposition, Growth, and Transformation of Calcium Carbonate on Surfaces at High Supersaturation, Cryst. Growth Des., 22, 4721–4729, https://doi.org/10.1021/acs.cgd.1c01505, 2022. a
Plummer, L. and Busenberg, E.: The solubilities of calcite, aragonite and vaterite in CO2-H2O solutions between 0 and 90 °C, and an evaluation of the aqueous model for the system , Geochim. Cosmochim. Ac., 46, 1011–1040, https://doi.org/10.1016/0016-7037(82)90056-4, 1982. a
Plummer, L. N., Wigley, T. M. L., and Parkhurst, D. L.: The kinetics of calcite dissolution in CO2-water systems at 5 °C to 60 °C and 0.0 to 1.0 Atm CO2, Am. J. Science, 278, 179–216, 1978. a
Sauerbrey, G.: Verwendung von Schwingquarzen zur Wägung dünner Schichten und zur Mikrowägung, Z. Phys., 155, 206–222, https://doi.org/10.1007/BF01337937, 1959. a
Tlili, M. M., Amor, M. B., Gabrielli, C., Joiret, S., Maurin, G., and Rousseau, P.: Study of Electrochemical Deposition of CaCO3 by In Situ Raman Spectroscopy, J. Electro. Soc., 150, C485, https://doi.org/10.1149/1.1579483, 2003. a
Ueckert, M., Wismeth, C., and Baumann, T.: Crystallization of Calcium Carbonate in a Large Scale Push-pull Heat Storage Test in a Jurassic Carbonate Aquifer, Geotherm. Energy, 8, 7, https://doi.org/10.1186/s40517-020-0160-5, 2020. a
Wanner, C., Eichinger, F., Jahrfeld, T., and Diamond, L. W.: Causes of abundant calcite scaling in geothermal wells in the Bavarian Molasse Basin, Southern Germany, Geothermics, 70, 324–338, https://doi.org/10.1016/j.geothermics.2017.05.001, 2017. a
Zacherl, L. and Baumann, T.: Quantification of the effect of gas–water–equilibria on carbonate precipitation, Geothermal Energy, 11, 11, https://doi.org/10.1186/s40517-023-00256-4, 2023. a, b, c
Zhang, C., Dehoff, K., Hess, N., Oostrom, M., Wietsma, T. W., Valocchi, A. J., Fouke, B. W., and Werth, C. J.: Pore-Scale Study of Transverse Mixing Induced CaCO3 Precipitation and Permeability Reduction in a Model Subsurface Sedimentary System, Environ. Sci. Technol., 44, 7833–7838, https://doi.org/10.1021/es1019788, 2010. a
- Abstract
- Introduction
- Material and Methods
- Results and Discussion
- Conclusions
- Appendix A: Experimental Results
- Appendix B: Analysis of Munich tap water
- Data availability
- Author contributions
- Competing interests
- Disclaimer
- Special issue statement
- Acknowledgements
- Financial support
- Review statement
- References