 | 29 Jan 2025
Impact of climate change on high wind and solar optimal mixes and system costs: the case of France
Joan Delort Ylla
Alexis Tantet
Philippe Drobinski
The electricity generation sector is undergoing profound transformations via the introduction of wind and solar energies. It is impacted by changing climate conditions, both on the demand and the supply side. The impact of a change in wind and solar resource coupled to the change in demand has however not been studied in regard of its effect on optimal investment decisions. We tackle this issue through the use of regional climate projections coupled to a minimalistic electricity system modeling tool. We find that for the case of France, increasing levels of climate change tend to decrease the optimal penetration of wind energy, while the optimal level of installed solar energy remains constant. We propose that this is explained by the interplay of an average effect coupled to a demand to generation correlation. To the contrary of previous literature, we find that the sole impact of climate change has no adverse consequences on system total costs, with adaptation measures being less attractive economically than their passive counterparts. This highlights the importance of specifying the working hypotheses and phenomena taken into account when issuing policymaking advice, and calls for further research exploring how combining all processes related to climate change impact all relevant elements of the electricity generation sector. We also encourage continued research at the climate and energy interface, to increase the precision and interpretability of similar studies.
- Article
(1050 KB) - Full-text XML
- BibTeX
- EndNote


The ambitious climate change mitigation goals set out under the Paris agreement1 call for a rapid decarbonization of the world's economy and supporting infrastructures. In particular, electricity generation, which in 2021 accounted for 20 % of total greenhouse gas emissions of Annex I parties2 is a key sector to decarbonize, potentially allowing the decarbonization of other sectors of the economy through electrification. Such decarbonization is expected to occur via the introduction of wind and solar photovoltaic generators – regrouped under the generic term of variable renewable energies (VREs). The share of VREs has been increasing in almost all european countries since the 2010s (see e.g. https://www.irena.org/Data, last access: 1 July 2024) and is expected to surge in the coming decades. The introduction of high shares of VREs will pose adaptation challenges from a techno-economic perspective (Sijm, 2014; Heptonstall and Gross, 2021) thus raising the question of planning and policymaking to incentivize for the most suitable generation mix under the decarbonization constraint.
If the electricity generation sector impacts the current climate state through greenhouse gas emissions, it is impacted by the climatic conditions as well (Craig et al., 2018; Yalew et al., 2020). This weather sensitivity makes it crucial to understand how changing climatic conditions will impact the current and future electricity generation sector. An increased understanding of these impacts will in turn help investigate the overarching question of optimal system operation and planning.
Many studies focus on a particular aspect of the impact of climate change on the electricity generation sector. However, if the study of the impacts of climate change at the component level is necessary, it is not sufficient and can lead to erroneous conclusions (Craig et al., 2018; Yalew et al., 2020; Khan et al., 2021). Systemic assessments are in this regard necessary.
Historically, energy system models were not designed to deal with the issue of high resolution climate data incorporation (Ciscar and Dowling, 2014). On the other hand, studies fulfilling the requirements of climate data incorporation are often limited in their handling of the energy system modeling step (Craig et al., 2019; Kozarcanin et al., 2019; Turner et al., 2019; Bloomfield et al., 2021). Finally, all reviewed studies up to date are not exhaustive in the number of processes considered. While some studies do not account for the changes in water availability (Jaglom et al., 2014; McFarland et al., 2015), others miss the effect of climate change on the VRE resource (Jaglom et al., 2014; McFarland et al., 2015; Mima and Criqui, 2015; Miara et al., 2019; Khan et al., 2021; Ralston Fonseca et al., 2021a), or neglect the impact of climate change on the electricity demand (Schlott et al., 2018; Peter, 2019). Among these limitations, we note that the compound impact of VRE resource and electricity demand changes due to climate change has up to date not been studied in regard of its effect on optimal investment decisions.
We focus in this study on how the compound impact of climate change on the future VRE resource and electricity demand influences the optimal investment decisions in its capacity as well as the resulting system costs. As climate change impacts and demand characteristics are region-specific, we tackle this question for the particular case of France. However this does not prevent our results and conclusions to be applicable to world regions with similar characteristics or our methodology to be applied in any other world region.
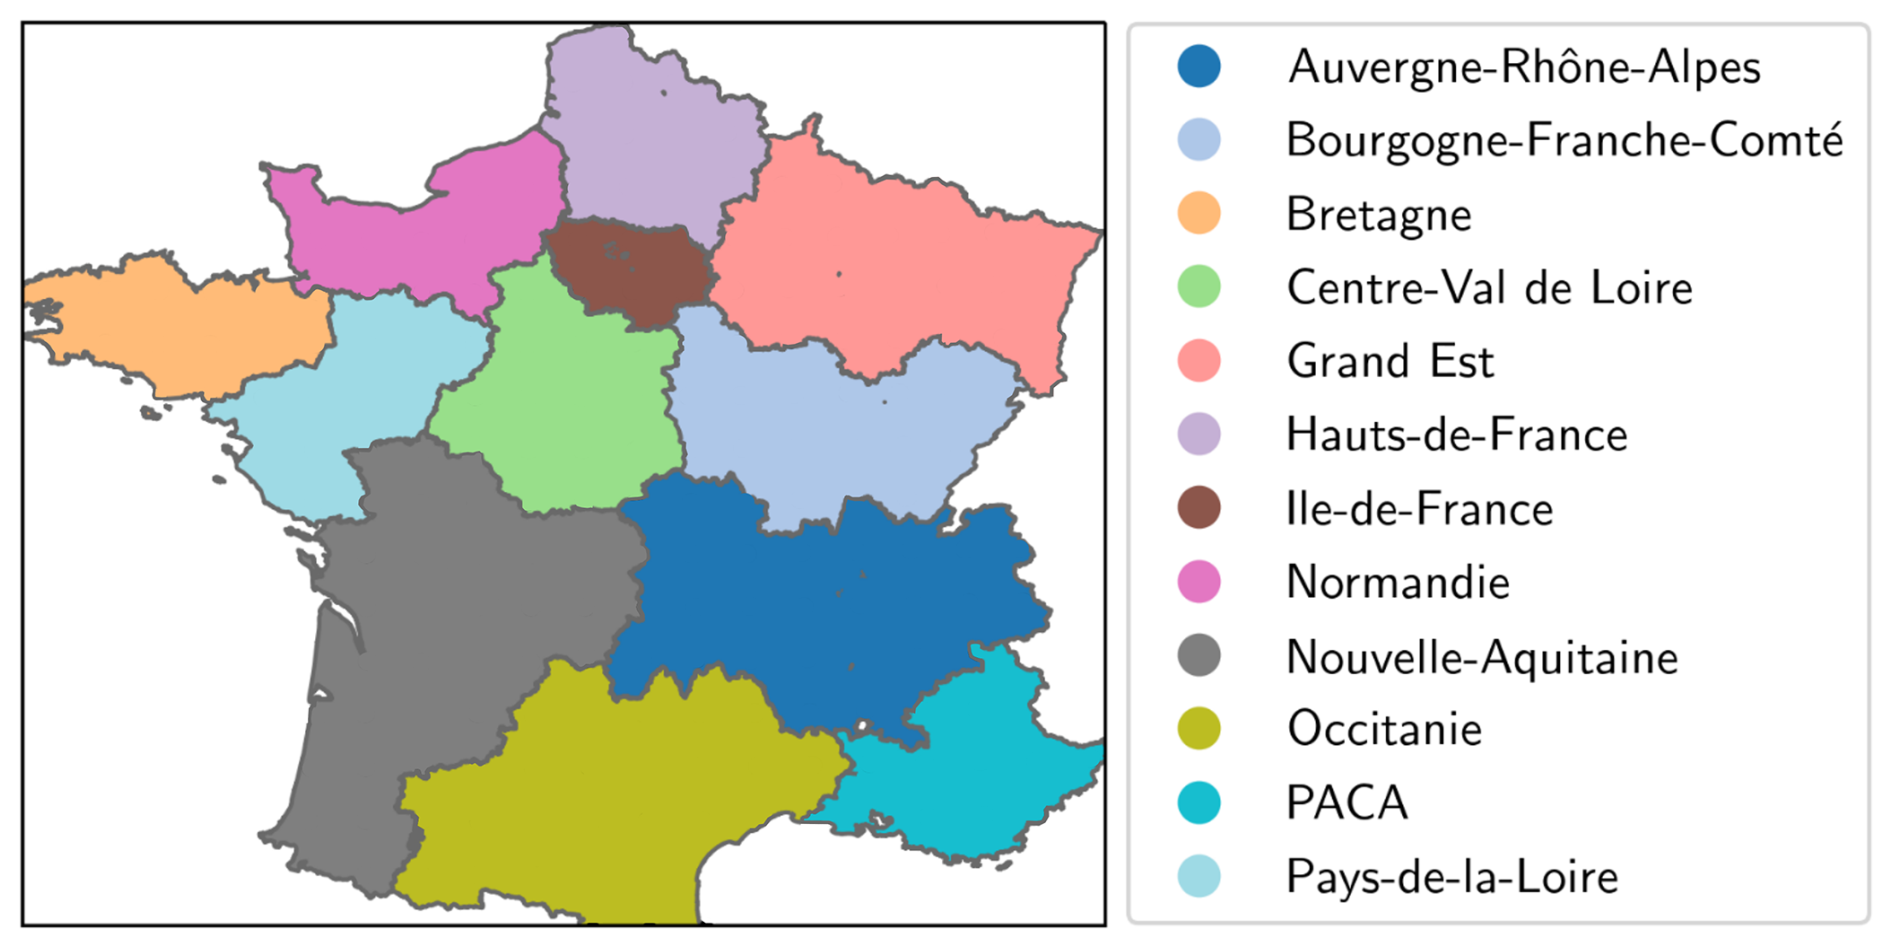
Figure 1Area of study: detail of french administrative regions, adapted from Tantet and Drobinski (2021).
2.1 Climate data
We use six different global/regional climate models pairs from the EURO-CORDEX initiative (Jacob et al., 2014; Coppola et al., 2021) for the 1975–2005 (historical) and 2020–2099 (future) periods as reported in Table 1.
Table 1EURO-CORDEX GCM/RCM model pairs considered in the study.
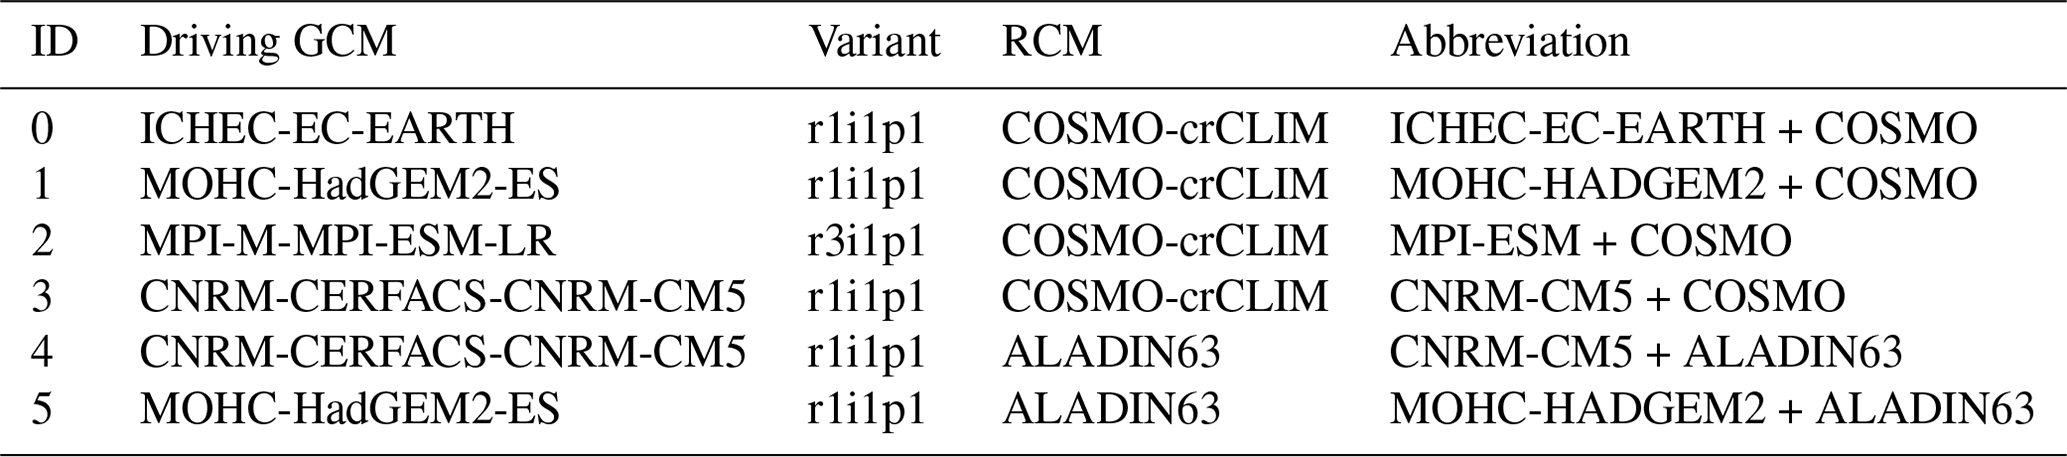
GCM: Global Climate Model. RCM: Regional Climate Model.
We use the output runs forced with the widely used CMIP-5 RCP 8.5 as a climate change scenario (Moss et al., 2010) for the future period. The models were chosen for practical reasons (availability of variables at the right time resolution) and are not the result of a more elaborate selection. The choice of climate models has been shown to impact study results (Gutiérrez et al., 2020; Wohland, 2022), but this will be explored in future works.
We use the near-surface air temperature (tas) and surface downward shortwave radiation (rsds) variables at 3 h time resolution, and zonal (ua100m) and meridional (va100m) wind components variables at 1 h time resolution3. Spatial resolution is approximately 12 km×12 km over the whole area of study.
To reduce model biases, each model pair output is calibrated to ERA5 reanalysis data (Hersbach et al., 2020) over the 1980–2005 period. Calibration is conducted by using the CDF-t algorithm (Michelangeli et al., 2009; Lavaysse et al., 2012; Vrac et al., 2012). As the ERA5 and EURO-CORDEX grids do not overlap, we interpolate ERA5 data on the EURO-CORDEX grid using bilinear interpolation and then calibrate the EURO-CORDEX data at every grid point. This step considerably reduces model biases (not shown here).
2.2 Wind and solar generation
Wind and solar generation are computed from climate time series. As generation depends on the installed capacity, which is a decision variable in our optimization problem, we focus instead on deriving time series of VRE generation per unit capacity, or capacity factors, which give the availability of the wind and solar resource for each hour of the time series. These hourly capacity factors time series – computed at each grid point – are averaged per region (see Fig. 1) and then bias corrected with respect to observations of regional capacity factors following the methodology detailed in Tantet et al. (2019) and regional capacity factors data from the french transmission system operator RTE (Réseau de Transport de l'Électricité). The computation of the wind and solar capacity factors is the same as in Tantet et al. (2019) except for the added dependence of the wind power on the temperature at hub height, following Dupré (2020).
Our methodology allows us to obtain hourly time series of wind and solar capacity factors for the historical (1975–2005) and future (2020–2099) periods. Wind capacity factors are impacted by climate change through any change in the wind regimes and through changes in air temperature (capacity factors decrease when temperature increases). Solar capacity factors are impacted by any change in surface radiation patterns as well as changes in air temperature (capacity factors decrease when temperature increases).
2.3 Demand model
Key to our study is the derivation of climate-sensitive plausible electricity demand time series for the historical and future periods. We use to this end an extended version of the demand model described in Tantet et al. (2019). The model is a probabilistic piecewise linear regression model of demand as a function of temperature and is thus directly linked to the surface temperature weather variable and so to the associated climate. We use electricity demand data from RTE for the years 2014–2019 and surface temperature time series from ERA5 reanalysis data (Hersbach et al., 2020) to train the model. We then validate the model against data for the year 2013. This gives us a model of the hourly national aggregated demand for the historical and future periods with a good representation of the daily and seasonal cyclicity of the demand. The model has a mean error of 5 % to 10 % of the observed demand and explains 90 % of its variability. Note however that because of the time span of the training data, the model corresponds to socio-economic electricity demand conditions (level of electrification, population, etc.) of the years 2014 to 2019. Such socio-economic parameters are supposed to remain constant in this study to isolate the effect of climate change, but their evolution could be explored in further works.
2.4 Energy system model
Assessing the impacts of a changing climate on the electricity generation sector in a systemic way is challenging due to the number of processes to be accounted for and their relevant spatial and temporal scales (see e.g. Ralston Fonseca et al., 2021a). These challenges add up to those encountered when dealing with high VRE systems (Ringkjøb et al., 2018; Prina et al., 2020). In this last case, a particular attention must be given to the proper representation of the weather and climate dependent VRE and demand time series. As such multiple years, from 10 to several decades (Bloomfield et al., 2016; Pfenninger, 2017; Staffell and Pfenninger, 2018; Zeyringer et al., 2018), 1 to 3-hourly time series should be used when no other time resolution reduction method is explicitly applied and tested beforehand (Pfenninger, 2017). Conclusions of modeling exercises with a high penetration of VREs failing to address, or a minima acknowledge this issue, would be highly compromised.
In this study, the treatment of non-VRE (i.e. dispatchable) sources is highly idealized to reduce modeling complexity, placing us in a best case setting in this regard. This allows us to discard the added complexity of having to deal with the water-energy nexus. Storage, transmission and imports/exports are also not included to keep the problem as minimalistic as possible. These could be incorporated into further studies by using a higher level model such as PyPSA (Brown et al., 2018) or Calliope (Pfenninger and Pickering, 2018).
We adapt the energy system model E4CLIM (Tantet et al., 2019) in its latest version (Tantet and Drobinski, 2021) to study the impacts of a changing demand and VRE capacity factors on optimal investment decisions. Our modeling domain is metropolitan France, a map of which is presented in Fig. 1. E4CLIM is a bottom-up linear programming stochastic power system model performing greenfield optimization in a single step, while ensuring hourly adequacy for the considered time period. It minimizes a system total cost that accounts for investment in VRE capacity (fixed costs) and generation of dispatchable (i.e. non-VRE) producers (variable costs). In this study, optimization is conducted over 30 year long hourly time series of demand and VRE capacity factors.
2.5 Scenarios
The study focuses on the response of the electricity generation sector to climate change and thus relies on a set of scenarios. In this study, socioeconomic determinants of the electrcity demand are kept constant and equal to the average conditions of 2014–2019 in metropolitan France. They are learnt via the training step of the demand model. VRE fixed costs are also kept constant and equal to EUR 115.7 and 39.9 for wind and solar respectively. The parameter that determines the magnitude of the variable costs of the dispatchable producers is kept constant so that the share of installed wind and solar capacity reaches 60 % under current conditions.
The socioeconomic parameters are then combined to different levels of climate change to yield the scenarios considered in this study. The combination of the aforementioned socioeconomic parameters to the historical (1975–2005) period gives us the Reference (REF) scenario. Then different levels of climate change are considered by sampling the climate data of the future period forced with the RCP 8.5 scenario over different 30 year long time periods. Sampling the future climate around 2035 (2020–2050 period) yields an average warming of +1.75 °C above pre-industrial levels, thus giving scenario REF1.75. Similarly, periods centered around 2050, 2060, 2070 and 2085 give scenarios REF2.35, REF2.80, REF3.28 and REF4.04 associated to their respective temperature increase. These scenarios are then used for the purpose of our study.
3.1 Impact of climate change on optimal wind and solar mixes
3.1.1 Installed VRE capacity
The impact of climate change on the optimal investment decisions is presented in Fig. 2 for the results aggregated at the national level. Results at the regional level are more complex and call for further research as well as a separated detailed analysis. We observe a robust consistent decrease of the installed wind capacity with increasing climate change: the former decreases monotonously with increasing climate change, from −2 % to −9 % for the REF1.75 scenario and up to −15 % to −22 % for scenario REF4.04. For solar, all variations are kept within ±3 % except for model pair MOHC-HADGEM2 + COSMO where the increase of solar PV with increasing climate change reaches +6 %. Optimal investment decisions in VRE mixes are thus impacted by climate change: the higher the level of climate change and the less wind capacity is worth installing (robust result). In turn, the optimal level of investment in solar capacity remains roughly constant with climate change (robust result but for one model).
3.1.2 Dispatchable capacity
Installed dispatchable capacity corresponds in our model to what is sometimes referred to as the balancing needs (Heide et al., 2010). It corresponds to the maximum of the residual demand (i.e. demand net of VRE generation) over the whole time period of optimization. As such it is directly determined by extreme events of high residual demand in the time series: this is why we do not observe a consistent behavior of the dispatchable capacity with increasing climate change, as extreme residual demand events (e.g. a high demand for heating combined to a wind drought) can still occur in warmer climates. Importantly, the obtained results show that extreme demand events are not necessarily correlated to extreme residual demand events: balancing needs may decrease with increasing climate change, even if extreme events of high demand still persist. This is evidenced by the comparison of the REF2.35 and REF2.80 scenarios in Fig. 2c, where both scenarios have the same level (101 GW) of dispatchable capacity but maximum demand is higher in scenario REF2.80 than in REF2.35. This is related to the occurrence of peak residual demand not following the occurrence of a high peak demand. A similar effect can be observed by comparing scenario REF2.35 and scenario REF3.28 in Fig. 2b.
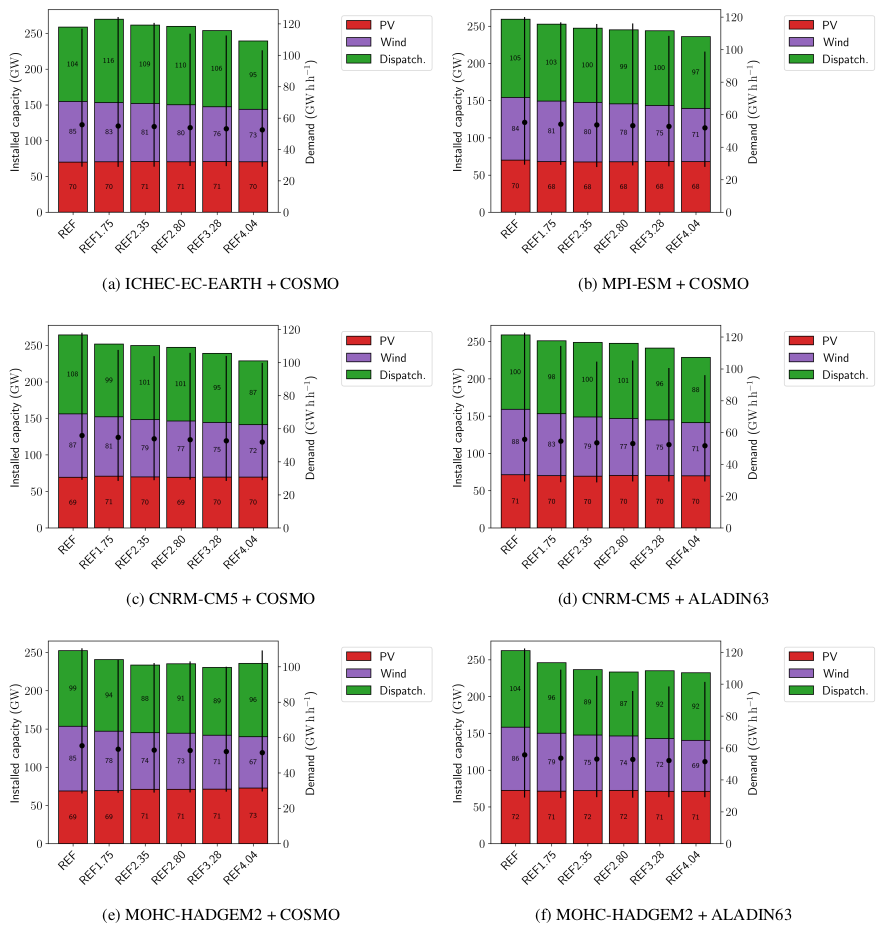
Figure 2Optimal VRE mixes (national level) for the levels of global warming considered. Each panel (a–f) corresponds to a GCM + RCM pair. Bars correspond to the nationally installed capacity in solar PV (red), wind (purple) and dispatchable (green), and correspond to the left axis graduation. Black dots correspond to the observed average demand during the 30 year period with the errorbar corresponding to the min-max values. They are associated to the right axis graduations.
3.2 Impacts of climate change on system costs
Aside from impacting optimal investment decisions, climate change impacts system costs. These depend on the adaptation strategy, supposing that some level of climate change will happen: either the central planner decides to adapt to climate change, and in our case it does so with perfect foresight, either it decides not to adapt, in which case climate change impacts the mix in its reference state. Since adapting to climate change with perfect foresight corresponds to decreasing the share of installed wind capacity, any unperfect adaptation strategy (e.g. adapting to a level of climate change while another one happens to actually unfold) will fall between the two mentioned extremes. We present both these extreme adaptation strategies and associated system costs in the following, and introduce a measure that allows us to compare both strategies.
Facing climate change with perfect foresight, a central planner has either the choice to perfectly adapt to climate change (i.e. optimize the VRE mix to a given level of climate change) or the choice not to adapt at all. In this last case, the VRE mix corresponds to the optimal mix under reference conditions put under the conditions of a changed climate (i.e. climate change happens whereas mix optimization does not). Each of these adaptation strategies yields a yearly system total cost that can be compared to the yearly system total cost in the reference scenario. We define the non-adaptation costs associated to scenario S (NACS) as the difference between the system total cost under scenario S without adaptation and the system total cost in the reference scenario. Similarly, we define the perfect adaptation costs associated to scenario S (PACS) as the difference between the system total cost under scenario S with perfect adaptation (i.e. with the corresponding optimal VRE mix) and the system total cost under the reference scenario. The evolution of both indicators under the different climate change scenarios is shown in Fig. 3. We observe a monotonous decrease of both the NAC and the PAC with increasing climate change intensity (except between scenarios REF1.75 and REF2.35 under model pair MOHC-HADGEM2 + COSMO). This behavior is consistent across models and is thus robust in this sense. We also observe that both NAC and PAC are always negative: system total costs under some level of climate change are less than in the reference case. This is also a robust result. The magnitude of the NAC and PAC varies across models and level of climate change: from a negligible impact (less than EUR 0.01 billion) per year (NAC) and a EUR 0.03 billion improvement (PAC) for the lowest level of climate change, to EUR 2.67 billion per year (NAC) and EUR 2.9 billion per year (PAC) improvements for the highest level of climate change. We thus show that in our experiment, no matter the future outcome (i.e. the level of climate change) and no matter the adaptation strategy, yearly total costs will decrease with climate change, ceteris paribus.
The previous result makes us ask wether perfect adaptation, which implies the building or decomissioning of new resp. installed capacity with respect to the VRE mix optimal under the reference scenario, is economically interesting. To investigate this question, we define a quantity that measures the benefits of perfect adaptation and that we call the cost of unpreparedness (CoU), as a measure of the extra costs incurred in the case where the central planner with perfect foresight does not adapt the VRE mix to future climate change conditions. The CoU is computed as the difference between the NAC and the PAC, and is represented in Fig. 3. We first observe that the CoU is positive and steadily increases with increasing climate change intensity. The CoU takes values between EUR 0.02 billion and EUR 0.23 billion across models and levels of climate change.
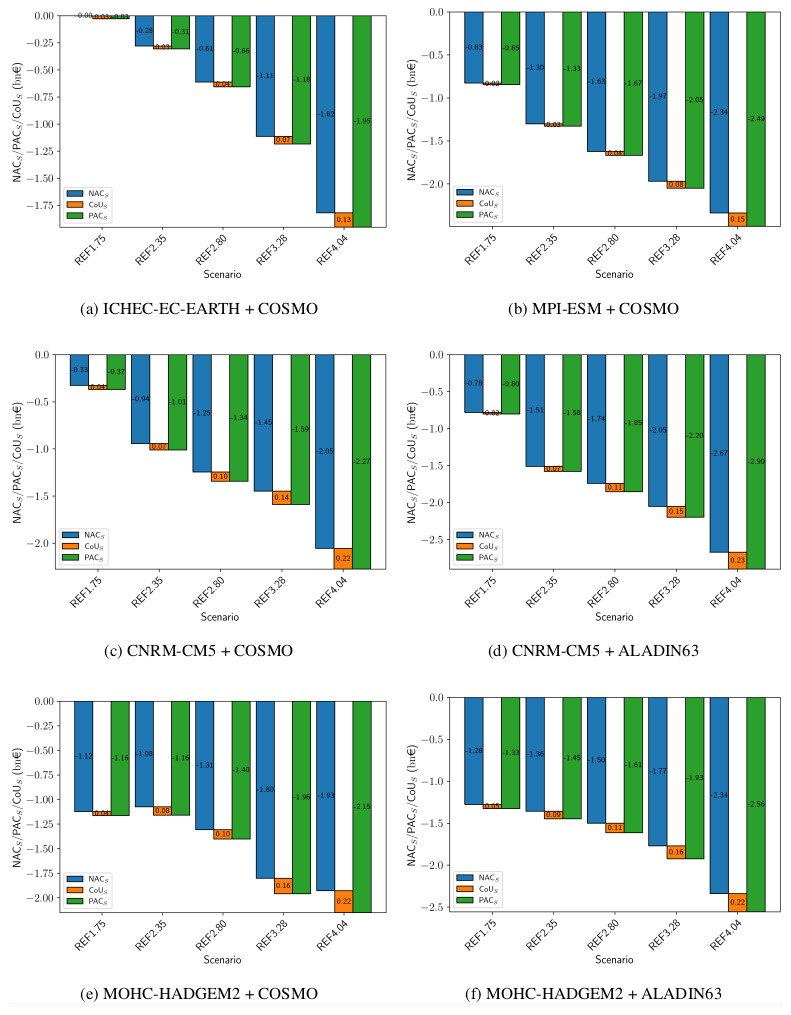
Figure 3Non-adaptation costs (NAC), perfect adaptation costs (PAC) and cost of unpreparedness (CoU) for the levels of global warming considered. Each panel (a–f) corresponds to a GCM + RCM pair.
4.1 Investment in wind and solar capacity
We showed so far that in the case of France, increasing climate change led to optimal mixes with less installed wind capacity, while the amount of installed solar capacity remained constant.
This result is robust except for one model in the case of solar capacity, where the amount of installed solar capacity was found to be increasing. We suggest that this discrepancy is due to an increased correlation of solar generation with demand in this particular simulation, that is not observed in the other simulations with such intensity. This robustness in capacity investment trends versus the varied trends in wind and solar resource reported in the literature (see e.g. Tobin et al., 2018; Cai and Bréon, 2021, among others) and observed in our input data (not shown) leads us to the conclusion that impacts of climate change are majoritarily demand-side. This makes our results robust to the relevant observations of Gutiérrez et al. (2020), Wohland (2022), that show that projections of the evolution of the wind and solar resource greatly vary depending on the climate model or model ensemble used. The effects evidenced in this study are to the first order demand-side and as such not so sensitive to the aforementioned discrepancies. We however do not exclude that stronger changes in wind and solar resource might cause supply-side effects: what is the extent of supply-side change needed for this to happen is however not straightforward and its quantification is left to further studies.
If the effects of climate change on the investment decisions are majoritarily demand-side, the correlation of the wind and solar resource to the demand is however not sufficient to explain the observed trends: if the wind to demand correlation tends to decrease, that of solar to demand tends to increase (not shown). We thus further propose that these observations are explained by (i) an average demand effect that makes the wind and solar capacity decrease with increasing climate change, and (ii) a demand to capacity factor correlation effect that brings wind capacity to decrease even more and solar capacity to remain steady, as the average demand effect is compensated by the correlation effect for the latter. Further studies comparing a decrease in average demand equivalent to a decrease from climate change would be needed to support this conclusion.
If existing literature (Schlott et al., 2018; Ralston Fonseca et al., 2021a) shows similar results regarding investment decisions, they lack the proposition of such a detailed explanatory mechanism. Schlott et al. (2018) also find that the importance of wind in the optimal mix will shrink under climate change conditions, but to the contrary of us find that the installed solar capacity will increase. They do not however account for demand changes with climate change, which we show to be of major importance when considering the correlation of VRE generation to demand. Taking into account the effect of a demand change, Ralston Fonseca et al. (2021a) find that solar generation capacity increases while installed wind capacity decreases with increasing climate change. If the increase in installed solar capacity is discussed and suggested to happen due to an increase in summer peak demand, the decrease in installed wind capacity is not discussed. Their results are however not incompatible with our proposed model.
It is finally important to consider these conclusions in regard of the strong working hypothesis that sets the balancing needs to be available at no other cost than their generation (i.e. no costs needed to install or remove capacity). This hypothesis makes us miss a feedback between installing more dispatchable generators vs. relying on more wind and solar power. We expect that accounting for dispatchable fixed costs would lead to less dispatchable investment and in turn more VRE investment to ensure adequacy. If this would favor the installation of wind or solar energy is however left for further studies to investigate. Furthermore, considering that dispatchable producers are always available neglects all the adverse impacts of climate change on dispatchable generation, from availability of hydropower to thermal deratings of thermoelectric units (van Vliet et al., 2016). In our case two possibilities arise: either the impacts of climate change on the dispatchable producers are negligible compared to demand-side impacts and in this case the results and conclusions would be unchanged, or if these impacts are of significant importance, then a more complex model involving dispatchable producers influence should be proposed.
We can conclude that for the case of France, and if the impacts on dispatchable producers can be neglected, climate change impacts on the optimal investment decisions in VRE are thus primarily demand-side related, with two effects competing to determine the optimal levels of investment: an average effect that leads to an increase resp. decrease of VRE capacity with increasing resp. decreasing average demand, and a correlation effect that in the case of France tends to favor solar capacity over wind capacity with increasing climate change.
4.2 Investment in balancing capacity
We show that the amount of installed dispatchable capacity is not directly linked to extreme events of high demand. In fact, dispatchable capacity is determined by extreme events of high residual demand. This shows that these events of high demand resp. residual demand are not necessarily correlated. A similar result was found in van der Wiel et al. (2019), but for the co-occurrence of events of high residual demand and low VRE production, calling for a detailed investigation with a focus on demand-related events, which we infer to be the main drivers of the system. Further research in extreme events theory and a more in-depth exploration of the occurrence of demand and residual demand extremes with a changing climate would also be needed to (i) conclude on the probability that an extreme event of residual demand occurs given that an extreme event of demand has occurred, and (ii) study the impacts of extreme events of residual demand on the VRE and dispatchable mix. Again, these future research questions should be contemplated in light of the simplifying assumption regarding dispatchable producers. We can expect that if the costs of installing dispatchable generation are accounted for, then extreme events of residual demand will not determine fully the amount of dispatchable generation. This could also be considered in light of a more complex energy system including storage, transmission and other energy carriers.
4.3 Adaptation strategies
We showed that no matter the climate change scenario considered, the perfect adaptation (PAC) and non adaptation costs (NAC) are always positive. As such, we could conclude that climate change has no adverse impacts on the electricity generation sector, questioning the need to adapt to it. We however showed that the benefit of perfect adaptation, or cost of unpreparedness (CoU) increases with increasing climate change. The higher the level of climate change thus the more interesting it is to adapt to it.
However this measure misses the fact that perfect adaptation necessitates the building resp. decomissioning of new resp. installed capacity departing from the reference mix. In the scope of this study, adaptation to climate change translates in the decomissioning of wind power plants, between 2 and 8 GW across models for the lowest level of climate change and between 12 and 18 GW across models for the highest level of cimate change. These decomissionings lead to stranded assets costs of EUR 0.23 billion to EUR 2.08 billion across models and levels of climate change. In fact, these stranded assets costs are consistently an order of magnitude higher than their associated CoU. We thus show that in our experiment, although yearly total system costs are smaller with a perfectly adapted mix, accounting for the full adaptation path makes the perfect adaptation strategy less attractive economically than its non-adaptation counterpart.
This could lead us to the conclusions that climate change has no adverse impacts on system costs, and that as the costs of adaptation to climate change overcome the costs incurred in the case of no adaptation, thus not incentivizing for adaptation measures, there is no need for adapting the energy system to potential forthcoming climate change. However this misses the crucial hypotheses regarding the handling of dispatchable generation. Our analysis represents an ideal case, which is the reason why no adverse impacts of climate change on system costs are found. Other, more complete analysis in this regard, do find adverse impacts of climate change on the system. In Schlott et al. (2018), system total costs are found to increase or remain constant with increasing climate change (depending on the climate model). Ralston Fonseca et al. (2021b) discuss system costs impacts of climate change, where different adaptation strategies are also considered. They do find that system costs might surge if adaptation to climate change is not appropriately carried. This comes from the fact that a mix not adapted to climate change fails to supply electricity more often than a correctly adapted mix. This cannot happen in our study because of our working hypotheses and highlights a crucial limitation of our work. It highlights the importance of dispatchable producers as a key element in electricity system adaptation to climate change, and the importance of accounting for the effect of climate change on the whole electricity generation sector to avoid biased policymaking advice.
We can thus conclude on the importance of considering the many interactions between energy system components when issuing policymaking advice, and we can not sufficiently point out that if component-level studies are necessary, the compound effect of all or a group of components needs to be considered for impactful research. We introduced in this study a set of metrics to discuss energy system adaptation to climate change, that could be worth using in future studies. How these metrics would behave in a similar experiment conducted with a more complex representation of the energy system will be the subject of further research.
Code and data are available upon request.
JDY: Conceptualization, Data curation, Formal analysis, Investigation, Methodology, Software, Validation, Visualization, Writing – original draft preparation, Writing – review & editing. AT: Conceptualization, Data curation, Methodology, Project administration, Software, Supervision, Validation, Writing – review & editing. PD: Conceptualization, Funding acquisition, Project administration, Supervision, Validation, Writing – review and editing.
The contact author has declared that none of the authors has any competing interests.
Publisher's note: Copernicus Publications remains neutral with regard to jurisdictional claims made in the text, published maps, institutional affiliations, or any other geographical representation in this paper. While Copernicus Publications makes every effort to include appropriate place names, the final responsibility lies with the authors.
This article is part of the special issue “European Geosciences Union General Assembly 2024, EGU Division Energy, Resources & Environment (ERE)”. It is a result of the EGU General Assembly 2024, Vienna, Austria, 14–19 April 2024.
This research is conducted in the frame of the Energy4Climate Interdisciplinary Center (E4C) of Institut Polytechnique de Paris and Ecole des Ponts ParisTech.
This research has been supported by the 3rd Programme d'Investissements d'Avenir (grant no. ANR-18-EUR-0006-02) and by the Foundation of Ecole Polytechnique and ENGIE through the program “Résilience des systèmes énergétiques au changement climatique et émissions négatives”.
This paper was edited by Michael Kühn and reviewed by Luis Ramirez Camargo and two anonymous referees.
Bloomfield, H. C., Brayshaw, D. J., Shaffrey, L. C., Coker, P. J., and Thornton, H. E.: Quantifying the increasing sensitivity of power systems to climate variability, Environ. Res. Lett., 11, 124025, https://doi.org/10.1088/1748-9326/11/12/124025, 2016. a
Bloomfield, H. C., Brayshaw, D. J., Troccoli, A., Goodess, C. M., De Felice, M., Dubus, L., Bett, P. E., and Saint-Drenan, Y. M.: Quantifying the sensitivity of european power systems to energy scenarios and climate change projections, Renewable Energy, 164, 1062–1075, https://doi.org/10.1016/j.renene.2020.09.125, 2021. a
Brown, T., Hörsch, J., and Schlachtberger, D.: PyPSA: Python for Power System Analysis, J. Open Res. Softw., 6, 4, https://doi.org/10.5334/jors.188, 2018. a
Cai, Y. and Bréon, F.-M.: Wind power potential and intermittency issues in the context of climate change, Energ. Convers. Manage., 240, 114276, https://doi.org/10.1016/j.enconman.2021.114276, 2021. a
Ciscar, J.-C. and Dowling, P.: Integrated assessment of climate impacts and adaptation in the energy sector, Energy Economics, 46, 531–538, https://doi.org/10.1016/j.eneco.2014.07.003, 2014. a
Coppola, E., Nogherotto, R., Ciarlo', J. M., Giorgi, F., van Meijgaard, E., Kadygrov, N., Iles, C., Corre, L., Sandstad, M., Somot, S., Nabat, P., Vautard, R., Levavasseur, G., Schwingshackl, C., Sillmann, J., Kjellström, E., Nikulin, G., Aalbers, E., Lenderink, G., Christensen, O. B., Boberg, F., Sørland, S. L., Demory, M.-E., Bülow, K., Teichmann, C., Warrach-Sagi, K., and Wulfmeyer, V.: Assessment of the European Climate Projections as Simulated by the Large EURO-CORDEX Regional and Global Climate Model Ensemble, J. Geophys. Res.-Atmos., 126, e2019JD032356, https://doi.org/10.1029/2019JD032356, 2021. a
Craig, M. T., Cohen, S., Macknick, J., Draxl, C., Guerra, O. J., Sengupta, M., Haupt, S. E., Hodge, B.-M., and Brancucci, C.: A review of the potential impacts of climate change on bulk power system planning and operations in the United States, Renewable and Sustainable Energy Reviews, 98, 255–267, https://doi.org/10.1016/j.rser.2018.09.022, 2018. a, b
Craig, M. T., Carreño, I. L., Rossol, M., Hodge, B.-M., and Brancucci, C.: Effects on power system operations of potential changes in wind and solar generation potential under climate change, Environ. Res. Lett., 14, 034014, https://doi.org/10.1088/1748-9326/aaf93b, 2019. a
Dupré, A.: Sizing of a short term wind forecasting system, Ph.D. thesis, Institut Polytechnique de Paris, https://theses.hal.science/tel-02513065 (last access: 7 December 2023), 2020. a
Gutiérrez, C., Somot, S., Nabat, P., Mallet, M., Corre, L., Meijgaard, E. V., Perpiñán, O., and Gaertner, M. A.: Future evolution of surface solar radiation and photovoltaic potential in Europe: investigating the role of aerosols, Environ. Res. Lett., 15, 034035, https://doi.org/10.1088/1748-9326/ab6666, 2020. a, b
Heide, D., von Bremen, L., Greiner, M., Hoffmann, C., Speckmann, M., and Bofinger, S.: Seasonal optimal mix of wind and solar power in a future, highly renewable Europe, Renewable Energy, 35, 2483–2489, https://doi.org/10.1016/j.renene.2010.03.012, 2010. a
Heptonstall, P. J. and Gross, R. J. K.: A systematic review of the costs and impacts of integrating variable renewables into power grids, Nature Energy, 6, 72–83, https://doi.org/10.1038/s41560-020-00695-4, 2021. a
Hersbach, H., Bell, B., Berrisford, P., Hirahara, S., Horányi, A., Muñoz-Sabater, J., Nicolas, J., Peubey, C., Radu, R., Schepers, D., Simmons, A., Soci, C., Abdalla, S., Abellan, X., Balsamo, G., Bechtold, P., Biavati, G., Bidlot, J., Bonavita, M., De Chiara, G., Dahlgren, P., Dee, D., Diamantakis, M., Dragani, R., Flemming, J., Forbes, R., Fuentes, M., Geer, A., Haimberger, L., Healy, S., Hogan, R. J., Hólm, E., Janisková, M., Keeley, S., Laloyaux, P., Lopez, P., Lupu, C., Radnoti, G., de Rosnay, P., Rozum, I., Vamborg, F., Villaume, S., and Thépaut, J.-N.: The ERA5 global reanalysis, Q. J. Roy. Meteor. Soc., 146, 1999–2049, https://doi.org/10.1002/qj.3803, 2020. a, b
Jacob, D., Petersen, J., Eggert, B., Alias, A., Christensen, O. B., Bouwer, L. M., Braun, A., Colette, A., Déqué, M., Georgievski, G., Georgopoulou, E., Gobiet, A., Menut, L., Nikulin, G., Haensler, A., Hempelmann, N., Jones, C., Keuler, K., Kovats, S., Kröner, N., Kotlarski, S., Kriegsmann, A., Martin, E., van Meijgaard, E., Moseley, C., Pfeifer, S., Preuschmann, S., Radermacher, C., Radtke, K., Rechid, D., Rounsevell, M., Samuelsson, P., Somot, S., Soussana, J.-F., Teichmann, C., Valentini, R., Vautard, R., Weber, B., and Yiou, P.: EURO-CORDEX: new high-resolution climate change projections for European impact research, Reg. Environ. Change, 14, 563–578, https://doi.org/10.1007/s10113-013-0499-2, 2014. a
Jaglom, W. S., McFarland, J. R., Colley, M. F., Mack, C. B., Venkatesh, B., Miller, R. L., Haydel, J., Schultz, P. A., Perkins, B., Casola, J. H., Martinich, J. A., Cross, P., Kolian, M. J., and Kayin, S.: Assessment of projected temperature impacts from climate change on the U.S. electric power sector using the Integrated Planning Model, Energy Policy, 73, 524–539, https://doi.org/10.1016/j.enpol.2014.04.032, 2014. a, b
Khan, Z., Iyer, G., Patel, P., Kim, S., Hejazi, M., Burleyson, C., and Wise, M.: Impacts of long-term temperature change and variability on electricity investments, Nat. Commun., 12, 1643, https://doi.org/10.1038/s41467-021-21785-1, 2021. a, b
Kozarcanin, S., Liu, H., and Andresen, G. B.: 21st Century Climate Change Impacts on Key Properties of a Large-Scale Renewable-Based Electricity System, Joule, 3, 992–1005, https://doi.org/10.1016/j.joule.2019.02.001, 2019. a
Lavaysse, C., Vrac, M., Drobinski, P., Lengaigne, M., and Vischel, T.: Statistical downscaling of the French Mediterranean climate: assessment for present and projection in an anthropogenic scenario, Nat. Hazards Earth Syst. Sci., 12, 651–670, https://doi.org/10.5194/nhess-12-651-2012, 2012. a
McFarland, J., Zhou, Y., Clarke, L., Sullivan, P., Colman, J., Jaglom, W. S., Colley, M., Patel, P., Eom, J., Kim, S. H., Kyle, G. P., Schultz, P., Venkatesh, B., Haydel, J., Mack, C., and Creason, J.: Impacts of rising air temperatures and emissions mitigation on electricity demand and supply in the United States: a multi-model comparison, Clim. Change, 131, 111–125, https://doi.org/10.1007/s10584-015-1380-8, 2015. a, b
Miara, A., Cohen, S. M., Macknick, J., Vörösmarty, C. J., Corsi, F., Sun, Y., Tidwell, V. C., Newmark, R., and Fekete, B. M.: Climate-Water Adaptation for Future US Electricity Infrastructure, Environ. Sci. Technol., 53, 14029–14040, https://doi.org/10.1021/acs.est.9b03037, 2019. a
Michelangeli, P.-A., Vrac, M., and Loukos, H.: Probabilistic downscaling approaches: Application to wind cumulative distribution functions, Geophys. Res. Lett., 36, https://doi.org/10.1029/2009GL038401, 2009. a
Mima, S. and Criqui, P.: The Costs of Climate Change for the European Energy System, an Assessment with the POLES Model, Environ. Model. A., 20, 303–319, https://doi.org/10.1007/s10666-015-9449-3, 2015. a
Moss, R. H., Edmonds, J. A., Hibbard, K. A., Manning, M. R., Rose, S. K., van Vuuren, D. P., Carter, T. R., Emori, S., Kainuma, M., Kram, T., Meehl, G. A., Mitchell, J. F. B., Nakicenovic, N., Riahi, K., Smith, S. J., Stouffer, R. J., Thomson, A. M., Weyant, J. P., and Wilbanks, T. J.: The next generation of scenarios for climate change research and assessment, Nature, 463, 747–756, https://doi.org/10.1038/nature08823, 2010. a
Peter, J.: How does climate change affect electricity system planning and optimal allocation of variable renewable energy?, Appl. Energy, 252, 113397, https://doi.org/10.1016/j.apenergy.2019.113397, 2019. a
Pfenninger, S.: Dealing with multiple decades of hourly wind and PV time series in energy models: A comparison of methods to reduce time resolution and the planning implications of inter-annual variability, Appl. Energy, 197, 1–13, https://doi.org/10.1016/j.apenergy.2017.03.051, 2017. a, b
Pfenninger, S. and Pickering, B.: Calliope: a multi-scale energy systems modelling framework, J. Open Source Softw., 3, 825, https://doi.org/10.21105/joss.00825, 2018. a
Prina, M. G., Manzolini, G., Moser, D., Nastasi, B., and Sparber, W.: Classification and challenges of bottom-up energy system models - A review, Renewable and Sustainable Energy Reviews, 129, 109917, https://doi.org/10.1016/j.rser.2020.109917, 2020. a
Ralston Fonseca, F., Craig, M., Jaramillo, P., Bergés, M., Severnini, E., Loew, A., Zhai, H., Cheng, Y., Nijssen, B., Voisin, N., and Yearsley, J.: Effects of Climate Change on Capacity Expansion Decisions of an Electricity Generation Fleet in the Southeast U.S., Environ. Sci. Technol., 55, 2522–2531, https://doi.org/10.1021/acs.est.0c06547, 2021a. a, b, c, d
Ralston Fonseca, F., Craig, M., Jaramillo, P., Bergés, M., Severnini, E., Loew, A., Zhai, H., Cheng, Y., Nijssen, B., Voisin, N., and Yearsley, J.: Climate-Induced Tradeoffs in Planning and Operating Costs of a Regional Electricity System, Environ. Sci. Technol., 55, 11204–11215, https://doi.org/10.1021/acs.est.1c01334, 2021b. a
Ringkjøb, H.-K., Haugan, P. M., and Solbrekke, I. M.: A review of modelling tools for energy and electricity systems with large shares of variable renewables, Renewable and Sustainable Energy Reviews, 96, 440–459, https://doi.org/10.1016/j.rser.2018.08.002, 2018. a
Schlott, M., Kies, A., Brown, T., Schramm, S., and Greiner, M.: The impact of climate change on a cost-optimal highly renewable European electricity network, Appl. Energy, 230, 1645–1659, https://doi.org/10.1016/j.apenergy.2018.09.084, 2018. a, b, c, d
Sijm, J.: Cost and revenue related impacts of integrating electricity from variable renewable energy into the power system – A review of recent literature, Tech. Rep. ECN-E–14-022, http://resolver.tudelft.nl/uuid:da69fee6-6c0b-47b9-b0a5-bb57db557d17 (last access: 26 January 2025), 2014. a
Staffell, I. and Pfenninger, S.: The increasing impact of weather on electricity supply and demand, Energy, 145, 65–78, https://doi.org/10.1016/j.energy.2017.12.051, 2018. a
Tantet, A. and Drobinski, P.: A Minimal System Cost Minimization Model for Variable Renewable Energy Integration: Application to France and Comparison to Mean-Variance Analysis, Energies, 14, 5143, https://doi.org/10.3390/en14165143, 2021. a, b
Tantet, A., Stéfanon, M., Drobinski, P., Badosa, J., Concettini, S., Cretì, A., D’Ambrosio, C., Thomopulos, D., and Tankov, P.: e4clim 1.0: The Energy for a Climate Integrated Model: Description and Application to Italy, Energies, 12, 4299, https://doi.org/10.3390/en12224299, 2019. a, b, c, d
Tobin, I., Greuell, W., Jerez, S., Ludwig, F., Vautard, R., Vliet, M. T. H. V., and Bréon, F.-M.: Vulnerabilities and resilience of European power generation to 1.5 °C, 2 °C and 3 °C warming, Environ. Res. Lett., 13, 044024, https://doi.org/10.1088/1748-9326/aab211, 2018. a
Turner, S. W. D., Voisin, N., Fazio, J., Hua, D., and Jourabchi, M.: Compound climate events transform electrical power shortfall risk in the Pacific Northwest, Nat. Commun., 10, 8, https://doi.org/10.1038/s41467-018-07894-4, 2019. a
van der Wiel, K., Stoop, L. P., van Zuijlen, B. R. H., Blackport, R., van den Broek, M. A., and Selten, F. M.: Meteorological conditions leading to extreme low variable renewable energy production and extreme high energy shortfall, Renewable and Sustainable Energy Reviews, 111, 261–275, https://doi.org/10.1016/j.rser.2019.04.065, 2019. a
van Vliet, M. T. H., Wiberg, D., Leduc, S., and Riahi, K.: Power-generation system vulnerability and adaptation to changes in climate and water resources, Nat. Clim. Change, 6, 375–380, https://doi.org/10.1038/nclimate2903, 2016. a
Vrac, M., Drobinski, P., Merlo, A., Herrmann, M., Lavaysse, C., Li, L., and Somot, S.: Dynamical and statistical downscaling of the French Mediterranean climate: uncertainty assessment, Nat. Hazards Earth Syst. Sci., 12, 2769–2784, https://doi.org/10.5194/nhess-12-2769-2012, 2012. a
Wohland, J.: Process-based climate change assessment for European winds using EURO-CORDEX and global models, Environ. Res. Lett., 17, 124047, https://doi.org/10.1088/1748-9326/aca77f, 2022. a, b
Yalew, S. G., van Vliet, M. T. H., Gernaat, D. E. H. J., Ludwig, F., Miara, A., Park, C., Byers, E., De Cian, E., Piontek, F., Iyer, G., Mouratiadou, I., Glynn, J., Hejazi, M., Dessens, O., Rochedo, P., Pietzcker, R., Schaeffer, R., Fujimori, S., Dasgupta, S., Mima, S., da Silva, S. R. S., Chaturvedi, V., Vautard, R., and van Vuuren, D. P.: Impacts of climate change on energy systems in global and regional scenarios, Nature Energy, 5, 794–802, https://doi.org/10.1038/s41560-020-0664-z, 2020. a, b
Zeyringer, M., Price, J., Fais, B., Li, P.-H., and Sharp, E.: Designing low-carbon power systems for Great Britain in 2050 that are robust to the spatiotemporal and inter-annual variability of weather, Nature Energy, 3, 395–403, https://doi.org/10.1038/s41560-018-0128-x, 2018. a
To limit global warming to well below 2 °C and to pursue efforts to limit global warming to 1.5 °C with respect to pre-industrial level temperatures.
Own computation base on data from https://di.unfccc.int/detailed_data_by_party (last access: 3 July 2024) without LULUCF.
Words in parenthesis indicate the EURO-CORDEX short variable name