 | 27 Sep 2024
New data for a model update of the Waiwera geothermal reservoir in New Zealand
Michael Kühn
Vaughan Stagpoole
Graham Paul D. Viskovic
Thomas Kempka
Waiwera is a small coastal village located on New Zealand's North Island above a geothermal reservoir. The origin of the hot water is not well understood. An inferred fault zone at the base of the reservoir is thought to channelise the uprising thermal water. The most recent geological model of Waiwera integrates the depositional environment, mineralogical composition and stratigraphic structures. Coupled numerical fluid flow, heat and transport simulations indicated that further model revisions are required, with support by additional field campaigns, to increase the knowledge of the complex reservoir geology. In this study, gravity data were acquired around the greater Waiwera area. Its interpretation shows a potential fault downthrow in the basement. This feature was tested using a revised geological model in view of a focus for the hot water to rise upwards. The observed characteristic cold and hot water distribution in the system was simulated and the temperature profiles show an improved agreement in the near field around the centre of the reservoir.
- Article
(6374 KB) - Full-text XML
- BibTeX
- EndNote


Waiwera is a small coastal village located on the southern bank of the Waiwera River (Fig. 1), north of Auckland on New Zealand's North Island. The geothermal springs at Waiwera have been used for bathing for several centuries and boreholes drilled in the last 70 years have provided additional hot water for both bathing and heating. Over 70 boreholes in the area encounter geothermally influenced water at 200 m to 400 m b.m.s.l. (below mean sea level). The geothermal reservoir below the town is within compacted and cemented sandstones and siltstones of the Waitemata Group (Auckland Regional Water Board, 1987; Auckland Regional Council, 1999; Kühn and Stöfen, 2005). These are 400 m thick and have been folded, faulted and fractured by tectonic processes throughout the entire depth.

Figure 1Waiwera study area and geological map. Insert: provided by Eagle Technology and Land Information New Zealand.
The origin of the 50 °C warm water is not well understood because the deeper structure of the field has mainly been inferred from the spatial distribution of thermal water from producing boreholes. Thermal water is inferred to rise along faults and fractures in the underlying Triassic-Jurassic Waipapa Group basement (Waipapa Composite Terrane) greywacke rocks and is stored in early Miocene Warkworth Subgroup (Waitemata Group) sediments (Auckland Regional Council, 1999; Weeber et al., 2001; Rose and Zemansky, 2013).
The youngest unit in the underlying geology of Waiwera consists of the flat land immediately adjacent to the Waiwera River mouth (Fig. 1). It is composed of unconsolidated alluvial and marine sands, silts and clays of Holocene age that are up to 13 m thick (Zemansky, 2005). These are underlain by the early Miocene age Waitemata Group – Pakiri Formation which is a flysch deposit consisting of alternating muddy sandstone, siltstone and interbedded lenses of volcanically derived material (Parnell Grit) containing grit to boulder-sized basaltic to andesite lava clasts. The Pakiri formation in the study is underlain by Mesozoic Waipapa (composite) Terrane greywacke rocks (Edbrooke, 2001). These basement rocks do not outcrop in the area around Waiwera but do on some of the Hauraki Gulf Islands to the east of the study area (i.e., Kawau Island and Tiritiri Matangi Island).
This manuscript describes the acquisition, processing and modelling of closely spaced gravity measurements carried out in March 2023 to determine the basement geometry of the Waiwera region which is then used in subsequent numerical simulations.
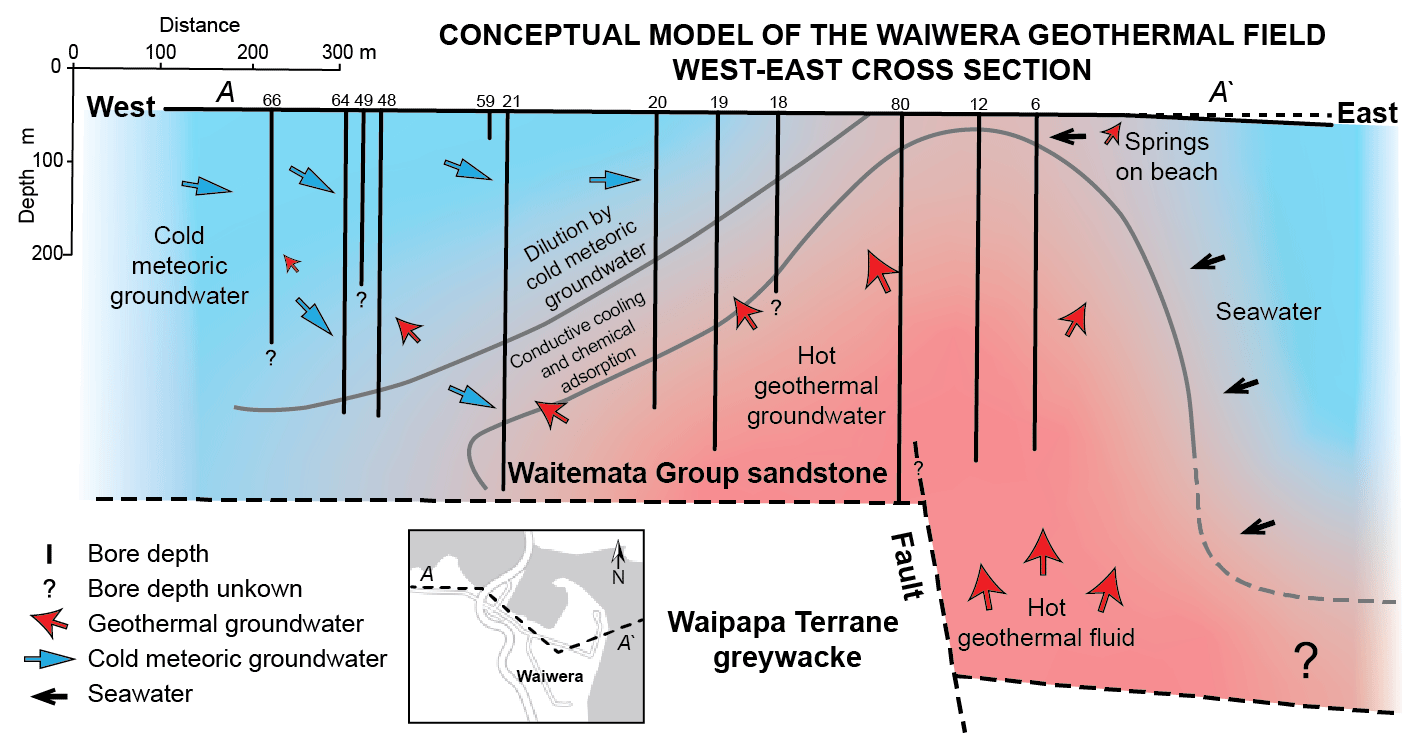
Figure 2Conceptual cross-section of the geothermal area at Waiwera (Kühn et al., 2022). The reservoir is fed by three different waters. The fault zone at the base of the reservoir is thought to be the source of the thermal water (Kempka and Kühn, 2023).
2.1 Conceptual model
Most researchers believe that geothermal waters at Waiwera are not of volcanic origin but rather that rainfall percolates downward until heating by background geothermal gradient causes temperature-driven uprising (Auckland Regional Water Board, 1987; Auckland Regional Council, 1999). Vertical migration of the maximum 50 °C warm water is inferred to be facilitated by a fault zone at Waiwera. Radiocarbon dating as part of the field survey presented here confirms that the geothermal fluids have effectively no modern component (age > 20 000 years, fraction modern ≈ 5 %), and this fits with the system being fed by ancient water that has a very slow cycle rate. The long-standing conceptual model for the Waiwera geothermal system (Auckland Regional Water Board, 1987; Auckland Regional Council, 1999) draws on well data along a W–E profile that shows hot water within the basement near Waiwera migrating up an inferred fault near borehole 80 into the reservoir in the permeable Waitemata Group sediments (Auckland Regional Water Board, 1987). The inferred fault throw in this model is speculated to be down to the east with less than 100 m offset (Fig. 2). This conceptual model has been used as a basis for understanding the geothermal resource and has formed a framework for hot water management/allocation plans at Waiwera (Auckland Regional Council, 1999).
2.2 Gravity survey
The gravity survey was undertaken from 12 to 16 March 2023. In total, 106 gravity measurements, usually consisting of three separate readings, were made at 79 stations (Fig. 3). The survey was tied to the New Zealand gravity reference network (Stagpoole et al., 2022). All measurements were made with a Lacoste & Romberg model D-37 gravity meter, which incorporates an electronic feedback system. Multiple repeat readings at stations were made each day to undertake error and drift analysis (Viskovic et al., 2023).
All gravity observations were reduced to anomalies using Gsolve software (McCubbine et al., 2018). Gsolve corrects for tidal effects and gravity meter drift, and a normal least squares method was used to transform relative gravity survey observations to gravity values tied to the ACLU reference gravity station (979 889.845 mGal). The standard error for the entire survey, determined from Gsolve, was 0.012 mGal.

Figure 3Map of the gravity stations in the Waiwera region. The 2023 gravity stations (blue dots) and existing GNS Science regional gravity stations (brown dots) are labelled with Bouguer gravity anomaly values. Boreholes that penetrate to basement depths are shown as white circles. Dashed lines show the location of the two modelling profiles (S–N profile in pink and W–E profile in purple). Coastline and rivers (blue lines), roads (brown lines) and residential areas (grey shading). Map is in NZTM.
The elevation of all gravity observation sites was measured with a Trimble GeoExplorer 6000 GNSS receiver that were post-acquisition processed to a vertical accuracy of ca. 0.1 m. Airborne LiDAR (light detection and ranging) data (vertical accuracy of ca. 0.2 m) were used to determine heights at a few localities with poor satellite coverage due to tree cover. Combining errors for the gravity (from Gsolve) and elevation uncertainty (0.03 mGal) gives an estimated error for the survey of 0.04 mGal.
Table 1Initial parameter of the 3D Waiwera numerical model (after Kühn and Stöfen, 2005).


Figure 4Map of the Bouguer gravity anomalies (0.1 mGal contour interval) at Waiwera, highlighting major features and trends. Crosshatching indicates areas of elevated topography associated with gravity lows. The arrows draw attention to a NNW trend in the contours of Bouguer anomalies. Gravity stations (blue dots), boreholes that penetrate to basement depths (white circles), the coastline and rivers (blue lines), roads (brown lines) and residential areas (grey shading) are also shown. Map is in NZTM.
2.3 Gravity modelling methodology
Gravity modelling of two profiles (Fig. 3) was undertaken using Encom ModelVision Pro, a Microsoft Windows programme with a range of utilities for modelling both gravity and magnetic data. This is a 2.5D modelling programme that allows the orientation and orthogonal dimensions (in and out of the page) of blocks representing basement and sediments to be varied. Forward modelling is an iterative process whereby the block structures and/or densities are altered until a good fit between observed and predicted gravity is produced.
Geological constraints for models were provided by borehole and rock-density measurement data. Boreholes 21 and 80 (Figs. 2 and 3) penetrate to Waipapa group basement greywacke at around 400 m b.m.s.l. (Auckland Regional Council, 1999). These provide locations to pin the thickness of the sedimentary succession in models. The Petlab database (Strong et al., 2016) contains 14 samples of Miocene Waitemata Group sediments from the region. These have an average wet density of 2245 kg m−3 and average dry density of 2080 kg m−3. Models used a density of 2250 kg m−3 for Waitemata Group rocks below sea level and a density of 2150 kg m−3 above sea level, representing rocks that are partially saturated. Basement density in all models was fixed at 2670 kg m−3.
2.4 Numerical process simulation
The most recent geological model of Waiwera integrates the depositional environment, mineralogical composition and stratigraphic structures (Kühn et al., 2022). Numerical simulations based on that model indicated that further revisions are required with support by additional field campaigns to increase the knowledge of the complex reservoir geology (Kempka and Kühn, 2023).
As in the previous study (Kempka and Kühn, 2023, the TRANSPORT Simulation Environment – TRANSPORTSE) was used to carry out the numerical simulations in the present study. TRANSPORTSE is a density-driven flow and transport simulator, considering dispersive, convective and conductive heat as well as advective, diffusive and dispersive species transport (Kempka, 2020).
Based on the existing SHEMAT models discussed by Kühn and Stöfen (2005) and Kempka and Kühn (2023), the TRANSPORTSE model implementation uses the same grid discretisation, boundary conditions, and parameter settings as in the previous models, except for taking into account the 180 m offset of the Waiwera sandstone formation basement in the model's eastern part. The applied flow parameters are compiled in Table 1.

Figure 5Simulated seawater intrusion represented by the 400 mmol L−1 NaCl isochlore (top) and thermal plume originating from the N–S fault system with the 38 °C isotherm (bottom) as well as the observation wells (black lines). The orientation of the x-axis is W–E and the y-axis S–N with increasing numbers.
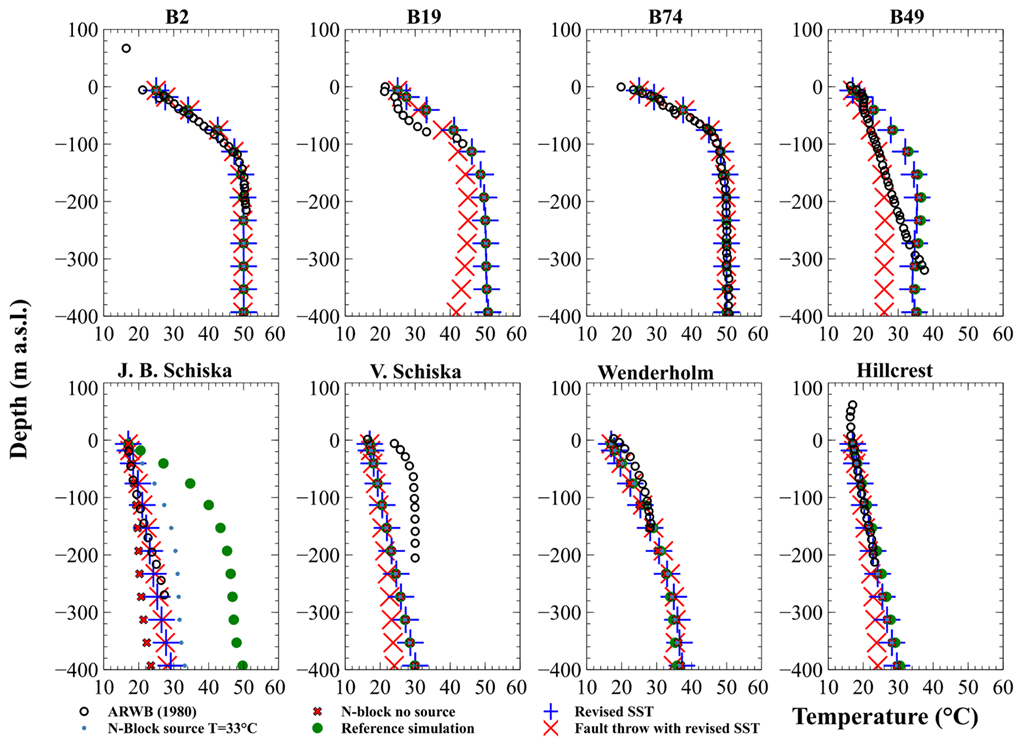
Figure 6Measured and simulated temperature profiles from selected boreholes of the study area. Comparison of observations and simulations for the near- and far-field boreholes (for locations refer to Fig. 5).
A map of contoured Bouguer gravity anomalies at Waiwera (Fig. 4) shows an NNW trend through the township (marked on figure). It is uncertain whether this feature extends NNW across the Waiwera River or SSE into the sea, as there is insufficient data coverage. Gravity lows to the north and south of Waiwera are associated with low density topography.
A subtle gravity low appears at the north-western edge of Waiwera township and extends westward out to sea. This is probably related to low-density ocean beach deposits in the tidal flats and Waiwera River estuary. The easternmost gravity measurements show a trend of decreasing Bouguer gravity, suggesting that the Waitemata Group sediments may thicken offshore before thinning towards Tiritiri Matangi and Kawau Islands, where basement crops out (Edbrooke, 2001).
Coupled fluid flow, heat and transport simulations using the new constraints provided by the gravity indicates that and how the implementation of the basement feature impacts on the fluid flow in the Waiwera geothermal system. Figure 5 shows the simulated seawater isochlore at a concentration of 40 mmol L−1 (panel a) and the resulting thermal plume (panel b). Fluid flow is focussed on the fault zone and the hot water influence is reduced significantly to the west, especially in borehole hole 49 (Fig. 6). Models predict that the fault zone leads to the hotter area to the east.
Figure 6 displays measured temperature profiles compared to the results of different numerical simulations. Here the reference simulation taken from Kühn and Stöfen (2005) is used as a starting point. Farthest away on the model boundaries the wells Hillcrest and Wenderholm show very stable modelled conductive geothermal gradients in coincidence with the logging data. Boreholes number 74 in the centre of the reservoir and number 2 to the Northeast are very well reflected by all simulation scenarios. Significant improvement of the new results compared to the reference case are obvious towards the West of the fault in wells 19 and 49. The focused water flow more to the East results in now cooler areas to the West and clearly a more conductive situation. Still to be further improved are the boreholes towards the North of Waiwera, J.B. Schiska and V. Schiska. For future improvements, it can be envisaged if the extent of the detected NNW–SSW structural feature can be better defined.
In the reports from the Auckland Regional Council (1999), the Auckland Regional Water Board (1987) and from Zemansky (2005), it is suggested that geothermal waters at Waiwera are generated from rainwater percolating downward and heating from the background geothermal gradient. The geothermal system at Waiwera is fed from hot water rising upwards along a fault zone located under the township.
Gravity models show a NNW-trending approximately 180 m step in the basement greywacke, 400 m below the surface. The models provide a good indication of the location and orientation of the step. The location and trend of the step complement past interpretations (Auckland Regional Council, 1999; Zemansky, 2005; Präg et al., 2020; Kühn et al., 2022) and provide new information on the geological structure beneath Waiwera.
Coupled flow, heat and transport simulations with the new geological constraints predict the characteristic cold and hot water distribution in the Waiwera system is mainly driven by the major NNW–SSE fault structure. Simulated and observed temperature profiles show a very good and improved agreement in the near field due to the newly characterised reservoir base. The refined conceptual model further improves overall process quantification. The extent of the fault beyond the Waiwera township is not well constrained and future field campaigns might help to delineate the system further.
The code is available via Kempka (2020, https://doi.org/10.5194/adgeo-54-67-2020). All input data is given within the paper.
For access to the raw data contact the corresponding author.
MK conceptualized the research work and acquired the funding for the field survey. MK and GPDV were responsible for the project administration. GPDV and VS organised and performed the field work. VS and TK did the data analyses and simulation work and provided the figures. MK wrote and finalised the manuscript. VS, GPDV and TK contributed with reviews and editing.
The contact author has declared that none of the authors has any competing interests.
Publisher's note: Copernicus Publications remains neutral with regard to jurisdictional claims made in the text, published maps, institutional affiliations, or any other geographical representation in this paper. While Copernicus Publications makes every effort to include appropriate place names, the final responsibility lies with the authors.
This article is part of the special issue “European Geosciences Union General Assembly 2024, EGU Division Energy, Resources & Environment (ERE)”. It is a result of the EGU General Assembly 2024, Vienna, Austria, 14–19 April 2024.
We appreciate the constructive comments from Viktor Bruckman, Johannes Miocic and Domenico Montanari.
The article processing charges for this open-access publication were covered by the Helmholtz Centre Potsdam – GFZ German Research Centre for Geosciences.
This paper was edited by Viktor J. Bruckman and reviewed by Johannes Miocic and Domenico Montanari.
Auckland Regional Council: Draft Waiwera geothermal groundwater resource assessment report, Auckland (NZ), Auckland Regional Council, 65 pp., Technical publication, no. 115, 1999.
Auckland Regional Water Board: Waiwera thermal groundwater allocation and management plan 1986, Auckland (NZ), Auckland Regional Water Board, 85 pp., AWRB technical publication, no. 39, 1987.
Edbrooke, S. W. (compiler): Geology of the Auckland area [map], Lower Hutt (NZ), Institute of Geological & Nuclear Sciences, 1 map + 74 pp., scale 1 : 250,000, Institute of Geological & Nuclear Sciences 1 : 250,000 geological map, 3, 2001.
Kempka, T.: Verification of a Python-based TRANsport Simulation Environment for density-driven fluid flow and coupled transport of heat and chemical species, Adv. Geosci., 54, 67–77, https://doi.org/10.5194/adgeo-54-67-2020, 2020.
Kempka, T. and Kühn, M.: Numerical simulation of spatial temperature and salinity distribution in the Waiwera geothermal reservoir, New Zealand, Grundwasser, 28, 243–254, https://doi.org/10.1007/s00767-023-00551-8, 2023.
Kühn, M. and Stöfen, H.: A reactive flow model of the geothermal reservoir Waiwera, New Zealand, Hydrogeol. J., 13, 606–626, https://doi.org/10.1007/s10040-004-0377-6, 2005.
Kühn, M., Präg, M., Becker, I., Hilgers, C., Grafe, A., and Kempka, T.: Geographic Information System (GIS) as a basis for the next generation of hydrogeological models to manage the geothermal area Waiwera (New Zealand), Adv. Geosci., 58, 31–39, https://doi.org/10.5194/adgeo-58-31-2022, 2022.
McCubbine, J., Caratori Tontini, F., Stagpoole, V., Smith, E., and O'Brien, G.: Gsolve, a Python computer program with a graphical user interface to reduce relative gravity survey measurements to absolute gravity values and gravity anomalies, SoftwareX, 7, 129–137, https://doi.org/10.1016/j.softx.2018.04.003, 2018.
Präg, M., Becker, I., Hilgers, C., Walter, T. R., and Kühn, M.: Thermal UAS survey of reactivated hot spring activity in Waiwera, New Zealand, Adv. Geosci., 54, 165–171, https://doi.org/10.5194/adgeo-54-165-2020, 2020.
Rose, J. L. and Zemansky, G.: Updated hydrogeological evaluation of the Waiwera geothermal aguifer, Lower Hutt (NZ), GNS Science, 26 pp., Consultancy Report 2013/67, Prepared for Waiwera Geothermal Resort Ltd, Waiwera Water NZ Ltd, 2013.
Stagpoole, V., Caratori Tontini, F., Fukuda, Y., and Woodward, D.: New Zealand gravity reference stations 2020: history and development of the gravity network, New Zeal. J. Geol. Geop., 65, 362–373, https://doi.org/10.1080/00288306.2021.1886120, 2022.
Strong, D. T., Turnbull, R. E., Haubrock, S., and Mortimer, N.: Petlab: New Zealand's national rock catalogue and geoanalytical database, New Zeal. J. Geol. Geop., 59, 475–481, https://doi.org/10.1080/00288306.2016.1157086, 2016.
Viskovic, G. P. D., Stagpoole, V. M., and Morgenstern, U.: Results of microgravity survey and ground water sampling, Waiwera, Auckland, GNS Science Report, 2023/33, 2023.
Weeber, J. H., Brown, L. J., White, P. A., Russell, W. J., and Thorpe, H. R.: A history of groundwater development in New Zealand, in: Groundwaters of New Zealand, edited by: Rosen, M. R. and White, P. A., Wellington (NZ), New Zealand Hydrological Society, 5–44, ISBN 978-0-473-07816-4, 2001.
Zemansky, G.: Hydrogeological evaluation of the Waiwera geothermal aquifer, Lower Hutt (NZ), Institute of Geological & Nuclear Science Limited, 56 pp., Client Report 2005/131, prepared for Waiwera Infinity Limited, 2005.