Articles | Volume 64
https://doi.org/10.5194/adgeo-64-37-2024
07 Nov 2024
 | 07 Nov 2024

Assessment of the evolution of groundwater quality for the state of California, United States using weighted index overlay analysis

Anisha Das, Dolon Banerjee, and Sayantan Ganguly
Abstract

Groundwater serves as a crucial source of drinking water, supports agricultural irrigation, and sustains aquatic ecosystems. However, contamination of groundwater poses significant risks to public health, food security, and ecological balance. Given that groundwater contributes an average of 40 % of California's water supply, ensuring its quality is of paramount importance for the state's municipalities, industries, and agricultural sector. To address this, rigorous groundwater quality assessment and monitoring are imperative to promote sustainable and safe utilization of these resources. Our study leveraged data from the California State Water Resources Control Board (CSWRCB) website, focusing on physiochemical parameters such as total dissolved solids, total hardness, and key cations (e.g., Ca2+, Mg2+, Na+ & K+) and anions (e.g., HCO3-, Cl, SO42- & NO3-). Utilizing the Inverse Distance Weighted (IDW) interpolation method in ArcMap, we generated spatial maps to visualize groundwater quality across California. Furthermore, we applied the Weighted Index Overlay Analysis (WIOA) approach, assigning weights to various physiochemical characteristics based on World Health Organization (WHO) drinking water quality guidelines. Our study aims to facilitate the assessment and monitoring of groundwater contamination in the region, providing valuable insights and formulating a spatial database that can be utilized for effective decision-making and resource management in ArcMap through WIOA analysis.

1 Introduction

Groundwater, a vital natural resource, plays a crucial role in supporting ecological balance, socioeconomic development, and human well-being. Particularly in regions where agriculture dominates, and the environment is semi-arid or arid, maintaining groundwater quality is of supreme importance. Intensive irrigated agriculture often leads to diffused pollution, posing challenges to water quality. Our study focuses on California, USA, a state characterized by complex geology, including diverse mountain ranges, active tectonic activity, and abundant natural resources. Groundwater in California accounts for approximately 30 % of the annual water supply under normal conditions and can increase to 60 % during drought years. Water usage patterns vary across communities, with some relying solely on surface water and others entirely on groundwater. Leveraging Geographic Information Systems (GIS), our assessment aims to evaluate groundwater quality in California and identify areas susceptible to contamination, building upon previous successful studies utilizing similar methodologies (Brindha and Elango; 2012; Balakrishnan et al., 2011; Nagaraju et al., 2016; Matta et al., 2021).

https://adgeo.copernicus.org/articles/64/37/2024/adgeo-64-37-2024-f01

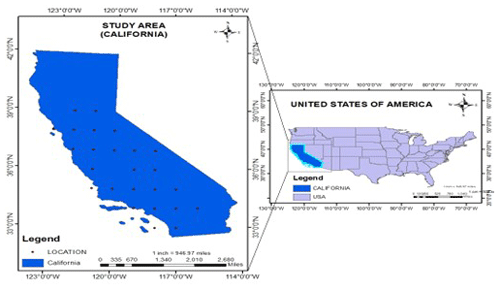
Figure 1The study area of California showing the observation wells.

2 Working Methodology

2.1 Data Acquisition

The dataset utilized in this research was sourced from the California State Water Resources Control Board (CSWRCB), accessible through their official website (https://www.waterboardsca.gov/, last access: 20 April 2024). This dataset encompasses comprehensive hydro-chemical parameters across California, essential for forecasting groundwater quality. The parameters considered include Calcium (Ca2+), Magnesium (Mg2+), Sodium (Na+), Potassium (K+), Chloride (Cl), Bicarbonate Alkalinity (HCO3-), Sulfate (SO42-), Nitrate (NO3-), Total Hardness (TH), and Total Dissolved Solids (TDS). These parameters align with the drinking water standards outlined by the World Health Organization (WHO) in 2011. Figure 1 illustrates the spatial distribution of observation wells contributing to the dataset utilized in this study.

2.2 Water Quality Index (WQI)

The WQI is one of the most reliable techniques for notifying concerned individuals & policymakers about the quality of water (Yisa and Jimoh, 2010). Each parameter is given a weight (wi) that reflects its relative significance to the total drinking water in order to calculate WQI and it can be calculated as:

(1) Relative Weightage , W i = w i 1 n w i

Where, wi is the weight of each parameter and n is the number of parameters. Using the WHO (2011) guidelines, each parameter in each water sample is given a quality rating (qi) based on the division of its concentration by the corresponding standard.

(2) Quality Rating , q i = C i S i

Where, ci is the concentration of each chemical parameter in each water sample (mg L−1) and Si= WHO standard for drinking water for each chemical parameter (mg L−1). The Sub Index (SI) of each chemical parameter is first calculated in order to compute the WQI by Eq. (3). The WQI is then calculated using Eq. (4).

(3)SubIndex,SIi=wi×qi(4)WaterQualityIndex,WQI=inSIi

The weightage assigned to different water quality parameters, their corresponding relative weightages and the WHO (2011) standard values corresponding to them are enumerated in Table S1 of Sect. S1 (Supplement).

2.3 Weighted Index Overlay Analysis

The Weighted Overlay tool applies one of the most widely used overlay analysis techniques to multicriteria problems such as appropriateness models and site selection. A weighted overlay analysis proceeds through each step of the general overlay analysis. In the Weighted Index Overlay Analysis (WIOA) approach, weights are assigned to various categories of distinct physiochemical characteristics based on their significance in preserving groundwater quality. The overall weight distribution is categorized into three classes: excellent, moderate, and poor. These categories correspond to drinking water levels that are (1) below the desired limit, (2) within the desirable limit, and (3) exceeding the desirable limit set by the WHO standards. The weightage assigned to different groundwater parameters considered in this study for WIOA is shown in Table S2 of Sect. S1. The detailed working methodology for this study is represented as a flowchart in Fig. S1 of Sect. S2.

3 Results

The General Hydro-chemistry of the research region was studied to give a statistical summary of the groundwater quality parameters and its comparison with WHO drinking standards. The hydro-chemical analysis of the groundwater quality parameters is shown in Table S3 and the comparison with WHO standards is represented in Table S4 of Sect. S3.

WQI was calculated by using the weightage and relative weightage calculated which is shown in Table S1 of Sect. S1. The variation of calculated average WQI from 1995 to 2023 is shown in Fig. 2. By looking at changing WQI values we see that the water quality is deteriorating over the years in study area.

https://adgeo.copernicus.org/articles/64/37/2024/adgeo-64-37-2024-f02

Figure 2Assessment of WQI values from 1995–2023.

Download

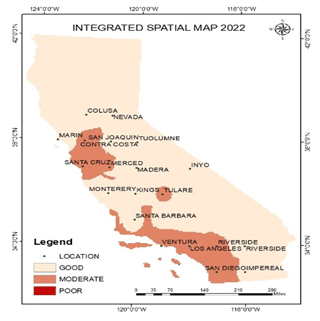
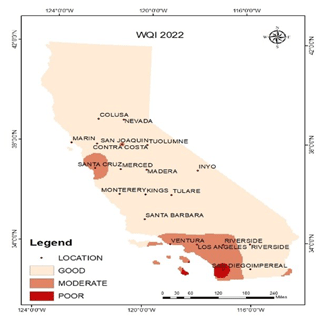
The surface variation maps were utilized to conduct the Weighted Index Overlay Analysis for all groundwater quality parameters (Sect. S4). In the year 2022, out of 201 groundwater samples, 166 exhibited good water quality, with instances of poor groundwater quality observed at minimal areas of the state as shown in Fig. 4. The spatially integrated WIOA map (Fig. 3) illustrates that the majority of the study area falls within the good category, indicating suitability for consumption.

The calculated WQI ranged from 6.45 to 116.86, with 166 samples meeting the criteria for good quality (WQI < 45) and 17 samples indicating poor quality (WQI > 60). These findings suggest that the groundwater in the study area is potable and safe for human consumption.

https://adgeo.copernicus.org/articles/64/37/2024/adgeo-64-37-2024-f03

Figure 3Groundwater Quality Zones Obtained from WIOA.

https://adgeo.copernicus.org/articles/64/37/2024/adgeo-64-37-2024-f04

Figure 4Groundwater Quality Zones Obtained from WQI.

The spatial maps representing WQI values from the year 2009–2023 showing the variability of groundwater quality over the entire study area is summarized in Sect. S5.

4 Conclusions

Hydro-chemical analysis revealed that the concentration of all groundwater quality parameters in the study area is at satisfactory levels. The WIOA indicates that the majority of the study area is categorized as good, signifying its suitability for human consumption. Assessment of groundwater quality using WIOA and Water Quality Index (WQI) methods in ArcMap further confirms that the groundwater in the study area meets the chemical standards for drinking purposes. Moreover, the WQI values reflect good to moderate index values, consistent with the findings of the WIOA analysis. Both methodologies, WIOA and WQI, yield congruent results, affirming the potability of the groundwater in the identified areas.

Data availability

The dataset utilized in this research was sourced from the California State Water Resources Control Board (CSWRCB), accessible through their official website (https://www.waterboards.ca.gov/, Water Boards, 2024, last access: 20 April 2024) and is publicly available.

Supplement

The supplement related to this article is available online at: https://doi.org/10.5194/adgeo-64-37-2024-supplement.

Author contributions

AD: conceptualization, methodology, data curation, writing – original draft, formal analysis, visualization. DB: conceptualization, methodology, formal analysis, writing – review and editing. SG: conceptualization, formal analysis, writing – review and editing, supervision.

Competing interests

The contact author has declared that none of the authors has any competing interests.

Disclaimer

Publisher's note: Copernicus Publications remains neutral with regard to jurisdictional claims made in the text, published maps, institutional affiliations, or any other geographical representation in this paper. While Copernicus Publications makes every effort to include appropriate place names, the final responsibility lies with the authors.

Special issue statement

This article is part of the special issue “Groundwater management in the context of global change: integrating innovative approaches (EGU2024 HS8.2.1 session)”. It is a result of the EGU General Assembly 2024, Vienna, Austria, 14–19 April 2024.

Review statement

This paper was edited by Estanislao Pujades and reviewed by two anonymous referees.

References

Balakrishnan, P., Saleem, A., and Mallikarjun, N. D.: Groundwater quality mapping using geographic information system (GIS): A case study of Gulbarga City, Karnataka, India, Afr. J. Environ. Sci. Technol., 5–12, 1069–1084, https://doi.org/10.5897/AJEST11.134, 2011. 

Brindha, K. and Elango, L.: Groundwater quality zonation in a shallow weathered rock aquifer using GIS, Geo-Spatial Info. Sci., 15, 95–104, https://doi.org/10.1080/10095020.2012.714655, 2012. 

Nagaraju, A., Sreedhar, Y., Thejaswi, A. and Dash, P.: Integrated Approach Using Remote Sensing and GIS for Assessment of Groundwater Quality and Hydrogeomorphology in Certain Parts of Tummalapalle Area, Cuddapah District, Andhra Pradesh, South India, Adv. Remote Sens., 5, 83–92, https://doi.org/10.4236/ars.2016.52007, 2016. 

Matta, G., Kumar, A., Kumar, P., Nayak, A., Kumar, P., Kumar, A., and Tiwari, A.: Evaluation of ground water quality by use of water quality index in the vicinity of the Rajaji National Park Haridwar, Uttarakhand, India. In Geostatistics and Geospatial Technologies for Groundwater Resources in India, Springer International Publishing, https://doi.org/10.1007/978-3-030-62397-5_17, 2021. 

Water Boards: State Water Resources Control Board, https://www.waterboards.ca.gov/ (last access: 20 April 2024), 2024. 

WHO: Guidelines for drinking-water quality FOURTH EDITION WHO library cataloguing-in-publication data guidelines for drinking-water quality, 4th Edn, ISBN 9789241548151, 2011. 

Yisa, J. and Jimoh, T.: Analytical Studies on Water Quality Index of River Landzu, Am. J. Appl. Sci., 7, 453–458, https://doi.org/10.3844/ajassp.2010.453.458, 2010. 

Download
Short summary
As groundwater serves as the principal source of water worldwide, its quality is of paramount importance. In this study, the evolution of groundwater quality in California is assessed using the Water Quality Index & Weighted Index Overlay Analysis methods. Several water quality parameters are considered for the analysis, and the results from both methods are compared. The study shows that in most parts of California, groundwater quality is potable, as per WHO guidelines, except in a few places.