 | 24 Jun 2024
Ground Deformation Monitoring Using InSAR and Meteorological Time Series and Least-Squares Wavelet Software: A Case Study in Catania, Italy
Ebrahim Ghaderpour
Gabriele Scarascia Mugnozza
Simone Mineo
Claudia Meisina
Giovanna Pappalardo
Persistent Scatterers Interferometric Synthetic Aperture Radar (PS-InSAR) is an advanced satellite remote sensing technique which allows an effective monitoring of ground movement. In this work, PS-InSAR time series as well as precipitation and temperature time series in a region in Catania, Italy are utilized during 2018–2022, and their possible interconnections with land subsidence/uplift due to groundwater level change are investigated. First, the potential jumps in the displacement time series are removed, and then the Sequential Turning Point Detection (STPD) is applied to estimate the times when the velocity of the displacement time series changes. The results show a significant correlation between the frequency of turning points in displacement time series and precipitation trend change, particularly during the winter season. Furthermore, the Least-Squares Cross Wavelet Analysis (LSCWA) is applied to estimate the coherency and phase delay between the displacement and weather cycles in the time-frequency domain. The annual cycles of displacement and temperature show more coherency than the ones of displacement and precipitation across the study region. The results presented herein are important for infrastructure and water management planning.
- Article
(2547 KB) - Full-text XML
- BibTeX
- EndNote


Rising and declining precipitation over time can potentially increase and decrease groundwater level, respectively (Jasechko et al., 2024). Excessive groundwater extraction during hot and dry seasons for various purposes, such as agriculture and industry, can result in seawater intrusion, streamflow reduction, and land subsidence (Jasechko et al., 2024). On the other hand, land uplift may be due to rising groundwater level as the result of increase in precipitations and reduction in groundwater pumping (Ghaderpour et al., 2024a). Catania plain, the widest alluvial plain in Sicily, has experienced land subsidence due to natural and anthropogenic causes, such as tectonic and volcanic activity, sediment compaction, fluid withdrawal, and dams (Anzidei et al., 2021). This plain has been studied by many researchers, especially from the structural and hydrogeological points of view (Spampinato et al., 2013; Guastaldi et al., 2014). European Ground Motion Service (EGMS) has recently provided PS-InSAR data derived from Sentinel-1 satellites for ground deformation monitoring across Europe with millimeter precision (Costantini et al., 2021). In the present study, trends, and seasonal components in PS-InSAR time series covering the plain are estimated and their potential interconnection with precipitation and temperature are investigated.
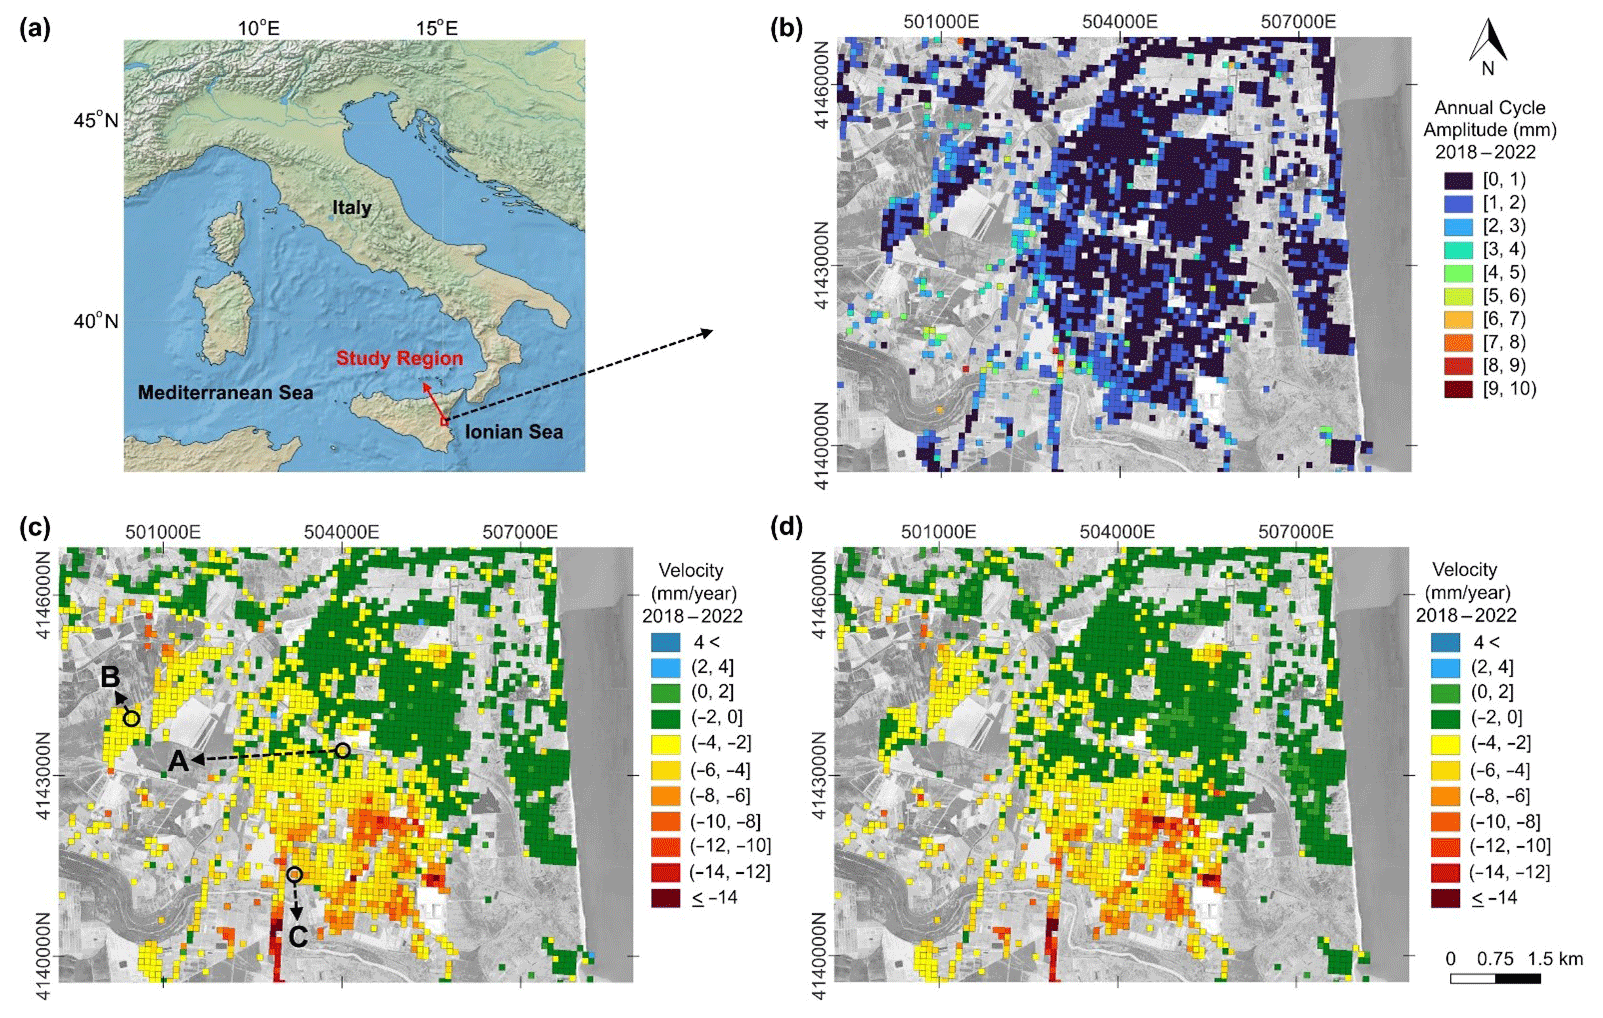
Figure 1(a) Location of the study region, (b) the amplitude map of annual cycles in PS-InSAR vertical time series, (c, d) the velocity maps before and after removing the jump at the end of 2018, respectively. The maps are produced by QGIS (from © Google Maps 2015).
2.1 Study region
The study region is part of Catania plain, located in southeast of Sicily (Italy), Fig. 1. The region includes Catania international airport, industrial areas, villages, and agricultural lands. Improper water management had a negative impact on groundwater in the last decades, resulting in seawater intrusion and aquifers salinization (Guastaldi et al., 2014). The Ionian Sea is on the east side of the region. From a geological point of view, this region is located between Mount Etna and the Hyblean foreland, where alluvial clastic deposits crop out (Lentini, 1982). These deposits mainly lie on a thick sequence of Pleistocene marine marly clays, which are also part of the sedimentary basement of Mount Etna.
2.2 Datasets
The vertical displacement time series with a sampling rate of 6 d for period 2018–2022 and at a spatial resolution of 100 m from the EGMS Level 3 Ortho Product (https://egms.land.copernicus.eu/, last access: 20 March 2024) are utilized herein, derived from ascending and descending PS-InSAR time series and information of Global Navigation Satellite Systems (GNSS). The daily precipitation and temperature time series at Fontarossa, near the center of the study region, are downloaded from https://www.3bmeteo.com/ (last access: 20 March 2024). For visualization purposes, the temperature (average) and precipitation (cumulative) time series are resampled to 6 d intervals to match the sampling rate of displacement time series. For the STPD and frequency bar chart, the displacement time series are monthly resampled using the spline interpolation method, and monthly accumulated precipitation time series are also calculated (Ghaderpour et al., 2024a, b).
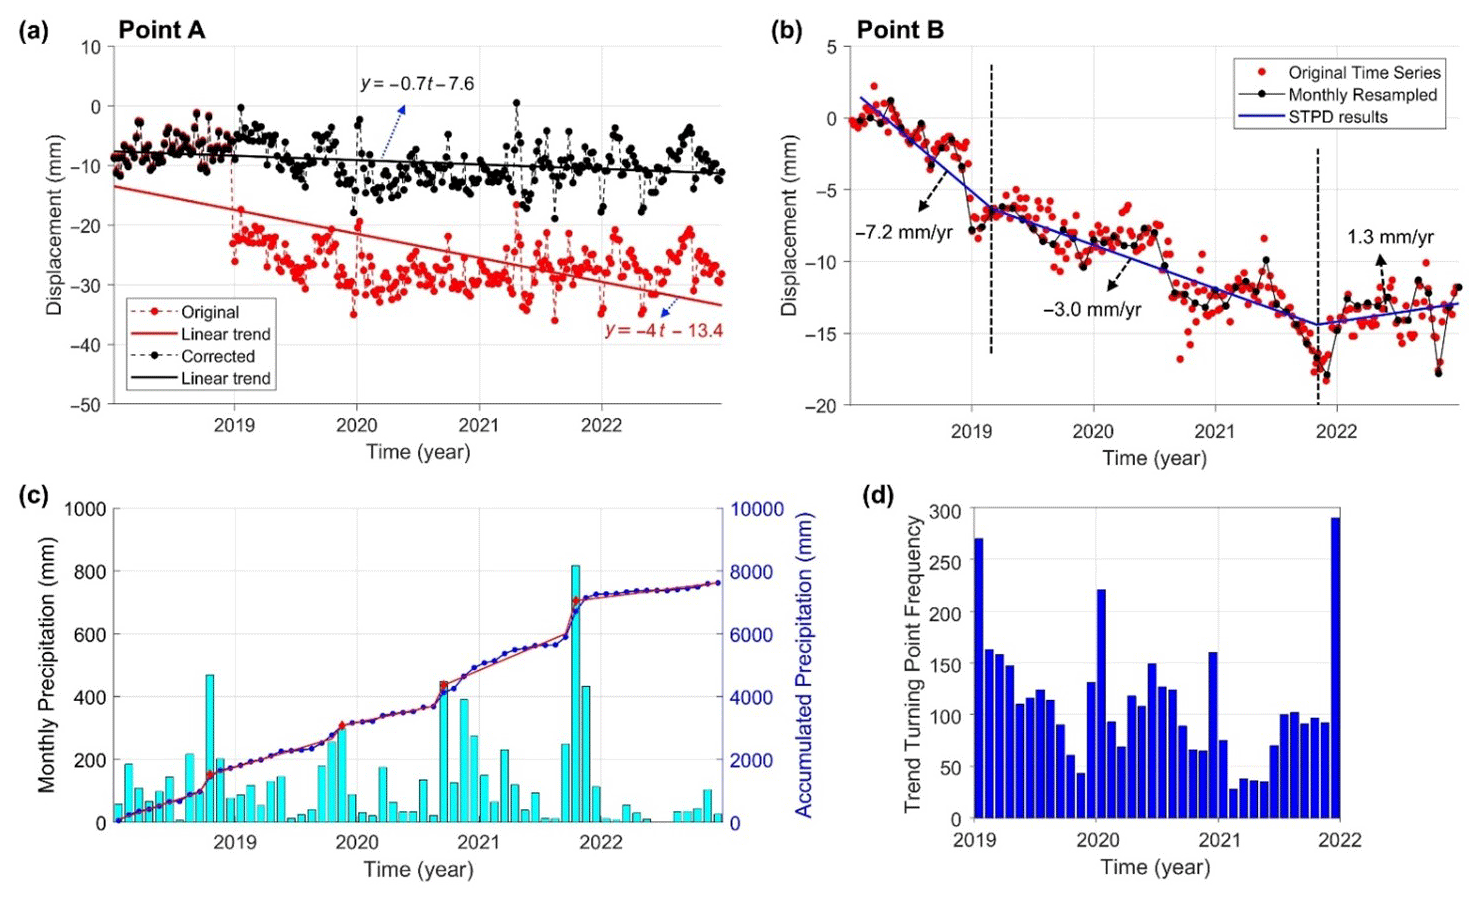
Figure 2(a) Velocity of a time series before and after jump removal, (b) STPD result of a time series showing two TPs, (c) JUST result of precipitation showing 4 significant changes, (d) frequency bar chart for the set of all the time series whose locations are shown in Fig. 1. Note that the original and corrected segments before 2019 are the same in panel (a).
2.3 Methods
2.3.1 Jumps Upon Spectrum and Trend (JUST)
JUST is a robust method of detecting abrupt changes (jumps) in the time series. Its special case, implemented herein, uses the Ordinary Least-Squares (OLS) by a sequential least-squares fitting of a linear trend with two pieces within a translating window (Ghaderpour, 2021b).
2.3.2 Sequential Turning Point Detection (STPD)
STPD is developed for detecting trend Turning Points (TPs) in a time series. A TP is the location where the gradient of connected linear pieces, fitting the time series, changes with the assumption that no significant abrupt change exists. STPD is like the special case of JUST, but a linear trend with two connected pieces is sequentially fitted to the time series segments. Like JUST, the criterion for selecting a potential TP is minimizing the residual norm (Ghaderpour et al., 2024b).
2.3.3 Least-Squares Cross Wavelet Analysis (LSCWA)
LSCWA decomposes time series into the time-frequency domain to estimate a cross-spectrogram (Ghaderpour et al., 2018). A spectrogram for each time series is estimated by fitting trend and sinusoidal functions to each segment within a translating window whose size is inversely proportional to frequency. Two spectrograms for the two time series are then cross-multiplied to obtain a cross-spectrogram which shows how much the periodic/aperiodic cycles of the two time series are coherent. LSCWA also provides phase delay information for cyclic components of the time series. The phase delay is usually depicted by white arrows on the cross-spectrograms, following the trigonometric principle. LSCWA is a tool in the LSWAVE software (Ghaderpour and Pagiatakis, 2019).
3.1 Velocity Estimation Before and After Jump Removal
From implementing JUST, it is found that there is a jump with a significant magnitude at the end of 2018 for many of the time series across the region, likely due to the earthquake occurred on 26 December 2018 (Alparone et al., 2022). Panels (c) and (d) in Fig. 1 respectively show the velocity maps before and after correcting the jump at the end of 2018, where the results of Point A are illustrated in Fig. 2a. This highlights the criticality of properly detecting and removing jumps before velocity estimation.
3.2 Turning Points and Jumps
Those time series with a significant jump at the end of 2018 are first corrected, then STPD is applied to all monthly resampled time series, including the corrected ones. An example of a time series with two TPs is depicted in Fig. 2b, where Point B is highlighted in Fig. 1c. Figure 2d shows the frequency bar chart of TPs for all the time series across the study region, where each bar shows the number of all the estimated TPs at a given calendar month. Due to extreme precipitation events, the accumulated precipitation time series exhibits significant jumps, so JUST is applied to estimate the dates when the precipitation trend has changed, considering the jumps (Fig. 2c). Note that the red points in Fig. 2c show the jumps (not TPs) in the accumulated time series due to extreme precipitation events, allowing the linear trend pieces to fit better the segments.
3.3 LSCWA
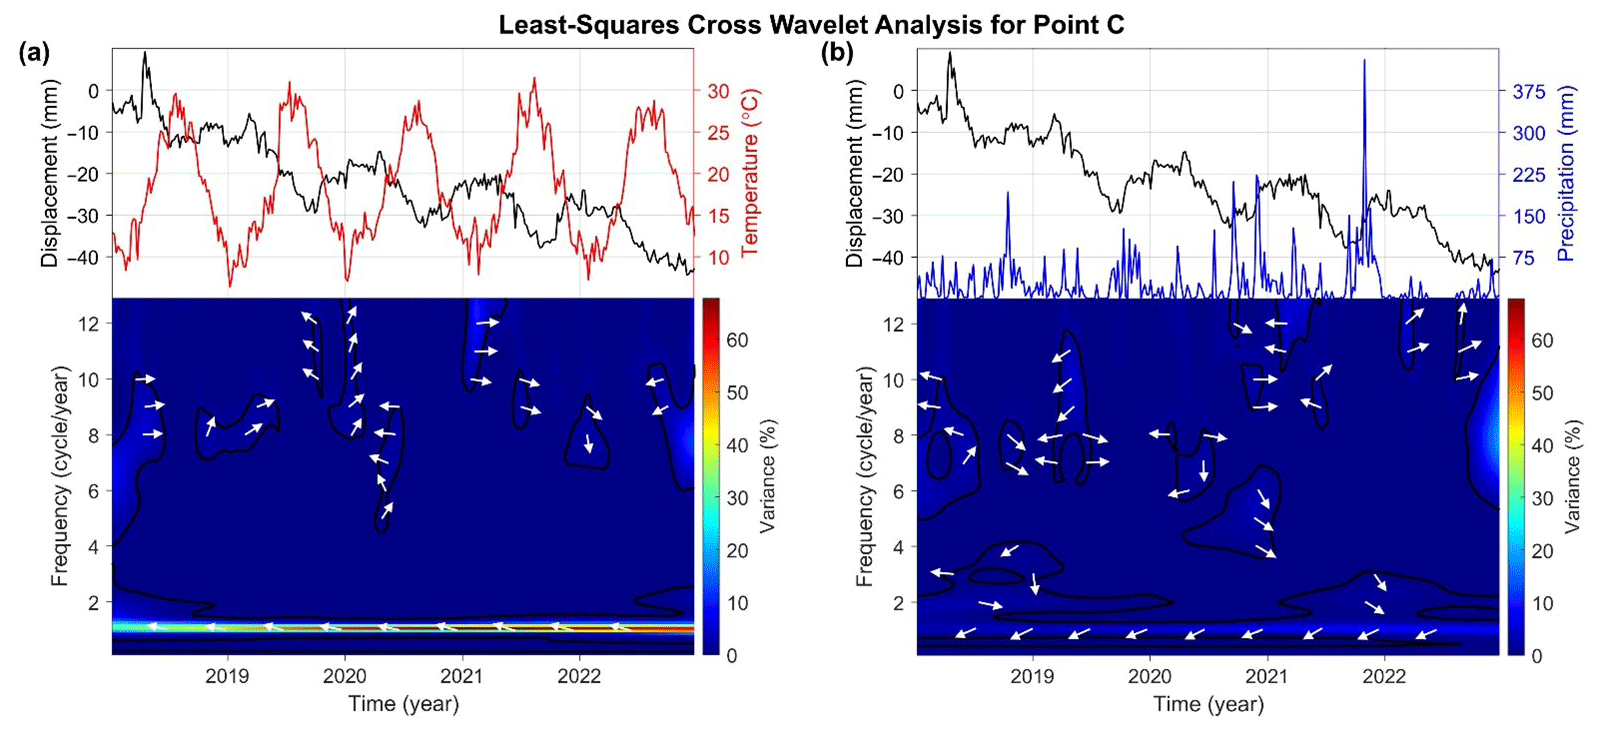
Figure 1b shows the amplitude map of annual cycles in the displacement time series, estimated by the least-squares spectral analysis (Ghaderpour, 2021b). LSCWA is then applied to the displacement and weather time series to further investigate the potential cause of annual and seasonal cycles in the displacement time series within the study region. One time series example corresponding to Point C in Fig. 1c is demonstrated in Fig. 3. The annual cycles in the displacement and temperature time series are relatively much more coherent than the ones in the displacement and precipitation time series across the study region, particularly for the reddish areas in Fig. 1b and Point C shown here; see the reddish horizontal peaks at 1 cycle/year in Fig. 3a and compare it with Fig. 3b. In Fig. 3, arrows pointing to the east and west indicate in-phase and out-of-phase, respectively. Arrows pointing to the north and south mean the weather cycle lag and lead the displacement cycle, respectively. Spectral peaks inside the black contour lines are statistically significant at 95 % confidence level.
Herein, ground deformation in Catania plain is studied using the tools in LSWAVE software applied to EGMS and weather data. From Fig. 2d, relatively higher numbers of TPs are observed during the winter. Many of these TPs have a positive direction, meaning that the subsidence rate has been decreased and in some cases land uplift is even observed. Interestingly, the jumps detected during the fall season, as shown in Fig. 2c, indicate that heavy precipitation could have played a role in the land uplift, although this aspect deserves further investigation focused on the hydrogeological setting of the study area. Moreover, tectonic dynamics must be considered since literature reports the presence of fault segments crossing the region (Ferrara and Pappalardo, 2004). The annual cycle of the displacement time series was almost out-of-phase with the annual cycles of temperature and precipitation in some areas, including the Centrale Elettrica Solare. This may be interpreted as relatively more land subsidence during the hot season and more land uplift during the cool season. This may also be partially due to thermal expansion and contraction of metal structures and solar power systems (Ghaderpour, 2021a). Moreover, the delay of about five months between annual cycles of precipitation and displacement time series could be due either to a delay between surface water and groundwater interaction, or to the groundwater travel time between the infiltration point and the aquifer existing within the study area. Land cover response to climate change could also be another contributing factor to the seasonal cycles of displacement time series as sensed from space (Ghaderpour et al., 2023). Historical groundwater level data for Catania plain are limited, but their analyses and correlation with climate and ground deformation are subjects to future studies.
The software is publicly available online at https://github.com/Ghaderpour/LSWAVE-SignalProcessing (Ghaderpour, 2021; Ghaderpour and Pagiatakis, 2019).
The Sentinel-1 based PS-InSAR time series utilized in this study are publicly available at https://doi.org/10.2909/943e9cbb-f8ef-4378-966c-63eb761016a9 (European Environment Agency, 2023). The weather data are also available at https://3bmeteo.com (3BMeteo S.r.l, 2024).
Conceptualization and interpretation of results: EG, GSM, SM, CM, GP; Formal Analysis & software: EG; Writing – original draft preparation: EG, Writing – review and editing: GSM, SM, CM, GP; All authors have read and agreed to the published version of the manuscript.
The contact author has declared that none of the authors has any competing interests.
Publisher’s note: Copernicus Publications remains neutral with regard to jurisdictional claims made in the text, published maps, institutional affiliations, or any other geographical representation in this paper. While Copernicus Publications makes every effort to include appropriate place names, the final responsibility lies with the authors.
This article is part of the special issue “Groundwater management in the context of global change: integrating innovative approaches (EGU2024 HS8.2.1 session)”. It is a result of the EGU General Assembly 2024, Vienna, Austria, 14–19 April 2024.
This research was partially supported by “Progetto dipartimentale” of the Department of Earth Sciences at Sapienza University of Rome. The authors thank EGMS for the PS-InSAR time series and 3bmeteo for the weather data utilized in this research.
This research was supported by “Progetto dipartimentale” of the Department of Earth Sciences and CERI Research Centre at Sapienza University of Rome.
This paper was edited by Estanislao Pujades and reviewed by two anonymous referees.
3BMeteo S.r.l.: Italian weather forecast, https://www.3bmeteo.com/meteo/, last access: 20 March 2024.
Alparone, S., Bonforte, A., Gambino, S., Grassi, S., Guglielmino, F., Latino, F., Morreale, G., Patti, G., Privitera, L., Obrizzo, F., Ursino, A., and Impoas, S.: Characterization of an Active Fault through a Multiparametric Investigation: The Trecastagni Fault and Its Relationship with the Dynamics of Mt. Etna Volcano (Sicily, Italy), Remote Sens., 14, 4760, https://doi.org/10.3390/rs14194760, 2022.
Anzidei, M., Scicchitano, G., Scardino, G., Bignami, C., Tolomei, C., Vecchio, A., Serpelloni, E., De Santis, V., Monaco, C., Milella, M., Piscitelli, A., and Mastronuzzi, G.: Relative sea-level rise scenario for 2100 along the coast of south eastern Sicily (Italy) by InSAR data, satellite images and high-resolution topography, Remote Sens., 13, 1108, https://doi.org/10.3390/rs13061108, 2021.
Costantini, M., Minati, F., Trillo, F., Ferretti, A., Novali, F., Passera, E., Dehls, J., Larsen, Y., Marinkovic, P., Eineder, M., Brcic, R., Siegmund, R., Kotzerke, P., Probeck, M., Kenyeres, A., Proietti, S., Solari, L., and Andersen, H. S.: European Ground Motion Service (EGMS), 2021 IEEE International Geoscience and Remote Sensing Symposium IGARSS, Brussels, Belgium, 3293–3296, https://doi.org/10.1109/IGARSS47720.2021.9553562, 2021.
European Environment Agency: European Ground Motion Service: Ortho – Vertical Component 2018–2022 (vector), Europe, EEA Geospatial Data Catalogue [data set], https://doi.org/10.2909/943e9cbb-f8ef-4378-966c-63eb761016a9, 2023.
Ferrara, V. and Pappalardo, G.: Intensive exploitation effects on alluvial aquifer of the Catania plain, eastern Sicily, Italy, Geofis. Int., 43, 671–681, https://doi.org/10.22201/igeof.00167169p.2004.43.4.854, 2004.
Ghaderpour, E.: Least-squares wavelet and cross-wavelet analyses of VLBI baseline length and temperature time series: Fortaleza-Hartrao-Westford-Wettzell, Publ. Astron. Soc. Pac., 133, 1019, https://doi.org/10.1088/1538-3873/abcc4e, 2021a.
Ghaderpour, E.: JUST: MATLAB and Python software for change detection and time series analysis, GPS Solut., 25, 85, https://doi.org/10.1007/s10291-021-01118-x, 2021b.
Ghaderpour, E. and Pagiatakis, S. D.: LSWAVE: A MATLAB software for the least-squares wavelet and cross-wavelet analyses, GPS Solut., 23, 50, https://doi.org/10.1007/s10291-019-0841-3, 2019.
Ghaderpour, E., Ince, E. S., and Pagiatakis, S. D.: Least-squares cross-wavelet analysis and its applications in geophysical time series, J. Geod., 92, 1223–1236, https://doi.org/10.1007/s00190-018-1156-9, 2018.
Ghaderpour, E., Mazzanti, P., Scarascia Mugnozza, G., and Bozzano, F.: Coherency and phase delay analyses between land cover and climate across Italy via the least-squares wavelet software, Int. J. Appl. Earth Obs. Geoinf., 118, 103241, https://doi.org/10.1016/j.jag.2023.103241, 2023.
Ghaderpour, E., Mazzanti, P., Bozzano, F., and Scarascia Mugnozza, G.: Ground deformation monitoring via PS-InSAR time series: An industrial zone in Sacco River Valley, central Italy, Remote Sens. Appl. Soc. Environ., 34, 101191, https://doi.org/10.1016/j.rsase.2024.101191, 2024a.
Ghaderpour, E., Antonielli, B., Bozzano, F., Scarascia Mugnozza, G., and Mazzanti, P.: A fast and robust method for detecting trend turning points in InSAR displacement time series, Comput. Geosci., 185, 105546, https://doi.org/10.1016/j.cageo.2024.105546, 2024b.
Guastaldi, E., Carloni, A., Pappalardo, G., and Nevini, J.: Geostatistical Methods for Lithological Aquifer Characterization and Groundwater Flow Modeling of the Catania Plain Quaternary Aquifer (Italy), J. Water Resource Prot., 6, 272–296, https://doi.org/10.4236/jwarp.2014.64032, 2014.
Jasechko, S., Seybold, H., Perrone, D., Fan, Y., Shamsudduha, M., Taylor, R. G., Fallatah, O., and Kirchner, J. W.: Rapid groundwater decline and some cases of recovery in aquifers globally, Nature, 625, 715–721, https://doi.org/10.1038/s41586-023-06879-8, 2024.
Lentini, F.: The Geology of the Mt. Etna Basement, in: Mount Etna Volcano, a Review of Recent Earth Sciences Studies, edited by: Romano, R., Mem. Soc. Geol. Ital., 23, 7–25, 1982.
Spampinato, C. R., Braitenberg, C., Monaco, C., and Scicchitano, G.: Analysis of vertical movements in eastern Sicily and southern Calabria (Italy) through geodetic leveling data, J. Geodyn., 66, 1–12, https://doi.org/10.1016/j.jog.2012.12.002, 2013.