 | 30 Jan 2024
Multi-salinity core flooding study in clay-bearing sandstones, a contribution to geothermal reservoir characterisation
Daniela Navarro-Perez
Quentin Fisher
Samuel Allshorn
Carlos Grattoni
Piroska Lorinczi
Porosity and permeability measurements aid the characterisation of geothermal reservoirs as they improve understanding of the impact of rock–fluid interactions during the life cycle of wells. Core flooding experiments can help us comprehend the rock–brine electrochemical system as critical parameters like salinity, pH, temperature, or pressure change. If the clay mineral content is significant it can reduce permeability and porosity since these particles can block the pore throat network connectivity through clay migration or swelling.
A multi-salinity experiment was conducted in three tight clay-bearing (kaolinite, chlorite, and glauconite) sandstones to study the impact of clay on their petrophysical properties. The experiment consisted of core-flooding brines with salinities of 75 000–200 000 and 0–50 000 ppm NaCl at very low flow rates. Electrical resistivity, the differential pressure across the sample, outlet brine electrical conductivity, and brine permeability were measured. Pore size distribution was acquired by measuring nuclear magnetic resonance (NMR) T2 relaxation time. Cation-exchange capacity (CEC) was derived using the Waxman and Smits (1968) approach.
The derived CECs were 71.5, 4.7, and 3.6 meq per 100 g for the kaolinite, chlorite, and glauconite sandstones, respectively. Kaolinite was the least water-sensitive as its permeability decreased uniformly. Chlorite and glauconite were more water-sensitive as in the low salinity range; their permeability increased, and both displayed a bimodal NMR T2 distribution and pore size rearrangement towards the mesoporosity and macroporosity range, indicating that the cation-exchange site prevailed within the pore space. This investigation highlights the importance of ensuring that appropriate fluid chemistry is used on brines flowing in clay-bearing geothermal reservoirs.
- Article
(2554 KB) - Full-text XML
- BibTeX
- EndNote


Permeability and porosity are crucial parameters in assessing water transmissibility within geothermal reservoirs. Hence, it is necessary to understand the rock–brine interactions within the management of the reservoir life cycle to prevent formation damage (Chicco et al., 2019; Zhang et al., 2021; Luo et al., 2023). Uncertainty increases for complex rock formations such as tight rocks (i.e. permeability <1 mD), which often contain significant quantities of clay minerals that may react with the ionic species in water during the hydraulic fracturing used in enhanced geothermal systems (Li et al., 2022; Iranfar et al., 2023). Clay swelling or migration can cause formation damage depending on the clay mineral types, the clay volume, and the chemistry of the fluid (Carcione et al., 2019; Elnaggar et al., 2023; Risha et al., 2023). The clay swelling phenomenon has long been studied for permeability impairment by core-flooding brine such as NaCl or KCl (e.g. Baptist and Sweeny, 1954; Jones, 1964; Bush and Jenkins, 1970; Khilar and Fogler, 1983; Lever and Dawe, 1987; Cobos and Søgaard, 2020; Ines et al., 2023; Liu et al., 2023).
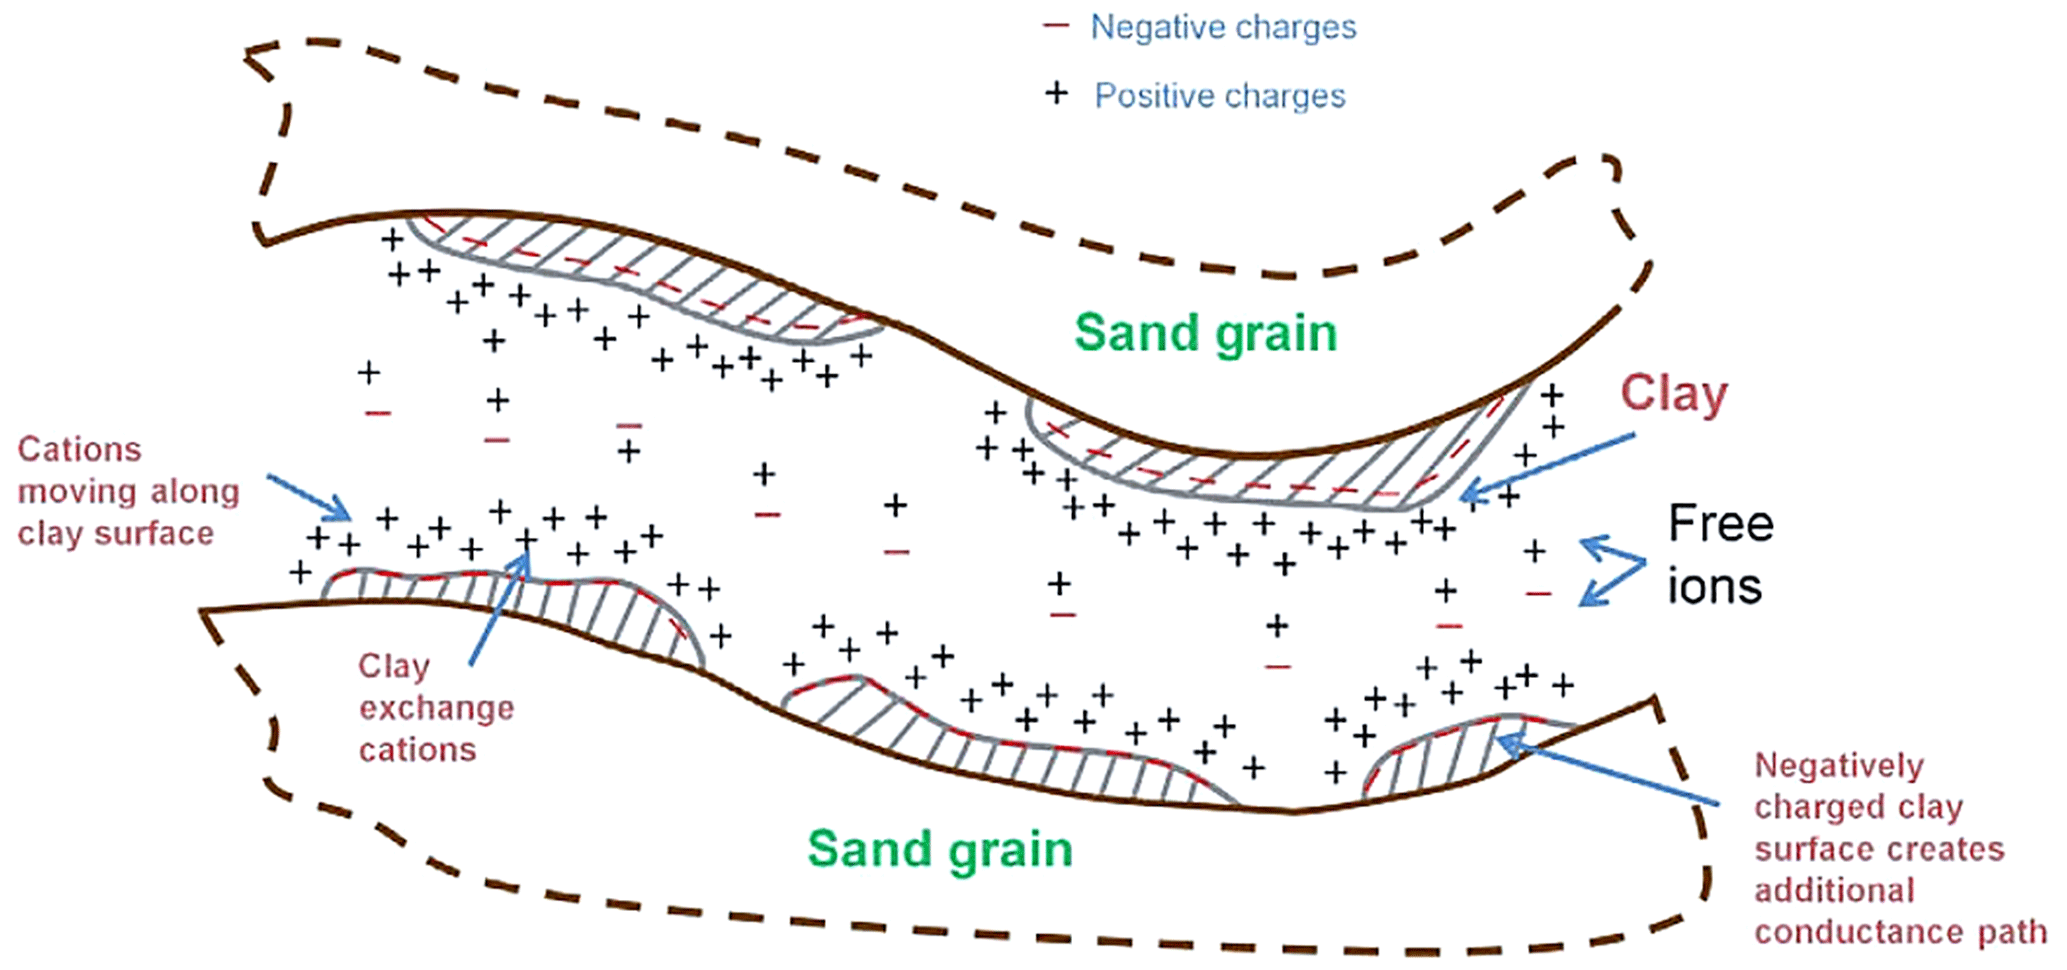
Figure 1Pore and clay ion mobility in a sandstone pore throat with clay minerals in the pore wall (McPhee et al., 2015).
Clay minerals possess the ability to exchange cations with the brine. The clay mineral basal surface is negatively charged and attracts cations of the same or lower valency within the brine, enabling cation-exchange sites to form (Fig. 1). Cation-exchange sites create an additional electrical current path increasing the rock's electrical conductivity (or decreasing electrical resistivity). Authors such as Waxman and Smits (1968), Rink and Schopper (1974), and Clavier et al. (1984) explain this phenomenon as a double-layer model for the ions that move freely within the bulk rock pore throats (diffuse cloud layer) and those trapped within the bound water in contact with the clayey surface (Stern layer). These authors added a clay term in their water saturation models and resistivity to include the electrical contribution of clay minerals.
Table 1Clay mineral groups' cation-exchange capacity range values (Patchett et al., 1993; McPhee et al., 2015).
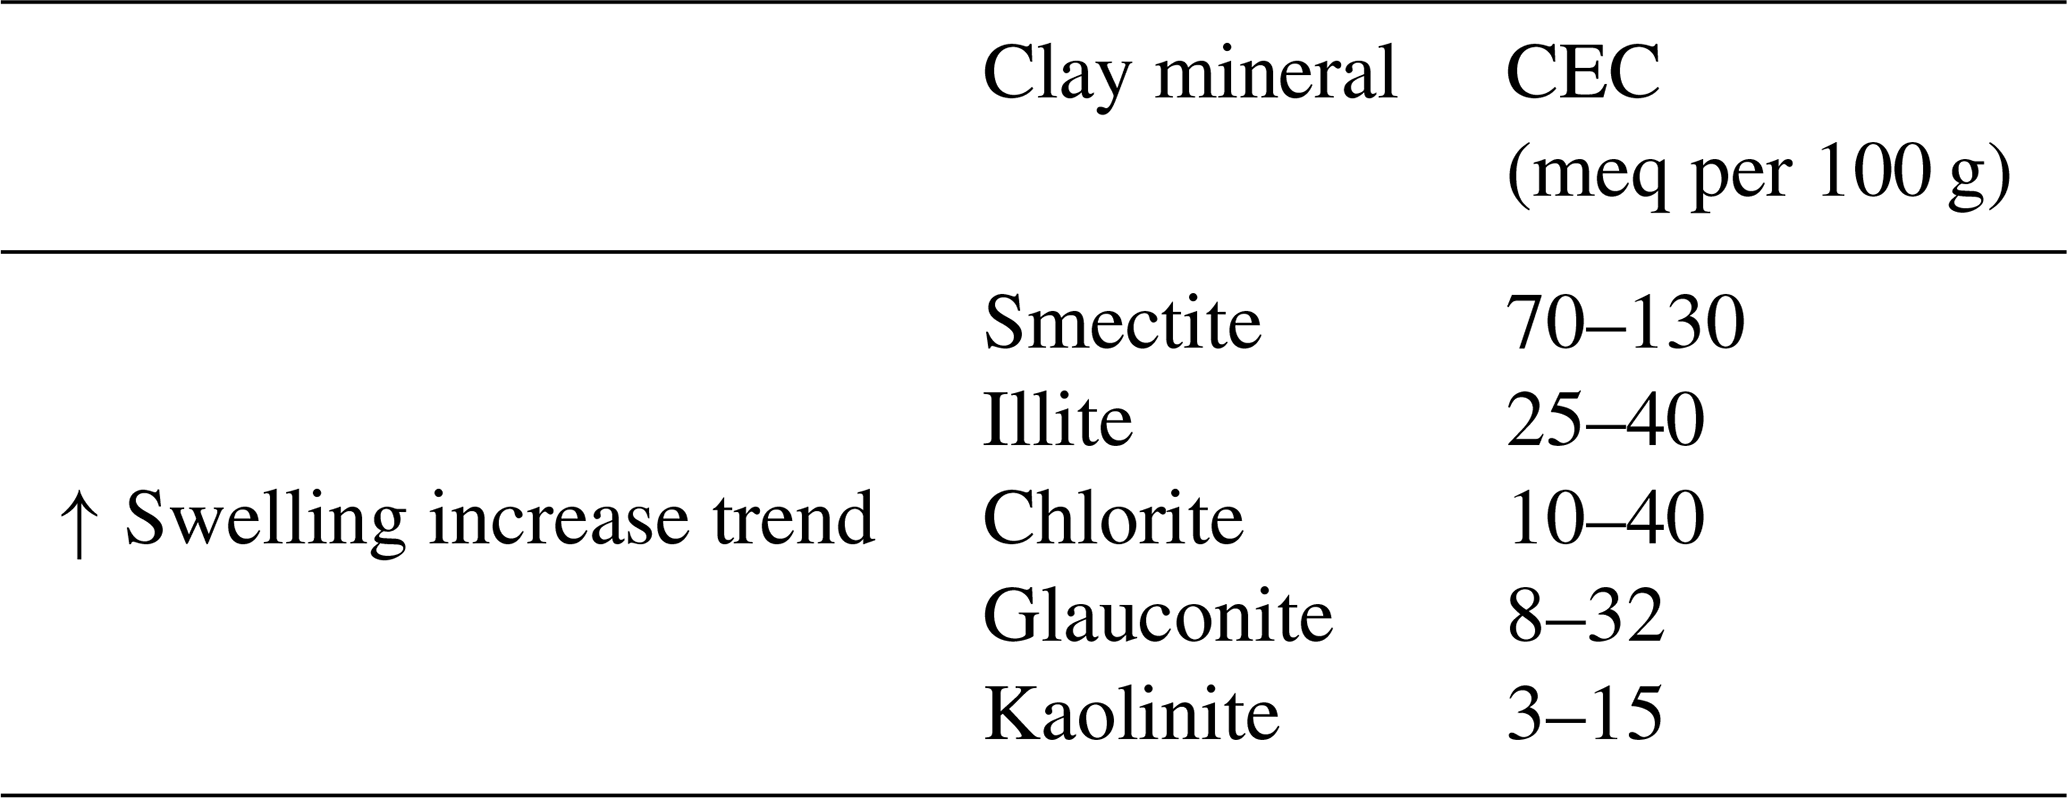
This electrochemical interaction is expressed as the cation-exchange capacity, which indicates the concentrations of exchangeable cations in milli-equivalents relative to mass as CEC (meq per 100 g) or volume as Qv (meq mL−1) (Allaby, 2019). Table 1 shows the range values of four clay minerals groups; their magnitude is directly proportional to their swelling capacity. The smectite group has the highest degree to interchange cations and swell since smectite forms expandable interlayers with water molecules or cations, allowing hydration and crystal lattice expandability. Montmorillonite – from the smectite group – has the strongest swelling capacity, followed by the mixed clays illite–smectite or mica–smectite, then chlorite and illite. In contrast, kaolinite has a lower swelling capacity since it does not have an interlayer in its structure (Tao et al., 2019).
Here, we investigate the impact of clay on rock electrical conductivity, CEC, and pore size distribution. Three tight clay-bearing sandstone samples of significant clay portions (15 % –37 % ) were tested through a core flooding experiment. Following Waxman and Smits's (1968) model, a multi-salinity test was conducted in the high and low salinity range, including deionised water. The novelty of this paper consists mainly of improving the understanding of the impact of brine salinity controls on resistivity and formation damage in geothermal reservoirs.
2.1 Multi-salinity experiment based on the Waxman and Smits (1968) model
Shaly water saturation models are mainly used to estimate the water saturation distribution in clayey sandstone formations (or shale), including the electrical contribution of the clay minerals present in the rock. The Waxman and Smits (1968) model is based on the ionic double layer that explicitly contains the cation-exchange capacity parameter volumetrically. Equation (1) shows partially saturated formations, while Eq. (2) shows fully saturated formations. Equation (3) shows the conversion from the volumetric cation-exchange capacity, Qv, to mass, CEC.
Ct is the true rock electrical conductivity (S m−1), Cw is the water electrical conductivity (S m−1), F∗ is the apparent formation factor, Sw is water saturation (), B is the equivalent conductance of clay (mho mL (meq m)−1), and Qv is the cation-exchange capacity per unit pore volume (meq mL−1).
CEC is the cation-exchange capacity per dry clay (meq per 100 g), ϕt is total core porosity (), and ρg is grain density (g mL−1).
The Juhasz (1981) correlation was used to estimate the cation-exchange mobility, B, via the following equation:
where Rw is the water electrical resistivity (Ω m) and T is the corresponding laboratory or formation temperature (∘C).
The multi-salinity experiment involves measuring the rock electrical conductivity (Co) of a fully brine-saturated rock with a range of salinities (Cw) at steady-state conditions of constant (i) very low flow rate (<0.1 mL min−1), (ii) temperature, and (iii) confined pressure. Co and Cw data points are plotted, and the empirical Waxman–Smits parameters are estimated by applying a linear correlation. The intercept obtained is , and so the CEC is derived (Fig. 2).
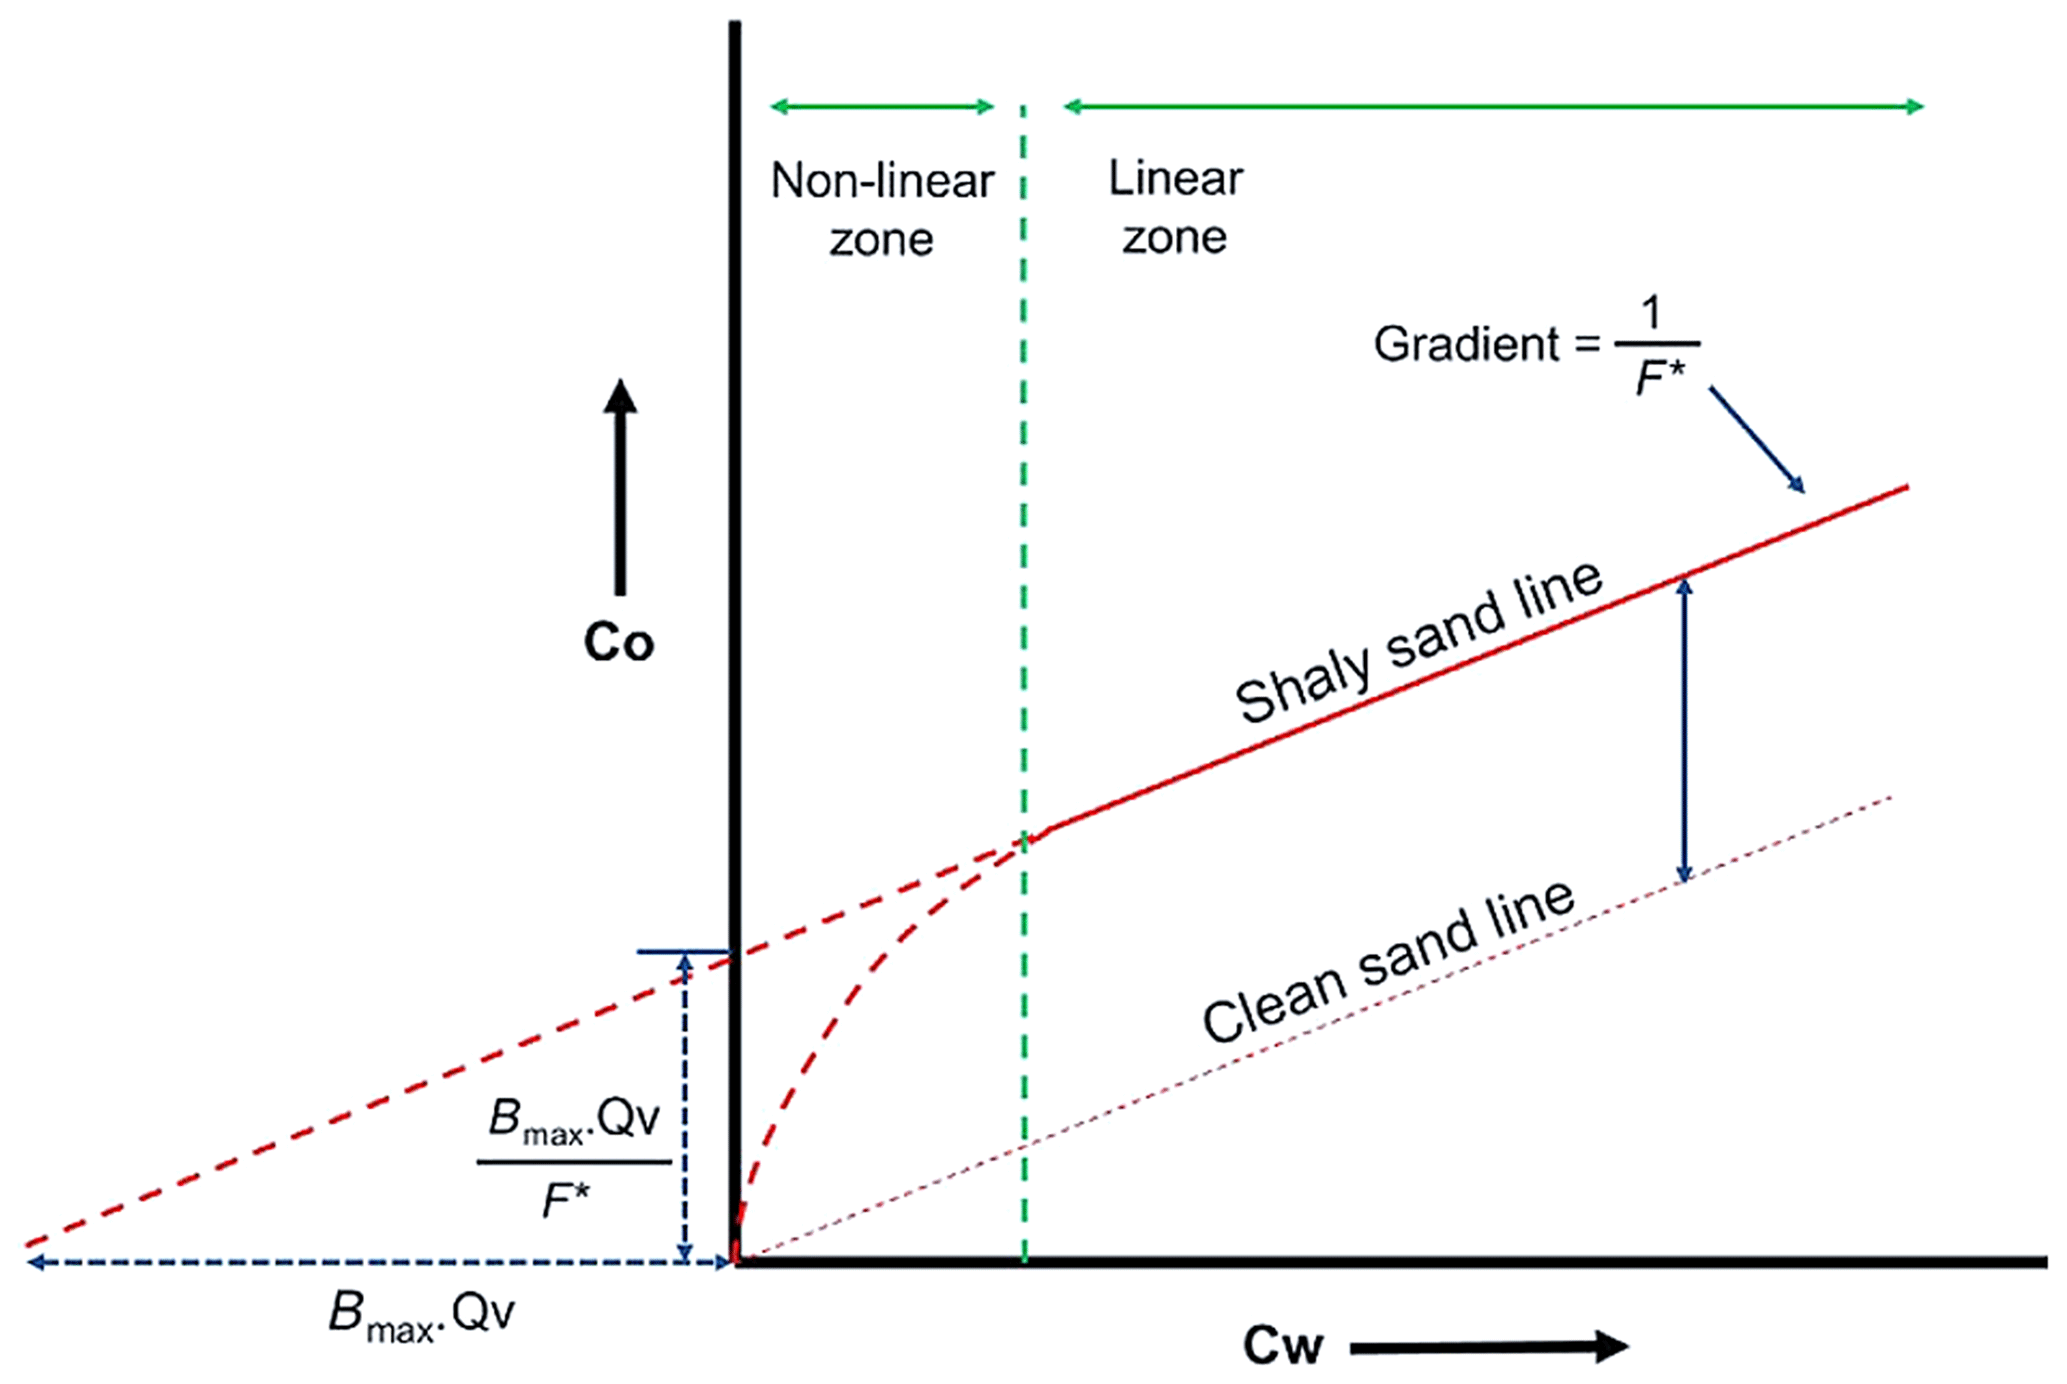
Figure 2Determination of volumetric cation-exchange capacity (Qv) from a multi-salinity experiment: Co is the fully saturated rock conductivity, Cw is the brine–water conductivity, F∗ is the apparent formation factor, and Bmax is the maximum equivalent conductance of clay (after Worthington, 1985).
Note that the electrical conductivity is the inverse of electrical resistivity. Thus, , , and . Hereinafter, when referring to conductivity, resistance, or resistivity in the text, it implicitly includes “electrical” as an adjective.
Table 2Core plug data.
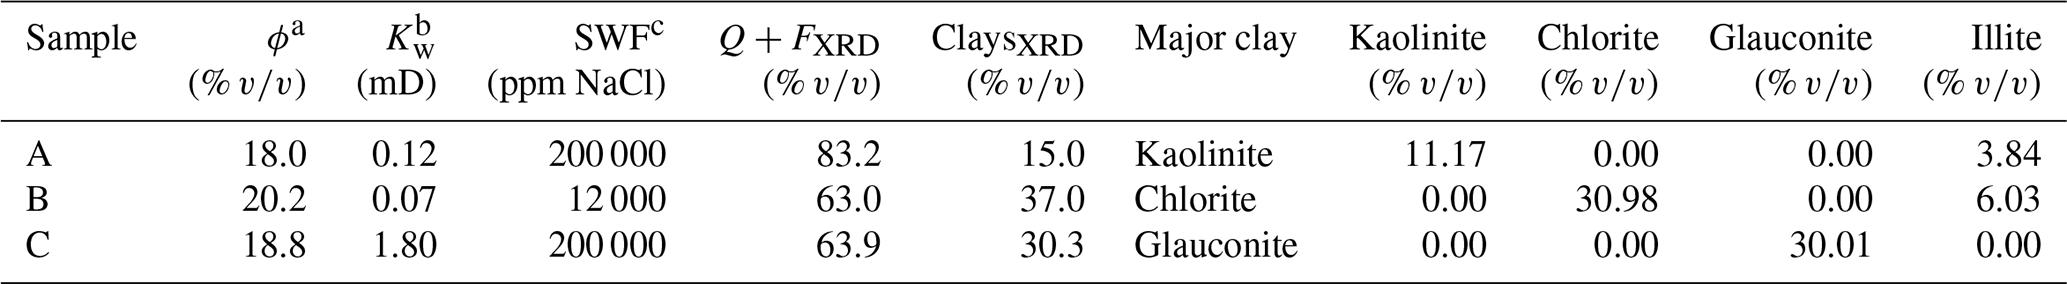
a Ambient helium porosity. b Brine permeability measured at a confining pressure of 10.34 MPa (1500 psi) and SWF. c SWF: synthetic water formation.
2.2 Sampling and experimental setup
Three samples from tight clay-bearing sandstone reservoirs were selected for this study (Table 2). Sample A is a kaolinite sandstone located at a depth of 3209 m and a temperature of 111 ∘C. Sample B is a chloritic greensand located at a depth of 2157 m and temperature of 93 ∘C. Sample C is a glauconitic greensand located at a depth of 3448 m and temperature of 98 ∘C. Sodium chloride was the selected brine with a pH of 7. The cores flooded in a high- and low-salinity brine range in decreasing concentration from 75 000–200 000 and 0–50 000 ppm NaCl, respectively. Sample B was only core-flooded in the low-salinity brine since its synthetic formation water is fresh water.
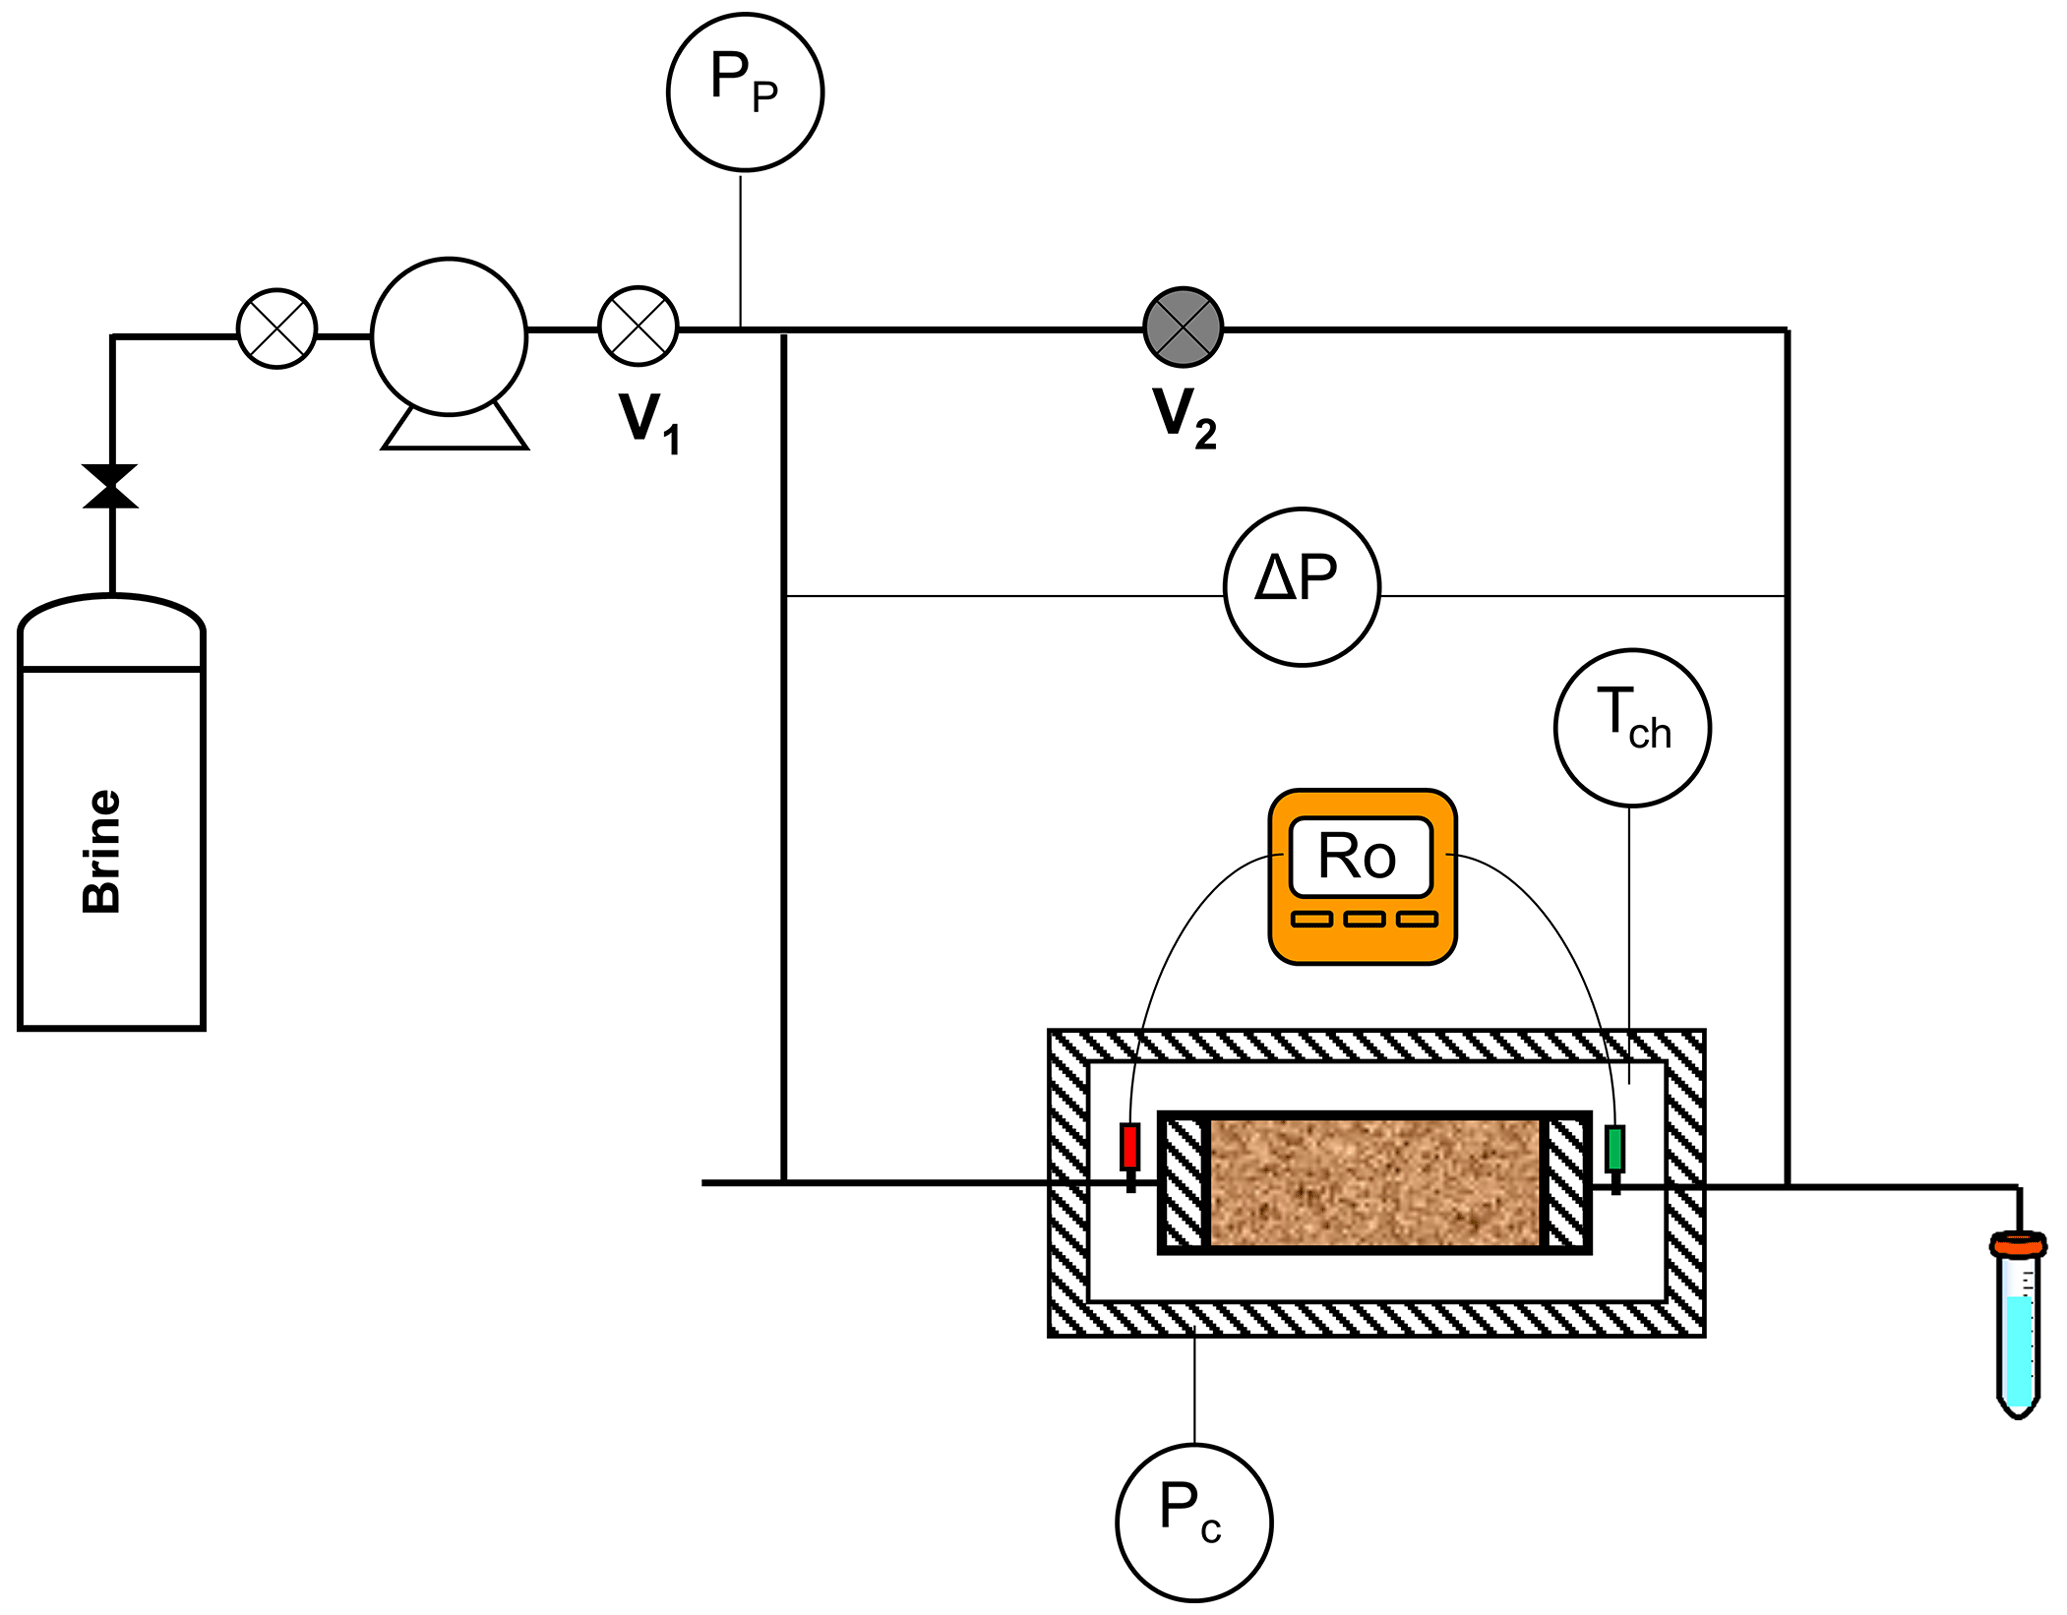
Figure 3Diagram of the multi-salinity experiment. Pp: pore pressure transducer, Pc: confining pressure indicator, ΔP: pressure difference gauge, Tch: chamber temperature indicator, Ro: rock resistance transducer, V1: pump downstream valve, and V2: bypass valve.
Figure 3 shows the multi-salinity experiment diagram setup. The sample was placed inside a Hassler core holder at a confining pressure of 10.34 MPa (1500 psi) inside a cabinet to maintain a constant temperature of 21 ∘C. An AC multifrequency meter (RS PRO LCR-600 model) with a four-electrode system measured the resistance and phase angle ranging from 0.1 to 20 kHz. The Mettler Toledo Seven Excelente multiparameter meter measured the brine conductivity inlet and outlet. The core flooding was undertaken at a low constant flow rate of 0.09 mL min−1. The experiment consisted of core-flooding the sample using brine with a constant inflow at different salinities and monitoring the rock resistivity, differential pressure, and outlet brine conductivity. This experiment, for tight gas sands, requires at least 20–40 pore volumes to be injected and then waiting for the steady state to be reached before moving on to the next salinity (Laswell, 2006). In addition, using the steady-state technique (Darcy's law; Darcy, 1856) and the unsteady or transient pressure technique (Amaefule et al., 1986), the brine permeability (Kw) was measured before and after each salinity. After each run, the T2 relaxation time distribution was measured using a nuclear magnetic resonance (NMR) spectrometer to monitor the change in pore size distribution (Coates et al., 1999). Finally, inductively coupled plasma optical emission spectroscopy (Thermo ICAP 7400 ICP-OES analyser) was used for ion detection release in sample C.
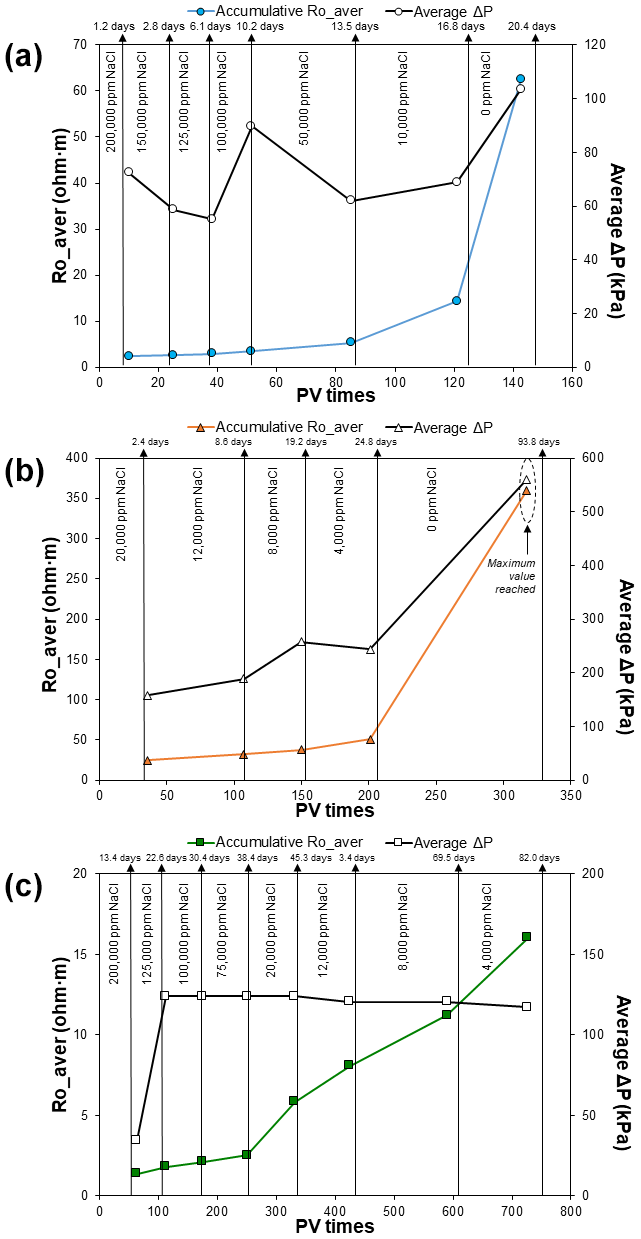
Figure 4The average rock resistivity trend (Ro_aver) of sample A (a), B (b), and C (c) in the multi-salinity experiment. Rock electrical resistivity (Ω m) is shown on the left y axis, the average pressure difference ΔP (kPa) on the right y axis, and the accumulative pore volume times PV needed to be flushed inside the core on the bottom x axis; the accumulative time (days) per brine is displayed at the top.
3.1 Rock resistivity trend
The resistivity of all samples increased as the brine salinity decreased (Fig. 4), a trend expected since the conductivity of the brine decreases as its salinity increases. Inversely, the rock resistivity ultimately tends to infinity. In terms of the duration, the experiment on the kaolinitic sample (A) lasted 20 d, the experiment on the glauconitic sample (C) lasted 82 d, and finally the experiment on the chloritic sample (B) lasted 94 d. The duration of each multi-salinity test is related to the initial pore volume (or porosity), the initial brine permeability, mineralogical content, and rock–brine electrochemical interactions.
The resistivity of sample A increased constantly in the high salinity range (2.3 to 3.5 Ω m) and rose sharply in the low salinity range (5.3 to 62.3 Ω m). The pressure difference across the sample ranged from 55 to 103 kPa, with an abrupt rise at 100 000 ppm NaCl. The resistivity and pressure difference increased dramatically in the final run with deionised water. A total of 143 pore volumes (PVs) of brine were injected in this experiment, with an average of 13 PVs in the high range and 30 PVs in the lower range.
For sample B, the core flooding from 20 000 to 4000 ppm NaCl lasted 25 d, where the resistivity increased steeply (24.5 to 51.0 Ω m). The resistivity did not reach stability in the last run with deionised water. The decision to continue monitoring the last run was merely to probe the theory that the resistivity continues rising without cations flowing inside the porous media. The pressure difference across the sample ranged from 158 to 558 kPa and increased dramatically when flooded with deionised water. A total of 317 PVs of brine were injected during this experiment, with an average of 50 PVs in the low salinity range.
For sample C, the resistivity increased smoothly in the high salinity range (1.4 to 2.5 Ω m) and rose more steeply in the low salinity range (5.8 to 16.0 Ω m). The pressure difference across the sample ranged from 34 to 124 kPa, rising from the second run. A total 726 PVs of brine were injected during the experiment, with an average of 63 PVs in the high salinity range and 119 PVs in the low salinity range. The last run was at 4000 ppm NaCl and the experiment could not be continued with deionised water since sulfate ions were detected at the end. The release of these cations was attributed to the dissolution of anhydrite present in the rock framework (identified on micrograph images), and therefore the experiment was stopped.
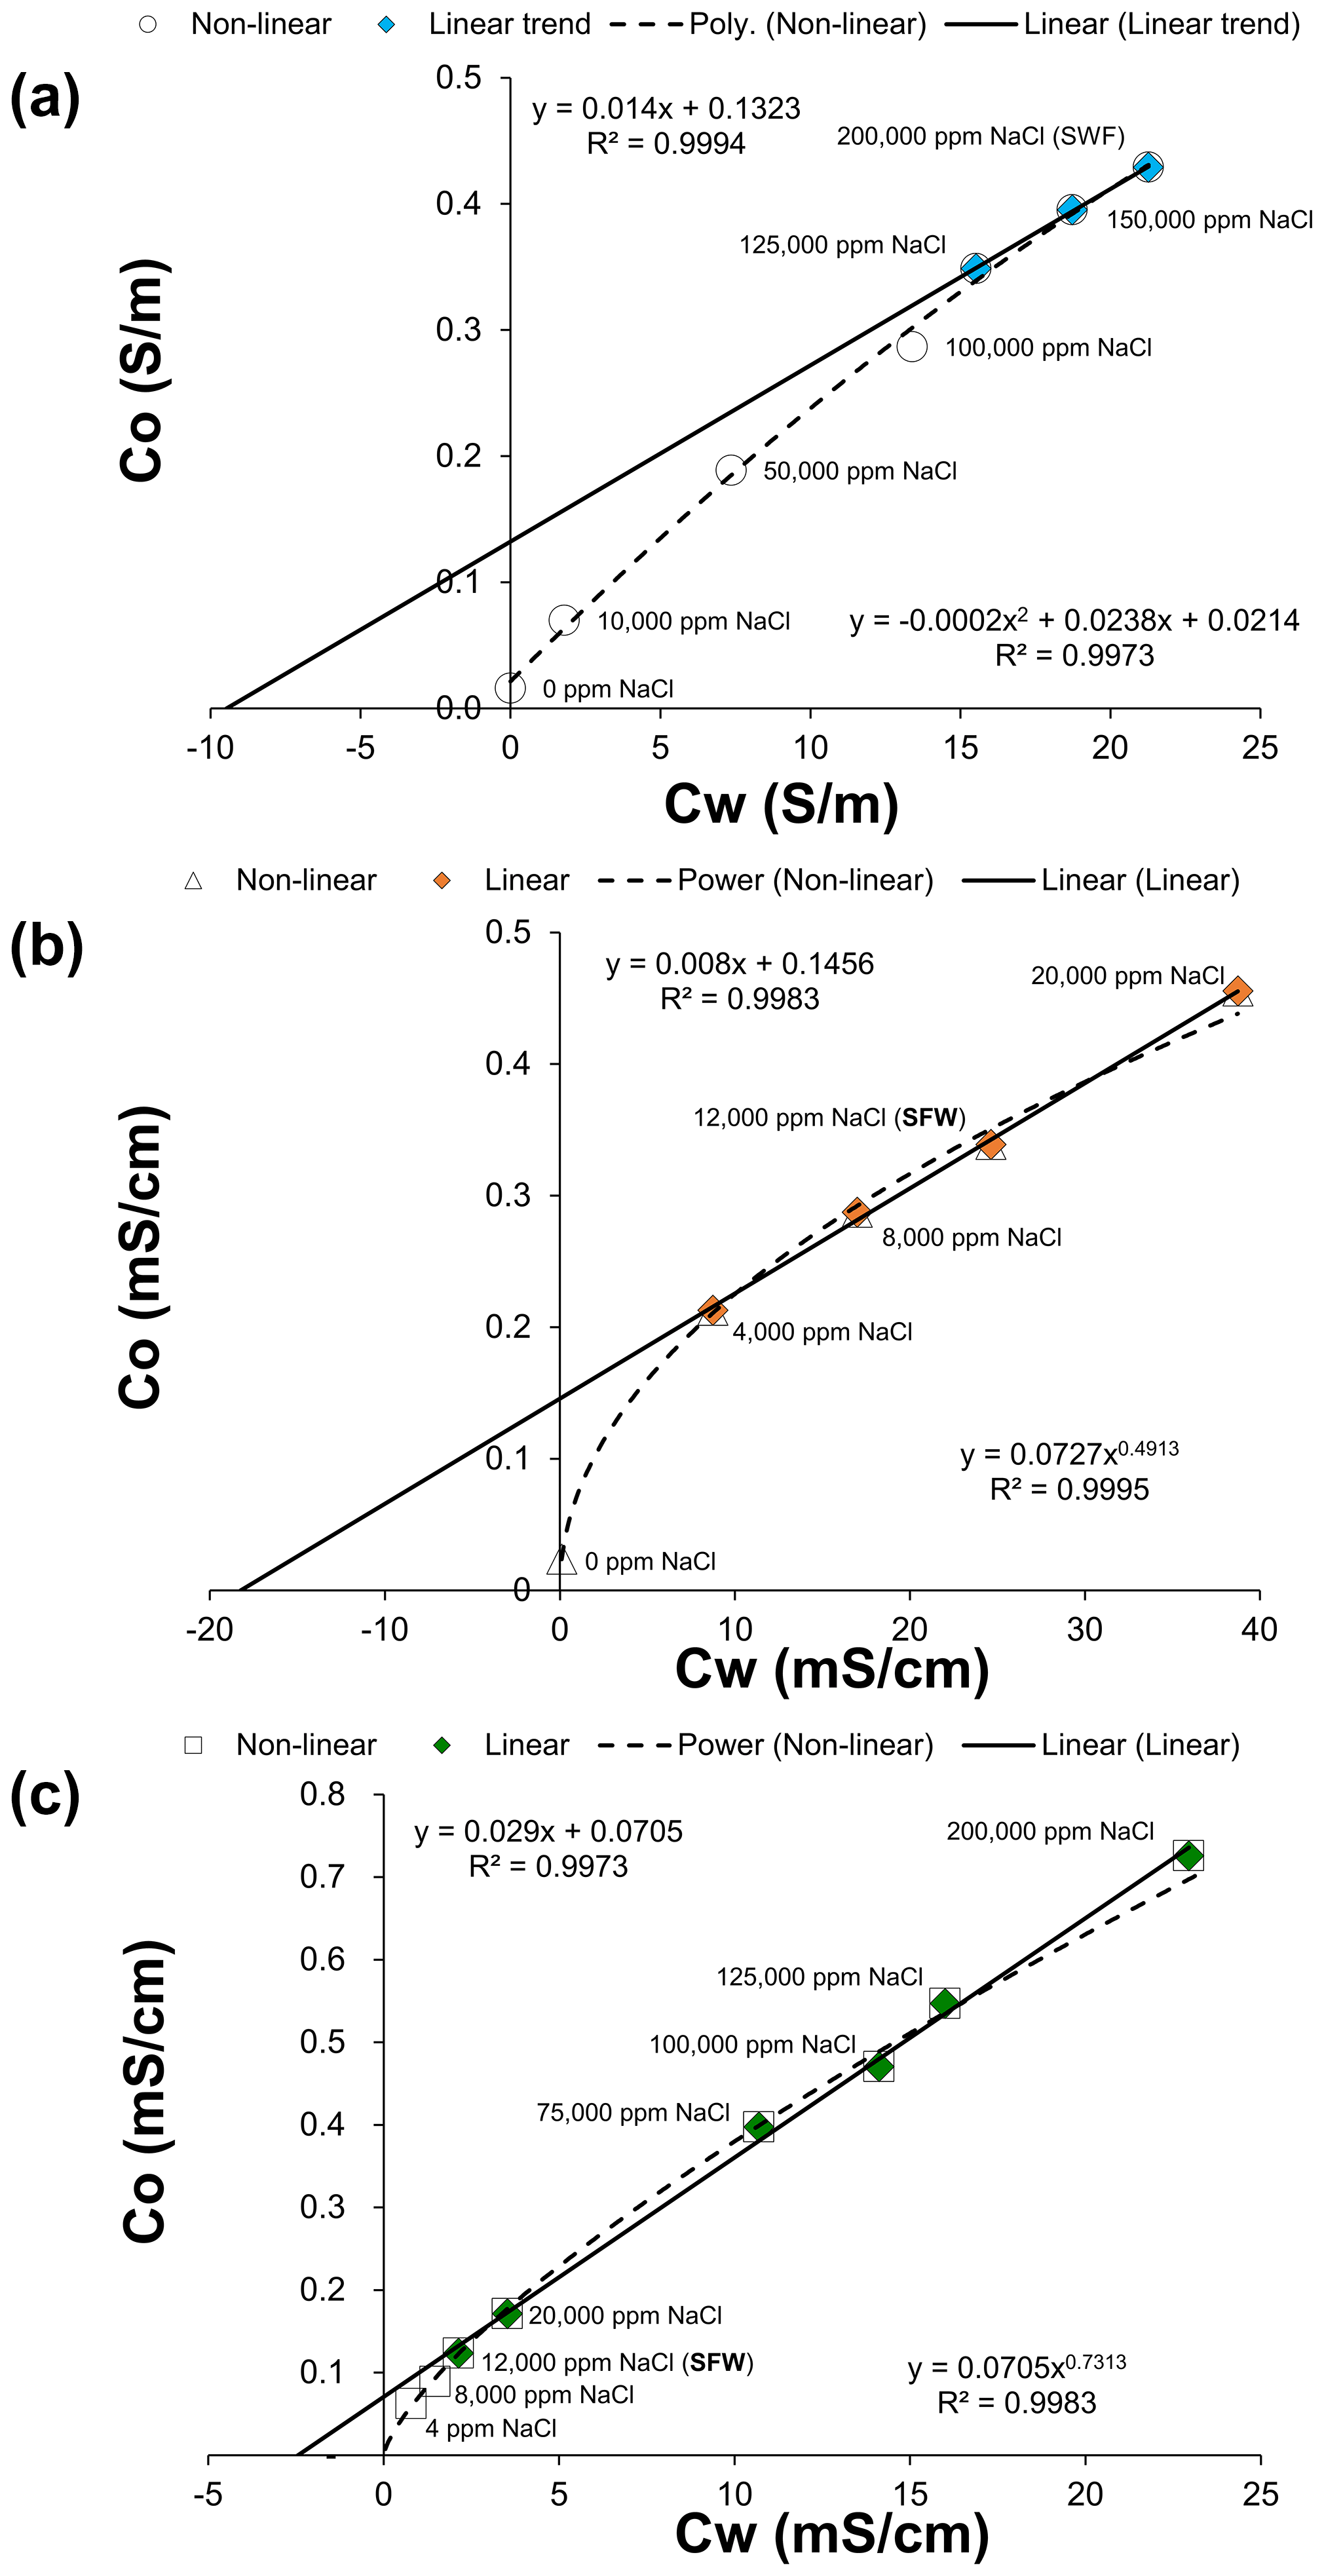
Figure 5Multi-salinity cross-plot of samples A (a), B (b), and C (c). Rock electrical conductivity, Co (S m−1), is shown on the y axis versus brine electrical conductivity, Cw (S m−1), on the x axis. The empirical correlation with the whole dataset and a linear correlation with selected data points to derive the cation-exchange capacity parameter are shown.
3.2 Cation-exchange capacity values
The CEC values obtained using the Waxman and Smits (1968) method (i.e. by cross-plotting the rock and brine conductivities) were calculated from the experimental results (Fig. 5). The impact of clay is evident in the low salinity range as a non-linear trend. By selecting all the data points, the sample A best fit is a polynomial correlation, while for samples B and C, the best fit is a power-law correlation. The Co value (0.023 mS cm−1) corresponding to deionised water for sample B was estimated to forecast the non-linear trend at Cw=0.
Table 3Cation-exchange capacity results.
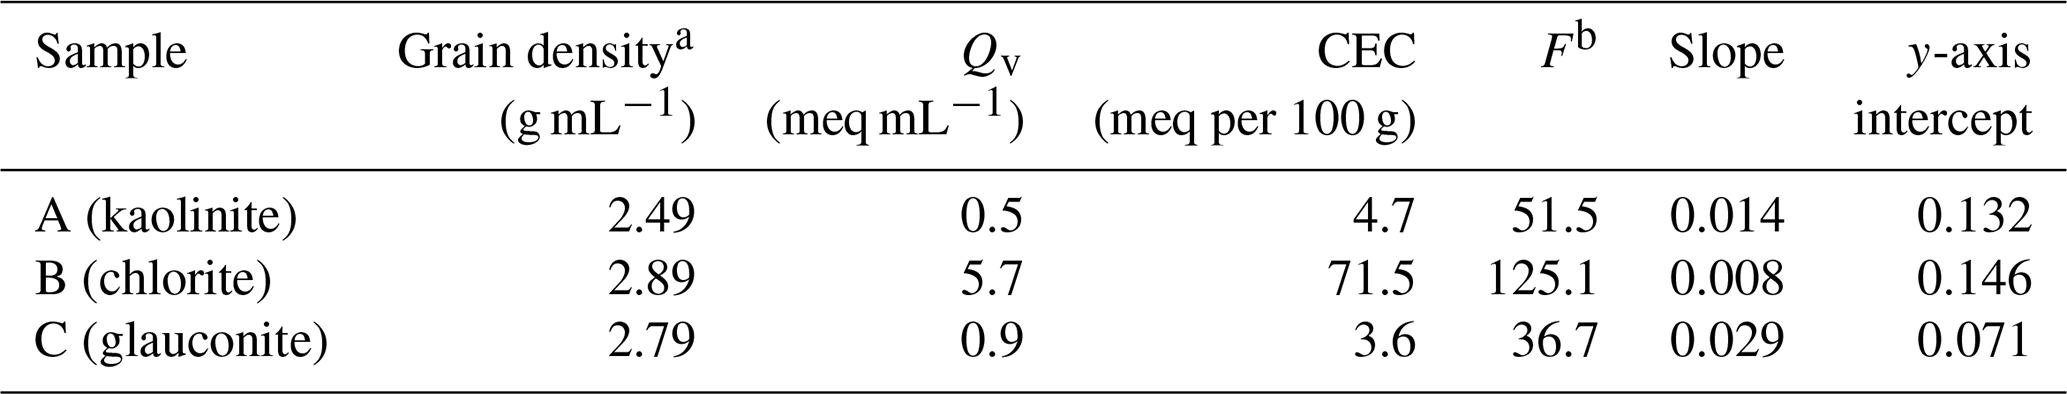
a Derived from helium porosimeter. b Apparent formation factor (inverse slope).
The chloritic greensand (B) has the highest CEC value of 71.5 meq per 100 g, followed by kaolinitic sandstone (A) of 4.7 meq per 100 g, and the glauconitic sandstone (C) of 3.6 meq per 100 g (further details in Table 3). Comparing these results with the mineralogy of each sample determined by XRD and the pure clay minerals' CEC range values (Table 1), it appears that there is a strong relationship between the clay mineral type and the CEC. The chloritic sample (B), combined with a significant presence of the illite group, can have a greater swelling capacity than the other samples. It is important to note that samples A and C come from the same reservoirs with high-salinity brines, while sample B comes from a freshwater reservoir (see Table 2). Hence for computing the water saturation distribution of these reservoirs, the classical Archie (1942) model can be applied to samples A and C, while a shaly sand model like Waxman and Smits (1968) should be used for sample C.
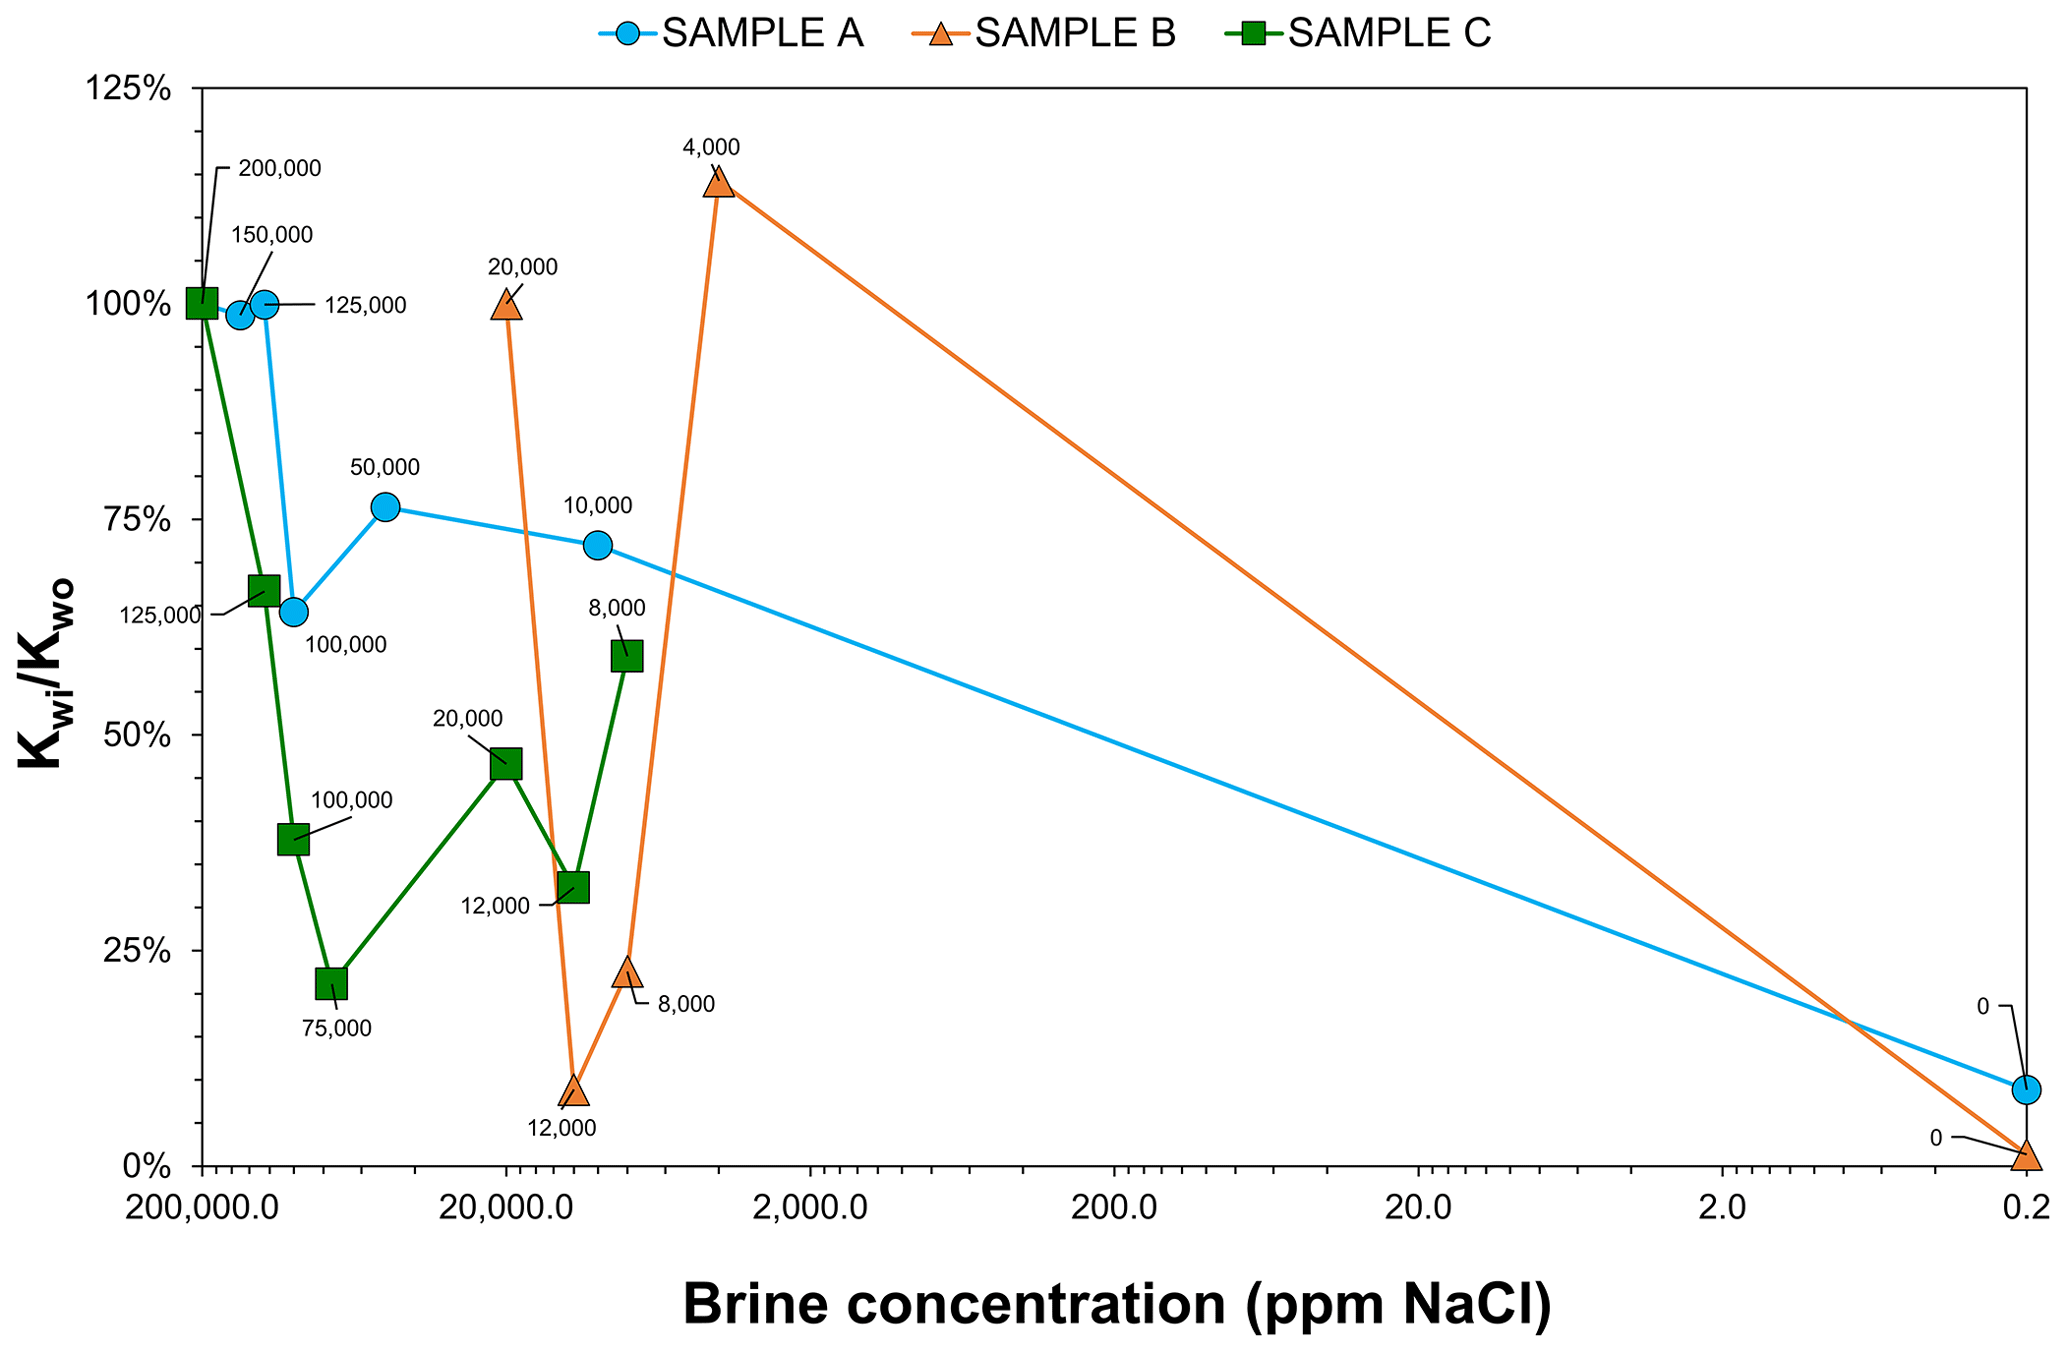
Figure 6Brine permeability results of samples A (blue circle), B (orange triangle), and C (green square). Brine NaCl salinity (ppm) is shown on the x axis, and the brine permeability ratio () is on the y axis in percentage. Note: due to the fact that the logarithmic value of zero does not exist, the deionised water ratio was plotted for 0.2 ppm NaCl.
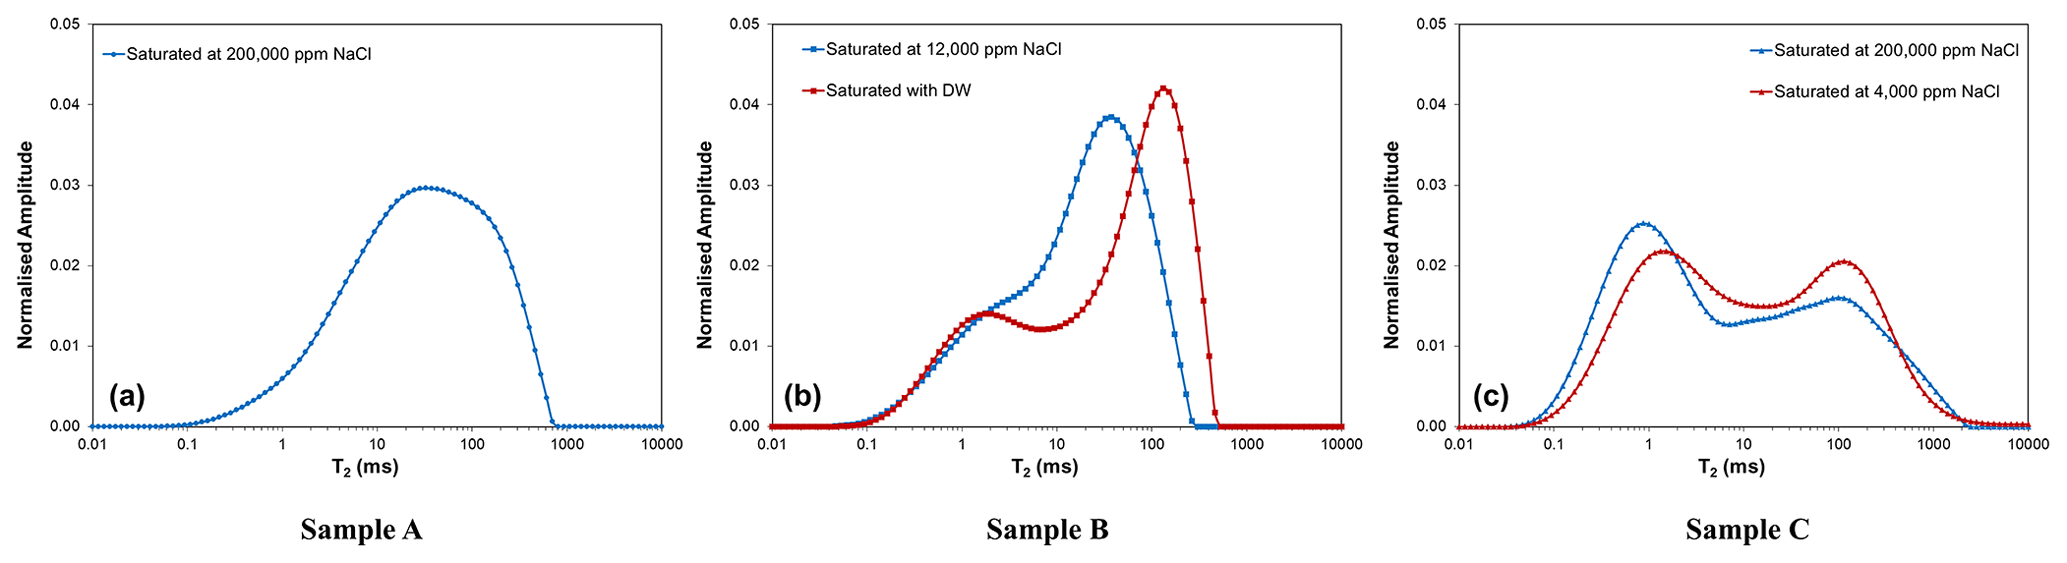
Figure 7NMR T2 distribution results of samples A (a), B (b), and C (c). Normalised amplitude is shown on the y axis on a linear scale versus NMR T2 distribution on the x axis on a logarithmic scale.
3.3 Brine permeability impairment
A brine permeability ratio () was used to compare the trend of the samples (Fig. 6): that is, the measured brine permeability of a run (Kwi) divided by the initial brine permeability (Kwo). Figure 7 shows the NMR T2 relaxation time distribution from the first and last brine run per sample, except for sample A, since this additional measurement was not added until the later samples were analysed. However, a reference plot is shown (left side) of the core from the master database showing an unimodal pore size distribution.
The ratio for sample A was steady in the high salinity range. It then drastically decreased in the low salinity range, being reduced to 9 % of the initial permeability compared with the permeability measured using deionised water. For sample B, which was only tested using low-salinity brine, the ratio had a peculiar variable trend – at 4000 ppm NaCl unusually increased to 114 %. The NMR T2 distribution indicates that a rearrangement of pore size distribution towards the mesopore and macropore range happened, meaning that permeability increased.
For sample C, the ratio showed a sharp decrease in the high salinity range up to 21 %. However, at the low salinity range, the ratio started to increase, and at 4000 ppm NaCl, Ca2+ and SO ions were detected in outlet brine, indicating that the anhydrite inside the sample was dissolving. The NMR T2 distribution also displays a rearrangement of pores towards the mesopore and macropore range, indicating increased permeability. The dissolution of anhydrite present in the sample may have widened the pore throats. Hence, the final brine permeability was not measured in this run and the experiment stopped.
This experimental core flooding study supports the Waxman–Smits model for fully water-saturated cores, showing the impact of clay in the low salinity range for three tight sandstones with different primary clay mineral presence: kaolinite (A), chlorite (B), and glauconite (C). Saner and Kissami (2003) conducted a similar core flooding test with NaCl brines from 250 000 to 1000 ppm in cores containing 90 % to 95 % quartz with a permeability range from 19.2 to >1000 mD, finding no shaliness (clayey) effect. Orr et al. (2005) developed a partially brine-saturated core flooding test using brines from 150 000 to 60 000 ppm, called CtCw plots, in synthetic samples with different low-clay minerals, detecting the clay effect only in the low brine range for chlorite (8 % ), illite (5 % ), and montmorillonite (3 % –10 % ) but not for kaolinite (5 % ). To the authors' knowledge, no such multi-salinity experiment has been reported on tight rocks with significant clay portions (15 % –37 % ).
The kaolinite sample (A) had the lowest clay portion (15 % ), including a smaller amount of illite (3.84 % ). The resistivity of this sample is the most stable as the brine salinity decreased (Fig. 4). In the high salinity range, the permeability remained relatively constant. As the brine salinity decreased below 100 000 ppm NaCl, reductions in permeability started to occur and reached 91 % of the original brine permeability with deionised water. This behaviour was also observed by Baptist and Sweeney (1954), where sandstones with kaolinite and illite are most sensitive in the low salinity range (16 500 and 5250 ppm NaCl) down to deionised water. Kaolinite is associated with clay migration since it is distributed as loose pore fillings (Neasham, 1977). Illite is typically distributed as pore bridging, creating microporosity and tortuous flow paths (Ines et al., 2023). Its CEC value, 4.7 meq per 100 g, was the second in descending order, which agrees with the pure kaolinite CEC range of 3–15 meq per 100 g (Table 1).
Sample B (chlorite) had the highest clay portion (37 % ) with a considerable amount of illite (6.03 % ). It is a complex sandstone with iron, magnesium, and potassium cations in its structure that may interact with the brine when present in the rock pore wall. Its resistivity trend was steep, with the highest resistivity value reaching up to 13.2 Ω m difference from 8000 to 4000 ppm NaCl (last two runs). It did not achieve a steady state for the deionised water run. Its brine permeability ratio shows a peculiar upside-down trend, increasing non-uniformly from 8000 to 4000 ppm NaCl instead of following a uniform decrease. An electrochemical interaction is believed to have occurred in the pore wall surface at this point, where the cation-exchange site interactions are more prevalent when fewer cations are available (Waxman and Smits, 1968) since from 4000 ppm NaCl the non-linear zone appears (Fig. 5). The NMR T2 distribution showed a shift of pore size distribution towards a higher pore throat size, indicating a permeability increase and rearrangement of pores (Fig. 7). These findings agree with the observation of Jones (1964) that magnesium-rich (and calcium-rich) clay particles do not disperse easily in fresh waters, unlike sodium clay particles, contributing to a higher negative charge in the cation-exchange sites and therefore a high CEC value. The experimentally derived CEC value was 71.5 meq per 100 g, the highest of the cores studied. Also, chlorite may occur as pore lining isolating pores or as a mixed layer with illite, or it can be pore filling (Neasham, 1977), resulting in porosity and permeability reduction due to clay swelling and migration (Liu et al., 2023).
The glauconite sample (C) had the second-highest clay portion (30.03 % ) with the lowest CEC value of 3.6 meq per 100 g. Weaver (1989) reported values from 5 to 12 meq per 100 g for glauconites with up to 5 % expandable clays and with 50 % expandable-layer CEC values up to 40 meq per 100 g. Patchett et al. (1993) reported values from 7.8 to 32.4 meq per 100 g (13 % to 81 % glauconite). Sample C also contained anhydrite. Glauconitic particles contribute greatly to disguising tight gas sweet spots (e.g. Gonzalez-Gonzalez et al., 2018; Prayoga et al., 2018). Its resistivity was smooth in the high salinity range (55 to 100 Ω), while it was steeper in the low salinity range (234 to 643 Ω); the experiment was stopped at the 4000 ppm run since sulfate ions were detected in the outflow. Permeability impairment was prevalent in the high salinity range (up to 75 000 ppm NaCl) and then increased in the low salinity range (Fig. 5). In addition, water-wet microporosity is a key feature for glauconitic sandstones where water is trapped in the bound water layer, resulting in high irreducible water saturation (Thomas et al., 2003; Hossain et al., 2011). Hence, if a mixture of anhydrite and glauconite is located in the pore wall neighbourhood, there is a higher possibility of mineral dissolution and pore opening. Temperature between 11 and 40 ∘C potentially favours the anhydrite–gypsum conversion in geothermal operations (Luo et al., 2023).
Water sensitivity is where the sandstone permeability decreases readily, and processes involving clay, such as swelling and migration, occur when the sandstone is in contact with fresh water (Khilar and Fogler, 1983). Sample C (glauconite) was the most water-sensitive since the core external face edges started to lose particles, followed by A (kaolinite), which presented a uniform impairment, and sample B (chlorite), whose permeability began to increase. In geothermal operations, the injection of low-salinity water (LSW) is frequent due to low cost and accessibility. Liu et al. (2023) experimentally found that LWS core flooding promotes the double electric layer and permeability reduction; they advised adding divalent cations to the LWS chemical composition to alleviate this phenomenon.
There is no conventional method to measure the CEC of a core in the upstream industry. The experiment conducted in this study used a non-destructive method which presents several advantages, including replicating the reservoir conditions as closely as possible. However, it is time-consuming to use in a commercial laboratory. Between 25 and 50 brine pore volumes must be injected to reach equilibrium, agreeing with Lasswell (2006). Despite this, destructive methods are preferred, where the core sample is crushed, followed by chemical or conductometric titration (e.g. McPhee et al., 2015). The issue with crushing clay-bearing sandstones is the possibility of breaking the structure of clay minerals, increasing surface area and therefore resulting in measurement bias.
A limitation of this study was the initial brine permeability range (<1 mD), which impacted the duration of the experiment since large numbers of pore volumes were required to core-flood to reach an electrical equilibrium in the core. The temperature used was 21 ∘C due to the technical capacity in the laboratory and, most importantly, to compare the three samples reasonably. Gan et al. (2022) experimentally found that temperature has a relatively minor effect on permeability and porosity changes in geothermal reinjection core experiments with a 1.0 mL min−1 flow rate (11-fold higher than the flow rate used in the experiments reported here). This study revealed that a low water salinity range enhances clay migration and swelling, especially for 2:1 clay minerals such as chlorite (sample B), illite (minor portion in samples A and B), and glauconite (sample C). Mineral dissolution occurred in the latter core due to the presence of anhydrite. Since fewer brine Na+ ions are flowing inside the pore throat networks at low salinity, it is believed that an ion exchange happened between them and a release of Ca2+ ions from the anhydrite mineral dissolution.
When conducting a multi-salinity experiment, future studies should consider using a very low rate (e.g. 0.09 mL min−1) of brine to allow the rock–brine electrical equilibrium and flow steady state to be reached. The brine salinity should be decreased during the experiment, avoiding the abrupt change from high to low salinity and thus preventing clay blocking of the pore throats. It is advisable to take additional measurements, such as NMR T2 distribution, or cut thin sections before and after the experiment to analyse if the rock texture and composition have been altered.
The following specific conclusions from the study can be drawn.
-
Water salinity is proportional to permeability impairment in the high salinity range (>75 000 ppm NaCl). However, at the low salinity range, clay minerals interact with the free cations of the brine strongly (cation-exchange sites formation), altering the electrochemical system of the porous media and increasing clay swelling or migration.
-
Kaolinitic sandstone is the least water-sensitive, followed by chloritic and glauconitic sandstone. The latter could not be measured in deionised water since the anhydrite in the rock framework dissolved and released sulfate ions. Water sensitivity increases as salinity decreases.
-
Chloritic sandstone is very sensitive to the low salinity range, increasing its permeability below 8000 ppm NaCl. Its formation water is fresh water (12 000 ppm NaCl).
-
Illite presence combined with kaolinite (sample A) or chlorite (sample B) reduces porosity and permeability, enhancing clay migration and swelling.
-
The multi-salinity test is a more realistic method to simulate the in situ conditions of a reservoir than non-destructive methods.
This investigation contributes to geothermal reservoir characterisation by providing a better understanding of how water salinity controls the impact of clay on permeability and formation damage in tight clay-bearing reservoirs. The experimental findings underscore the need for strategic approaches to counteract the impact of the mineralogical rock composition on permeability, directly impacting geothermal energy production and optimising energy extraction efficiently and sustainably.
This paper is based on the research results presented in the EGU 2023 on-site presentation with the conference abstract EGU23-8407 (https://doi.org/10.5194/egusphere-egu23-8407; Navarro-Perez et al., 2023). The conference abstract states that the CEC value for sample A was “3.7 meq/100 g”, and it should say a value of “4.7 meq per 100 g” as indicated in this paper.
Due to sponsors' confidentiality agreements, supporting data and sampling can only be made available to bona fide researchers subject to a non-disclosure agreement.
DNP, QF, SA, and CG designed the experiment and DNP carried it out. DNP prepared the paper with contributions from all co-authors.
The contact author has declared that none of the authors has any competing interests.
The funder had no role in the study design, data collection, or analysis and no involvement in this paper.
Publisher's note: Copernicus Publications remains neutral with regard to jurisdictional claims made in the text, published maps, institutional affiliations, or any other geographical representation in this paper. While Copernicus Publications makes every effort to include appropriate place names, the final responsibility lies with the authors.
This article is part of the special issue “European Geosciences Union General Assembly 2023, EGU Division Energy, Resources & Environment (ERE)”. It is a result of the EGU General Assembly 2023, Vienna, Austria, 23–28 April 2023.
We thank the PETGAS project (https://www.petgas3.leeds.ac.uk/, last access: 1 June 2020) from the Centre for Integrated Petroleum, Engineering and Geoscience (CiPEG) at the University of Leeds, UK, and the exploration and production management from ENAP Magallanes, Chile, for supplying the samples.
Daniela Navarro-Perez was funded by the National Research and Development Agency of Chile (ANID) and the scholarship programme Doctorado en el Extranjero Becas Chile in the form of grant 2018-72190176. In addition, the processing charges for this open-access publication were covered by this grant.
This paper was edited by Michael Kühn and Giorgia Stasi and reviewed by two anonymous referees.
Allaby, M.: A dictionary of plant sciences, 4th edn., Oxford University Press, Oxford, ISBN 9780191871665, 2019.
Amaefule, J. O., Wolfe, K., Walls, J. D., Ajufo, A. O., and Peterson, E.: Laboratory determination of effective liquid permeability in low-quality reservoir rocks by the pulse decay technique, 56th California Regional Meeting of the Society of Petroleum Engineers, Oakland, California, 2–4 April, SPE-15149, https://doi.org/10.2118/15149-MS, 1986.
Archie, G. E.: The electrical resistivity log as an aid in determining some reservoir characteristics, Transactions AIME, 146, 54–67, 1942.
Baptist, P. C. and Sweeny, S. A.: The effect of clays on the permeability of reservoir sands to waters of different saline contents, Clays and Clay Miner., 3, 505–515, 1954.
Bush, D. C. and Jenkins, R. E.: Proper hydration of clays for rock property determination, J. Pet. Technol., 22, 800–804, https://doi.org/10.2118/2589-PA, 1970.
Carcione, J. M., Gei, D., Ting, Y., and Jing, B.: Effect of clay and mineralogy on permeability, Pure Appl. Geophys., 176, 2581–2594, https://doi.org/10.1007/s00024-019-02117-3, 2019.
Chicco, J. M., Pierantoni, P. P., Costa, M., and Invernizzi, C.: Plio-Quaternary tectonics and possible implications for geothermal fluids in the Marche region (Italy), Tectonophysics, 755, 21–34, https://doi.org/10.1016/j.tecto.2019.02.005, 2019.
Clavier, C., Coates, G., and Dumanior, J: Theoretical and experimental bases for the dual-water model for interpretation of shaly sands, SPE J., 24, 153–168, https://doi.org/10.2118/6859-PA, 1984.
Coates, G. R., Xiao, L., and Prammer, M. G.: NMR logging Principles and Interpretation, Halliburton Energy Service, Houston, Texas, ISBN 9780967902609, 0967902606, OCLC 45068524, 1999.
Cobos, J. E. and Søgaard, E. G.: Study of geothermal brine reinjection by microcalorimetry and core flooding experiments, Geothermics, 87, 101863, https://doi.org/10.1016/j.geothermics.2020.101863, 2020.
Darcy, H.: Les fontaines publiques de la ville de Dijon: exposition et applications, Volume 1, Victor Dalmont, Paris, 1856.
Elnagger, H., Sobhy, M., Elagab, O., Saeed, A., and Yehia, T.: A review on clay reactivity with brine and its impact on fluid flow through porous media, IOGP Conference and Exhibition, October 2023, Boston, USA, 2023.
Gan, H., Liu, Z., Wang, G., Liao, Y., Wang, X., Zhang, Y., Zhao, J., and Liu, Z.: Permeability and porosity changes in sandstone reservoir by geothermal fluid reinjection: insights from a laboratory study, Water, 14, 3131, https://doi.org/10.3390/w14193131, 2022.
Gonzalez-Gonzalez, A., Valderrama, J. M., Gschaider, C. T., Carcamo, R. A., Verdugo-Dobronic, M., Canessa, N. D., Perez-Perez, A., Velasquez-Arauna, A., Sanchez-Ojeda, J., Ahumada-Villar, M., and Gonzalez-Vidal, M.: Desarrollo del play tight gas zona glauconitica, Bloque Arenal, Cuenca de Magallanes – Chile: caso estudio, 10th Congreso de Exploracion y Desarrollo de Hidrocarburos, 5–9 November 2018, Mendoza, Argentina, 2018.
Hossain, Z., Grattoni, C., Solymar, M. and Fabricius, I. L.: Petrophysical properties of greensand as predicted from NMR measurements, Pet. Geosci., 17, 111–125, https://doi.org/10.1144/1354-079309-038, 2011.
Ines, R., Marc, F., Eric, K., Nicolas, P., and Béatrice, L.: Clay-induced permeability decline in sandstone reservoir: insights from a coupled NMR-SEM experimental approach, Geothermics, 114, 102784, https://doi.org/10.1016/j.geothermics.2023.102784, 2023.
Iranfar, S., Karbala, M. M., Shakiba, M., and Shahsavaru, M. H.: Effects of type and distribution of clay minerals on the physico-chemical and geomechanical properties of engineered porous rocks, Sci. Rep., 13, 5837, https://doi.org/10.1038/s41598-023-33103-4, 2023.
Jones Jr., F. O.: Influence of chemical composition of water on clay blocking of permeability, J. Pet. Technol., 165, 441–446, https://doi.org/10.2118/631-PA, 1964.
Juhasz, I.: Normalised Qv – the key to shaly sand evaluation using the Waxman-Smits equation in the absence of core data, Trans. SPWLA 22nd Ann. Logging Symp., June 1981, Mexico City, Mexico, SPWLA-1981-Z, 1981.
Khilar, K. C. and Fogler, H. S.: Water sensitivity of sandstones, SPE J., 23, 55–64, https://doi.org/10.2118/10103-PA, 1983.
Lasswell, P. M.: Core analysis for electrical properties, Petrophysics, 45, 191–213, 2006.
Lever, A. and Dawe, R. A.: Clay migration and entrapment in synthetic porous media, Mar. Pet., 4, 112–118, https://doi.org/10.1016/0264-8172(87)90027-4, 1987.
Li, S., Wang, S., and Tang, H.: Stimulation mechanism and design of enhanced geothermal systems: a comprehensive review, Renew. Sustain. Energy Rev., 155, 111914, https://doi.org/10.1016/j.rser.2021.111914, 2022.
Liu, G., Jiang, F., Ge, L., Zhang, Q., Chen, X., Fan, Z., and Wang, J.: Investigation of salinity and ion effects on low salinity water flooding efficiency in a tight sandstone reservoir, Energy Reports, 9, 2732–2744, https://doi.org/10.1016/j.egyr.2023.01.098, 2023.
Luo, W., Kottsova, A., Vardon, P. J., Dieudonné, A. C., and Brehme, M.: Mechanisms causing injectivity decline and enhancement in geothermal projects, Renew. Sustain. Energy Rev., 185, 113623, https://doi.org/10.1016/j.rser.2023.113623, 2023.
McPhee, C., Reed, J., and Zubizarreta, I.: Core Analysis: a best practice guide, Cubbit, J., Elsevier, the Netherlands, 826 pp., ISBN 978-0-444-63533-4, 2015.
Navarro-Perez, D., Fisher, Q., Lorinczi, P., Allshorn, S., and Grattoni, C.: Multi-salinity core flooding study in clay-bearing sandstones, a contribution to geothermal reservoir characterisation, EGU General Assembly 2023, Vienna, Austria, 24–28 April 2023, EGU23-8407, https://doi.org/10.5194/egusphere-egu23-8407, 2023.
Neasham, J. W.: The morphology of dispersed clay in sandstone reservoirs and its effect on sandstone shaliness, pore space and fluid flow properties, SPE Annual Fall Technical Conference and Exhibition, 9–12 October 1977, Denver, Colorado, 1977.
Orr, J. Z., Grattoni, C., and Potter, D. K.: Shaly sands: multiple salinity at varying brine saturation, International Symposium of the Society of Core Analysts, 21–25 August 2005, Toronto, Canada, 2005.
Patchett, J. G., Wiley, R., and El Bahr, M.: Modeling the effects of glauconite on some openhole logs from the Lower Senonian Egypt, SPWLA 34th Annual Logging Symposium, 13–16 June 1993, Cairo, Egypt, 1993.
Prayoga, O. A., Wicaksono, B., Setyoko, J., Wibowo, A., Wijaksono, E., Sulistyono, Momen, M., and Zulmi, I.: Integrated analysis for reservoir characterization of low resistivity glauconitic shaly sand reservoir of Miocene Ngrayong sandstone: implication for saturation modelling at low contrast hydrocarbon pay zone, 2nd SPWLA Asia Pacific Technical Symposium, 7–8 November 2018, Indonesia, 2018.
Rink, M. and Schopper, J. R.: Interface conductivity and its implications to electric logging. Trans. SPWLA 15th Ann. Logging Symp., June 1974, McAllen, Texas, SPWLA-1974-J, 1974.
Risha, M., Tsegab, H., Rahmani, O., and Douraghi, J.: The impact of clay minerals on the porosity distribution of clastic reservoirs: a case study from the Labuan Island, Malaysia, Appl. Sci., 13, 3427, https://doi.org/10.3390/app13063427, 2023.
Saner, S. and Kissami, M.: Critical salinity for Archie – non Archie models in the Jauf sandstone reservoir, Saudi Arabia, International Symposium of the Society of Core Analysts, 21–24 September 2003, Pau, France, 2003.
Tao, S., Gao, L., and Pan, Z.: Swelling of clay minerals and its effect on coal permeability and gas production: a case study of southern Qinshui Basin, Chine, Energy Sci. Eng., 7, 515–528, https://doi.org/10.1002/ese3.301, 2019.
Thomas, W. H., Ringen, J. K., and Rasch, S. O.: Effect of glauconite on petrophysical properties as revealed by core analysis, International Symposium of the Society of Core Analysts, 21–24 September 2003, Pau, France, 2003.
Waxman, M. H. and Smits, L. J. M.: Electrical conductivities in oil-bearing shaly sands. SPE J., 8, 107–122, https://doi.org/10.2118/1863-A, 1968.
Weaver, C. E.: Clays, muds, and shales, Elsevier, the Netherlands, 819 pp., ISBN 0-44-87381-3, 1989.
Worthington, P. F.: The evolution of shaly-sand concepts in reservoir evaluation. The Log Analyst, 26, 23–40, 1985.
Zhang, D., Meegoda, J. N., Goncalves da Silva, B., and Hu, L.: Impact of de-ionized water on changes in porosity and permeability of shales mineralogy due to clay-swelling, Sci. Rep., 11, 20049, https://doi.org/10.1038/s41598-021-99523-2, 2021.