 | 08 Nov 2022
Geographic Information System (GIS) as a basis for the next generation of hydrogeological models to manage the geothermal area Waiwera (New Zealand)
Michael Kühn
Melissa Präg
Ivy Becker
Christoph Hilgers
Andreas Grafe
Thomas Kempka
The geothermal hot water reservoir below the small town of Waiwera in New Zealand has been known to the indigenous Māori for many centuries. Overproduction by European immigrants led to a water level decrease and consequently artesian flow from the wells and the seeps on the beach ceased. The Te Kaunihera o Tāmaki Makaurau Auckland Council established the Waiwera Thermal Groundwater Allocation and Management Plan to allow the geothermal system to recover. For a sustainable operation, the management regime can be informed by hydrogeological models based on monitoring data. The underlying geological model has been revised according to field observations and an existing numerical model transferred to the newly developed software package TRANSPORTSE. Monitoring and digitally derived data have been integrated in a geographic information system (GIS).
- Article
(6050 KB) - Full-text XML
- BibTeX
- EndNote


The Waiwera geothermal aquifer is valued for its amenity – namely to supply hot water to private and commercial spa pools. The town of Waiwera was founded on this resource (ARWB, 1980). Knowledge of rock properties, structures, heat transfer and resulting interactions supported to set-up a sustainable geothermal reservoir management for the area (ARC, 1999). This knowledge further allows for the development of geological models that describe the processes within the reservoir (e.g. Bréthaut, 2009). They can serve as foundation for geothermal production and management plans aimed to preserve natural resources (ARC, 1991).
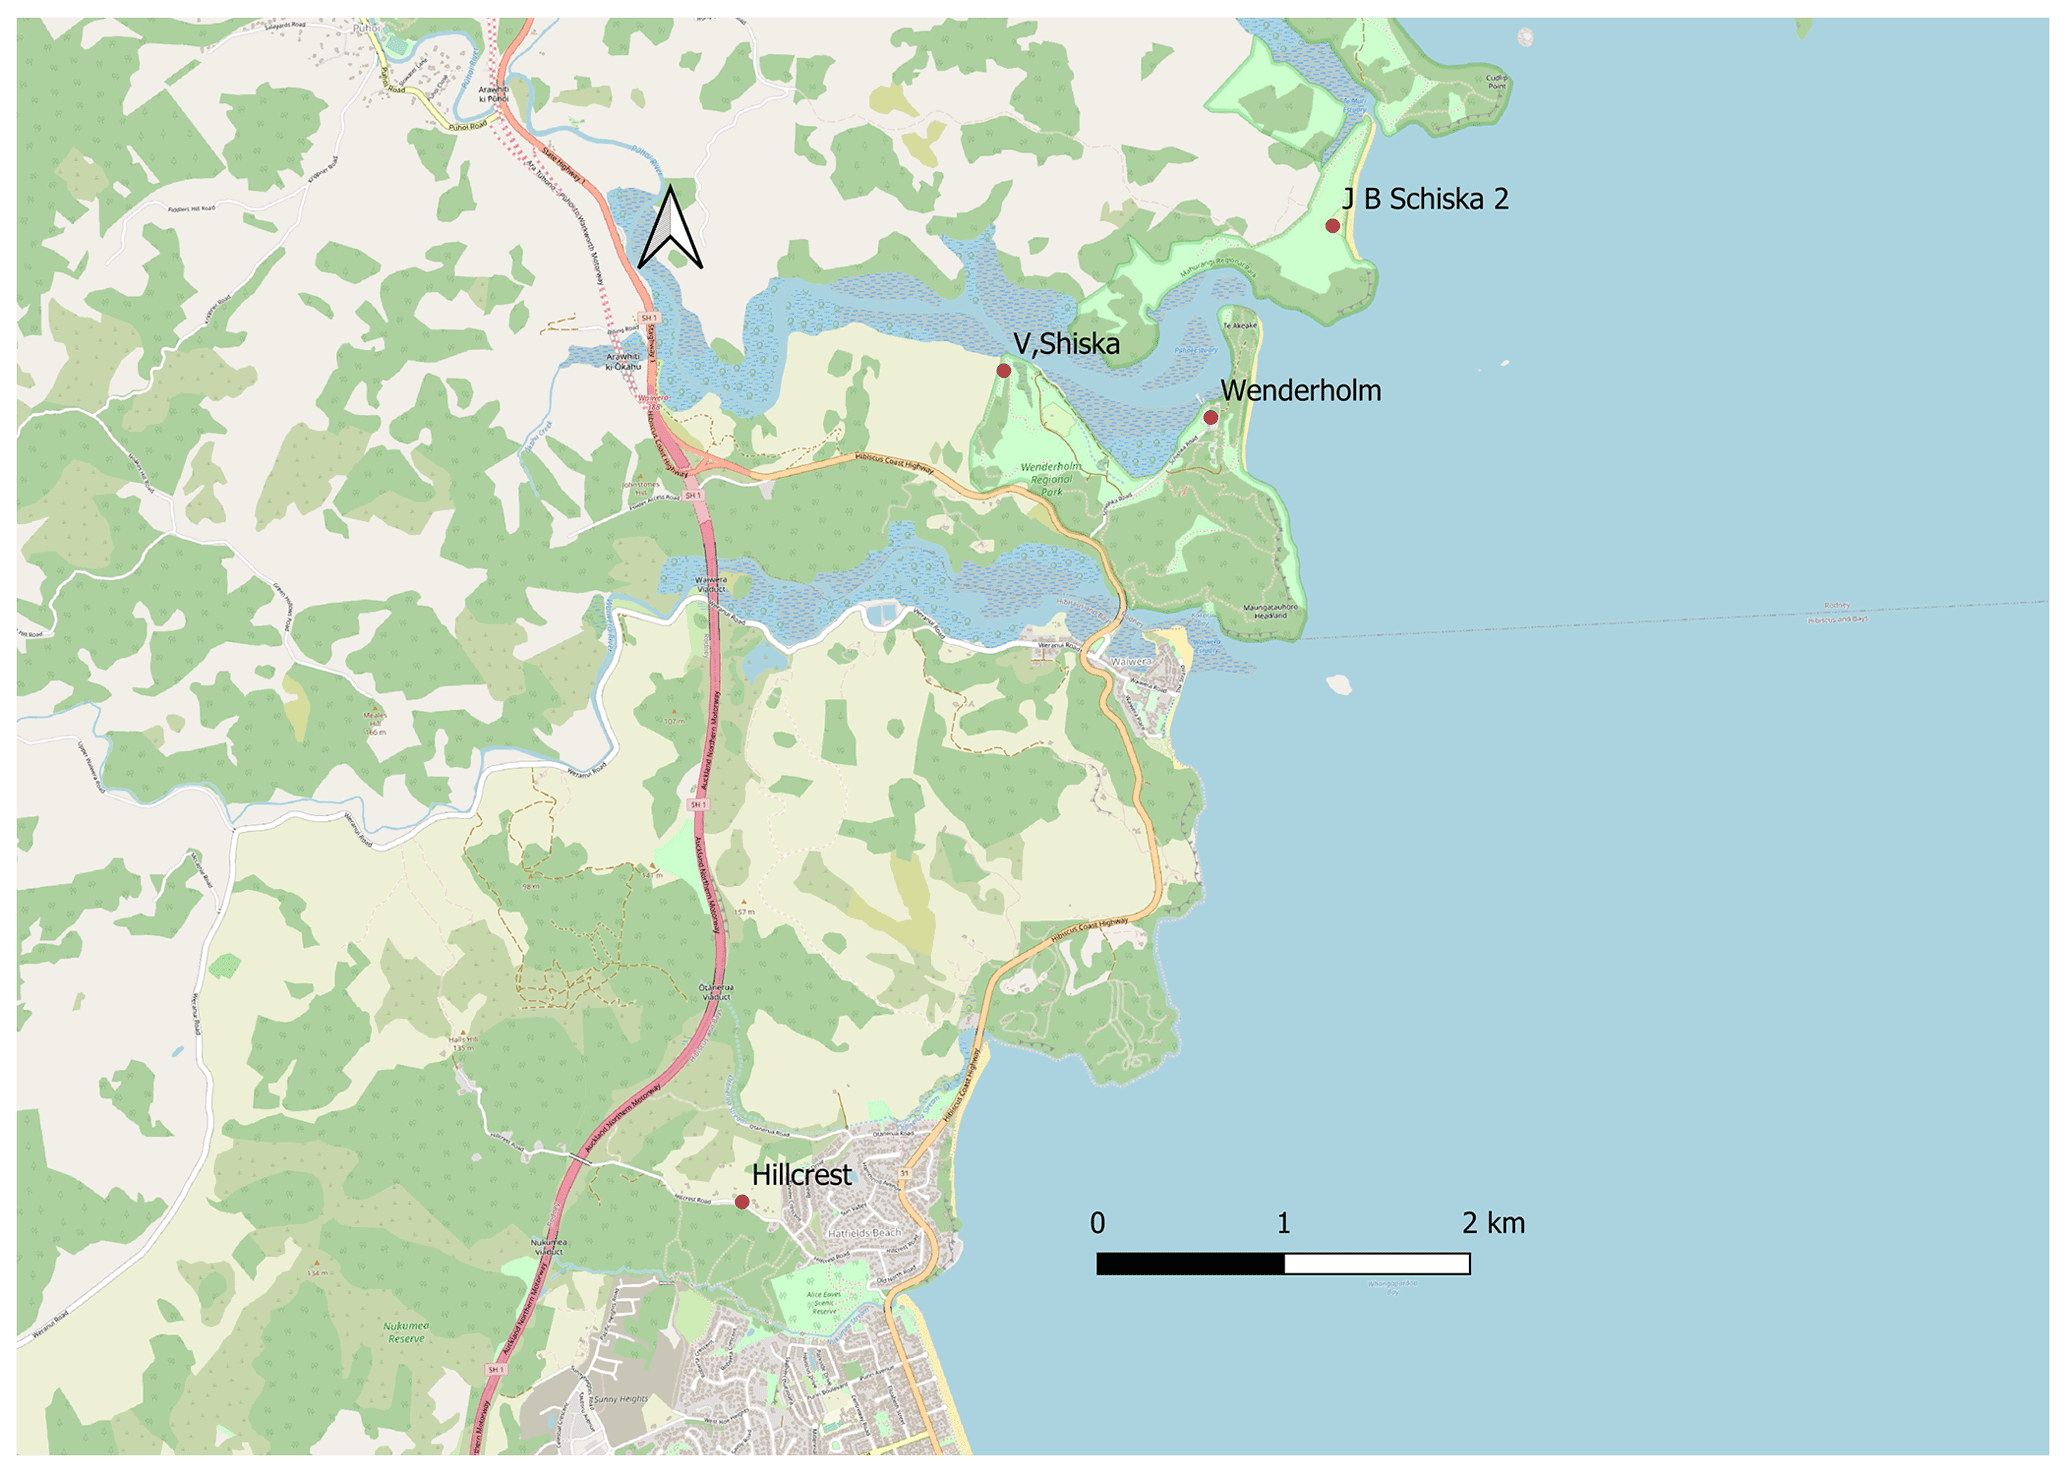
Figure 1Location map of the study site with the town of Waiwera in the centre. Locations of the far field bore holes outside the centre of Waiwera are additionally given (taken from Grafe, 2021).
The geothermal hot water reservoir below the small town of Waiwera in New Zealand has been known to the indigenous people, the Māori, for many centuries. It was first used by European immigrants in the 19th century (ARWB, 1980). Until the end of the 1960s, all drilled warm water production wells were artesian. Water with temperatures of up to 50 ∘C, must be pumped up as a consequence of overproduction. In the 1970s, the warm water springs on Waiwera beach subsequently ceased to flow (ARC, 1999). Resultantly, the Auckland Council implemented a water management plan for the area's future sustainable usage in the 1980s (ARWB, 1980). The Waiwera Thermal Groundwater Allocation and Management Plan, adopted by the Te Kaunihera o Tāmaki Makaurau Auckland Council (formerly known as Auckland Regional Water Board – ARWB and Auckland Regional Council – ARC; in the following abbreviated with Auckland Council) in 1987 (ARWB, 1987), allowed the geothermal system to gradually recover, but production rates did not allow the return to artesian conditions or the reactivation of the hot springs (Kühn and Stöfen, 2005). However, shortly after the primary user (Waiwera Thermal Resort & Spa) shut down in 2018, local residents reported overflowing bores to the Auckland Council. Furthermore, there is indication for a renewed activity of the hot springs on the beach (Präg et al., 2020). This implies a progressing recovery of the geothermal system including the return to artesian conditions. From what is known of the owner's plans of the resort, a new thermal spa and hotel should replace the old facilities. These plans threaten the recovery of the geothermal system and its return to natural conditions.
For a comprehensive understanding and an environmentally friendly and balanced long-term usage of the aquifer the following objectives need to be met: (i) maintain the desired production temperature and (ii) keep the required water level in the reservoir for that (ARWB, 1987). Hydrogeological models of the system can support water management by providing answers to the questions how much water can be taken over time from the reservoir and if possible from which depth and/or location. Various approaches for a quantified description of the Waiwera reservoir have been implemented since the 1980s. Some are data-driven (Kühn and Schöne, 2017; Kühn and Grabow, 2021) while others are process based (Kühn and Altmannsberger, 2016; Somogyvári et al., 2019) in order to finally comprehend and assess the constraints and impacts on the system (Kühn and Schöne, 2018). However, none of the models directly delivers all the results needed for an all-encompassing water management that would e.g. include the ability to confirm or optimise the recent monitoring set-up as well as the possibility to position new production wells in regard to a more sustainable use of the reservoir (Auckland Council, personal communication, 2017). The disadvantage of all previous work is the independent model set-up and usage of only some of the acquired monitoring and simulation results.
For further improvement of the Waiwera models two master theses were conducted (Präg, 2020; Grafe, 2021). Präg (2020) performed unmanned aerial vehicle (UAV) flights to carry out photogrammetric analyses, which allow the lithological and structural mapping of the outcrops at Waiwera. Grafe (2021) set up a revised hydrogeological model in view of the new geological data as well as knowledge from previous work. Conclusively, a data base which integrates all geoscientific information known about the geothermal area of Waiwera has been created within the framework of the presented study.
2.1 Location
Waiwera is a small coastal village located on New Zealand's North Island, about 40 km north of Auckland (Fig. 1). The geothermal reservoir below Waiwera consists of compacted and cemented sandstones and siltstones of the Waitematā Group. These are up to 425 m thick and have been folded, faulted and fractured by tectonic processes throughout the entire depth. Unconsolidated alluvial and marine sands, silts and clays form the sandspit on which Waiwera was built, act as a sealant for the underlying aquifer (ARWB, 1980). The thermal water has a temperature of approximately 50 ∘C at 150 m depth and is believed to be of meteoric origin according to its chemical composition and the enclosed gases (primarily nitrogen, carbon dioxide is only present in traces, no hydrogen sulphide), which preclude a volcanic origin. It is further assumed that the thermal water is sourced by rain water from farther inland, which percolates to a depth between 1200 and 2200 m (indicated by the silica content of the thermal water) and flows seawards, while being heated by a temperature gradient of about 30 ∘C km−1 (ARWB, 1980).
The recent model (ARC, 1999) based on the assumption that the thermal water enters the aquifer through a north-striking fault zone within the greywacke basement rock of the Waipapa Group (Fig. 2). The existence of this fault zone, however, has not been proven since there is no direct evidence for it at the surface (ARWB, 1980). A pump test conducted in April 1979, revealed a fairly homogeneous composition of the aquifer with a calculated transmissivity of 320 m2 d−1. Due to the high transmissivity value (for a Waitemata Group aquifer) it is assumed that the pathways for the groundwater flow within the aquifer are given by fractures rather than pores, which further form the leakage paths to the hot springs (ARWB, 1980).

Figure 2Conceptual cross-section of the geothermal reservoir at Waiwera, including lithology, bore locations, bore numbers and depths (originally given in ARC 1999 and modified after Kühn and Altmannsberger, 2016).
In addition to the geothermal water that recharges the aquifer from below, two more types of water enter the reservoir. An influx of cold (ambient temperatures in the range of 15–30 ∘C depending on depth), fresh, near-surface groundwater arrives into the aquifer from the west, while seawater intrudes from the foreshore in the east (ARWB, 1980; Kühn and Stöfen, 2005; Fig. 2). The intruding cold groundwater and seawater have the potential to alter the hydraulic conditions of the geothermal reservoir, if the upwelling of thermal water is suppressed. Therefore, the abstraction rates from the reservoir have been monitored since 1986, in accordance with the water allocation and management plan. Furthermore, it is demanded that the water level in the official observation well of the Auckland Council (Fig. 2, well 74) does not fall below a twelve-month average of 0.5 m a.s.l. (above sea level).
2.2 Geological field work
The study area is located on the southern bank of the Waiwera River, between the Wenderholm Regional Park in the north and the Waiwera Hill Scenic Reserve in the south (Fig. 3). It includes the cliff of the Waiwera Hill Scenic Reserve and the outcrops on the shore surrounding it (Fig. 3, southern area with approximately 0.13 km2). Furthermore, the outcrops on the shore north of the Waiwera River around Mahurangi Island and the southern peak of Wenderholm Regional Park (Fig. 3, northern area with approximately 0.5 km2) were studied for additional information about the structural setting. Both areas feature turbiditic sequences of the Waitemata Group (Allen, 2004; Schofield, 1989; Ricketts et al., 1989), which further represent the host rock of the geothermal aquifer below Waiwera (ARWB, 1980; Kühn and Stöfen, 2005).
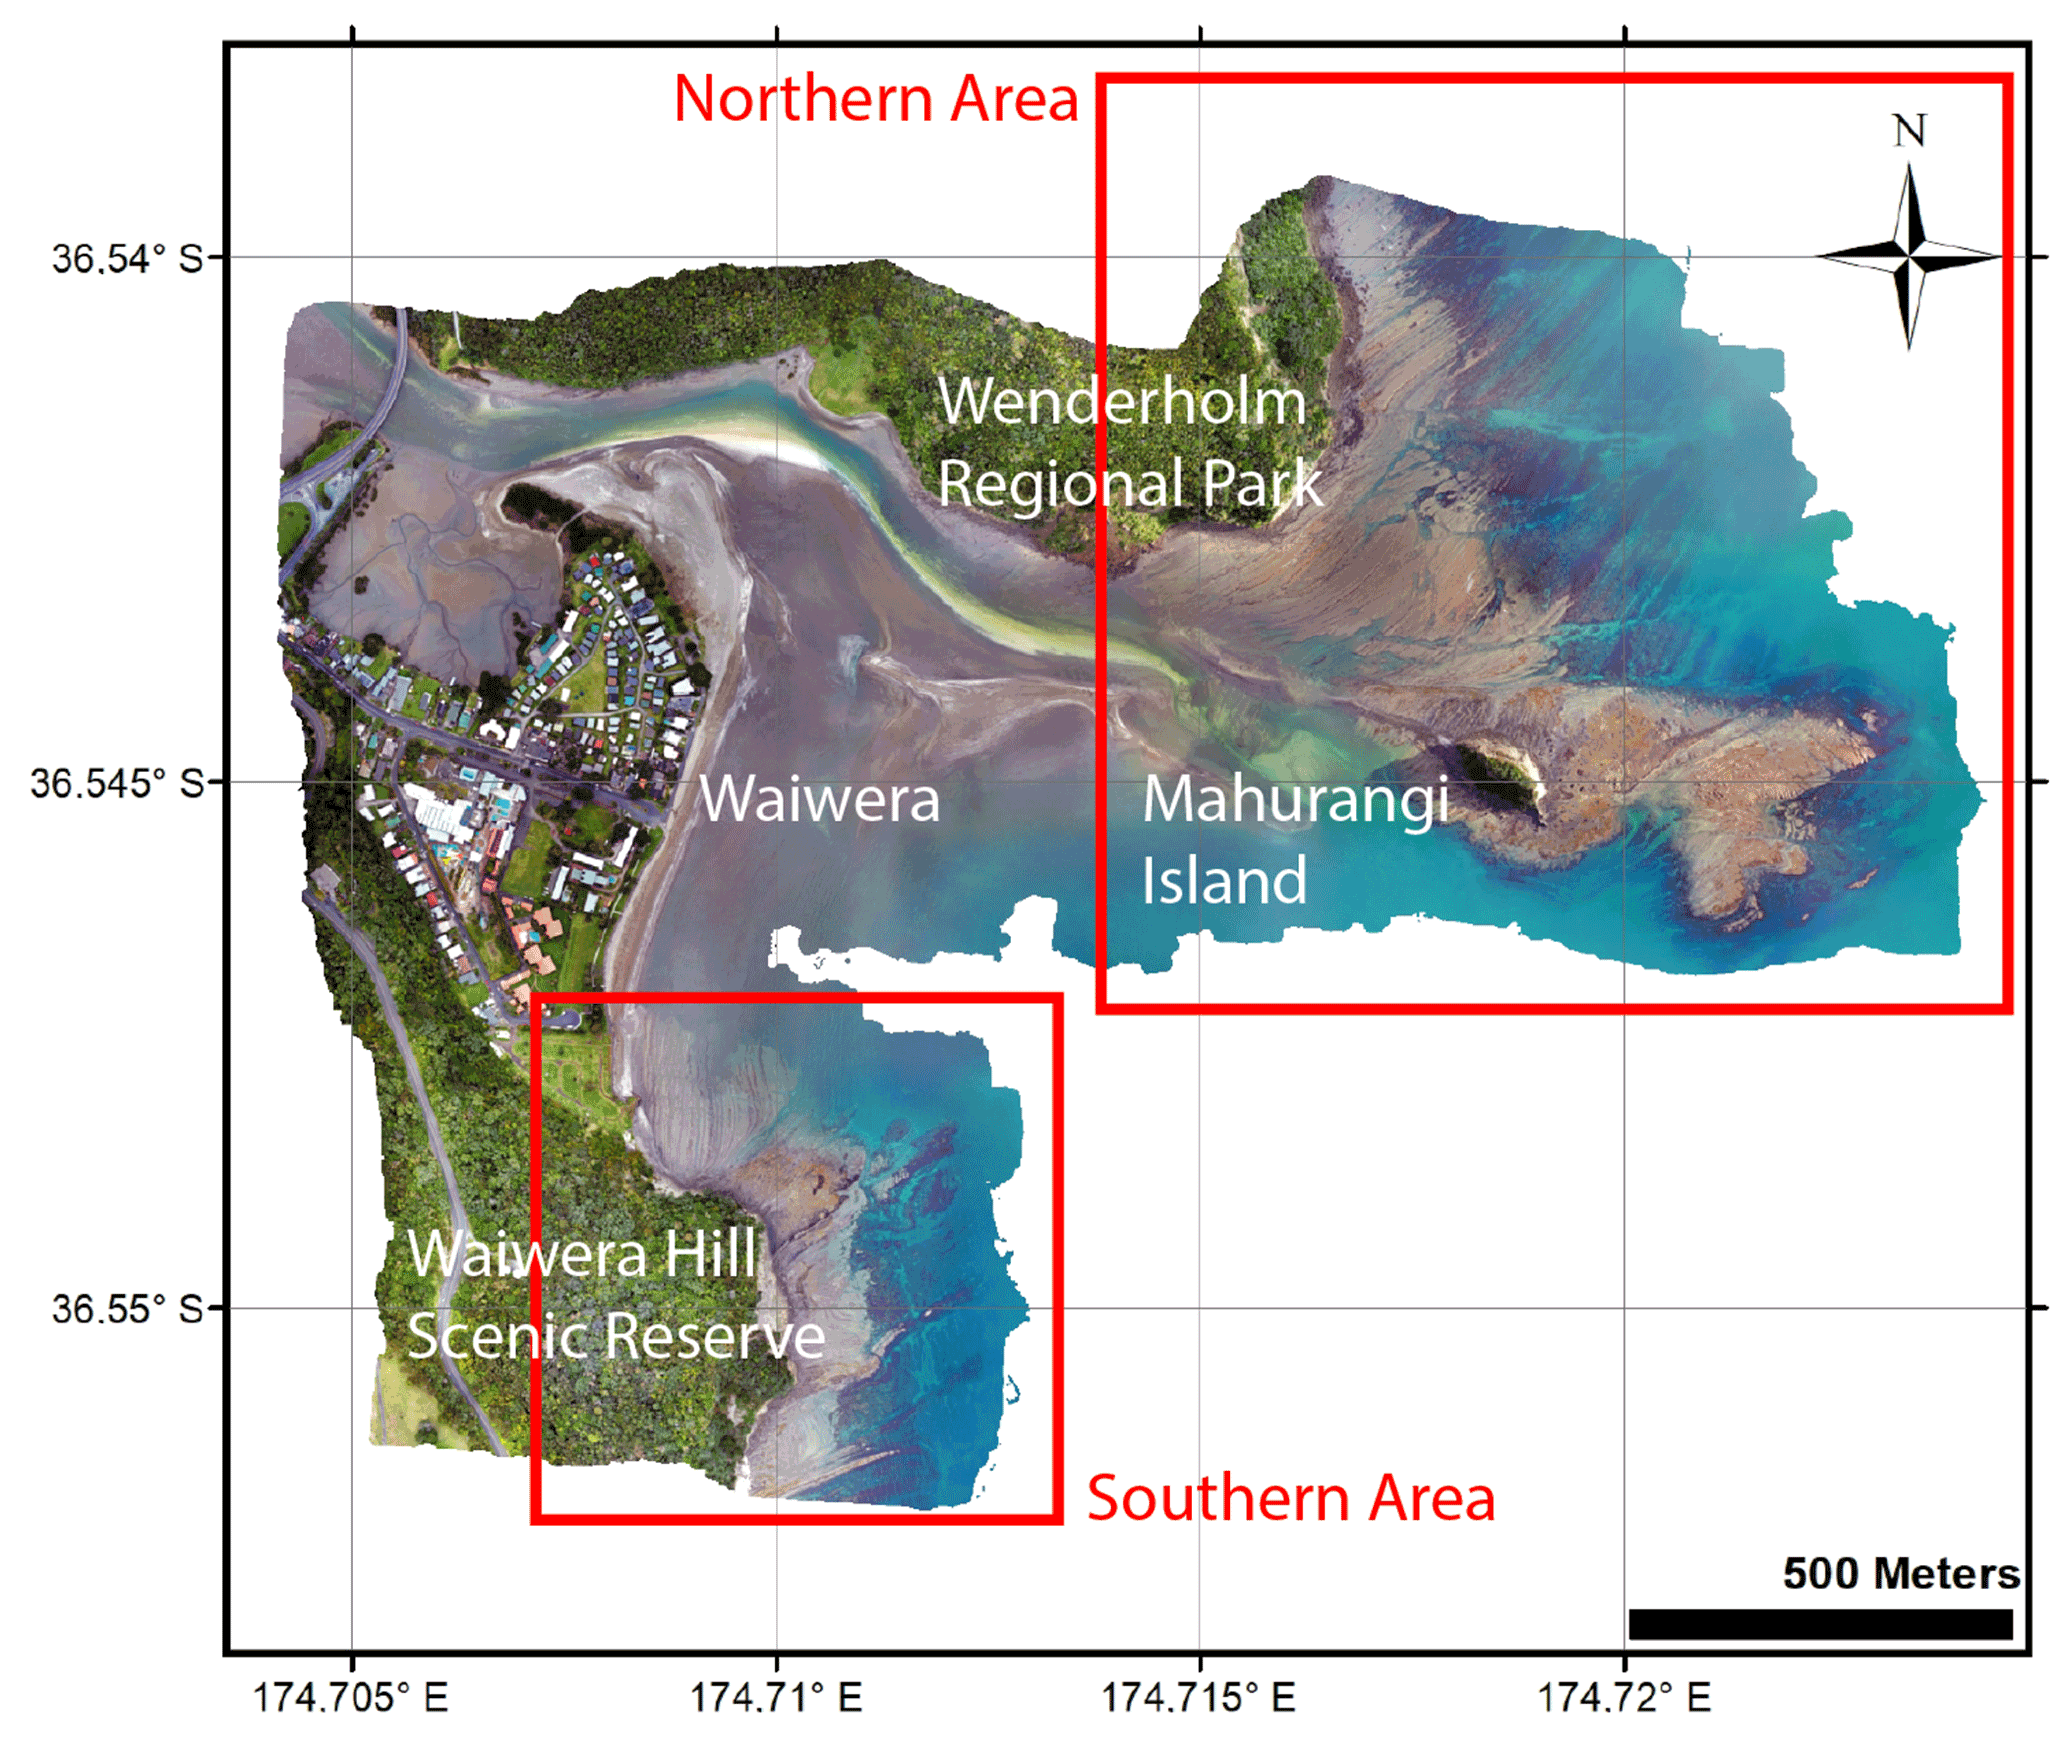
Figure 3Photographic map of Waiwera showing the southern peak of Wenderholm Regional Park, the Waiwera Hill Scenic Reserve, Mahurangi Island and the location of the northern and southern area of study (red rectangles).
The Waiwera Hill Scenic Reserve cliff and the surrounding outcrops at the beachfront of Waiwera were investigated during a two-week long field trip (Präg, 2020). The work included UAV mapping and multiple sketches of the important structural properties of the area such as bedding, faults, folds, fractures and veins, as well as their orientations. For orientation measurements a compass of the type GEKOM PRO by Breithaupt was used and the local declination of 19.69∘ positive east (Magnetic Declination 2020) added to strike and dip directions. A scanline measurement of 134 m was carried out on the outcrops at the beachfront. Working locations, sample locations and important features of the area were marked using a handheld GPS of the type eTrex® 10 by Garmin.
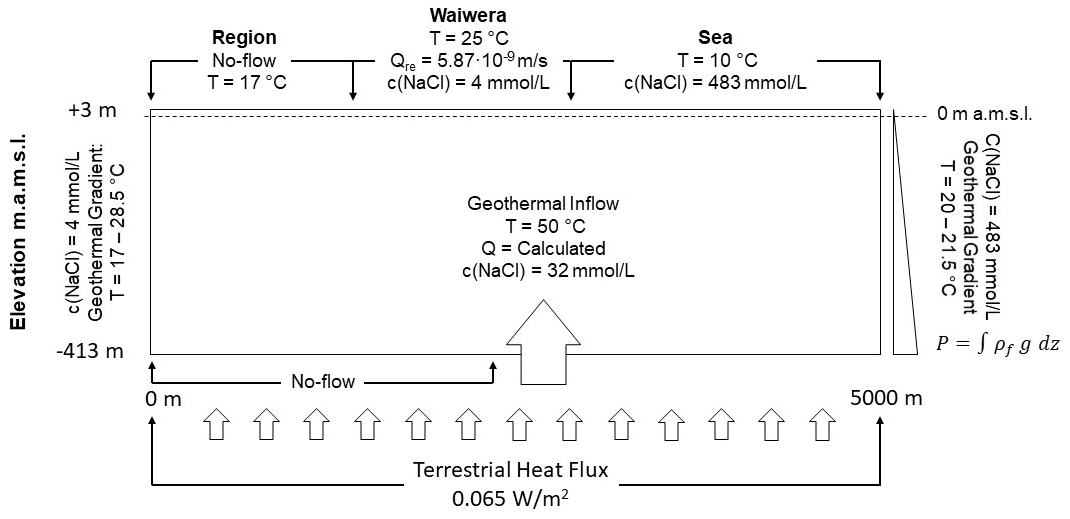
Figure 4Boundary conditions for the 3D Waiwera reference model as applied with TRANSPORTSE (after Kühn and Stöfen, 2005).
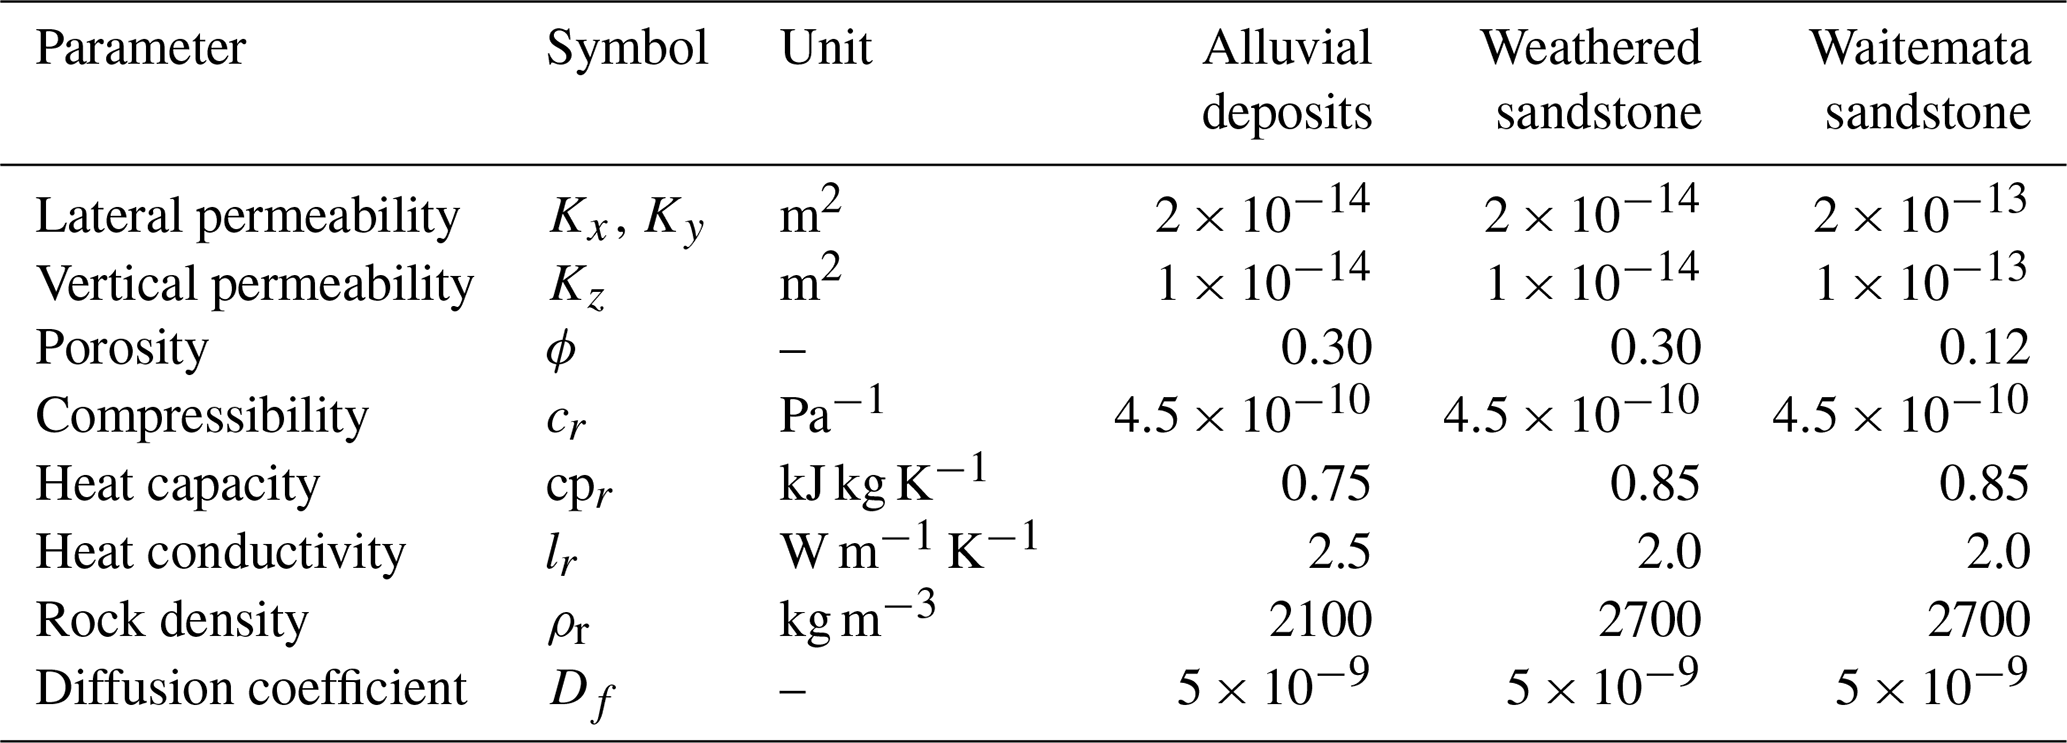
Table 1Initial parameter of the 3D Waiwera numerical model (after Kühn and Stöfen, 2005).
2.3 Hydrogeological model and numerical process simulation
The TRANSPORT Simulation Environment (TRANSPORTSE) was used to carry out the numerical simulations in the present study to reproduce the models of Kühn and Stöfen (2005), because the previously used version of the SHEMAT software package (Clauser, 2003) is not maintained anymore and lacks features that support computational efficiency. TRANSPORTSE is a density-driven flow and transport simulator, considering convective and conductive heat as well as advective, diffusive and dispersive species transport (Kempka et al., 2022). The following model of Waiwera's geothermal field expands on the concept with the main components and mechanisms of heat and mass transport taking place in the hydrothermal reservoir underlying the township as illustrated above (Fig. 2).
Based on the existing SHEMAT models discussed by Kühn and Stöfen (2005), the TRANSPORTSE model has been extended by a salinity-dependent viscosity function utilising the equation of state introduced by Sharqawy et al. (2010) to further improve accuracy. The current model implementation uses the same grid discretisation, boundary conditions, and parameter settings as in the existing model (Kühn and Stöfen, 2005). The boundary conditions employed for the simulation are illustrated in Fig. 4 and the applied flow parameters compiled in Table 1.
The vertical discretisation is in accordance with the given geological layering, namely, the alluvial deposits at the top (13 m, one layer) that overlay weathered sandstone (10 m, two layers) and the Waitemata sandstone down to the bottom of the model (390 m, 10 layers). The greywacke is not parametrised but rather defined as an impermeable boundary. Parameters for the different lithologies are applied accordingly (Table 1).
2.4 Geographic Information System (GIS) for Waiwera
A geographic information system (GIS) is of value for reservoir management because it allows capturing, storing, checking, and displaying data corresponding to discrete positions on the Earth's surface and below. This enables operator and authorities to more quickly detect, analyse, and understand patterns and linkages such as those in the hydrogeological system at Waiwera. Advantage of a GIS is that it can use any data that includes information about locations. Within the presented study, we used QGIS, a free and open-source cross-platform desktop GIS (QGIS 2022, QGIS Geographic Information System, QGIS Association, http://www.qgis.org, last access: 4 November 2022).
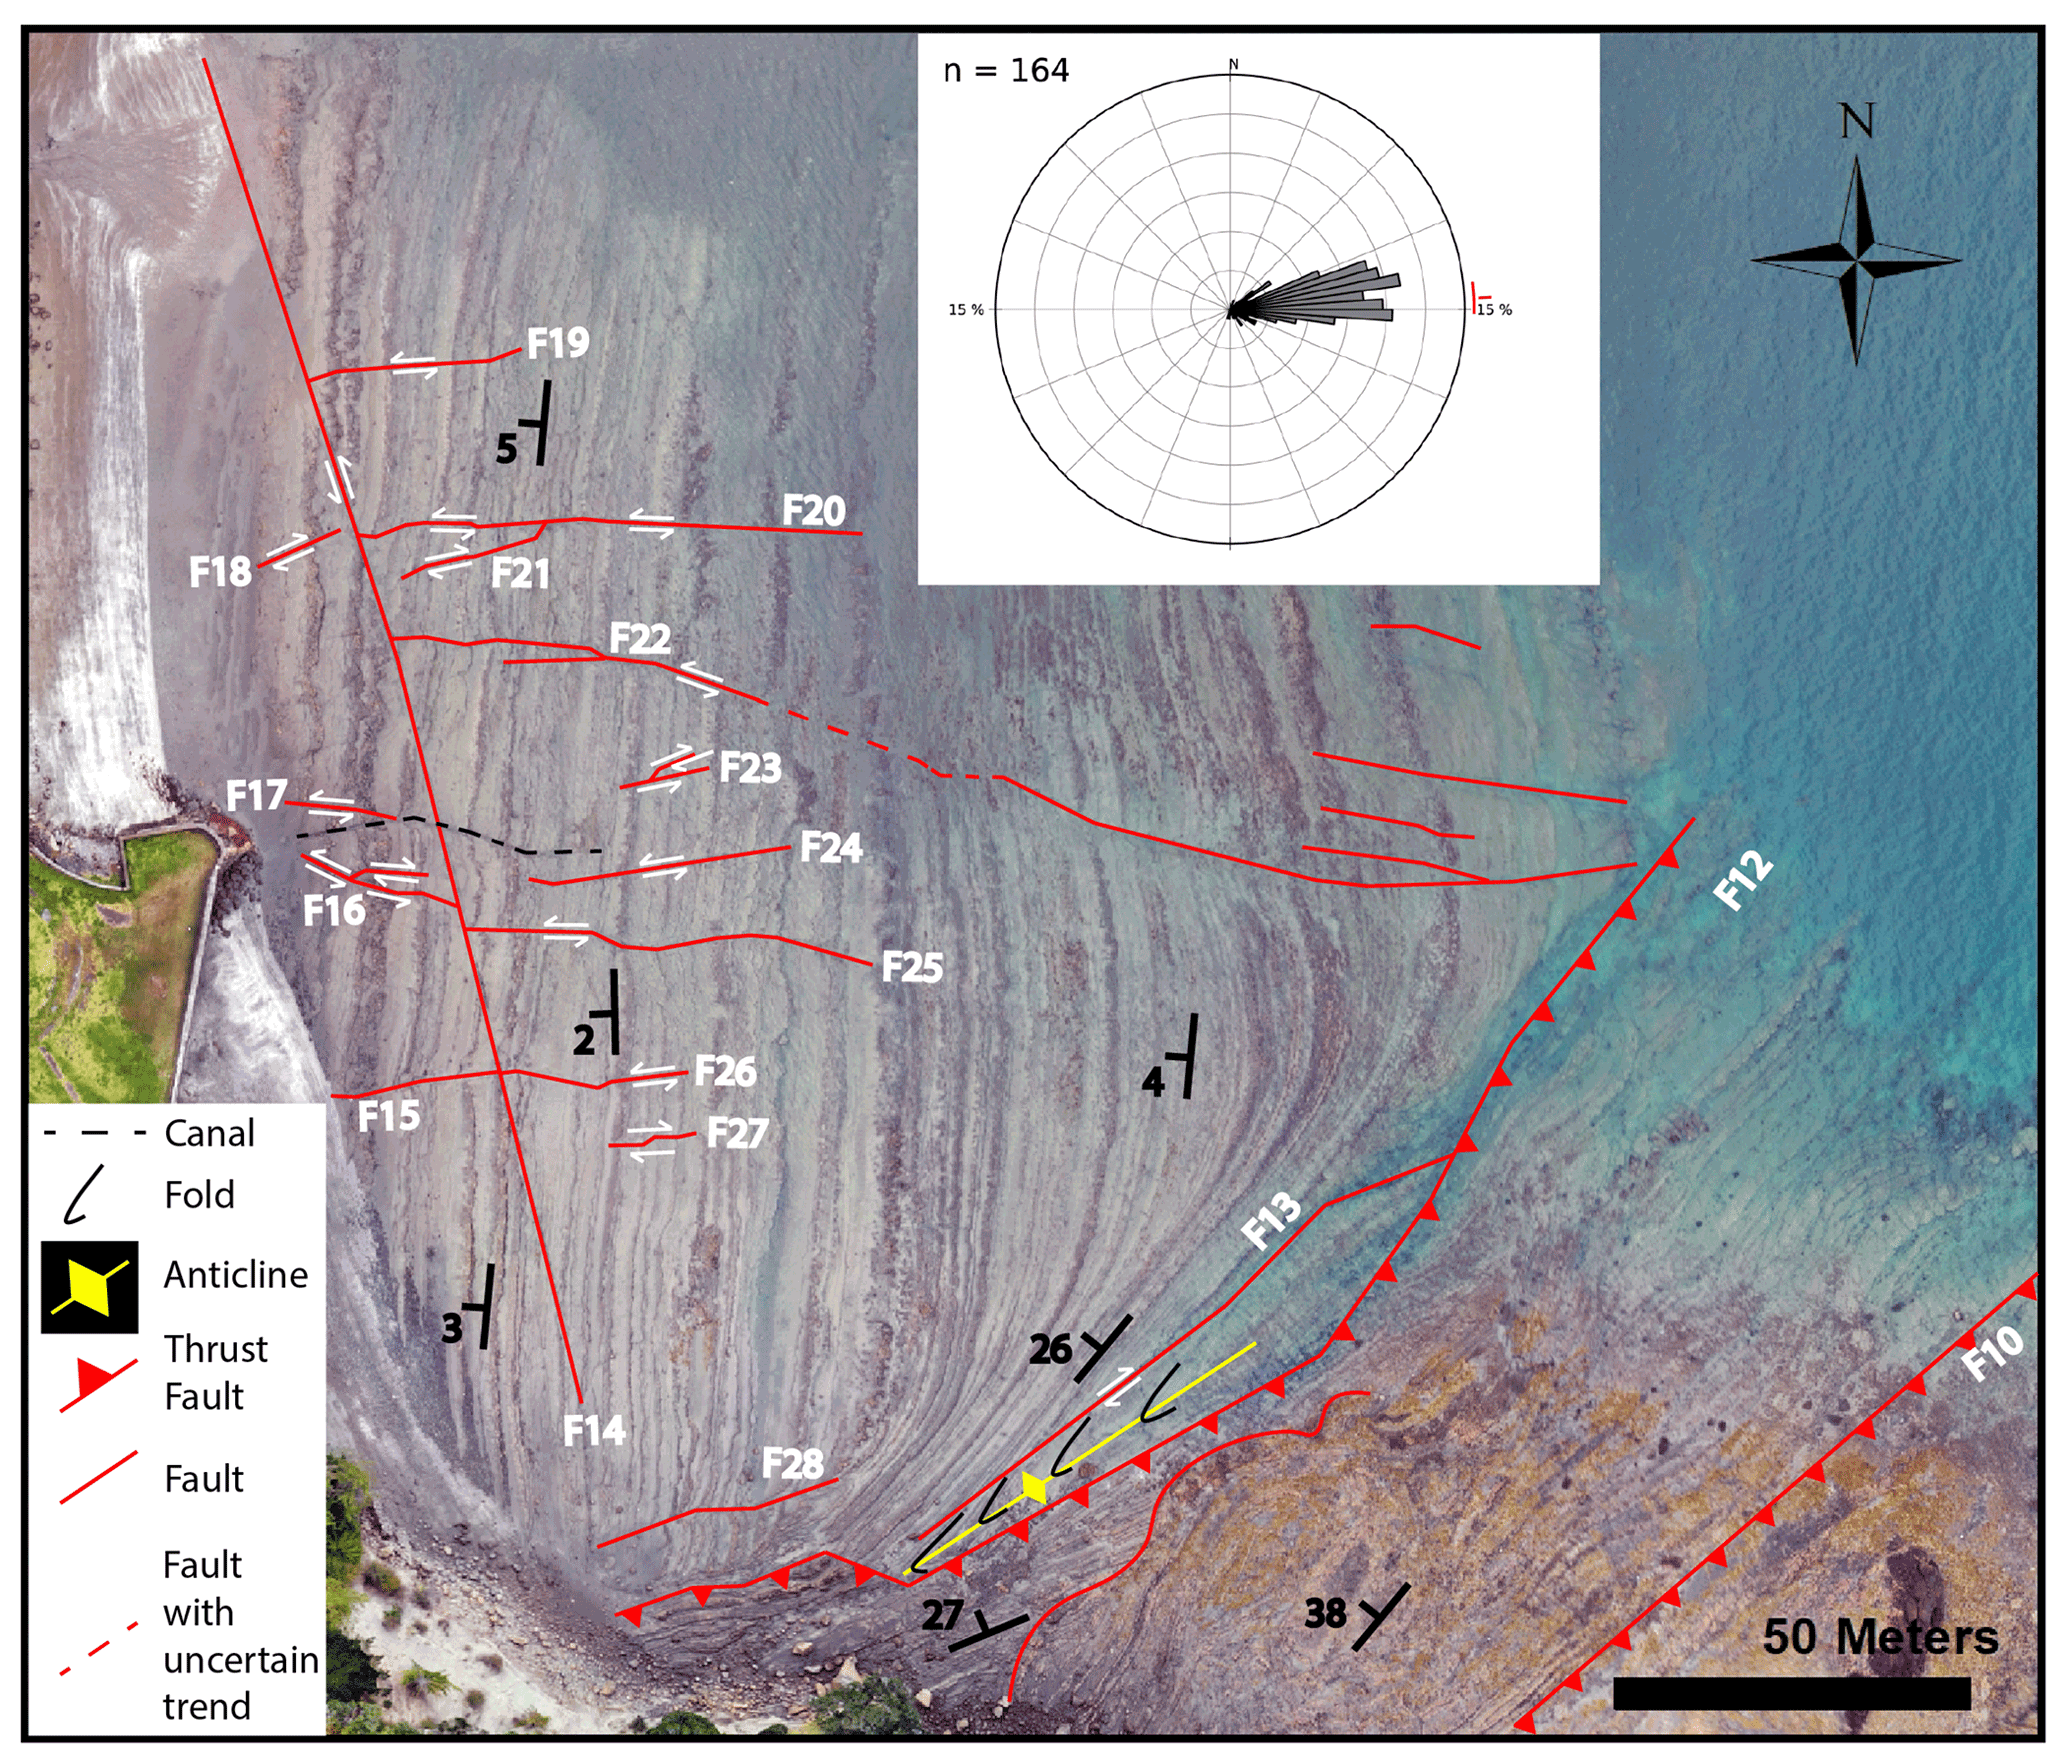
Figure 5Photographic map of the outcrops at the beachfront of Waiwera and the northernmost part of the outcrops around the Waiwera Hill Scenic Reserve cliff. The rose diagram shows the strike orientations of the scanline measurements (n=164; including F14), which are mainly towards the east.
The available information in the form of data from previous studies (especially ARWB, 1980; Kühn and Stöfen, 2005; Kühn and Altmannsberger, 2016; Kühn and Schöne, 2017; Präg et al., 2020) has been extracted and integrated into the new hydrogeological model. Furthermore, geospatial datasets such as groundwater recharge and the delineation of hydrogeological units outcropped at the surface are retrieved from the database by the Ministry for the Environment (MfE, https://environment.govt.nz/, last access: 4 November 2022) of New Zealand and subsequently processed in the system.
The Waiwera Hill Scenic Reserve cliff exposes the Early Miocene Pakiri Formation of the Warkworth Subgroup (Ballance, 1976), showing bathyal turbiditic sequences ranging from clayey siltstones to coarse grained sandstones and an interbedded, distinctly black layer of the Parnell Volcaniclastic Conglomerate (PVC, Shane et al., 2010). Multiple (normal) faults run through the cliff. The proximal submarine fan deposits of the Pakiri Formation at Waiwera contain turbiditic sandstones of varying grain sizes with interbedded pelagic siltstones and a PVC bed with sedimentary rip-up clasts Präg (2020).
The bedding shown in the outcrops at the beachfront dips very gently (∼2 to 5∘) towards the west, except for the beds directly NW of the deformed area between the faults F12 and F13, which dip moderately (∼26∘) towards NW (Fig. 5). There, the outcrops of the beachfront continue into the outcrops around the Waiwera Hill Scenic Reserve cliff, from which they are separated by the fault F12. The southern study area comprises fractures, veins, strike-slip, thrust and normal faults, the latter forming horst and graben structures. All faults visible at the beachfront (F14 to F28, Fig. 5) continue through multiple beds and are strike-slip faults, except for F15 and F28 which do not show clearly distinguishable lateral displacements but vertical displacements are possible. One main orientation is towards E and ENE (F15 to F28), while the other orientation is towards SSE (F14). The dextral strike-slip fault F13 (∼2.5 m displacement) strikes towards NE and appears to be connected to the thrust fault F12 that marks the transition between the outcrops at the beachfront and those around the Waiwera Hill Scenic Reserve cliff (Fig. 5).

Figure 6Comparison of observed temperature profiles (ARWB, 1980) with simulated ones for the near-field boreholes B2, B19, B74 and B9 (top row panels), as well as for the far-field boreholes J. B. Schiska, V. Schiska, Wenderholm and Hillcrest (bottom row panels).
Further manual measurements of the outcrops at Waiwera's beachfront include scanline measurements of 134 m along F14, documenting a total of 163 fractures. Their primary strike orientation is towards the E (143 fractures), with a minority of fractures trending towards the NE (12 fractures) and SE (8 fractures, rose diagram in Fig. 5). All fractures end at F14 emphasising its significance. Most importantly, this confirms F14 (Fig. 5) as one major NNW–SSE structural feature as implemented in the 3D geological models (this study and Kühn and Stöfen, 2005).
Our simulation results show that the documented faults have a significant impact regarding the match of the observed with the simulated temperature profiles in several wells (Fig. 6). For the near field in the vicinity of the Waiwera township, the simulated and observed temperature profiles show a very good agreement, except for the deviations found for the B49 borehole. Here, a linear temperature gradient is observed, while the simulation results suggest that convective heat flow occurs at the borehole location. In the far field, data for the Wenderholm and Hillcrest boreholes are in good agreement and show conductive heat transfer profiles, underlining that they are located outside the active geothermal area (compare Figs. 1 and 7 for bore hole locations; the investigated outcrop is located in between bore holes B74 and Hillcrest). However, deviations between observations and simulations are found for the J. B. Schiska well, where convective heat flow occurs following the simulation results, while a linear temperature gradient was observed. Further, a linear gradient was simulated for the V. Schiska borehole, whereas the observation suggests convective heat flow.
Figure 7a shows the simulated seawater isochlor at a concentration of 40 mmol L−1, indicating that the J. B. Schiska borehole is located in the seawater intrusion region, which also explains the simulated linear temperature gradient at this well. On the contrary, the convective heat flow observed at the V. Schiska borehole cannot be explained by the present model, since the origin of the geothermal water is limited to the N–S trending fault. Hereby, a higher geothermal fluid inflow has been applied to the region below the Waiwera township, resulting in a wider thermal plume as shown in Fig. 7b. In this context, the simulated 38 ∘C isotherm is close to the B49 borehole, resulting in the previously discussed deviation from the observed data.
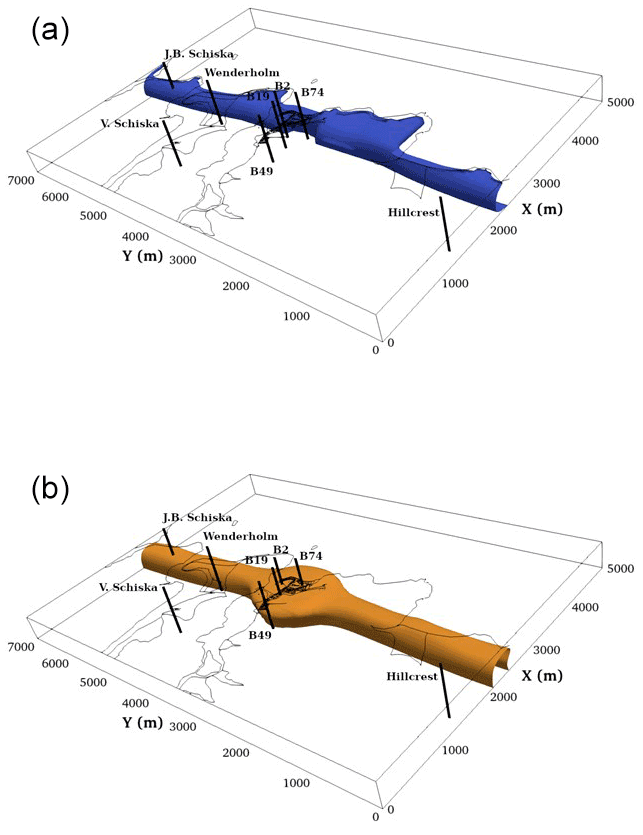
Figure 7Simulated seawater intrusion represented by the 40 mmol L−1 NaCl isochlor (a) and thermal plume originating from the N–S fault system with the 38 ∘C isotherm (b) as well as the relevant observation wells (black lines). The orientation of the x axis is W–E and the y axis S–N with increasing numbers.
The simulation results indicate that further model revisions are required to overcome the deviations between the observed and simulated temperature profiles in three of the eight wells. Especially larger deviations of up to 20 ∘C in the J. B. Schiska well imply that the N–S trending fault might not be present in the northern modelling area or at least might not be hydraulically conductive for the geothermal fluids originating in deeper geological units. For that reason, further modelling studies are under way to improve the agreements between observations and simulations. None of the bore holes were investigated in regard to their recent physical conditions and temperature profiles during the field campaign conducted in 2019. This should be considered for the future.
The geological model of Waiwera presented in this study is based on newly collected data that was compared to previous studies and existing data before being integrated into a GIS. Stratigraphy, depositional environment, mineralogical composition and geological structures of the local Waitemata Group rocks have been analysed. Structural orientations derived by manual and digital measurements agree well with each other.
The tectonic setting at Waiwera represents a local zone of intense deformation within the Waitemata Group. Undeformed bedding dips gently (∼5 to 10∘) westwards. Main fault strike orientations are towards the E, NE and SSE. A major feature in approximately N–S direction provides evidence for the north- and southward extension of the main inflow zone of the geothermal water at the bottom of the reservoir proclaimed earlier. However, the subsurface below Waiwera is complex and barely explored.
The SHEMAT model by Kühn and Stöfen (2005) was revisited and reworked to provide an updated, geospatially accurate and referenced 3D geological model of Waiwera. The new model, which implements geospatial data for the distribution of hydrogeological units at the surface, was successfully plugged into the numerical solver TRANSPORTSE (Kempka et al., 2022), in which coupled processes for fluid flow and heat transport were simulated. While five wells were successfully modelled, simulations revealed to re-assess the extent and geothermal relevance for three wells. Further field campaigns and modelling studies are in the planning phase and ongoing, respectively, to improve the understanding of the complex reservoir geology.
The code is available via Kempka et al. (2022). All input data is given within the paper.
MK and CH conceptualised the field trip. MP and IB did the field work. MK and TK conceptualised the simulation work. AG and TK performed the numerical investigations. MK wrote the original draft and finalised the paper. MP, IB, CH, AG and TK contributed with reviews and editing.
The contact author has declared that none of the authors has any competing interests.
Publisher's note: Copernicus Publications remains neutral with regard to jurisdictional claims in published maps and institutional affiliations.
This article is part of the special issue “European Geosciences Union General Assembly 2022, EGU Division Energy, Resources & Environment (ERE)”. It is a result of the EGU General Assembly 2022, Vienna, Austria, 23–27 May 2022.
We appreciate the constructive comments from Lorna Strachan and an anonymous reviewer.
This publication has been supported by the funding programme “Open Access Publikationskosten” Deutsche Forschungsgemeinschaft (DFG, German Research Foundation) – Project Number 491075472.
The article processing charges for this open-access publication were covered by the Helmholtz Centre Potsdam – GFZ German Research Centre for Geosciences.
This paper was edited by Viktor J. Bruckman and reviewed by Lorna Strachan and one anonymous referee.
Allen, S. R.: The parnell grit beds revisited: Are they all the products of sector collapse of western subaerial volcanoes of the northland volcanic arc?, NZ J. Geol. Geophys., 47, 509–524, https://doi.org/10.1080/00288306.2004.9515073, 2004.
ARC: Waiwera geothermal groundwater resources statement and allocation plan, Technical Publication No. 112, Auckland Regional Council, 1991.
ARC: Waiwera geothermal groundwater resource assessment report, Technical Publication No. 115, Auckland Regional Council, unpublished data, 1999.
ARWB: Waiwera water resource survey – Preliminary water allocation/management plan, Tech. Publ., 17, Auckl. Reg. Water Board, unpublished data, 1980.
ARWB: Waiwera thermal groundwater allocation and management plan 1986, Technical Publication No. 39, Auckland Regional Water Board, unpublished data, 1987.
Ballance, P. F.: Stratigraphy and bibliography of the waitemata group of auckland, new zealand, NZ J. Geol. Geophys., 19, 897–932, https://doi.org/10.1080/00288306.1976.10420746, 1976.
Bréthaut, D.: Numerical modelling of the Waiwera geothermal system, Project report – GEOTHERM 689, The University of Auckland, unpublished data, p. 35, 2009.
Clauser, C.: Numerical Simulation of Reactive Flow in Hot Aquifers, Springer, Berlin, Heidelberg., p. 332, ISBN 978-3-642-55684-5, 2003.
Grafe, A.: Revised hydrogeological model of the hydrothermal system Waiwera (New Zealand), MS thesis, Freie Universität Berlin, Berlin, p. 101, unpublished data, 2021.
Kempka, T., Steding, S., and Kühn, M.: Verification of TRANSPORT Simulation Environment coupling with PHREEQC for reactive transport modelling, Adv. Geosci., 58, 19–29, https://doi.org/10.5194/adgeo-58-19-2022, 2022.
Kühn, M. and Altmannsberger, C.: Assessment of data driven and process based water management tools for the geothermal reservoir Waiwera (New Zealand), Energy Proced., 97, 403–410, https://doi.org/10.1016/j.egypro.2016.10.034, 2016.
Kühn, M. and Grabow, L.: Deconvolution well test analysis applied to a long-term data set of theWaiwera geothermal reservoir (New Zealand), Adv. Geosci., 56, 107–116, https://doi.org/10.5194/adgeo-56-107-2021, 2021.
Kühn, M. and Schöne, T.: Multivariate regression model from water level and production rate time series for the geothermal reservoir Waiwera (New Zealand), Energy Proced., 125, 571–579, https://doi.org/10.1016/j.egypro.2017.08.196, 2017.
Kühn, M. and Schöne, T.: Investigation of the influence of earthquakes on the water level in the geothermal reservoir of Waiwera (New Zealand), Adv. Geosci., 45, 235–241, https://doi.org/10.5194/adgeo-45-235-2018, 2018.
Kühn, M. and Stöfen, H.: A reactive flow model of the geothermal reservoir Waiwera, New Zealand, Hydrogeol. J., 13, 606–626, https://doi.org/10.1007/s10040-004-0377-6, 2005.
Präg, M.: Geothermal reservoir characterization of faulted and folded turbidite sequences, Waiwera, New Zealand, MS thesis, KIT – Karlsruhe Institute of Technology, Karlsruhe, unpublished data, p. 86, 2020.
Präg, M., Becker, I., Hilgers, C., Walter, T. R., and Kühn, M.: Thermal UAS survey of reactivated hot spring activity in Waiwera, New Zealand, Adv. Geosci., 54, 165–171, https://doi.org/10.5194/adgeo-54-165-2020, 2020.
Ricketts, B. D., Ballance, P. F., Hayward, B. W., and Mayer, W.: Basal Waitemata Grouplithofacies: rapid subsidence in an early Miocene interarc basin, New Zealand, Sedimentology, 36, 559–580, https://doi.org/10.1111/j.1365-3091.1989.tb02086.x, 1989.
Schofield, J. C.: Geological Map of New Zealand – Helensville and Whangaparaoa, GNS Science, New Zealand, https://shop.gns.cri.nz/m501/ (last access: 4 November 2022), 1989.
Shane, P., Strachan, L. J., and Smith, I.: Redefining the Waitemata Basin, New Zealand: A new tectonic, magmatic, and basin evolution model at a subduction terminus in the SW Pacific, Geochem. Geophy. Geosy., 11, 1–23, https://doi.org/10.1029/2009GC002705, 2010.
Sharqawy, M. H., Lienhard V, J. H., and Zubair, S. M.: Thermophysical properties of seawater: A review of existing correlations and data, Desalin. Water Treat., 16, 354–380, https://doi.org/10.5004/dwt.2010.1079, 2010.
Somogyvári, M., Kühn, M., and Reich, S.: Reservoir-scale transdimensional fracture network inversion, Adv. Geosci., 49, 207–214, https://doi.org/10.5194/adgeo-49-207-2019, 2019.