 | 08 Oct 2021
Reactive transport model of kinetically controlled celestite to barite replacement
Maria Wetzel
Marco De Lucia
Michael Kühn
Barite formation is of concern for many utilisations of the geological subsurface, ranging from oil and gas extraction to geothermal reservoirs. It also acts as a scavenger mineral for the retention of radium within nuclear waste repositories. The impact of its precipitation on flow properties has been shown to vary by many orders of magnitude, emphasising the need for robust prediction models. An experimental flow-through column setup on the laboratory scale investigating the replacement of celestite (SrSO4) with barite (BaSO4) for various input barium concentrations was taken as a basis for modelling. We provide here a comprehensive, geochemical modelling approach to simulate the experiments. Celestite dissolution kinetics, as well as subsequent barite nucleation and crystal growth were identified as the most relevant reactive processes, which were included explicitly in the coupling. A digital rock representation of the granular sample was used to derive the initial inner surface area. Medium (10 mM) and high (100 mM) barium input concentration resulted in a comparably strong initial surge of barite nuclei formation, followed by continuous grain overgrowth and finally passivation of celestite. At lower input concentrations (1 mM), nuclei formation was significantly less, resulting in fewer but larger barite crystals and a slow moving reaction front with complete mineral replacement. The modelled mole fractions of the solid phase and effluent chemistry match well with previous experimental results. The improvement compared to models using empirical relationships is that no a-priori knowledge on prevailing supersaturations in the system is needed. For subsurface applications utilising reservoirs or reactive barriers, where barite precipitation plays a role, the developed geochemical model is of great benefit as only solute concentrations are needed as input for quantified prediction of alterations.
- Article
(3606 KB) - Full-text XML
- BibTeX
- EndNote


Utilised subsurface systems are often affected by continuous changes in rock properties due to water-rock-interaction. There are applications, where mineral precipitation or dissolution induced rock alterations are intended, e.g., in reactive barriers for nuclear waste repositories (Curti et al., 2019). In other cases, they are an unwanted side effect, for example, barite scalings in geothermal systems or during oil and gas extraction, where they can induce a massive loss of injectivity or productivity (Tranter et al., 2020). A comprehensive understanding of the reactive processes taking place is crucial, so they can be incorporated into prediction models that anticipate and quantify the behaviour of the system, paving the way for a successful utilisation. As opposed to commonly applied empirical formulations for describing rock property alterations, process-based models are more robust and flexible. In order to develop reactive transport models that are applicable to a broad range of boundary conditions and scenarios, it is necessary to identify, parametrise and calibrate the relevant processes with the aid of laboratory experiments.
A recent experimental study investigated the role of barite supersaturation on its precipitation mechanisms caused by concurrent celestite dissolution (Poonoosamy et al., 2020). To this aim, quasi one-dimensional flow-through column experiments were conducted, providing insights into pore-scale evolution during mineral exchange reactions. Three different orders of magnitudes of barite supersaturation were applied, where each caused different precipitation patterns. The authors identified barite nucleation as a key process that becomes increasingly relevant at higher supersaturations. Nuclei formation increases exponentially with supersaturation, and in turn creates reactive surface area for consecutive crystal growth (Lasaga, 1998). Thus, at high input concentrations, a passivation effect occurred due to complete or partial coverage of the celestite grains, preventing any further dissolution. At low input concentrations, nucleation played a lesser role, enabling the replacement reaction to take place. The authors tested the validity of conceptual models to describe precipitation induced reactive surface area development together with celestite dissolution kinetics and barite equilibrium reactions. They concluded that a single empirical relationship is insufficient, but rather two or more are needed to represent the observed responses at all input concentrations. However, it remains open which saturation threshold is to be used for switching instances, and how transition ranges should be treated.
In this study, we provide a comprehensive geochemical modelling approach to match the reported experimental responses. A digital rock representation of the granular celestite sample was applied. The derived rock properties were then used as initial conditions for one-dimensional reactive transport simulations. Next to bulk dissolution and precipitation kinetics, process-based heterogeneous nucleation applying classical nucleation theory and geometrical crystal growth were considered in the coupling. The modelled mineral phase volume fractions in the column and effluent chemistry were compared to the experimental results.
2.1 Experimental setup
A detailed description of the considered laboratory experiment is given in Poonoosamy et al. (2020). The flow-through core experiment consisted of a granular celestite section (11 mm) enclosed by granular quartz sections on both ends (17 and 4 mm, respectively). Each cylindrical section was filled up with respective grains and then packed to attain a target porosity of 46 %. The core diameter is 10 mm, thus it can be assumed to be a one-dimensional problem. In three such columns, BaCl2-solutions with concentrations of 100, 10, and 1 mM, respectively, were injected for a duration of 500 h. Temperature and pressure were constant 25 ∘C and 0.1 MPa, respectively. Initial pH was reported to be 5.6. The influent is undersaturated with respect to celestite, causing celestite to dissolve. Due to the release of -ions into solution the fluid becomes supersaturated with respect to barite, causing barite to precipitate. The injection flow rate Q was kept constant at . The chemical composition (Ba2+, Cl−, Sr2+, ) of the effluent was measured multiple times over the course of the experiment duration. After the injection period, the columns were cut into slices to investigate the chemical and structural alterations in the porous sections.
2.2 Reactive transport modelling
One-dimensional reactive transport simulations were carried out using the phreeqc (Parkhurst and Appelo, 2013) software code (version 3.6.2) to model the experiment. The input scripts are provided in the supplementary data and model repository (Tranter, 2021b). Only the enclosed celestite section was considered, as the quartz sections were assumed to be unreactive. The model domain was discretised into a regular grid of 30 elements each with a length of 0.37 mm (Fig. 1).
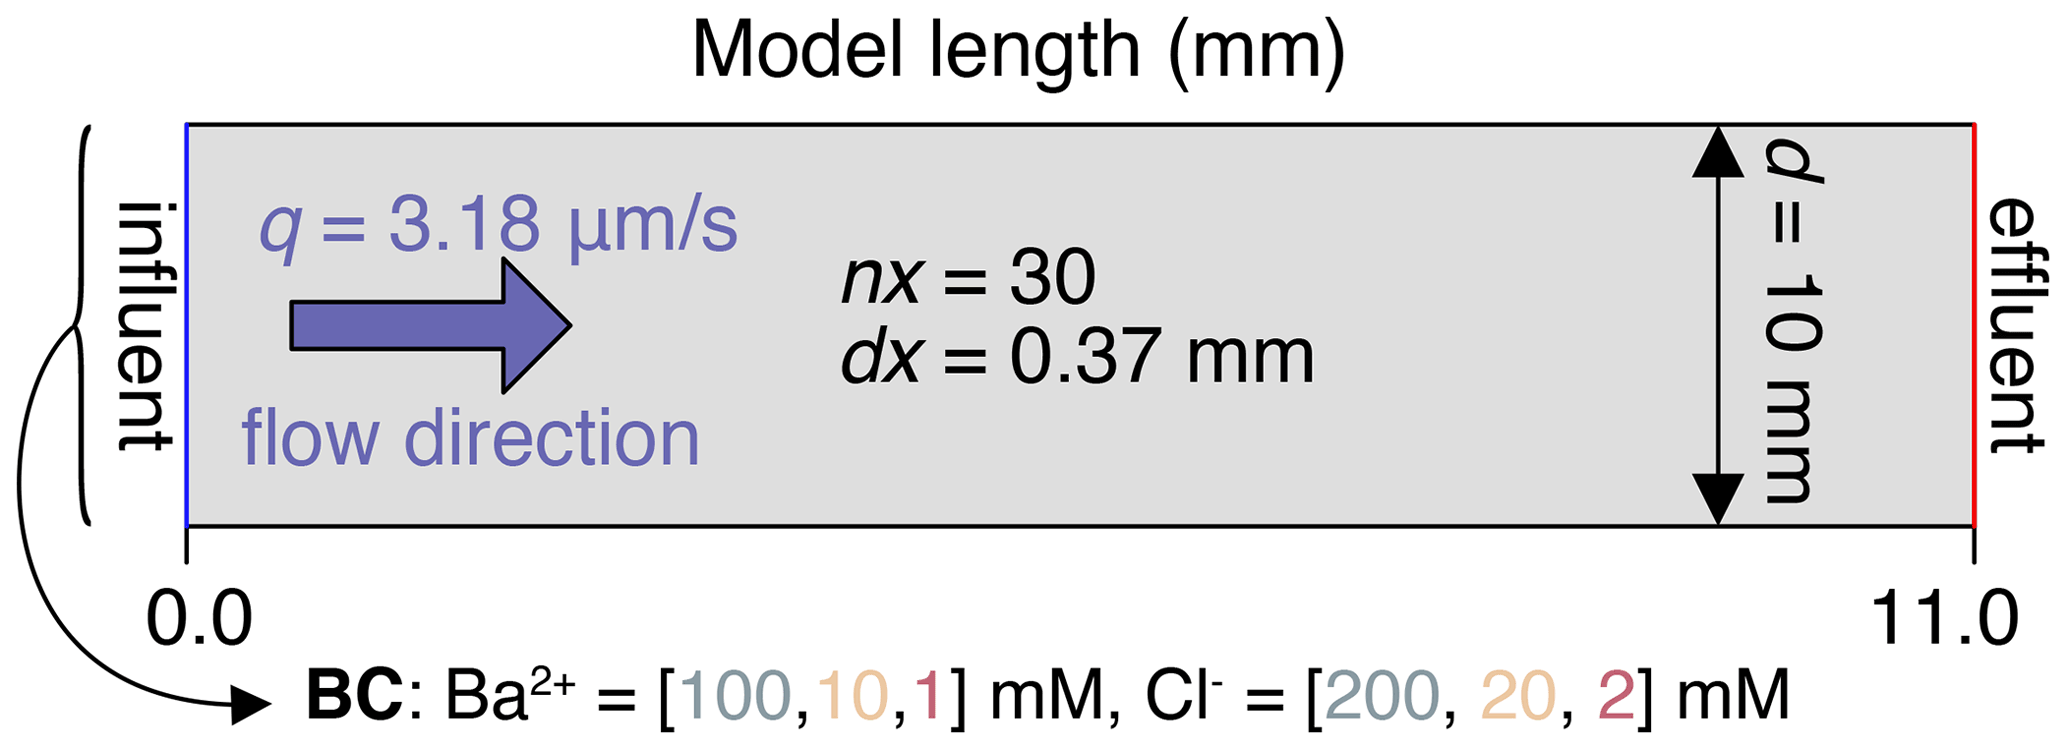
Figure 1Numerical setup of the simulations based on the laboratory experiment from Poonoosamy et al. (2020). Initial conditions in the column are φ=0.46, , , (this study), , , , . BC shows the boundary conditions of the flux inflow.
Flow velocity q was set to a constant value of 3.18 µm/s.
Feedback of porosity changes to pore flow velocity was not considered, as the final porosity decrease in the experiments from 0.46 to 0.43 only has a negligible influence. Diffusion was disregarded for solute transport as it is an advection-dominated system (Peclet number ≫1). At each integration step, phreeqc calculates transport then kinetics in serial. In addition, nucleation and crystal growth were calculated in between advection and kinetics steps, altering the reactive surface areas. The reactive processes are shown schematically in Fig. 2.
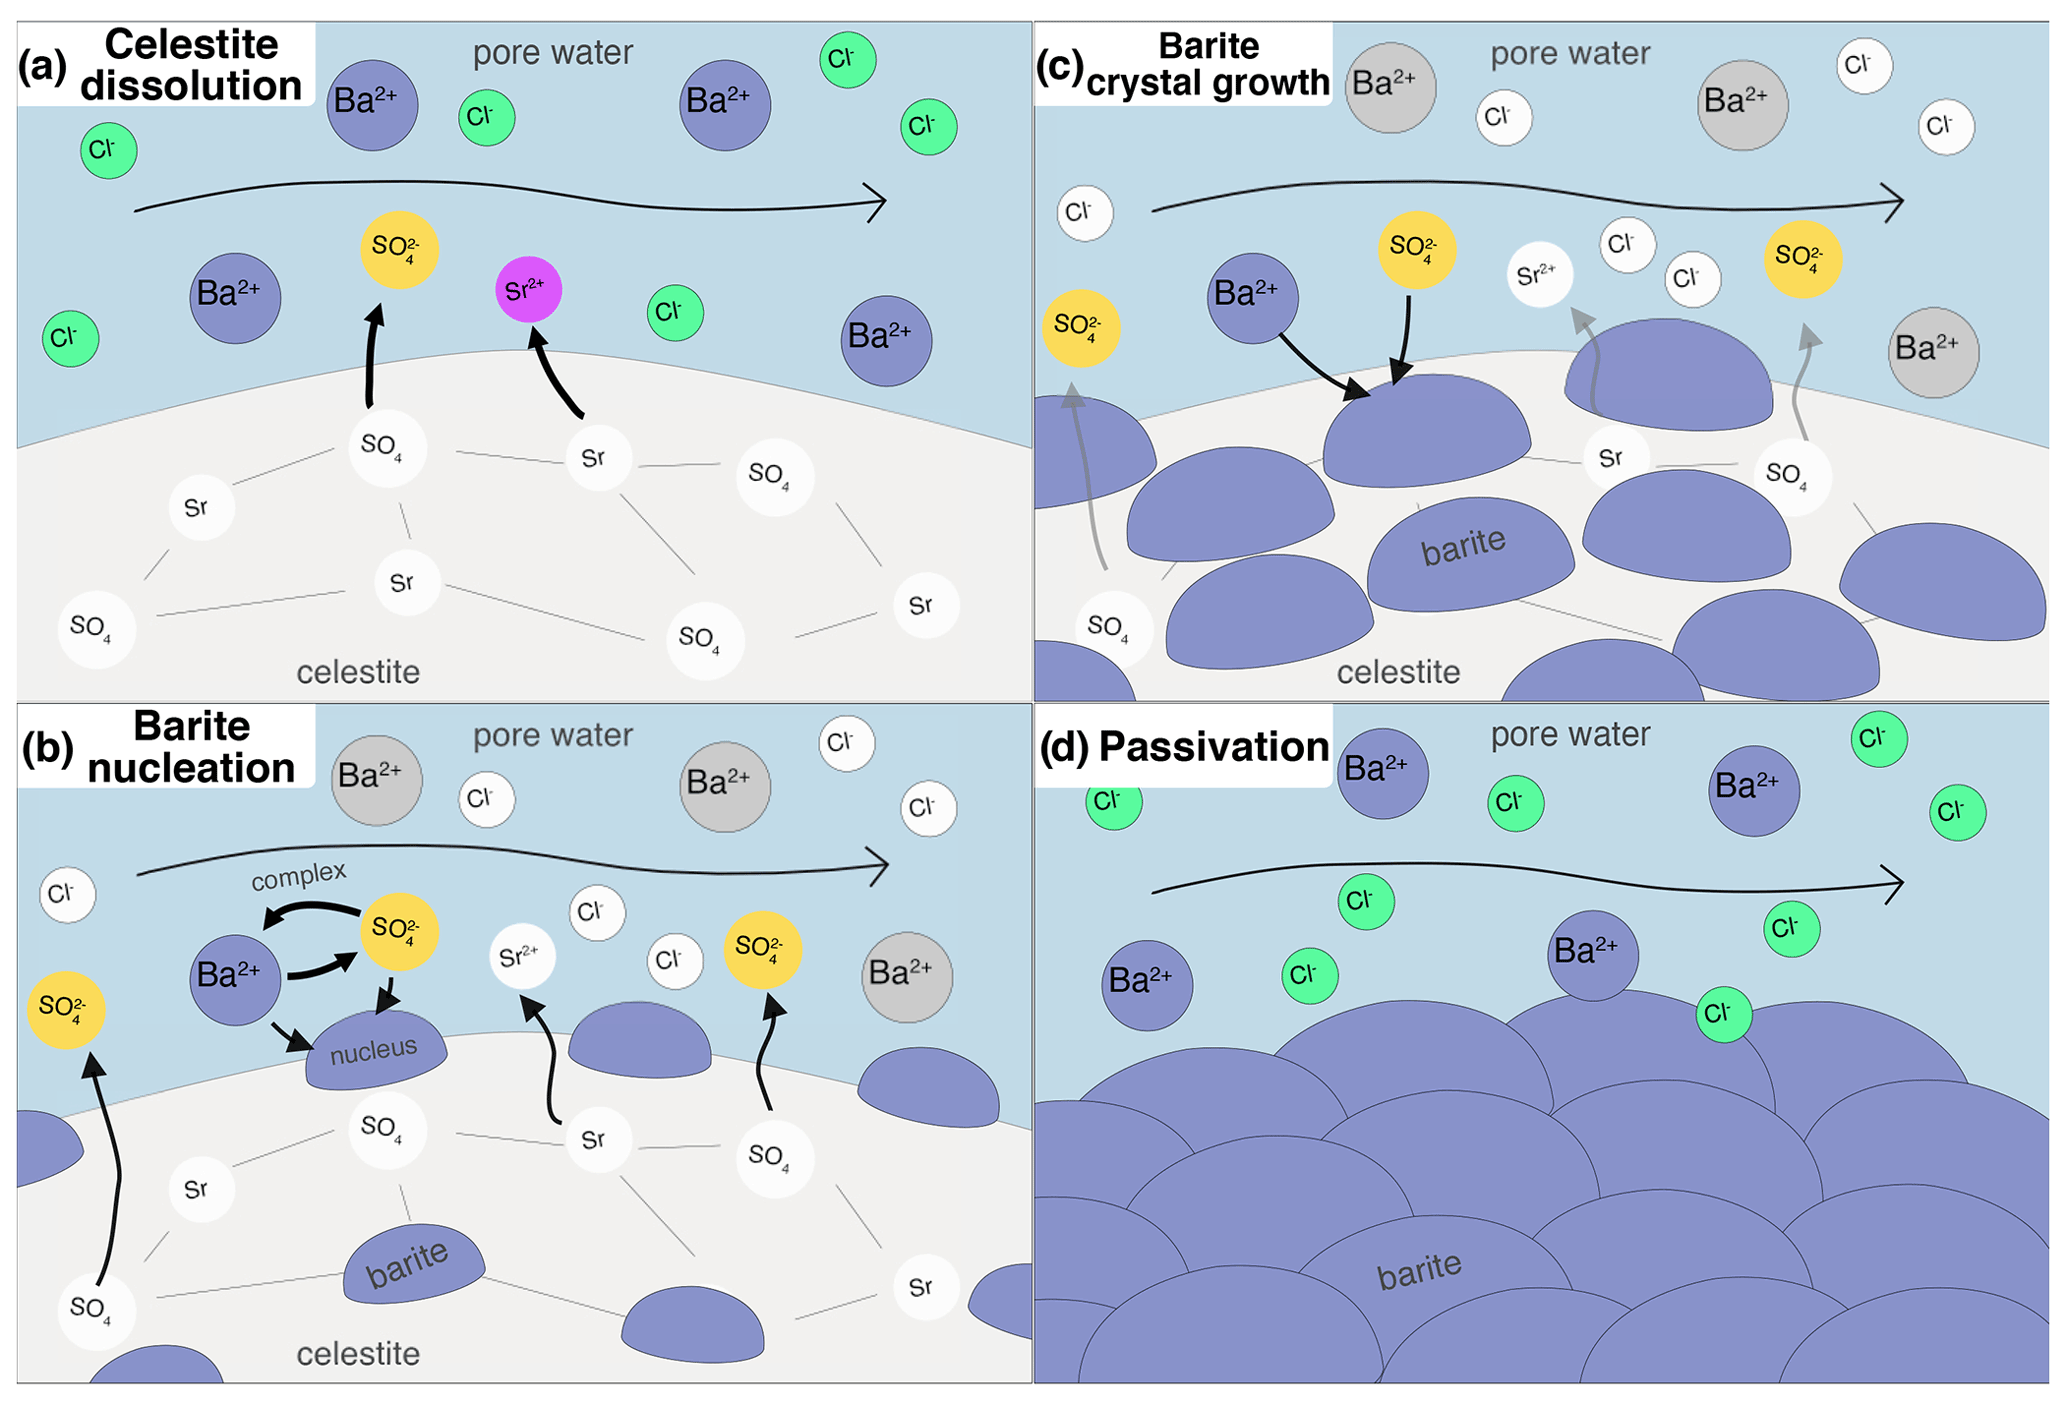
Figure 2Conceptual illustration of the considered processes in the reactive transport simulations. (a) Celestite dissolves after BaCl2 solution is injected into the column, as the solution is undersaturated with respect to celestite. (b) Heterogeneous barite nucleation on celestite substrate sets in after a barite supersaturation threshold is exceeded. The more celestite dissolves, the more sulfate is in solution, increasing barite supersaturation. (c) Creation of barite reactive surface area causes bulk precipitation to happen and the precipitated nuclei to grow. (d) When nucleation and crystal growth are fast, the celestite substrate may overgrow with barite crystals, leading to a passivation of the system.
2.2.1 Digital celestite sample
To determine the initial inner surface area of the celestite sample, a well sorted granular sample was generated exhibiting a grain size equivalent to the laboratory experiment. Therefore, the discrete element method (DEM) of Al Ibrahim et al. (2019) is applied. This approach considers interactions between individual particles, which are successively deposited under the influence of gravity. Combined with an additional grain cementation, this method enables to construct virtual sandstone samples with granulometric, hydraulic and elastic properties equivalent to those of the natural sample (Wetzel et al., 2020, 2021). The geometry of the DEM is converted into a digital image comprising a rectangular uniform grid, in order to compute geometrical properties and perform additional grain pack alterations. The porosity of the very well sorted grain pack is with 38 % considerably lower than that of the celestite sample from Poonoosamy et al. (2020). For the reason of comparability, grain sizes of the deposited grain pack are uniformly reduced until the porosity of 46 % is achieved. Finally, the constructed virtual sample (Fig. 3) comprises 3198 individual grains with a mean diameter of 42 µm. The inner surface area of is determined using MorphoLibJ (Legland et al., 2016).

Figure 3(a) Three dimensional virtual sample of well sorted celestite grains with a mean grain diameter of 42 µm is used to determine the inner surface area. (b) Two-dimensional slice through the virtual celestite grain pack (red plane in a).
2.2.2 Kinetics
Reaction kinetics for celestite dissolution and barite precipitation were taken into account. Solid-solutions were not taken into account. Dissolution of celestite and the successive release of into solution causes barite to precipitate (Fig. 2):
Reaction rates are calculated using a general kinetics rate law for both dissolution and precipitation based on transition state theory (Lasaga, 1998):
where is the rate of a mineral phase m, SA (m2) is the reactive surface area, is the rate constant, and SR (–) is the saturation ratio, i.e., the ratio of the ion activity product of the reacting species and the solubility constant.
The saturation ratio is calculated with phreeqc using the provided phreeqc.dat database.
The dissolution rate constant of celestite is calculated at each kinetic step following the approach of Palandri and Kharaka (2004), using data from Dove and Czank (1995).
For calculating the precipitation rate constant of barite, a linear regression was used that accounts for temperature and ionic strength, which have been shown to have a significant impact (Tranter et al., 2021a; Zhen-Wu et al., 2016):
where T (K) is the temperature and I (M) is the ionic strength of solution.
2.2.3 Nucleation
Classical nucleation theory was applied to calculate heterogeneous formation of barite on celestite substrate. Nucleation describes the spontaneous formation of stable clusters of a supersaturated phase. The formation of nuclei has the following impacts on reactive transport: (1) reactive surface area of the nucleating phase is created, which increases the subsequent precipitation rate, (2) minor amount of phase substance is precipitated, (3) substrate area is covered and therefore its reactive surface area is decreased (Fig. 2b).
Here, we followed the approach as reported in Prieto (2014) and Tranter et al. (2021a). The heterogeneous nucleation rate is calculated with
with the bulk free energy change (J)
where is a pre-exponential factor, θ is the fitted contact angle of a nucleus and the substrate, β is a shape factor for spherical nuclei (), γ is the interfacial tension of the nucleating phase set to (Prieto, 2014), is the molar volume of the nucleating phase set to (phreeqc.dat), is the gas constant, is Boltzmann's constant, T (K) is the temperature, and SR is the saturation ratio.
The pre-exponential factor accounts for the attachment rate of monomers to a sub-critical nucleus:
with the Zeldovic factor
where is a fitting factor, Dm is the molecular diffusion coefficient set to , is the number of nucleation sites on the substrate (), is the number of available monomers in solution, and nc is the number of monomers in a critical nucleus. As a precursor for nucleation, the neutral complex [BaSO4]0 was chosen, which was calculated with phreeqc at each time step. The radius of a spherical, critical nucleus is calculated with
and its respective interfaces with the solution and the substrate are
where Vc is the volume of a monomer (). The changes in reactive surface areas were calculated at each time step for the nucleating and substrate phase:
For the following crystal growth step, the mean nucleus radius and total amount of nuclei in a cell were tracked. Only one mean nucleus size was taken into consideration for each cell. The precipitated phase amount in nuclei was taken into consideration and added to the system.
2.2.4 Crystal growth
Crystal growth was implemented as the homogeneous, three-dimensional spatial growth of barite nuclei. The basic geometry of a sphere cap nucleus was maintained, i.e., contact angle θ was kept constant, and only its radius was increased based on the added volume from bulk precipitation kinetics.
In practical terms, the radius of a sphere-cap corresponds to a crystal height – or a rim thickness if we consider the overgrowth of a substrate material – which can be calculated with:
The mean nucleus volume in a cell at a time step i was calculated with its radius of the previous time step and the amount of newly precipitated phase volume from bulk precipitation.
The new corresponding mean nucleus radius rN,i was saved for consecutive nucleation and crystal growth steps. The change of nucleus-solution and nuclei-substrate interfaces, as well as the total reactive surface areas of barite and celestite can then be derived:
Crystal growth was skipped if the celestite surface was completely covered (SAcelestite=0).
For matching the results of the reactive transport simulations with the experimental data, only the nucleation process was calibrated manually. By adjusting θ and Γ0 to 32∘ and , these were found to be the best matching values to reproduce the experimental data with respect to effluent chemistry and mineral substance amount in the column. The results of the simulations using these parameters are presented in the following.
3.1 Nucleation and crystal growth
The amount of nuclei and mean rim thicknesses were tracked for each cell. They are shown for all experiments for the length of the column after the experiment in Fig. 4a–b and for the first cell over the course of the experimental duration in Fig. 5a–b.
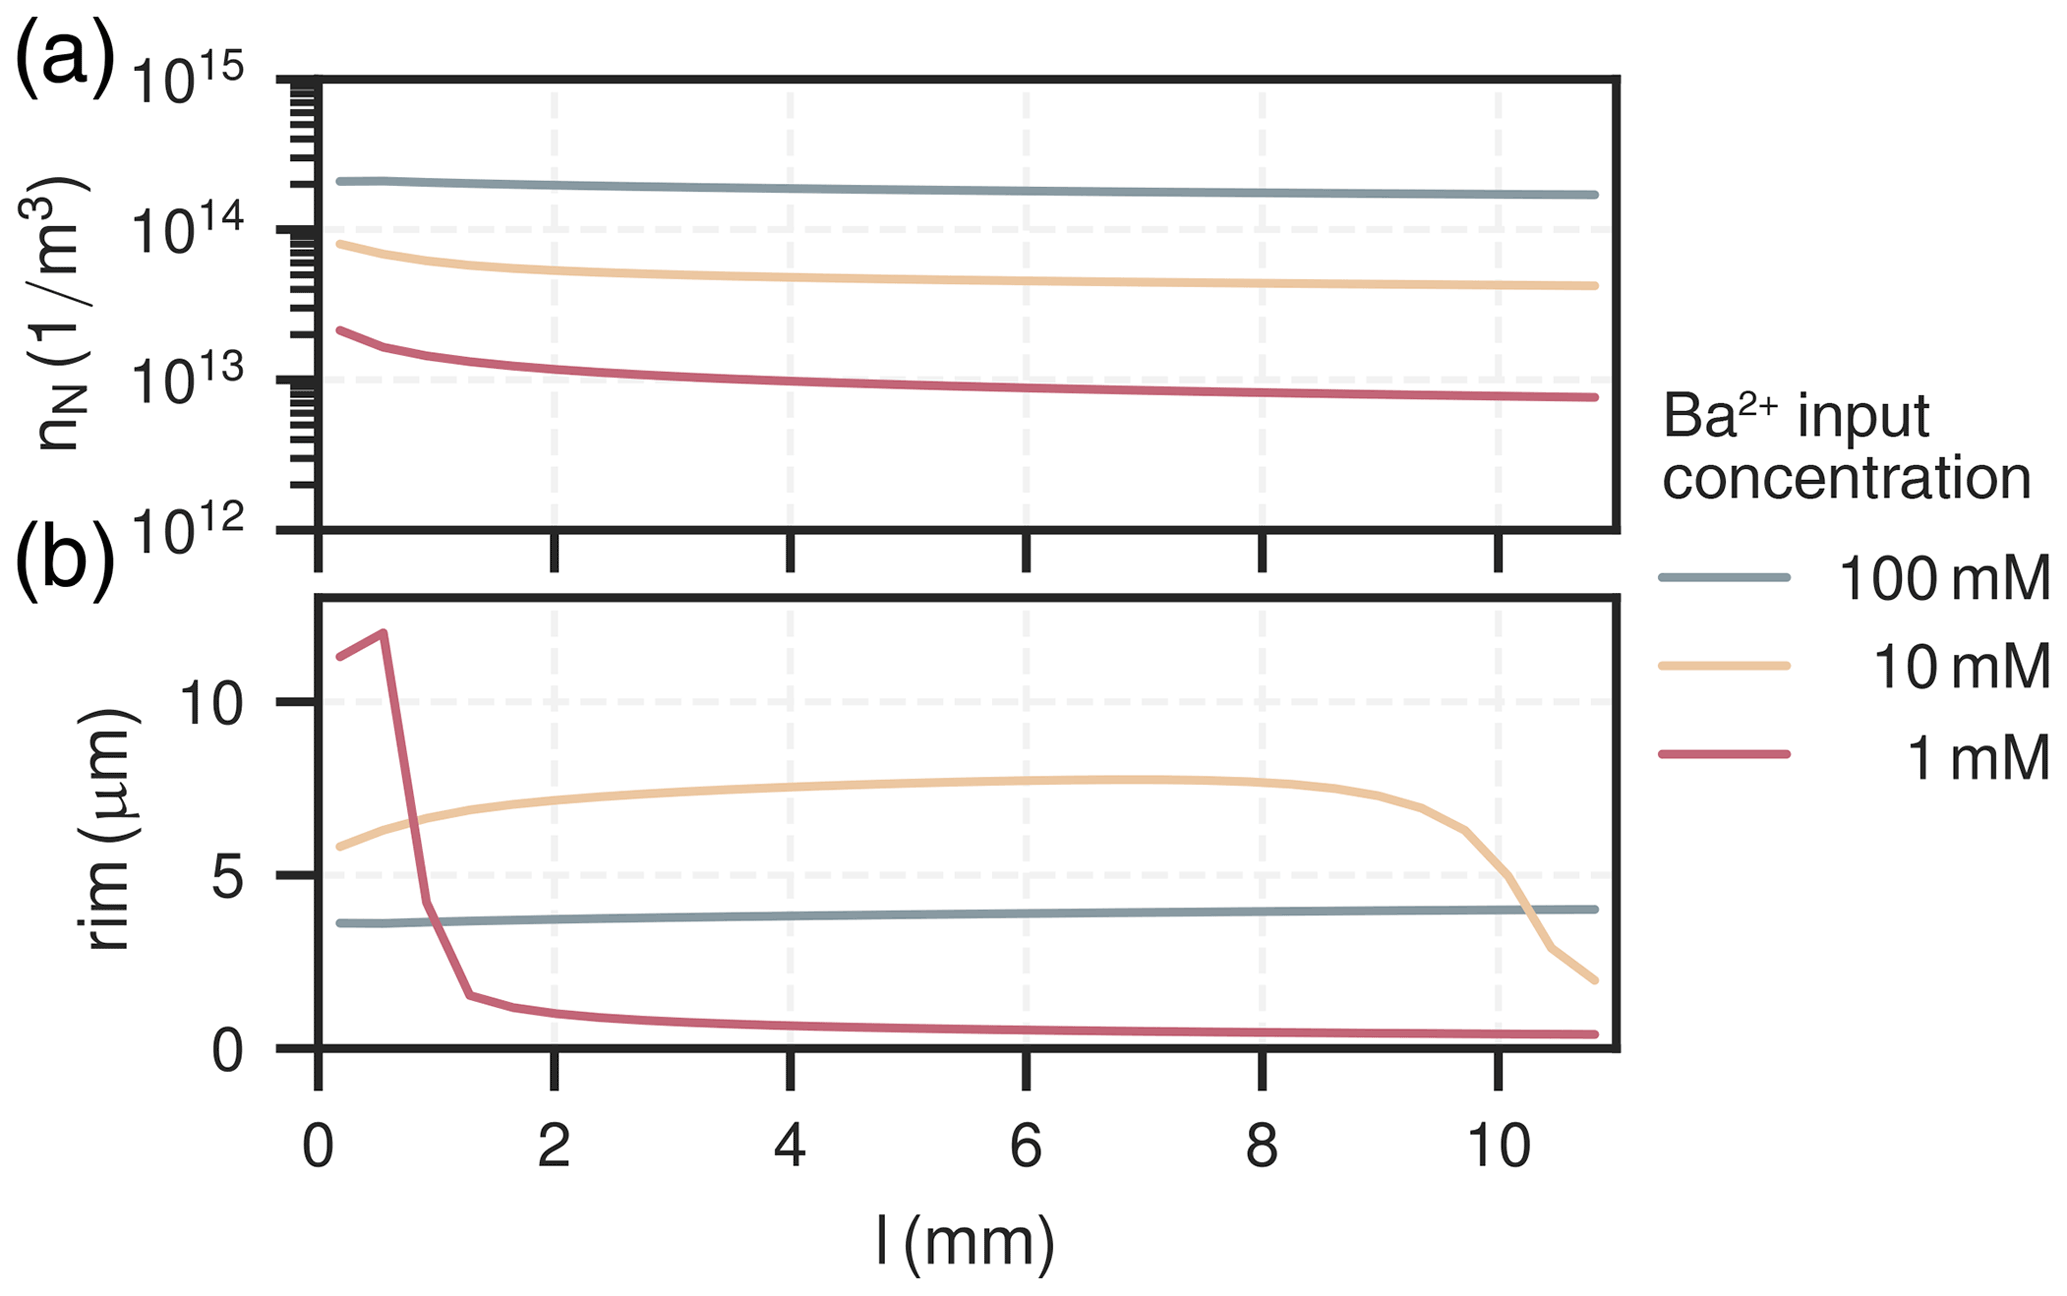
Figure 4Spatial distribution of nuclei (a) and their corresponding rim thickness (b) in the column for all experiments.
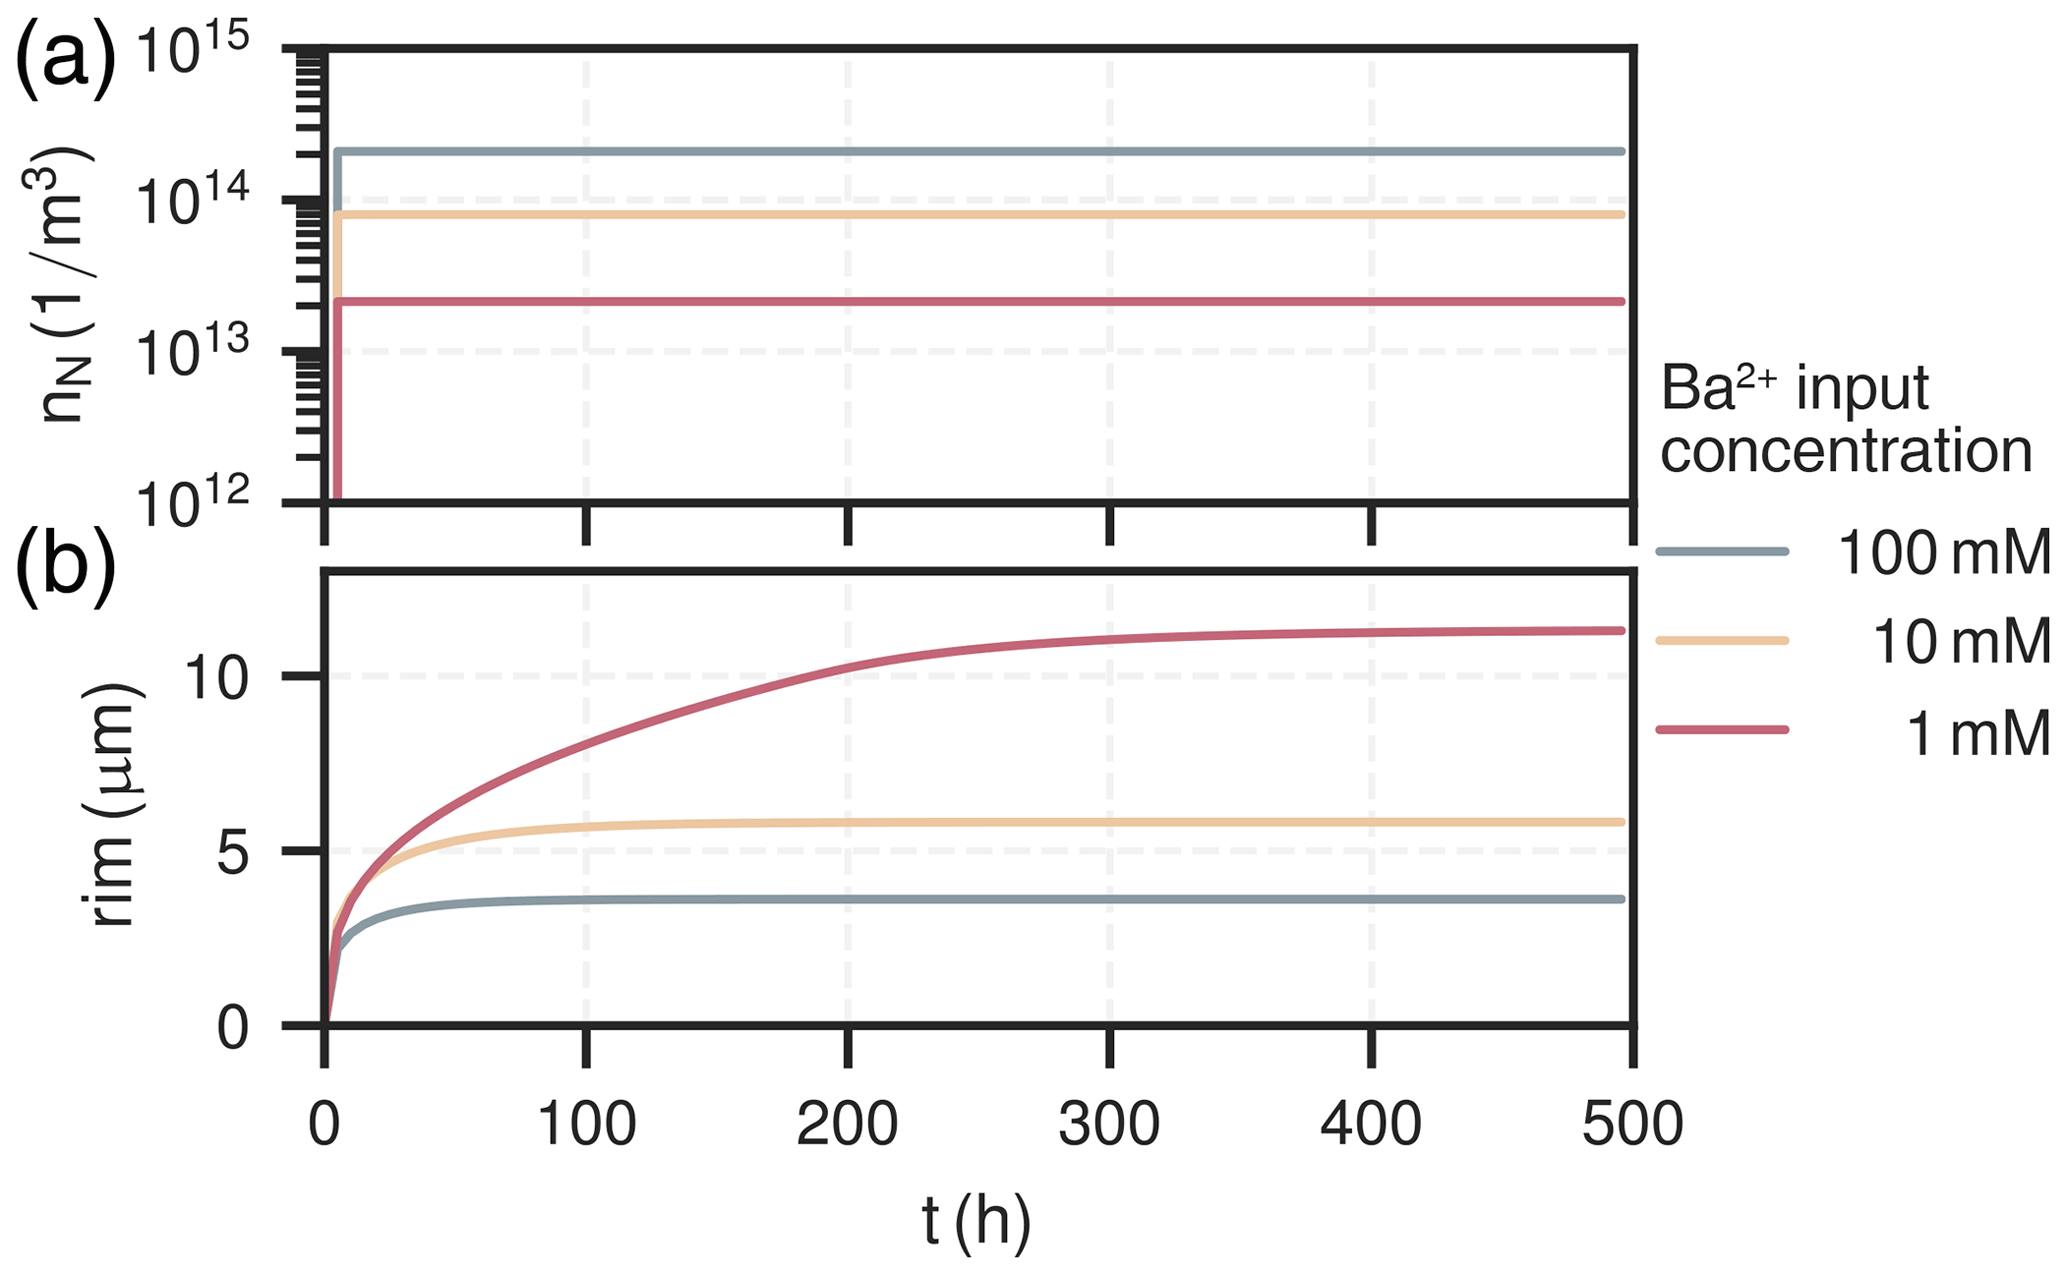
Figure 5Temporal distribution of nuclei (a) and their corresponding rim thickness (b) in the first cell (0–0.37 mm) over the course of the experiment for all experiments.
The amount of nuclei are evenly spread along the column for all experiments, ranging from 1×10¹³ to . The experiment with had the most nuclei overall, about ten-times as many as the experiment with , which had the least. The nucleation process is characterised by a surge of nuclei formation in the beginning of the experiment within the first few hours (<10h). The early barite crystal rim thickness after the initial surge at around 10 h is similar for all cases, about 2 µm. Increase in size hereafter is solely due to bulk precipitation and crystal growth. Crystals in the experiment with high input concentration () reach their final rim thickness of 4 µm after about 80 h, which are homogeneous throughout the column. In the medium input concentration experiment (), crystal sizes are proportional to the mole fraction of barite, reaching rim thicknesses between about (2–8) µm. The growth phase in each cell is only short-lived and happens within the moving reaction front, where the reactive surface area of celestite concurrently goes towards zero. Consequently, celestite dissolution rate and barite precipitation rate both also go towards zero. At the rear end of the column (l>9 mm), crystal sizes are smaller because the reaction front has not reached this section yet. The low input concentration experiment () mainly exhibits crystal growth in the first two millimeters of the column, although continuously until all celestite is dissolved (rim thickness up to 12 µm). Similar to the medium input concentration, barite crystals only grow within a sharp reaction front, which travelled about 1 mm in the low concentration mode.
3.2 Effluent chemistry and column mineral content
The effluent breakthrough curves from the reactive transport simulations are shown together with measured values from laboratory experiments for input concentrations 100 mM, 10 mM, and 1 mM in Figs. 6a, 7a, and 8a, respectively. The respective summed total mineral phase amounts of barite and celestite in the column are shown over the course of the experiment in Figs. 6b, 7b, and 8b. The corresponding mole fractions of barite and celestite at the end of the experiment are depicted in Fig. 9a–c. For all experiments, chloride stays constant after the advection front has reached the end of the column, equal to the injected concentration.

Figure 6Comparison of experimental (Poonoosamy et al., 2020) and simulation results for barium input concentration . (a) Breakthrough curves of the effluent, i.e., the chemical composition (Ba2+, , Sr2+, Cl−) of the last cell over the course of the experiment. (b) Total barite and celestite phase amount in the column over the course of the experiment.

Figure 7Comparison of experimental (Poonoosamy et al., 2020) and simulation results for barium input concentration . (a) Breakthrough curves of the effluent, i.e., the chemical composition (Ba2+, , Sr2+, Cl−) of the last cell over the course of the experiment. (b) Total barite and celestite phase amount in the column over the course of the experiment.
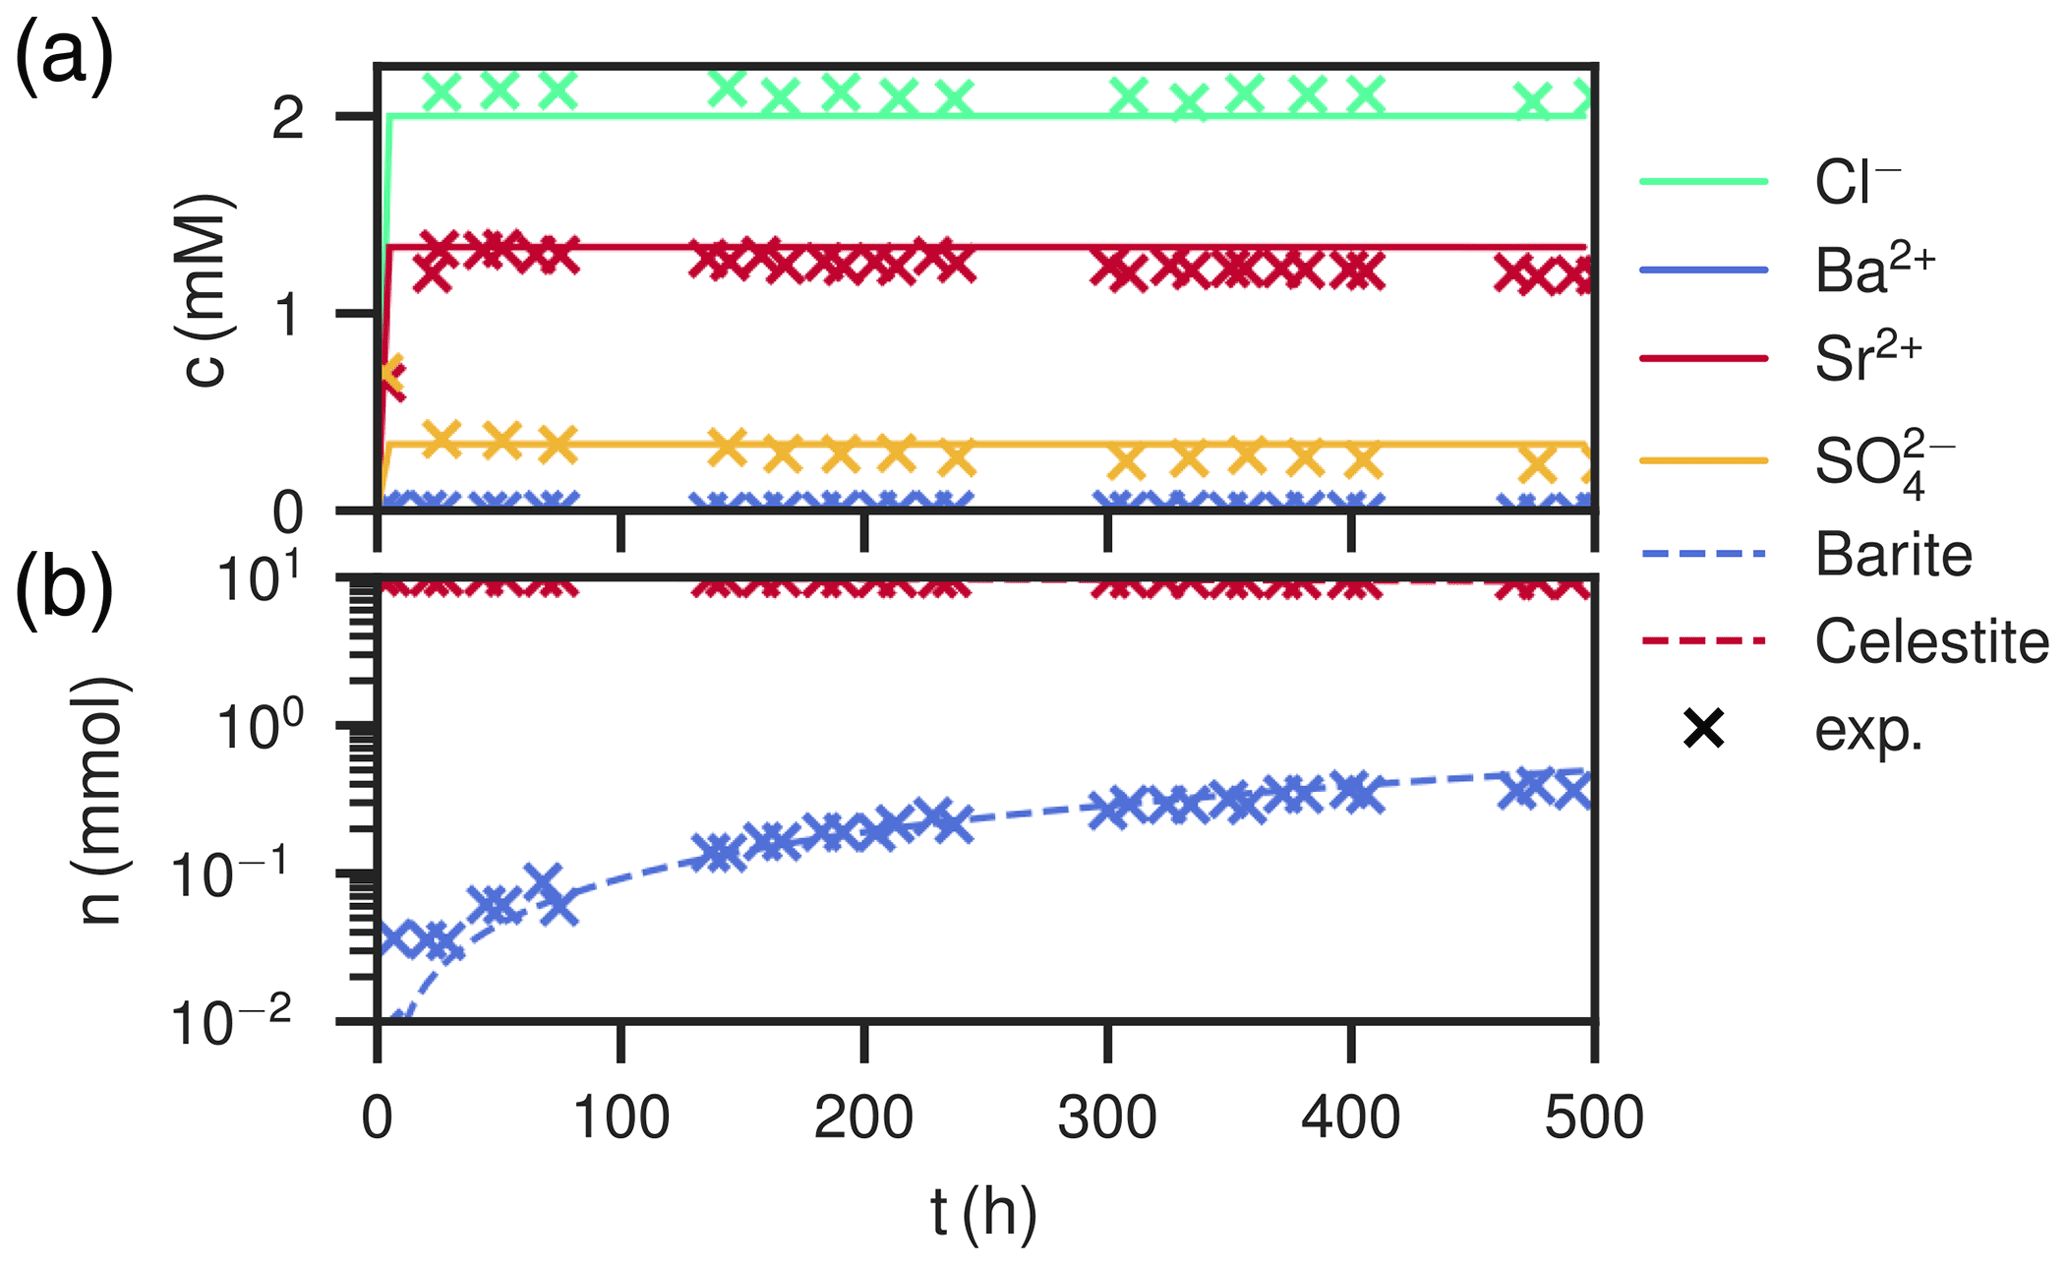
Figure 8Comparison of experimental (Poonoosamy et al., 2020) and simulation results for barium input concentration . (a) Breakthrough curves of the effluent, i.e., the chemical composition (Ba2+, , Sr2+, Cl−) of the last cell over the course of the experiment. (b) Total barite and celestite phase amount in the column over the course of the experiment.
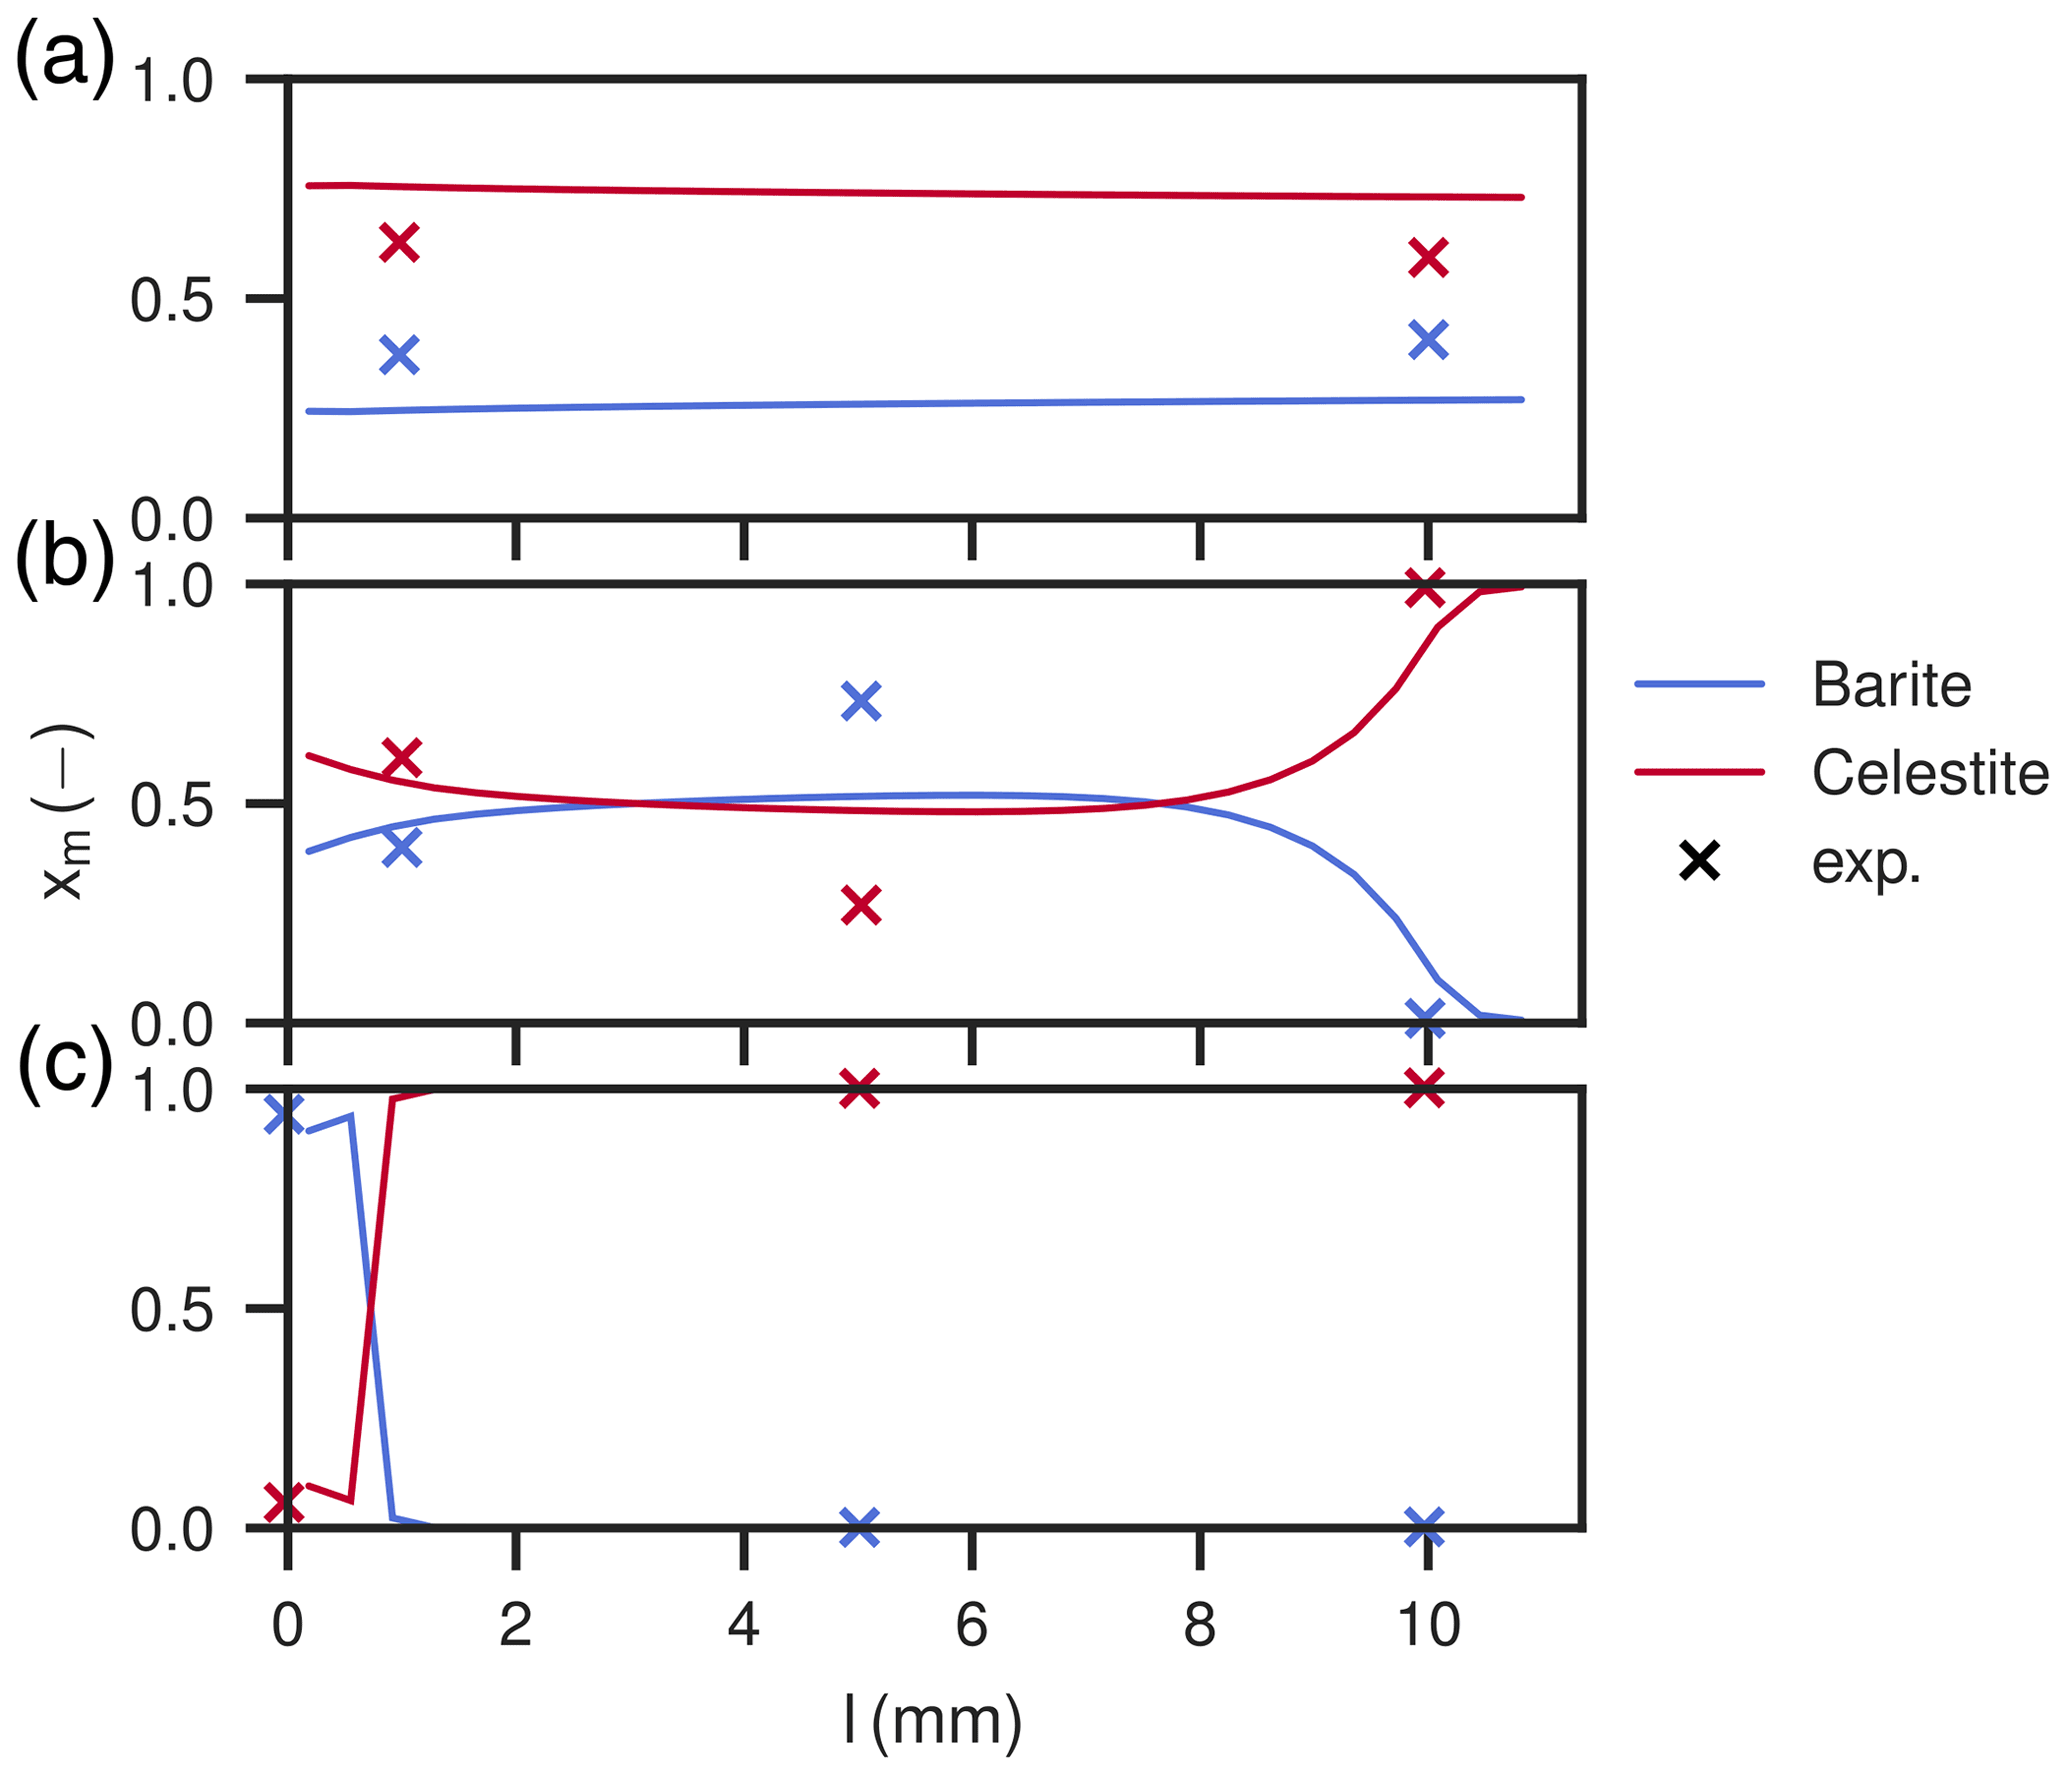
Figure 9Mole fractions of barite and celestite in the column after the duration of experiments one (a), two (b) and three (c). Shown are also mole fractions derived in the experimental study (Poonoosamy et al., 2020). Only barite and celestite are present in the column.
High Ba2+ input concentration results in a peak concentration of almost 100 mM newly dissolved Sr2+, arriving together with the chloride concentration, which slowly levels off over the course of 150 h (Fig. 6a). Contrastingly, Ba2+ breaks through with concentrations below 1 mM and then increases quickly, reaching the input concentration of 100 mM asymptotically after about 150 h. The calculated sulfate concentrations are always comparably small, but correspond to equilibrium conditions with respect to celestite in the beginning (<10 h) and barite in the end (>150 h). The measured values are matched well, except for Sr2+ had a lower peak (Fig. 6a). The total amount of substance in the column showed a continuous barite increase and celestite decrease in the first 80 h and then stays constant for the rest of the time. The distribution in the column is homogeneous, with mole fractions ranging from xbarite=0.32 at the entrance of the column to xbarite=0.37 at the exit. Measured data correspond to slightly more precipitated barite (xbarite=0.37 and xbarite=0.40, respectively).
The medium input concentration experiment shows a quick increase of Sr2+ in the breakthrough curve together with chloride in the beginning, reaching 10 mM and staying constant for the remainder of the experiment (Fig. 7a). Sulfate concentration always corresponds to equilibrium with respect to celestite in the order of 0.1 mM. Ba2+ is in the order of 0.01 mM in the beginning, but gradually increases to 0.1 mM. The measured values are reproduced. During the whole time, the total amount of barite in the column increases linearly, while the amount of celestite decreases. After the experiment, the mole fraction of barite slightly increases along the column length up to 7 mm from 0.4 to about 0.5. From there on, the content decreases to zero again.
At low input concentrations, all species concentrations in the effluent are constant over the whole period (Fig. 8a), matching the laboratory data. Sr2+ is about 1.34 mM, is about 0.34 mM and Ba2+ is about 10−4 mM, all corresponding to equilibrium with respect to celestite and barite. The amount of barite in the column increases continuously over time, but less than for the medium input concentration experiment. The mole fractions along the column length at the end show that precipitation only happened in the first millimeter of the column, whereas the rest is mostly undisturbed. Close to complete mineral replacement happened at the entrance of the column.
Continuum scale reactive transport simulations were applied to match the experimental results. Barite precipitation likewise caused the reactive surface area of barite to increase and that of celestite to decrease, up to five orders of magnitude. These large variations justify to take dissolution kinetics of celestite and precipitation kinetics of barite into account (Lasaga, 1998). The precipitation mechanism of barite was identified to consist of two steps, heterogeneous nucleation on celestite substrate and subsequent growth of these nuclei to become larger crystals. Nucleation was treated deterministically with the classical theory (Kashchiev and van Rosmalen, 2003). Crystal growth was implemented as the averaged geometrical growth of nuclei bodies, where the volume increase was taken from bulk precipitation rate.
The overgrowth of celestite with barite crystals had a passivation effect at high and medium input concentrations ( and ). This happened when a high enough number of nuclei formed during the initial surge of nucleation. The subsequent crystal growth covered all the celestite surface and prevented any further dissolution. At low supersaturations (i.e., for ), the passivation effect was not observed, since significantly fewer nuclei formed in the beginning. Thus, fewer barite crystals grew to larger sizes compared to the experiments with 100 mM and 10 mM input concentration, covering the celestite surface only in parts. Therefore, a complete mineral replacement took place.
The modelled distribution patterns of barite crystals match well with the SEM images of the laboratory experiments for all input concentrations (Poonoosamy et al., 2020). The experiment with high input concentration showed celestite grains overgrown uniformly with a thin barite rim (∼3 µm). The other two experiments showed distinct zonation patterns across the column with mineral phase substitution of different degrees. The medium input concentration mode exhibited a transition zone in the center with thicker rims (∼5 µm) and generally decreasing barite content on either end of the column. At low BaCl2 input concentration, a sharp reaction front at the upstream was observed, where the average thickness of overgrowth was about ∼7 µm. Simulated crystal sizes are slightly larger, corresponding to final rim thicknesses of 4, 8, and 12 µm for experiments with high, medium, and low input concentration, respectively.
Nucleation was parametrised assuming spherical cap shaped nuclei and a respective interfacial tension from the literature (Prieto, 2014). Two parameters were fitted to match the laboratory experiments: Γ0 and θ. Γ0 is part of the pre-exponential factor Γ of the nucleation rate (Eq. 4), which quantifies the diffusive attachment rate of monomers from solution to sub-critical clusters. Compared to the exponential term, where parameter uncertainties are much more significant, approximating the order of magnitude of Γ is usually sufficient. However, many of the parameters for calculating Γ are challenging to quantify. It is uncertain, how many monomers in the pore fluid actually play a role in the nucleation process, or if only monomers in the diffusive layer surrounding the substrate should be considered. Furthermore, the available nucleation sites can only be judged from the total substrate surface area and the approximate size of a nuclei. Calibrating Γ0 accounts for these uncertainties in the considered system. The contact angle θ of the nuclei and the substrate depends on the structural similarity between the substances. At 180∘ the contact is practically only one point, at 0∘ the “wets” the substrate. The fitted value of 32∘ accounts for the similarity between barite and celestite, both crystallise in the orthorhombic system. It also compares well to the value of used by Poonoosamy et al. (2016) for a similar system.
Modelling all three experiments with empirical relationships required at least two different models to account for the reactive surface area evolution (Poonoosamy et al., 2020). However, for the modeller it remains impossible to know, which empirical relationship to use a-priori. Furthermore, they seem insufficient to be used for the transitional case (). In this study, the identified chemistry-based processes are taken into consideration explicitly in coupled models. The resulting transient reactive surface areas are used in both kinetic rates for barite and celestite, compared to only celestite kinetics and barite equilibrium reactions (Poonoosamy et al., 2020). After calibration of the here provided models, the effluent and column chemistry of laboratory experiments at medium (10 mM) and low (1 mM) barium input concentrations could be reproduced almost exactly, and at high (100 mM) input concentration the match was good with slight deviations. The main benefit is that no knowledge of the supersaturation in the system has to be known in advance, which also solves the transitional case well (medium input concentration).
Calibration of the presented models may be improved by further refining the grid size and increasing the iteration steps of nucleation and crystal growth between transport steps, thus coupling them more tightly together with the kinetics solver. However, model run times on a regular desktop working machine (2.3 GHz Quad-Core Intel Core i5) were in the range (12–20) h for one experiment run on a single CPU with 30 grid elements. Increasing the grid size would make manual calibration unfeasible due to too long model run times. In future work, this could be solved by using approaches for chemistry speed-ups in reactive transport simulations (De Lucia and Kühn, 2021). Furthermore, a more detailed crystal size distribution map using digital pore-scale models instead of mean values in each cell may improve determination of transient reactive surface areas. However, nucleation happens predominantly in the beginning, thus the comparably low amount of new nuclei later in the experiment do not change the mean crystal size of each cell significantly. The assumption of tracking only one mean size per cell appears sufficient as the models can describe the investigated system qualitatively well and moreover the data basis does not cover this in enough detail.
A geochemical modelling approach was presented to simulate barite formation in a celestite grain packed column. Celestite dissolution and barite precipitation kinetics, as well as barite nucleation and barite crystal growth were included explicitly as processes in the model coupling. After calibration of the nucleation process, of the three different precipitation patterns observed in the experiments, two were reproduced almost exactly and one was matched qualitatively well by only varying the input concentration. Compared to previous modelling approaches using various empirical relationships to take reactive surface area evolution into account, the provided models can be applied to systems with a broad range of input concentrations without a-priori knowledge of the prevailing barite supersaturations. This can be of great benefit for modelling the evolution of subsurface systems due to barite formation, where only the prevalent solute concentrations are known. This is foremost important in geothermal reservoirs or in reactive barriers near nuclear waste repositories, where it is crucial to predict the response of the system in advance, so it can be incorporated into the project design. In future work, it is planned to couple reactive transport and digital pore-scale models more tightly together. The aim is to track pore-scale alterations in detail and exploit the capabilities of digital rock physics for deriving rock properties: evolution of reactive surface areas and feedback of resulting geometrical and porosity changes on permeability evolution. Furthermore, the use of surrogate models to speed-up geochemical calculations will be a valuable improvement in the future, making higher grid discretisation and inverse modelling feasible for more accurate parameter determination.
Input scripts and results can be found in the zenodo repository. https://doi.org/10.5281/zenodo.5055471 (Tranter, 2021b).
The four authors have equally contributed to this paper. MT and MK conceived and designed the simulations; MT performed the research; MT, MW, MDL and MK analysed the data; MT, MW, MDL and MK wrote the paper. All authors read and agreed to the published version of the manuscript.
The contact author has declared that neither they nor their co-authors have any competing interests.
Publisher’s note: Copernicus Publications remains neutral with regard to jurisdictional claims in published maps and institutional affiliations.
This article is part of the special issue “European Geosciences Union General Assembly 2021, EGU Division Energy, Resources & Environment (ERE)”. It is a result of the EGU General Assembly 2021, 19–30 April 2021.
We are grateful for the constructive comments provided by the two reviewers Jenny Poonoosamy and Renchao Lu, who contributed in improving the paper.
This research has been supported by the Bundesministerium für Wirtschaft und Energie (grant no. 0324244C, project ReSalt).
The article processing charges for this open-access publication were covered by the Helmholtz Centre Potsdam – GFZ German Research Centre for Geosciences.
This paper was edited by Sonja Martens and reviewed by Jenna Poonoosamy and Renchao Lu.
Al Ibrahim, M. A., Kerimov, A., Mukerji, T., and Mavko, G.: Particula: A Simulator Tool for Computational Rock Physics of Granular Media, Geophysics, 84, F85–F95, https://doi.org/10/gkzffr, 2019. a
Curti, E., Xto, J., Borca, C. N., Henzler, K., Huthwelker, T., and Prasianakis, N. I.: Modelling Ra-Bearing Baryte Nucleation/Precipitation Kinetics at the Pore Scale: Application to Radioactive Waste Disposal, Eur. J. Mineral., 31, 247–262, https://doi.org/10/ghbtvb, 2019. a
De Lucia, M. and Kühn, M.: DecTree v1.0 – chemistry speedup in reactive transport simulations: purely data-driven and physics-based surrogates, Geosci. Model Dev., 14, 4713–4730, https://doi.org/10.5194/gmd-14-4713-2021, 2021. a
Dove, P. M. and Czank, C. A.: Crystal Chemical Controls on the Dissolution Kinetics of the Isostructural Sulfates: Celestite, Anglesite, and Barite, Geochim. Cosmochim. Ac., 59, 1907–1915, https://doi.org/10/fvq6sw, 1995. a
Kashchiev, D. and van Rosmalen, G. M.: Review: Nucleation in Solutions Revisited, Cryst. Res. Technol., 38, 555–574, https://doi.org/10/c5sn2n, 2003. a
Lasaga, A. C.: Kinetic Theory in the Earth Sciences, Princeton Series in Geochemistry, Princeton University Press, Princeton, N.J, 1998. a, b, c
Legland, D., Arganda-Carreras, I., and Andrey, P.: MorphoLibJ: Integrated Library and Plugins for Mathematical Morphology with ImageJ, Bioinformatics, 33, btw413, https://doi.org/10/gfzpdm, 2016. a
Palandri, J. L. and Kharaka, Y. K.: A Compilation of Rate Parameters of Water-Mineral Interaction Kinetics for Application to Geochemical Modeling, Report 2004-1068, USGS, 2004. a
Parkhurst, D. L. and Appelo, C.: Description of Input and Examples for PHREEQC Version 3: A Computer Program for Speciation, Batch-Reaction, One-Dimensional Transport, and Inverse Geochemical Calculations, Report 6-A43, USGS, Reston, VA, 2013. a
Poonoosamy, J., Curti, E., Kosakowski, G., Grolimund, D., Van Loon, L., and Mäder, U.: Barite Precipitation Following Celestite Dissolution in a Porous Medium: A SEM/BSE and μ-XRD/XRF Study, Geochim. Cosmochim. Ac., 182, 131–144, https://doi.org/10/f8nzm4, 2016. a
Poonoosamy, J., Klinkenberg, M., Deissmann, G., Brandt, F., Bosbach, D., Mäder, U., and Kosakowski, G.: Effects of Solution Supersaturation on Barite Precipitation in Porous Media and Consequences on Permeability: Experiments and Modelling, Geochim. Cosmochim. Ac., 270, 43–60, https://doi.org/10/ghntxn, 2020. a, b, c, d, e, f, g, h, i, j, k
Prieto, M.: Nucleation and Supersaturation in Porous Media (Revisited), Mineralogical Magazine, 78, 1437–1447, https://doi.org/10/f65cb9, 2014. a, b, c
Tranter, M., De Lucia, M., Wolfgramm, M., and Kühn, M.: Barite Scale Formation and Injectivity Loss Models for Geothermal Systems, Water, 12, 3078, https://doi.org/10/ghntzk, 2020. a
Tranter, M., De Lucia, M., and Kühn, M.: Numerical Investigation of Barite Scaling Kinetics in Fractures, Geothermics, 91, 102027, https://doi.org/10/ghr89n, 2021a. a, b
Tranter, M.: Supplemental data of publication “Reactive Transport Model of Kinetically Controlled Celestite to Barite Replacement”, Zenodo [data set], https://doi.org/10.5281/zenodo.5055471, 2021b. a, b
Wetzel, M., Kempka, T., and Kühn, M.: Digital rock physics approach to simulate hydraulic effects of anhydrite cement in Bentheim sandstone, Adv. Geosci., 54, 33–39, https://doi.org/10.5194/adgeo-54-33-2020, 2020. a
Wetzel, M., Kempka, T., and Kühn, M.: Diagenetic Trends of Synthetic Reservoir Sandstone Properties Assessed by Digital Rock Physics, Minerals, 11, 151, https://doi.org/10/gkzvsq, 2021. a
Zhen-Wu, B., Dideriksen, K., Olsson, J., Raahauge, P., Stipp, S., and Oelkers, E.: Experimental Determination of Barite Dissolution and Precipitation Rates as a Function of Temperature and Aqueous Fluid Composition, Geochim. Cosmochim. Ac., 194, 193–210, https://doi.org/10/f88cq4, 2016. a