 | 01 Feb 2021
IWV retrieval from ground GNSS receivers during NAWDEX
Pierre Bosser
Olivier Bock
A ground-based network of more than 1200 Global Navigation Satellite System (GNSS) Continuously Operating Reference Stations (CORS) was analysed using GIPSY-OASIS II software package for the documentation of time and space variations of water vapor in atmosphere during the North Atlantic Waveguide and Downstream impact EXperiment (NAWDEX) during fall 2016. The network extends throughout the North Atlantic, from the Caribbeans to Morocco through Greenland. This paper presents the methodology used for GNSS data processing, screening, and conversion of Zenith Tropospheric Delay (ZTD) estimates to Integrated Water Vapor content (IWV) using surface parameters from reanalysis. The retrieved IWV are used to evaluate the European Centre for Medium-Range Weather Forecasts (ECMWF) reanalyses ERAI and ERA5. ERA5 shows an overall improvement over ERAI in representing the spatial and temporal variability of IWV over the study area. The mean bias is decreased from 0.31±0.63 to 0.19±0.56 kg m−2 (mean ±1σ over all stations) and the standard deviation reduced from 2.17±0.67 to 1.64±0.53 kg m−2 combined with a slight improvement in correlation coefficient from 0.95 to 0.97. At regional scale, both reanalyses show a general wet bias at mid and northern latitudes but a dry bias in the Caribbeans. We hypothesize this results from the different nature of data being assimilated over the tropical oceans. This GNSS IWV data set is intended to be used for a better description of the high impact weather events that occurred during the NAWDEX experiment.
- Article
(1808 KB) - Full-text XML
- BibTeX
- EndNote


The North Atlantic Waveguide and Downstream impact EXperiment (NAWDEX) is an international field campaign that took place during fall 2016. The experiment aims at a better understanding of the effects of the diabatic process on the evolution of atmospherics disturbances along the North Atlantic Jet Stream and a better representation of these processes in Numerical Weather Prediction (NWP) models. In particular, it consisted in the realisation of new and various multi-scale observations in the North Atlantic Basin. The observational field campaign took place from 16 September to 16 October 2016 with the deployment of four research aircrafts and extensive ground-based instrumentation (Schäfler et al., 2018).
In addition to this special ground-based instrumentation, measurements from more than 1200 Global Navigation Satellite System (GNSS) Continuously Operating Reference Stations (CORS) located along the North Atlantic Arc were analysed using a single software package for an extended period, from 1 September to 5 November 2016. Indeed, with constantly improved accuracy in the estimation of tropospheric delay, GNSS has become a very valuable tool for monitoring the atmosphere, and especially atmospheric water vapor (Bock et al., 2016). The routine analysis of continuously operating GNSS networks worldwide provide continuous ZTD time series with high resolution (from a few hours down to a few minutes) (Byun and Bar-Sever, 2009). Thus, it is now quite common to use GNSS ZTD estimates retrieved from global or regional networks for climatological and meteorological studies (Poli et al., 2007; Wang and Zhang, 2008; Bock et al., 2008; Guerova et al., 2016; Parracho et al., 2018).
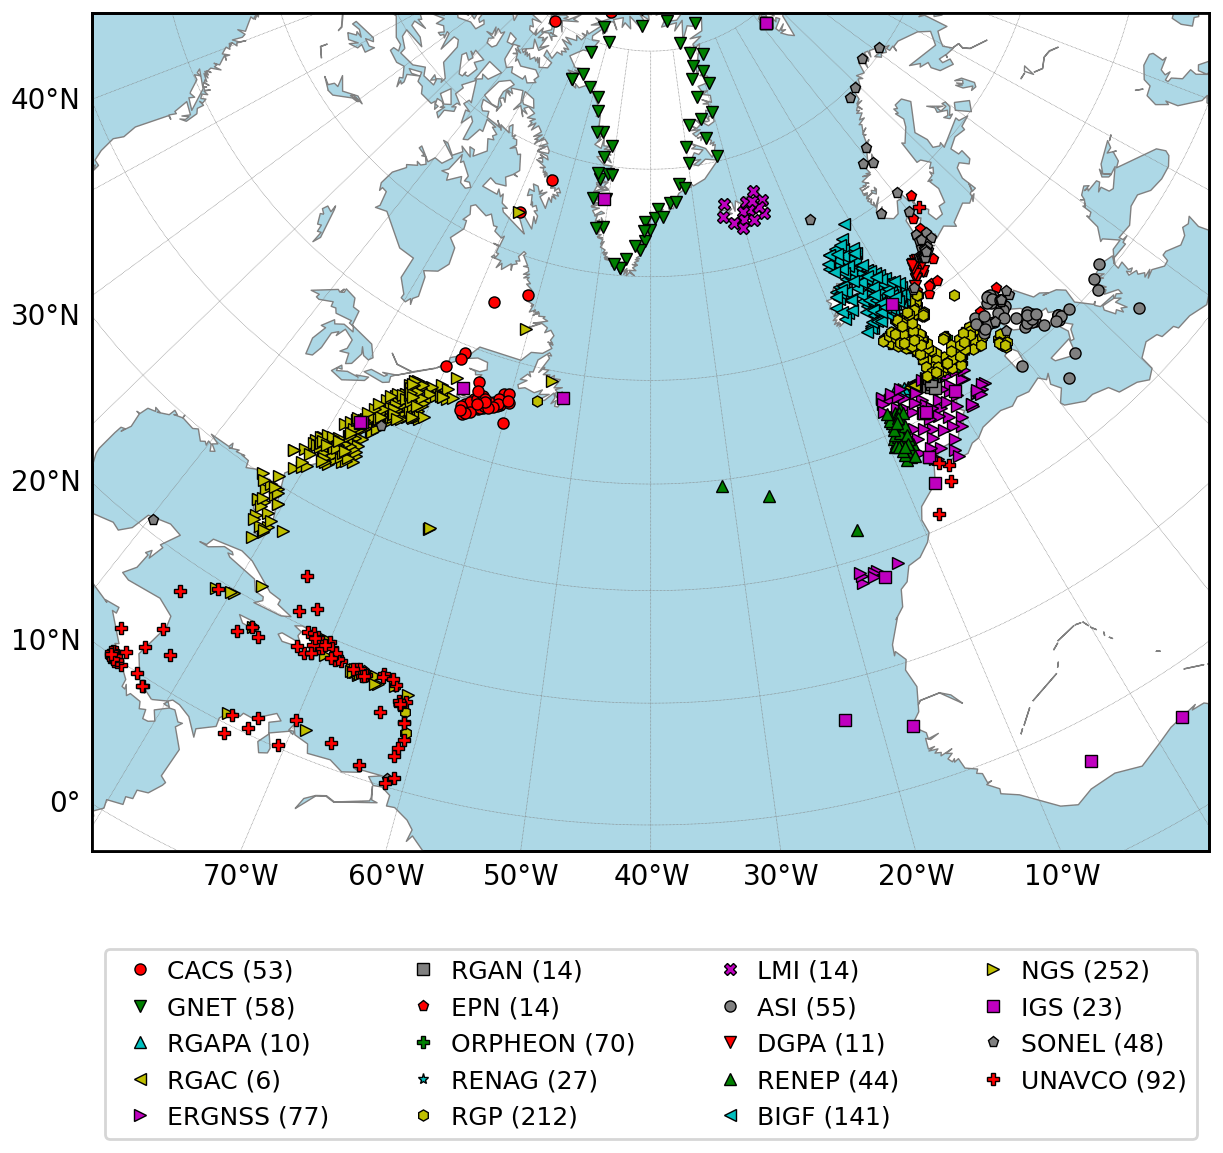
Figure 1Map of the 1221 GNSS stations for which measurements were processed in the framework of the NAWDEX project. The symbols represent the 19 data providers from which data were collected (see the legend at the bottom with the corresponding number of stations).
The goal of this paper is to describe the retrieval of ZTD and IWV estimates from the GNSS measurements and to assess the quality of IWV estimates from the European Centre for Medium-Range Weather Forecasts (ECMWF) reanalyses ERAI (ECMWF Reanalysis – Interim, Dee et al., 2011) and ERA5 (ECMWF Reanalysis 5, Hersbach et al., 2020) in the NAWDEX study area. In Sect. 2, the GNSS CORS network, data processing and post-processing (screening and ZTD to IWV conversion) are described. In Sect. 3, the GNSS IWV data are compared to the two reanalyses and the results are discussed in different geographical regions. Section 4 gives a summary and concludes.
2.1 GNSS networks and data processing
GNSS measurements for 19 CORS networks, including 1221 stations, were reprocessed for the NAWDEX project (Fig. 1). For more details about the networks used, please refer to Appendix A.
Global Positioning System (GPS) measurements were processed using the GIPSY/OASIS II v6.4 software in PPP mode (Zumberge et al., 1997). The fiducial-free final satellite obit and clock products 3.0 from Jet Propulsion Laboratory (JPL) were used. The data were analysed in a 30 h window centred on each day from which the 00–24 h parameters were extracted to avoid edge effects. Second order ionospheric correction was used. Phase ambiguities were fixed using the wide-lane phase biases computed by JPL as part of the analysis (Bertiger et al., 2010). The cut-off angle was fixed at 7∘ without down-weighting low-elevation observations. We applied IERS conventions for solid Earth tides (Petit and Luzum, 2010) and the Finite Element Solution tide model FES2004 (Lyard et al., 2006) for ocean tide loading effects using the coefficients computed by the ocean tide loading provider (Machiel Simon Bos and Hans-Georg Scherneck, http://holt.oso.chalmers.se/loading/, last access: 20 June 2020). We also used absolute antenna models for satellites and ground receivers (from https://files.igs.org/pub/station/general/igs_01.atx, last access: 29 January 2021).
Tropospheric delays were modelled by time-varying Zenith Hydrostatic Delays (ZHD), Zenith Wet Delays (ZWD) and horizontal gradients along with their respective Vienna Mapping Function 1 (VMF1) mapping functions (Boehm et al., 2006). The a priori values for ZHD and ZWD and the values for the mapping functions were computed from 6-hourly ECMWF operational analyses by Technische Universität Wien (TU-Wien, https://vmf.geo.tuwien.ac.at/, last access: 20 June 2020). Correction to a priori ZWD and horizontal gradients were modelled as random walk processes with a 300 s time resolution and were estimated during the data processing. The random walk parameters were fixed at 5 and 0.5 mm h for ZWD and gradients, respectively. Zenith Tropospheric Delays (ZTD) were then calculated by the summation of a priori ZHD, a priori ZWD, and the estimated ZWD correction.
2.2 Screening and quality assessment
A quality assessment of the ZTD estimates is mandatory for scientific use, and also to obtain reference data sets. This is particularly crucial when considering large data sets as in this study. Screening consists in the removal of spurious data or outliers that would induce erroneous interpretation and/or degrade comparisons. A GNSS-based screening method (i.e. independent from external data) was used previously with GPS (Bock et al., 2016) and DORIS ZTD data (Bock et al., 2014). The method was applied using both ZTD estimates and their formal errors, ans included two major steps: the range check, which tests the values against maximum range of the physical variable, and the outlier check that is statistical in nature and will detect values based on station statistics. In both studies, screening was shown to improve the agreement of GNSS ZTD or IWV data with independent data.
Inspired by previous work and completed by an analysis of the ZTD and its formal error distribution, the following procedure was applied for the screening of the ZTD estimated for the entire network, using both ZTD estimated values and the associated formal errors (σZTD):
-
ZTD range check: reject value if ZTD is outside [1; 3] m;
-
ZTD outlier check: reject value if ZTD is outside Md(ZTD)±0.5 m, where “Md” denotes the median;
-
σZTD range check; reject value if σZTD is outside [0.1; 4] mm;
-
σZTD outlier check: reject value if σZTD is superior to , where k=3.0 and IQR is the interquartile range;
-
data check: reject day if the percentage of remaining ZTD values is inferior to 50 %.
Overall, 0.31 % of the ZTD estimates data were rejected; screening checks based on ZTD estimates (both range and outlier checks) were ineffective (no input data were effectively rejected). This was due not only to the high quality of the data sets but also to the processing strategy (ZTD estimation as a random walk process) that prevented highly spurious ZTD values by constraining time variations. 0.13 % of input data were rejected after the range check on formal error; Outlier checks on formal error were more active in terms of rejection: they eliminated around 0.16 % of the input data. The last step, the data check, rejected around 0.02 % of input data.
To assess the impact of screening, we also investigated daily processing output parameters (ambiguity resolution rate, height estimates) which were resampled at ZTD time resolution (5 min) and selected according to ZTD screening criteria. Such selection induces a re-weighting of output parameters according to the count of valid estimates per session. Figure 2 represents changes in resampled output parameters (mean ambiguity resolution rate and height repeatability) and ZTD formal error after screening according to the station rejection rate. For most stations, the rejection rate was low and no significant changes (>1 %) were observed. Significant changes (>1 %) occurred for a high rejection rate (>5 %) and were always positive whatever the parameter (increase in ambiguity resolution rate and decrease in height repeatability). Of course, the reduction in mean ZTD formal error was to be expected (decrease greater than 1 % for 73 stations), but the ambiguity resolution rate was also improved, as 10 stations presented an increase in average ambiguity resolution rate greater than 1 %. An improvement in height repeatability was also observed since this value was decreased by more than 1 % for 42 stations. For these 3 parameters, there was no degradation higher than 1 %.
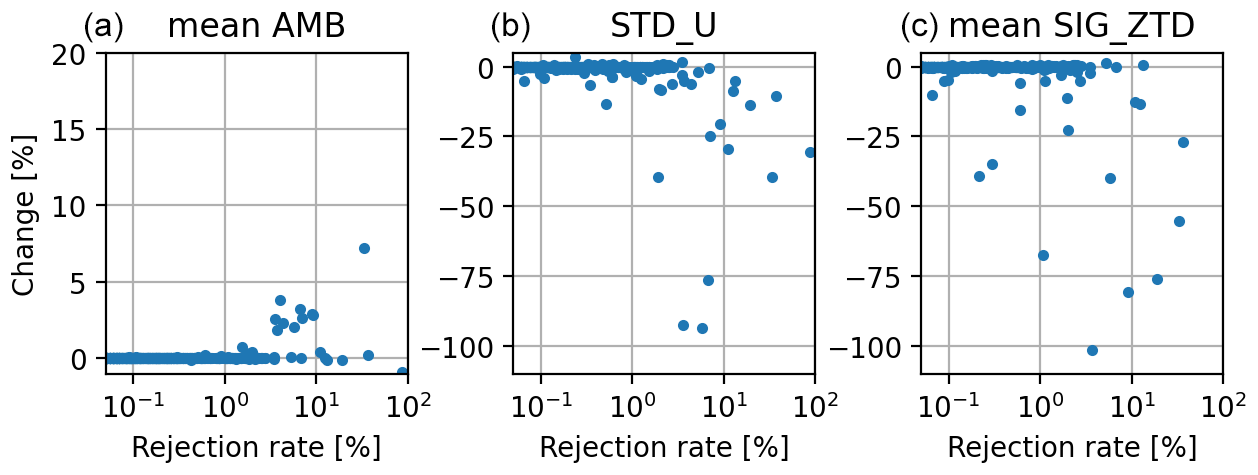
Figure 2Percentage change in mean ambiguity resolution rate (mean AMB, a), repeatability on height (STD_U, b), mean ZTD formal error (SIG_ZTD, c) induced by the data screening method, versus the data rejection rate for each of the 1221 GNSS stations.
2.3 GNSS ZTD to IWV conversion
The ZTD can be divided into 2 components as follows:
ZHD was computed from surface pressure from ERAI or ERA5 grids using the Saastamoinen formula (Saastamoinen, 1972). For ERAI, grids were given for a horizontal resolution of 0.75∘ every 6 h. For ERA5, grids were given for a horizontal resolution of 0.25∘ every hour. ZHD were then extrapolated to GNSS antenna height using a formulation inspired by Steigenberger et al. (2009) and Boehm and Schuh (2013) which was shown to be sufficient for small height differences:
where hG and hE are respectively the geoid height of the GNSS antenna and the ERAI or ERA5 grid, T(hE), P(hE) and g(hE)=9.8062 m s−2 are respectively the temperature, pressure and mean gravity between the GNSS antenna and the ERAI or ERA5 surface; P and T could be approximated using a standard model as GPT (Boehm et al., 2007); k1 is a refractivity constant (Thayer, 1974) and gatm=9.7840 m s−2 is the approximated gravity of the centre of mass of the atmosphere (Boehm and Schuh, 2013).
ZHD are then interpolated at each GNSS epoch; From GNSS ZTD and ERAI or ERA5 ZHD we can deduce ZWD that is related to IWV following:
κ is a semi-empirical function given by Bevis et al. (1992). It depends on the integrated mean temperature, Tm, which is interpolated using values provided by the TU-Wien database (https://vmf.geo.tuwien.ac.at/, last access: 20 June 2020) that consists in 6-hourly grids derived from ECMWF operational analysis and provided on global grid ().
In order to limit the systematic errors due to the extrapolation with Eq. (2), GNSS stations with a geoid height differing by more than 1000 m from the model orography were not subsequently considered.
3.1 IWV from ERA reanalysis
We used IWV grid from ERAI and ERA5. The IWV were first extrapolated from the ERAI or ERA5 orography to the height of the GNSS antenna by using the empirical formulation used by Parracho et al. (2018):
where hE and hG are respectively the geoid height of the ERAI or ERA5 grid and the GNSS antenna; IWV(hE) is the IWV values from the ERAI or ERA5 grid; IWV(hG) is the extrapolated values at GNSS antenna height. Once again, the selection of only the GNSS stations that had a geoid height differing by less than 1000 m from the model orography enabled a reduction in extrapolation errors.
Finally, the IWV were bilinearly interpolated to the horizontal position of the antenna to obtain the ERAI or ERA5 time series at a time resolution of 6 and 1 h respectively for each GNSS station.
3.2 Results
In this section, we compare the GNSS IWV derived using ERAI and ERA5 surface pressure fields and the IWV extracted from ERAI and ERA5 IWV fields respectively. It is necessary for the dates of the compared data to match exactly, i.e. GNSS data are resampled at 6 h for comparisons with ERAI and at 1 h for comparisons with ERA5 (the results for 6-hourly ERA5 data are almost exactly the same, see Appendix B). Only stations with enough comparison points for a duration of at least 60 h are considered here. Finally, stations for which more than 50 % of the ZTD estimates had been rejected by screening were also removed from the data set. That decreases the number of stations from 1221 to 1203.
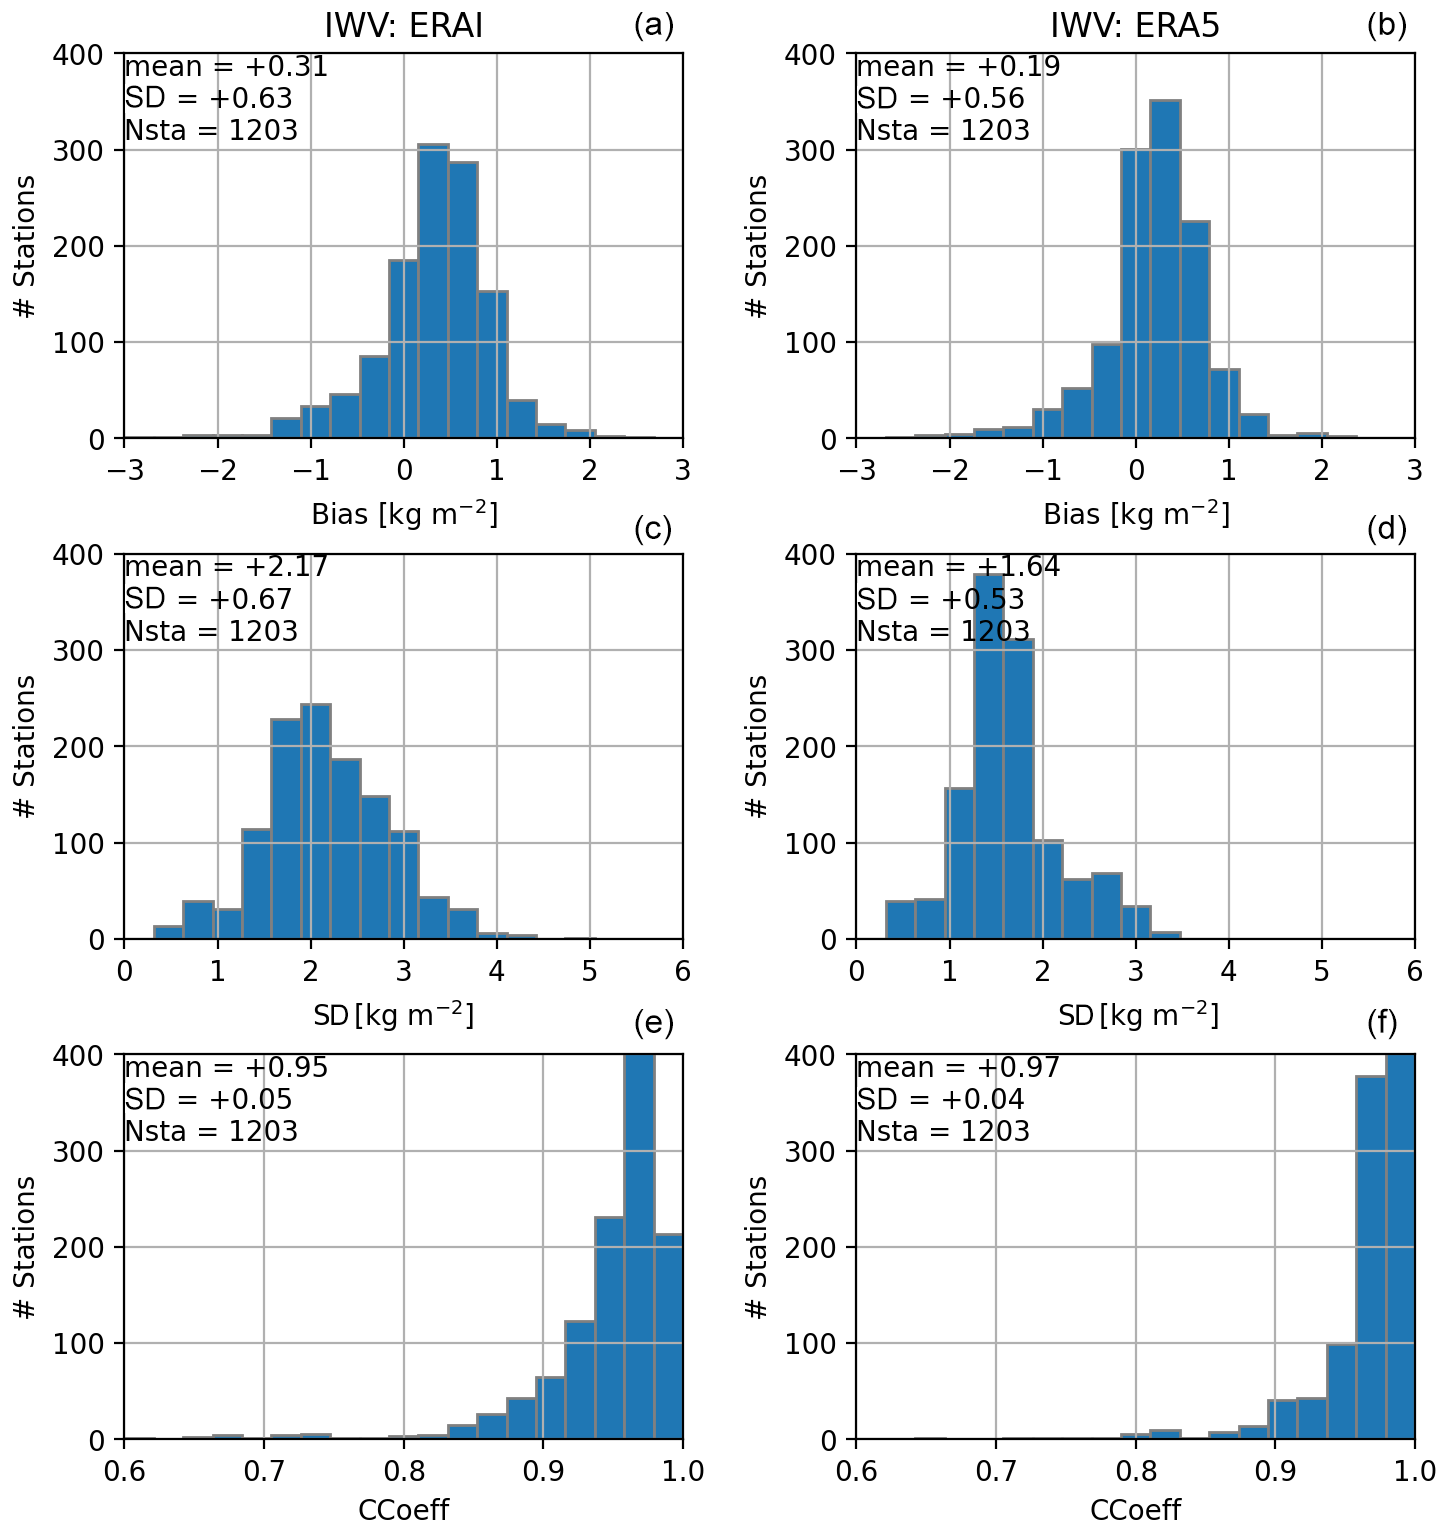
Figure 3Histogram of IWV comparison statistics for ERAI (a, c, e) and ERA5 (b, d, f). From top to bottom, bias (kg m−2, reanalysis minus GNSS), standard-deviation of difference (kg m−2) and correlation coefficient. The inserted text indicates the mean value, the standard deviation, and the number of stations.
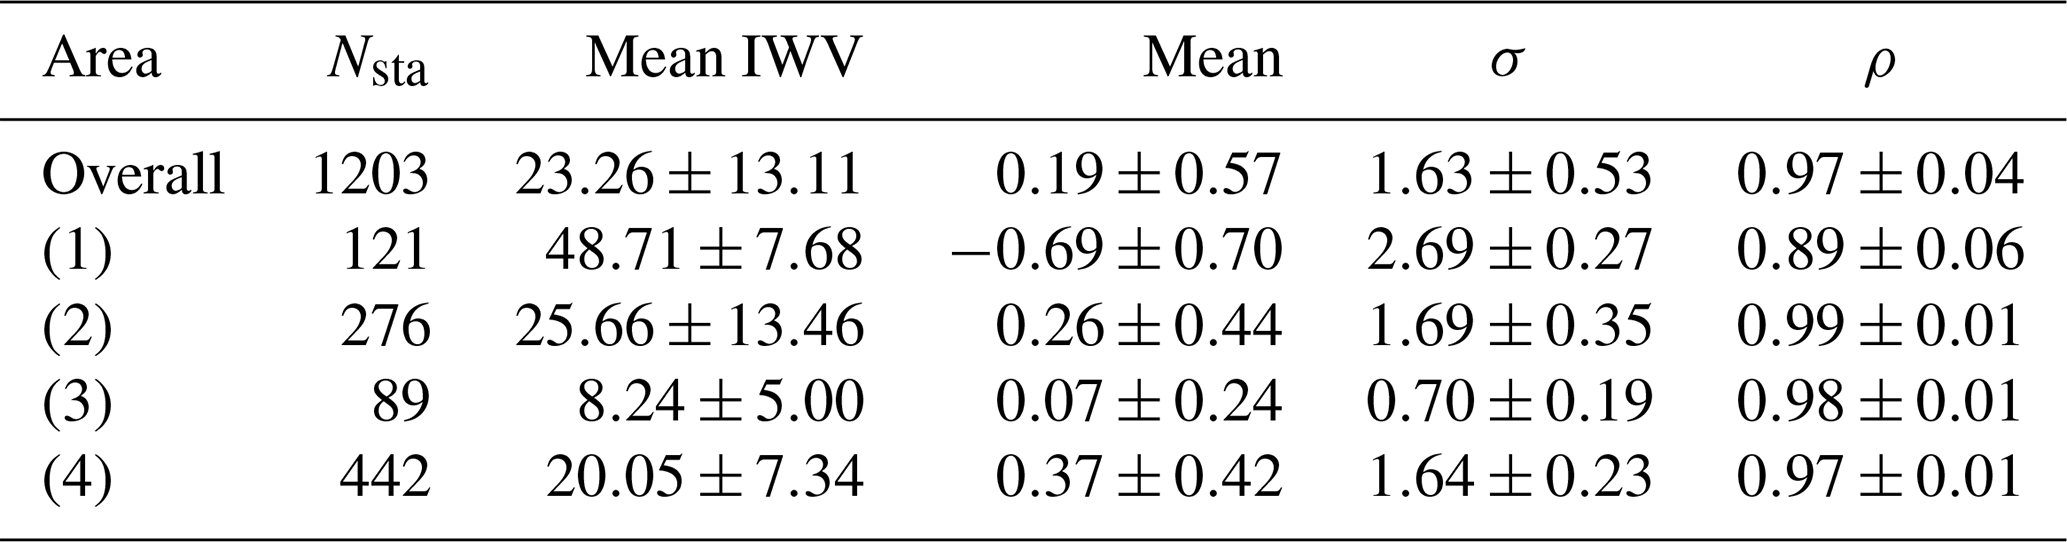
Table 1Statistics of IWV differences between ERAI, ERA5, and GNSS over all stations and over four domains: Caribbean (1), Northern America East Coast (2), Arctic Circle (3) and Western Europe (4). Nsta denotes the number of stations in the area; mean IWV (kg m−2) is the mean IWV from all GNSS stations on the area; “mean” is the mean difference (kg m−2, ERAI, ERA5 − GNSS), σ the standard deviation of difference (kg m−2), and ρ the mean correlation coefficient. The values indicate the mean ± 1 SD (standard deviation) over the stations in the domain. Note that some stations are outside of the four main domains.
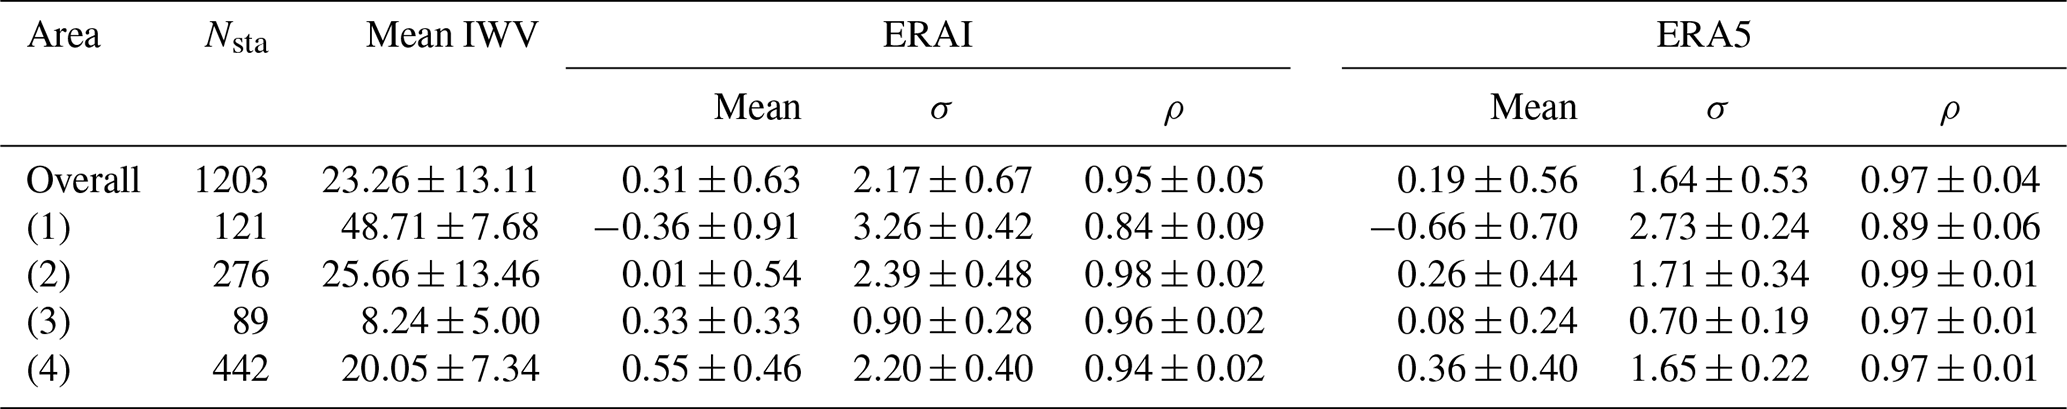
Figure 3 gives an overview of the observed differences between the IWV from the ERAI and ERA5 reanalyses and GNSS for the whole network. Both reanalyses show an overall small wet bias compared to GNSS, but the bias is slightly smaller for ERA5 compared to ERAI: 0.31±0.63 kg m−2 for ERAI and 0.19±0.56 kg m−2 for ERA5. A significant overall reduction in the standard deviation of differences is also observed, from 2.17±0.67 kg m−2 for ERAI to 1.64±0.53 kg m−2 for ERA5, which highlights a better representation of the IWV time variations with ERA5 than with ERAI. This reduction in standard deviation also comes with an increase in the correlation coefficient from 0.95 to 0.97. For all three statistics, a tightening of the histograms is clearly observed, as well as an increase in the number of classes corresponding to lower values for bias and standard deviation and higher values for the correlation coefficient with ERA5. The overall better agreement between ERA5 and GNSS can be thought as being due to smaller representativeness errors (errors due to some small-scale variability that is not resolved by the reanalysis but captured by GNSS observations) with ERA5 than with ERAI, thanks to its higher spatial resolution (31 km compared to 80 km), and the impact of more water vapour observations (especially from satellites) in the more recent reanalysis (Hersbach et al., 2020).
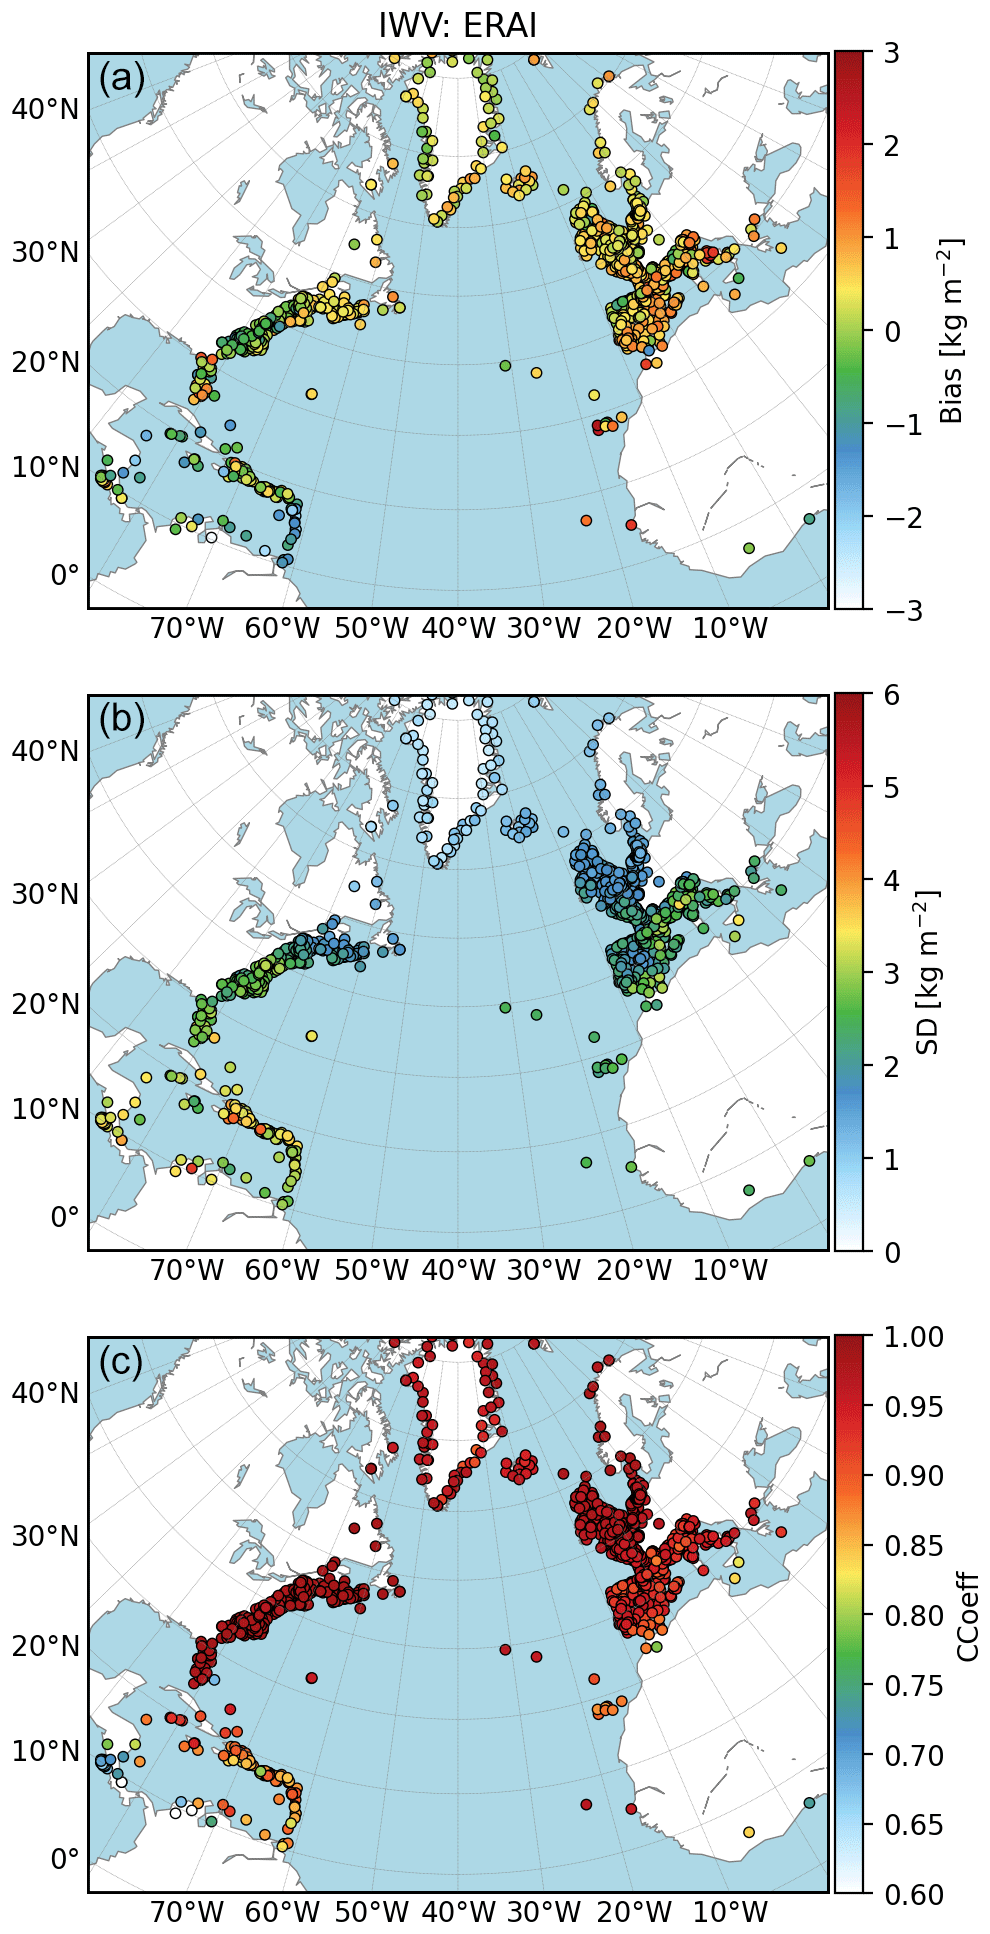
Figure 4Maps of comparisons between ERAI and GNSS IWV for all stations. From (a) to (c), bias (kg m−2, reanalysis minus GNSS), standard-deviation (kg m−2) and correlation coefficient.
The geographical distribution of the three statistics (bias, standard deviation of differences, and correlation coefficient) for both reanalysis is presented in Figs. 4 and 5. It is obvious from these figures that the statistics are strongly region-dependent. Both reanalyses show contrasted agreement with GNSS depending on the region with some differences between the reanalyses. In order to simplify the discussion, the results are analysed in four domains: (1) the Caribbean sea, (2) the Northern America East Coast, (3) Greenland and the broader area close to the Arctic Circle, and (4) Western Europe. The results in all four regions are more spotted (larger dispersion between sites) with ERAI than with ERA5. This feature does again highlight the larger representativeness errors with ERAI. The biases show a quite large scatter from station to station, but more positive biases are observed over Europe (wet bias in the reanalyses) and more negative biases in the Caribbean. The biases are further discussed below. The standard deviation and correlation coefficient are more uniform within each region and highlight: (i) smaller standard deviation in the Arctic where the mean IWV content is lower, (ii) higher correlation in the US where more observations are assimilated, and (iii) higher standard deviation and smaller correlation in the Caribbean where the mean IWV content and the amplitude of temporal variability is higher.
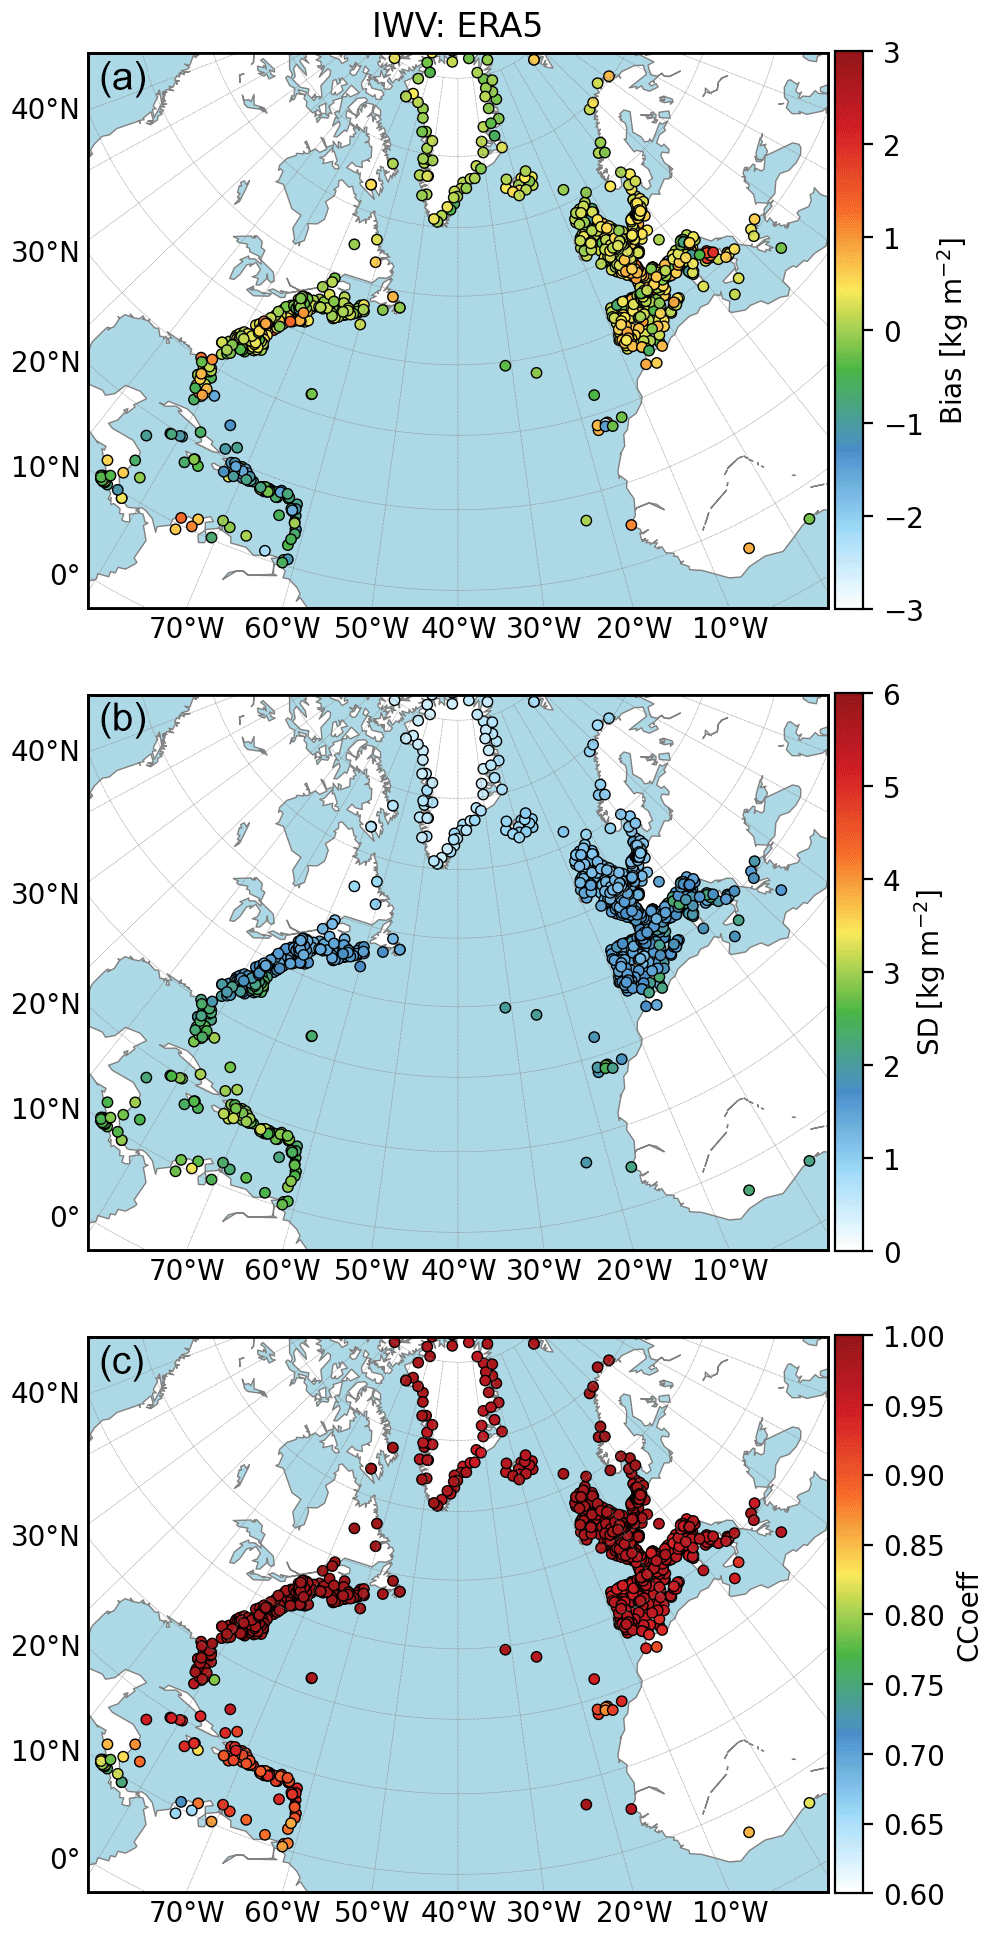
Figure 5Same as Fig. 4 for comparisons between ERA5 and GNSS IWV.
Table 1 reports the average results along with the dispersion (one standard deviation) in the 4 geographical areas. The general comments on standard deviation and correlation are easily checked based on these numbers. It is noticeable that the results are systematically improved with ERA5 in all four regions. The mean IWV numbers also highlight the huge difference in total column water vapour content between the tropics (48.7 kg m−2) and the Arctic region (8.2 kg m−2). One interesting feature here is also the high variability along the Northern America East Coast (13.5 kg m−2) that reflects the alternation of strong cyclonic activity and quieter weather conditions in this region during this period of the year. Cyclonic activity in the storm track region also impacts the Western Europe area as reflected from the relatively high space-time variability (7.3 kg m−2 to be compared to the moderate mean of 20 kg m−2).
Coming back to the biases, we emphasized that the mean bias compared to GNSS is slightly reduced in ERA5. However, this result is not uniform throughout the large study area, nor is the sign of the bias between regions. The most striking feature is the negative (dry) bias in the Caribbean in both reanalyses. This is in contrast with the positive (wet) bias in the other regions, in both reanalyses. Such a spatial variation in the mean IWV differences was already highlighted by Parracho et al. (2018) and Bock and Parracho (2019), as a strong systematic feature of ERAI (based on 16 years of data). Both studies showed that ERAI has an overall dry bias in the inter-tropical band and an opposite wet bias at higher latitudes. The reason hypothesized in these studies is the difference in the nature of data assimilated. In the tropics, most of the humidity observations come from satellite observations over the oceans, while over the more continental higher latitudes (especially northern latitudes), the many radiosonde observations have still a strong impact in the data assimilation process and the water vapour observations from satellites are limited over land. These characteristics are again found in ERA5 probably for the same reasons. The second interesting result is the consistency of the systematic difference between ERAI and ERA5 in three of the regions where the bias difference is about 0.2–0.3 kg m−2, with ERA5 drier than ERAI. Only for the Northern America East Coast is ERA5 moister than ERAI. This result is not explained. Finally, the larger absolute value of the dry bias in ERA5 in the Caribbean compared to ERAI may simply be due to the combination of the overall 0.2–0.3 mean difference between the two reanalyses and the dry bias in the tropics discussed above.
In the framework of the NAWDEX project, GNSS data from more than 1200 CORS located along the North Atlantic arc have been analysed over a one month period during fall 2016. An outlier screening method was applied to ZTD data and rejected about 0.3 % of the data. The method is based on distribution of ZTD and its formal error. It also improved other processing outputs such as the mean ambiguity resolution rate and the height repeatability. GNSS IWV estimates were computed using surface fields from ECMWF reanalyses, ERAI and ERA5, and then compared to the IWV fields from these reanalyses. The change from ERAI to ERA5 goes together with a significant reduction in standard deviation (25 % decrease) and a slight improvement in correlation with GNSS which are partly explained by reduced representativeness errors in ERA5 as well as the impact of more recent model physics and enhanced data assimilation. Improvements are noticeable in the entire area considered in this study but the results show some regional variability due to the contrasted climates between the Tropics and the Arctic. The study highlights a slight reduction in the overall wet bias in ERA5 compared to ERAI in all regions except along Northern America East Coast. This result is unexplained and will be investigated in more detail in the future. Consistent with previous studies based on ERAI, a small dry bias was found in both reanalyses in the Tropics. However, the absolute value of this bias is increased in ERA5 compared to ERAI. We hypothesize this is a result of the overall wet bias reduction observed in ERA5 and the dry bias in the Tropics. In conclusion, general good agreement is found between both reanalyses and GNSS, with a small superiority in the quality of the IWV represented in the ERA5 reanalysis. The higher temporal resolution of ERA5 (1-hourly) combined with the GNSS IWV time series makes both data sets especially useful to study high impact weather events. The GNSS IWV data set is available from the NAWDEX database.
The providers listed in Table A1 are gratefully acknowledged for giving access to the GNSS data used in this study.
Khan et al., 2016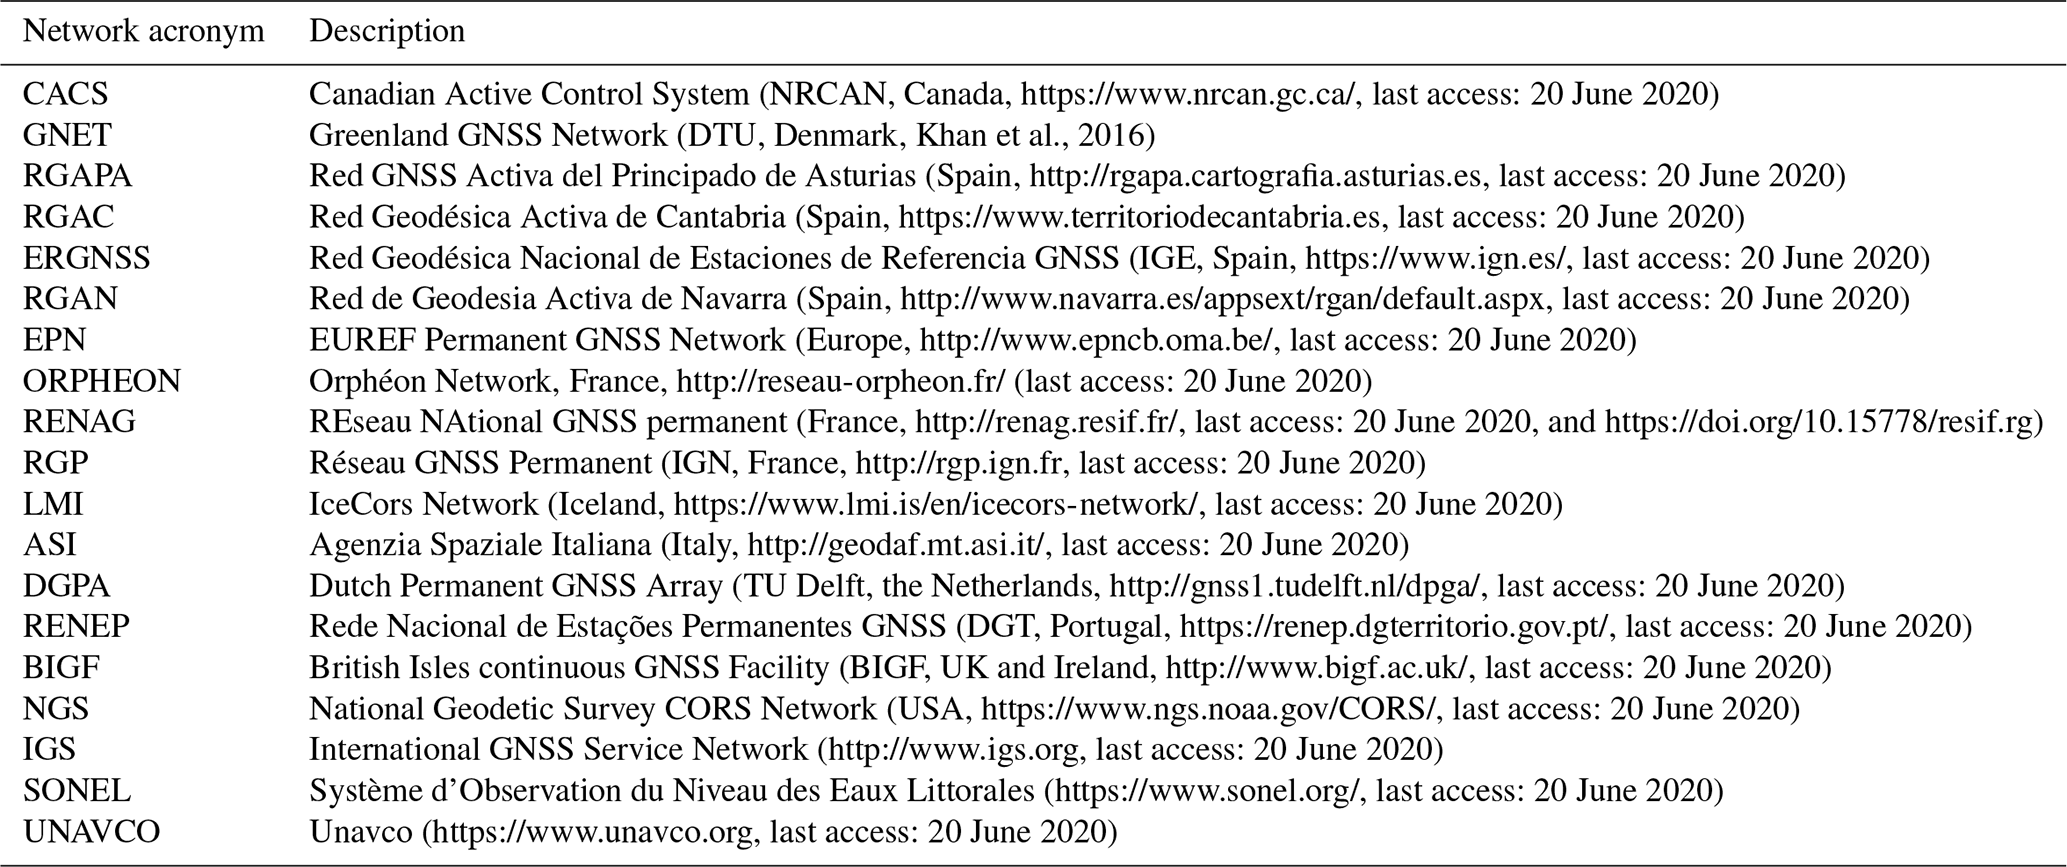
A 6 h resampling of ERA5 grid is evaluated with respect to GNSS IWV in order to assess the impact of the time resolution of the reanalysis. Results are presented in Table B1. No significant change was observed for bias, standard deviation and correlation coefficient.
Table B1Similar to Table 1 but for ERA5 only with 6-hourly data.
The data used for this work are made available by the different providers listed in Table A1. The IWV products described in this study can be provided for free on demand.
PB collected and processed the GNSS data and computed all the results. PB and OB analysed the results and co-wrote the article.
The authors declare that they have no conflict of interests.
This article is part of the special issue “European Geosciences Union General Assembly 2020, EGU Geodesy Division”. It is a result of the EGU General Assembly 2020, 4–8 May 2020.
Authors acknowledge the French National Research Agency (ANR) via the project DIP-NAWDEX (grant: ANR-17-CE01-0010). All the GNSS data providers are acknowledged. More specifically, RESIF is a national Research Infrastructure, recognised as such by the French Ministry of Higher Education and Research. RESIF is managed by the RESIF Consortium, composed of 18 Research Institutions and Universities in France. RESIF is additionally supported by a public grant overseen by the French National Research Agency (ANR) as part of the “Investissements d'Avenir” program (reference: ANR-11-EQPX-0040) and the French Ministry of Ecology, Sustainable Development and Energy. ORPHEON GNSS data were provided to the authors for scientific use in the framework of the GEODATA-INSU-CNRS convention. This material is based on services provided by the GAGE Facility, operated by UNAVCO, Inc., with support from the National Science Foundation and the National Aeronautics and Space Administration under NSF Cooperative Agreement EAR-1724794.
This research has been supported by the French National Research Agency (ANR) via the project DIP-NAWDEX (grant: ANR-17-CE01-0010).
This paper was edited by Pawel Wielgosz and reviewed by two anonymous referees.
Bertiger, W., Desai, S. D., Haines, B., Harvey, N., Moore, A. W., Owen, S., and Weiss, J. P.: Single receiver phase ambiguity resolution with GPS data, J. Geod., 84, 327–337, https://doi.org/10.1007/s00190-010-0371-9, 2010. a
Bevis, M., Bussinger, S., Herring, T. A., Rocken, C., Anthes, R. A., and Ware, R. H.: GPS Meteorology: Remote Sensing of Atmospheric Water Vapor Using the Global Positioning System, J. Geophys. Res., 97, 15787–15801, 1992. a
Bock, O. and Parracho, A. C.: Consistency and representativeness of integrated water vapour from ground-based GPS observations and ERA-Interim reanalysis, Atmos. Chem. Phys., 19, 9453–9468, https://doi.org/10.5194/acp-19-9453-2019, 2019. a
Bock, O., Bouin, M. N., Doerflinger, E., Collard, P., Masson, F., Meynadier, R., Nahmani, S., Koité, M., Gaptia Lawan Balawan, K., Didé, F., Ouedraogo, D., Pokperlaar, S., Ngamini, J.-B., Lafore, J. P., Janicot, S., Guichard, F., and Nuret, M.: West African Monsoon observed with ground-based GPS receivers during African Monsoon Multidisciplinary Analysis (AMMA), J. Geophys. Res., 113, 21005, https://doi.org/10.1029/2008JD010327, 2008. a
Bock, O., Willis, P., Wang, J., and Mears, C.: A high-quality, homogenized, global, long-term (1993–2008) DORIS precipitable water data set for climate monitoring and model verification, J. Geophys. Res.-Atmos., 119, 7209–7230, https://doi.org/10.1002/2013JD021124, 2014. a
Bock, O., Bosser, P., Pacione, R., Nuret, M., Fourrié, N., and Parracho, A.: A high-quality reprocessed ground-based GPS dataset for atmospheric process studies, radiosonde and model evaluation, and reanalysis of HyMeX Special Observing Period, Q. J. Roy. Meteorol. Soc., 142, 56–71, https://doi.org/10.1002/qj.2701, 2016. a, b
Boehm, J. and Schuh, H.: Atmospheric Effects in Space Geodesy, Springer Atmospheric Sciences, Berlin, 2013. a, b
Boehm, J., Niell, A. E., Tregoning, P., and Schuh, H.: The Global Mapping Function (GMF): A new empirical mapping function based on numerical weather model data, Geophys. Res. Lett., 33, L07304, https://doi.org/10.1029/2005GL025546, 2006. a
Boehm, J., Heinkelmann, R., and Schuh, H.: A global model of pressure and temperature for geodetic applications, J. Geod., 81, 679–683, https://doi.org/10.1007/s00190-007-0135-3, 2007. a
Byun, S. H. and Bar-Sever, Y. E.: A new type of troposphere zenith path delay product of the international GNSS service, J. Geod., 83, 1–7, https://doi.org/10.1007/s00190-008-0288-8, 2009. a
Dee, D. P., Uppala, S. M., Simmons, A. J., Berrisford, P., Poli, P., Kobayashi, S., Andrae, U., Balmaseda, M. A., Balsamo, G., Bauer, P., Bechtold, P., Beljaars, A. C. M., van de Berg, L., Bidlot, J., Bormann, N., Delsol, C., Dragani, R., Fuentes, M., Geer, A. J., Haimberger, L., Healy, S. B., Hersbach, H., Hólm, E. V., Isaksen, L., Kållberg, P., Köhler, M., Matricardi, M., McNally, A. P., Monge-Sanz, B. M., Morcrette, J.-J., Park, B.-K., Peubey, C., de Rosnay, P., Tavolato, C., Thépaut, J.-N., and Vitart, F.: The ERA-Interim reanalysis: configuration and performance of the data assimilation system, Q. J. Roy. Meteorol. Soc., 137, 553–597, https://doi.org/10.1002/qj.828, 2011. a
Guerova, G., Jones, J., Douša, J., Dick, G., de Haan, S., Pottiaux, E., Bock, O., Pacione, R., Elgered, G., Vedel, H., and Bender, M.: Review of the state of the art and future prospects of the ground-based GNSS meteorology in Europe, Atmos. Meas. Tech., 9, 5385–5406, https://doi.org/10.5194/amt-9-5385-2016, 2016. a
Hersbach, H., Bell, B., Berrisford, P., Hirahara, S., Horányi, A., Muñoz-Sabater, J., Nicolas, J., Peubey, C., Radu, R., Schepers, D., Simmons, A., Soci, C., Abdalla, S., Abellan, X., Balsamo, G., Bechtold, P., Biavati, G., Bidlot, J., Bonavita, M., De Chiara, G., Dahlgren, P., Dee, D., Diamantakis, M., Dragani, R., Flemming, J., Forbes, R., Fuentes, M., Geer, A., Haimberger, L., Healy, S., Hogan, R. J., Hólm, E., Janisková, M., Keeley, S., Laloyaux, P., Lopez, P., Lupu, C., Radnoti, G., de Rosnay, P., Rozum, I., Vamborg, F., Villaume, S., and Thépaut, J.-N.: The ERA5 Global Reanalysis, Q. J. Roy. Meteorol. Soc., 146, 1999–2049, https://doi.org/10.1002/qj.3803, 2020. a, b
Khan, S. A., Sasgen, I., Bevis, M., van Dam, T., Bamber, J. L., Wahr, J., Willis, M., Kjær, K. H., Wouters, B., Helm, V., Csatho, B., Fleming, K., Bjørk, A. A., Aschwanden, A., Knudsen, P., and Munneke, P. K.: Geodetic measurements reveal similarities between post–Last Glacial Maximum and present-day mass loss from the Greenland ice sheet, Sci. Adv., 2, e1600931, https://doi.org/10.1126/sciadv.1600931, 2016. a
Lyard, F., Lefevre, F., Letellier, T., and Francis, O.: Modelling the global ocean tides: insights from FES2004, Ocean Dynam., 56, 394–415, 2006. a
Parracho, A. C., Bock, O., and Bastin, S.: Global IWV trends and variability in atmospheric reanalyses and GPS observations, Atmos. Chem. Phys., 18, 16213–16237, https://doi.org/10.5194/acp-18-16213-2018, 2018. a, b, c
Petit, G. and Luzum, B.: IERS 2010 Conventions, Tech. rep., IERS, Frankfurt am Main, Germany, 2010. a
Poli, P., Moll, P., Rabier, F., Desroziers, G., Chapnik, B., Berre, L., Healy, S. B., Andersson, E., and El Guelai, F.-Z.: Forecast impact studies of zenith total delay data from European near real-time GPS stations in Météo-France 4DVAR, J. Geophys. Res., 112, D06114, https://doi.org/10.1029/2006JD007430, 2007. a
Saastamoinen, J.: Atmospheric correction for the troposphere and stratosphere in radio ranging of satellites, in the use of artificial Satellites for geodesy, Geophys. Monogr.,15, 16, 1972. a
Schäfler, A., Craig, G., Wernli, H., Arbogast, P., Doyle, J. D., McTaggart-Cowan, R., Methven, J., Riviẽre, G., Ament, F., Boettcher, M., Bramberger, M., Cazenave, Q., Cotton, R., Crewell, S., Delanoë, J., Dörnbrack, A., Ehrlich, A., Ewald, F., Fix, A., Grams, C. M., Gray, S. L., Grob, H., Groß, S., Hagen, M., Harvey, B., Hirsch, L., Jacob, M., Kölling, T., Konow, H., Lemmerz, C., Lux, O., Magnusson, L., Mayer, B., Mech, M., Moore, R., Pelon, J., Quinting, J., Rahm, S., Rapp, M., Rautenhaus, M., Reitebuch, O., Reynolds, C. A., Sodemann, H., Spengler, T., Vaughan, G., Wendisch, M., Wirth, M., Witschas, B., Wolf, K., and Zinner, T.: The North Atlantic Waveguide and Downstream Impact Experiment, B. Am. Meteorol. Soc., 99, 1607–1637, https://doi.org/10.1175/BAMS-D-17-0003.1, 2018. a
Steigenberger, P., Boehm, J., and Tesmer, V.: Comparison of GMF/GPT with VMF1/ECMWF and implications for atmospheric loading, J. Geod., 83, 943–951, https://doi.org/10.1007/s00190-009-0311-8, 2009. a
Thayer, G.: An improved equation for the radio refractive index of air, Radio Sci., 9, 803–807, 1974. a
Wang, J. and Zhang, L.: Systematic Errors in Global Radiosonde Precipitable Water Data from Comparisons with Ground-Based GPS Measurements, J. Climate, 21, 2218–2238, https://doi.org/10.1175/2007jcli1944.1, 2008. a
Zumberge, J. F., Heflin, M. B., Jefferson, D. C., and Watkins, M. M.: Precise point positioning for the efficient and robust analysis of GPS data from large networks, J. Geophys. Res., 102, 5005–5017, 1997. a
- Abstract
- Introduction
- GNSS data analysis
- Comparisons of ERA reanalysis with GNSS IWV
- Conclusions
- Appendix A: GNSS data providers
- Appendix B: Impact of ERA5 time resolution on differences with GNSS
- Data availability
- Author contributions
- Competing interests
- Special issue statement
- Acknowledgements
- Financial support
- Review statement
- References