 | 08 Jun 2021
Thermo-hydro-mechanical modelling study of heat extraction and flow processes in enhanced geothermal systems
Dejian Zhou
Alexandru Tatomir
Martin Sauter
Enhanced Geothermal Systems (EGS) are widely used in the development and application of geothermal energy production. They usually consist of two deep boreholes (well doublet) circulation systems, with hot water being abstracted, passed through a heat exchanger, and reinjected into the geothermal reservoir. Recently, simple analytical solutions have been proposed to estimate water pressure at the abstraction borehole. Nevertheless, these methods do not consider the influence of complex geometrical fracture patterns and the effects of the coupled thermal and mechanical processes. In this study, we implemented a coupled thermo-hydro-mechanical (THM) model to simulate the processes of heat extraction, reservoir deformation, and groundwater flow in the fractured rock reservoir. The THM model is validated with analytical solutions and existing published results. The results from the systems of single fracture zone and multi-fracture zones are investigated and compared. It shows that the growth of the number and spacing of fracture zones can effectively decrease the pore pressure difference between injection and abstraction wells; it also increases the production temperature at the abstraction, the service life-spans, and heat production rate of the geothermal reservoirs. Furthermore, the sensitivity analysis on the flow rate is also implemented. It is observed that a larger flow rate leads to a higher abstraction temperature and heat production rate at the end of the simulation, but the pressure difference may become lower.
- Article
(817 KB) - Full-text XML
- BibTeX
- EndNote


The Increasing development of geothermal energy has become a central issue globally for its low-carbon generation and environmental friendliness (Sun et al., 2018). However, the exploitation of geothermal energy is widely restricted by reservoir structure and properties. Nearly 98 % of geothermal energy is stored within the Hot Dry Rocks (HDRs) (Armstead and Tester, 1987), whose permeability and porosity are very low. Thus, the low permeabilities being the main obstacle for successful exploitation of the heat resources.
Generally, the HDRs are located 3–10 km beneath the ground level, with temperatures ranging between 150 to 650∘ (Brown et al., 1995). The Enhanced Geothermal System (EGS) was developed to overcome the low permeability of HDR systems (Olasolo et al., 2015). An EGS is a man-made reservoir created in the subsurface where hot rocks are available, but they are insufficiently permeable for the high flow rate circulation to be economical. In EGS, the cold fracturing fluid is injected into the subsurface to increase the permeability by dilating pre-existing fractures or creating new ones. The increased permeability allows the fluid underground to circulate through the newly created fracture zones. The hot fluid is abstracted from the abstraction well; then the cold fluid is re-injected into the subsurface to form the circulation. Two main criteria need to be addressed when designing an EGS (Kaya et al., 2011; Rivera et al., 2015; Figueiredo et al., 2020): (1) temperature at the abstraction well: if the temperature decreases quickly during the operation, the lifetime of the EGS will be much restricted; (2) the pore pressure difference between wells of injection and abstraction; if the pressure difference is too large, the EGS will not be cost-effective, i.e., the cost of injection and abstraction will be too high. Therefore, these two criteria are investigated in our study.
Recently, a mathematical model capable of handling the thermal, hydraulic, and mechanical (THM) coupled processes was developed and implemented within different numerical simulators for the investigation of the performance of the geothermal reservoirs in EGS (e.g., Ogata et al., 2018; Pandey et al., 2018; Danko and Bahrami, 2012; Li et al., 2016). The THM numerical model can simulate the migration of fluid, thermal transfer, and matrix deformation in the fractured underground structures and become the suitable approach for investigating the multi-physical processes in EGS. In EGS, usually several artificially fracture zones are created. Usually, these fractures are oriented roughly parallel to each other (Lei et al., 2019). To handle the geometrical complexity of the fracture systems and decrease computational effort, some studies focus on one single fracture zone (e.g., Figueiredo et al., 2020; Knarud and Geving, 2015). However, this kind of operation ignores the influence from neighbouring fractures and/or fracture zones. Therefore, the heat production rates are likely to be under-or over-estimated.
The main objective of this study is to apply and test a THM numerical model capable of simulating the coupled THM processes occurring in an EGS. The mathematic model is firstly validated by the analytical solutions, then the THM model consisting of parallel fracture zones is validated with the model proposed by Figueiredo et al. (2020). The model assumes that fractures were already created or re-opened within the fracture zone. Commonly, more fracture zones are present in an EGS. Even though the rock permeability is extremely low and the fracture zones in the EGS are not hydraulically connected, they can influence each other through the stress distribution. Therefore, in this study, we investigate the THM effects induced by the fracture zone number and spacing on the overall pressure and temperature distributions at the injection and extraction wells by comparing the results successively among several sets of parallel fracture zones. Furthermore, a sensitivity analysis on the flow rate is also implemented to investigate the role of flow rate in the heat production process in EGS.
The mathematical model describing the coupled THM processes involved in EGS is similar to those described by Sun et al. (2018) and Yao et al. (2017).
Darcy's law describes the fluid flow in the subsurface porous system:
in which, K is the permeability tensor of the porous media which is assumed to be homogenous and isotropic,
μ is the dynamic viscosity of water. With the mass variation of water being considered:
In which S is storage term, here:
Where ϕ is the initial porosity assumed to be homogenously distributed, Xf and Xm are the compressibility of water and surrounding matrix respectively.
Deformation is assumed to be elastic. The force balance equation is given with:
with Fv is the external force, mainly gravity, σ is the stress tensor acting on the matrix. According to previous research (Rutqvist and Tsang, 2002; Rutqvist et al., 2013), the stress-induced mechanical porosity ϕeff can be expressed by stationary initial porosity ϕ and the volumetric strain εv:
with the volumetric strain being the sum of the axial strain, according to Hook's law and theory of poroelasticity:
where E is the elastic modulus, ν is the Poisson's ratio, the effective stress in the porous medium, σii is the external stress acting on the matrix, αb is the biot-coefficient, p is the pore pressure and pref is the stationary reference pressure. To obtain the effective permeability of surrounding rocks, an empirical relationship between the permeability and porosity has been generally applied (Pashin et al., 1998; Pan and Connell, 2007; Li et al., 2016; Rutqvist and Tsang, 2002):
The power-law coefficient n varies with different geological material and structure, usually between 3 to 25 (Rutqvist et al., 2013), in which the value 15 is widely applied in the researches (Rutqvist and Tsang, 2002; Rutqvist et al., 2013; Figueiredo et al., 2020).
In the non-isothermal model, the influence of temperature variations on the strain is also considered, the influence mainly results from thermal expansion and contraction:
in which εth is the strain caused by temperature variations, α(T) is the coefficient of thermal expansion, in general, the direction of thermal expansion or contraction depends on the property of the material. Here, all materials are assumed to be homogeneous; thus α(T) is isotropic. T−Tref is the temperature changes during the non-isothermal injection and abstraction of water. The temperature distribution and thermal transfer is described by the energy conservation equation:
in which, CP is the heat capacity of water, k is the thermal conductivity, uw is Darcy velocity, Q is the thermal source and sink, the subscript eff stands for an average value of water and surrounding rocks:
where ρw, ρm, CPw, CPm, kw and km are density, heat capacity and thermal conductivity of water and surrounding rocks respectively; kdisp is the coefficient of thermal dispersion
3.1 Simulation strategy
The numerical simulator COMSOL Multiphysics is employed to solve the complex coupled partial differential equations, which uses the finite element method for space discretization when solving the system of partial differential equations describing the coupled THM processes. The production strategies for EGS are presented in Fig. 1. Four scenarios have been raised to implement the influence of the fracture structures on the performance of geothermal reservoirs. The blue part presents the fracture zones in which the cold water is injected and hot water is abstracted. Scenario 1 has one fracture zone located in the middle (250 m above the lower boundary) of the surrounding rocks; scenario 2 and 3 have two parallel fracture zones, but the zone spacings are different; Scenario 4 has three parallel fracture zones. The total injection and abstraction rates are the same for the four scenarios, i.e., 12 L/s (Figueiredo et al., 2020). The rates are assumed to be distributed evenly for the scenarios with multi fracture zones, which means for the scenario 2 and 3, the rate is 6 L/s and the value is 4 L/s for the scenario 4. The heating processes within the injection and abstraction tubes and the preferentially flow within the fracture zone is ignored.
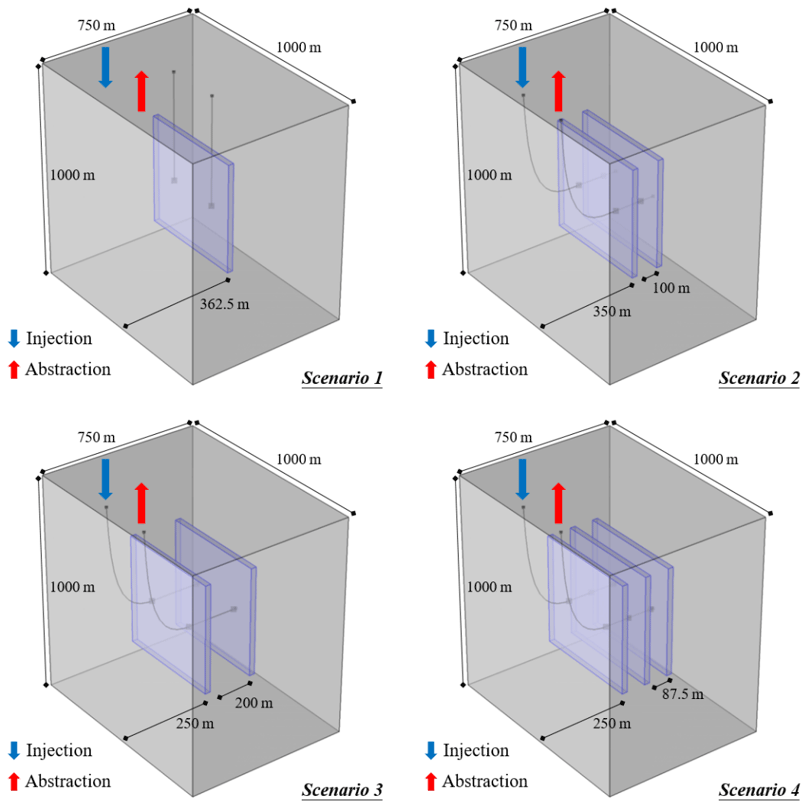
Figure 1Geometry and scenarios for the numerical simulation (Scenario 1: single fracture zone; Scenario 2: two parallel fracture zones with tight spacing; Scenario 3: two parallel fracture zones with loose spacing; Scenario 4: three parallel fracture zones).
3.2 Geometry and boundary conditions
The simulated domain size is 1000 m by 1000 m by 750 m, and the size of the fracture zones is 500 m by 500 m by 25 m. The top of the domain is located 6000 m below ground level. The x-coordinate axis is parallel to the fracture direction and the z-axis is vertical. The abstraction and injection wells are symmetrical to the centre of the modelling domain. The spacing between the two wells is 250 m.
Because of the low permeability of the surrounding rock matrix, it is assumed that water will not enter the rock material, and all outside model boundaries are assumed tight for fluid flow. A static temperature distribution linearly increasing from 132 ∘C at the top boundary with a constant thermal gradient of 18 ∘C/km is assigned (Figueiredo et al., 2020). This temperature gradient has been observed in several sites in Sweden (Ahlbom et al., 1995). It is also assumed that the top and bottom boundaries are at large distances from the fracture zones, and the temperature at the two boundaries is set constant to the initial temperature. The normal displacements are set to be zero for all six boundaries. The initial pressure distribution in the system results from a hydrostatic pressure gradient (9.81 MPa/km) and an atmospheric pressure of 0.1 MPa at the surface. This results in the pressure of 63 MPa at the top and 73.4 MPa at the bottom of the domain. The vertical stress distribution is calculated from an overburden density of 2700 kg/m3 and the horizontal stress is set equal to the vertical stress. Table 1 presents the other parameters used in the model. Coldwater is injected into the injection borehole with a temperature of 47∘. After being heated by the surrounding rocks, the thermal water is abstracted at the abstraction borehole located 250 m away from the injection borehole. The total production time is 30 years.

3.3 Methodology to estimate the heat production performance
In this work, heat production rate (W) and the totoal produced energy (E) are employed for the judegment of the heat production performance of the aforementioned 4 scenarios. The formulas for W and E are as following:
where n is the number of fracture zones, Q(t) is the production rate, Cpw is the water capacity and Tout(t) and Tin are the production temperature and injection temperature respectively.
With the value of total simulation timets, the total producted energy can be described:
The validation of the THM model is necessary before its further application. The two-dimensional analytical solutions considering fluid flow in single fracture zone is firstly employed to validate our model.
Afterward, the THM model is applied to a realistic three-dimensional EGS system for which no analytical solutions are available, and it is compared with published literature data, i.e., Figueiredo et al. (2020). The hydro-mechanical coupled model, without including the thermal coupling, has been used to perform a verification benchmark with the academic simulator DuMuX (Zhou et al., 2020).
4.1 Two-dimensional validation of the coupled thermal- hydraulic model
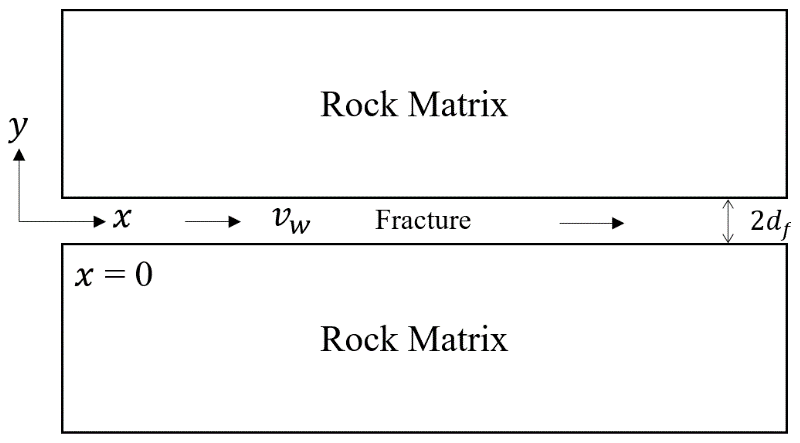
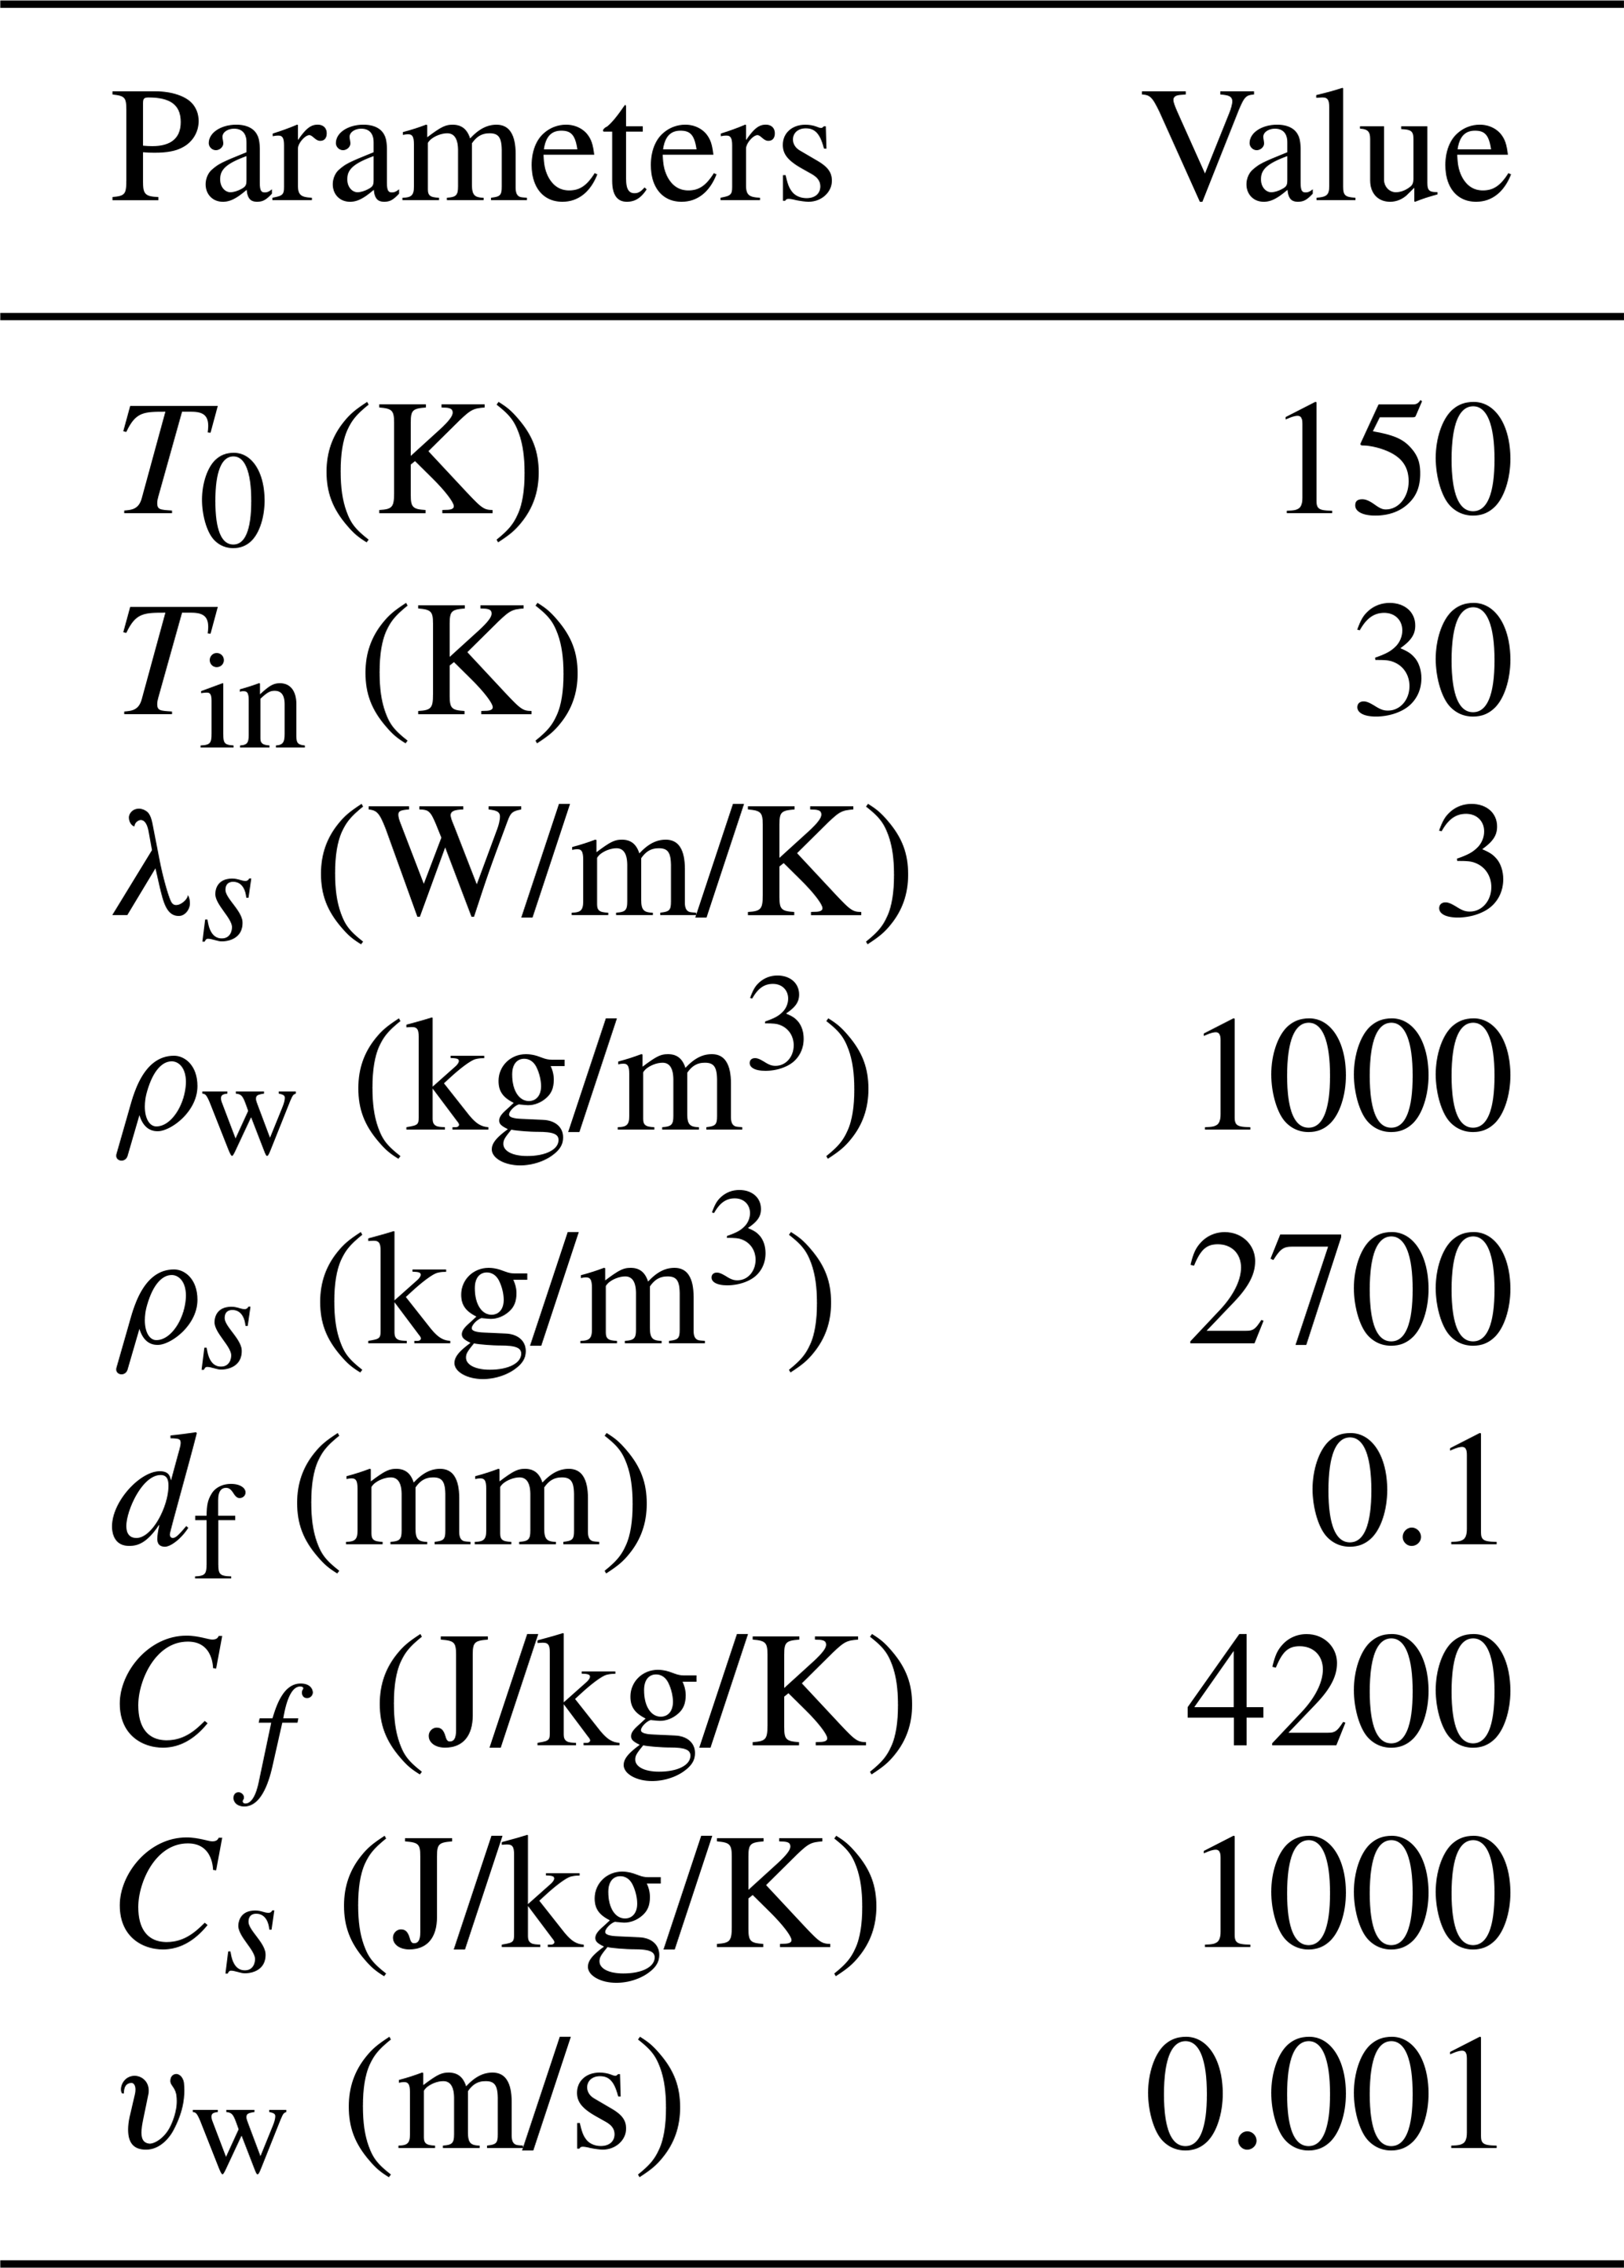
For the validation of the thermal-hydraulic coupling, the analytical solution proposed by Lauwerier et al. (1955) and Barends et al. (2010) is employed. This solution describes the temperature variation caused by the heat convection and conduction within a single fracture with a given aperture. As presented in Fig. 2, the single fracture is located in the middle of the geometry, surrounded by rock matrices. The thickness of the rock matrices is assumed to be infinite. Heat is transferred by thermal conduction in the rock matrix while heat convection dominates within the fracture. During the heat abstraction, water is injected into the fracture with a constant flow velocity vf and temperature Tin. The analytical solution can be described as following:
where T0 is the initial temperature of the system, λs is the thermal conductivity of the matrix rocks, ρw, ρs, Cpw and Cps are the density and heat capacities of water and rock matrix respectively, df is the fracture aperture, “erfc()” is the residual error function and “U()” is the unit step function. The detailed value of the parameters for the analytical solution and numerical simulation are presented in Table 2
The comparisons of numerical simulation with the analytical solution are presented in Fig. 3. Figure 3a illustrates the temperature variation over time at different positions (x= 10, 30 and 50 m). Spatial temperature distribution at different time points (t= 10, 30 and 50 d) is illustrated in Fig. 3b.

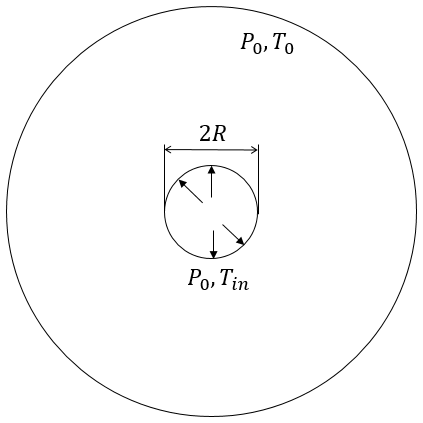
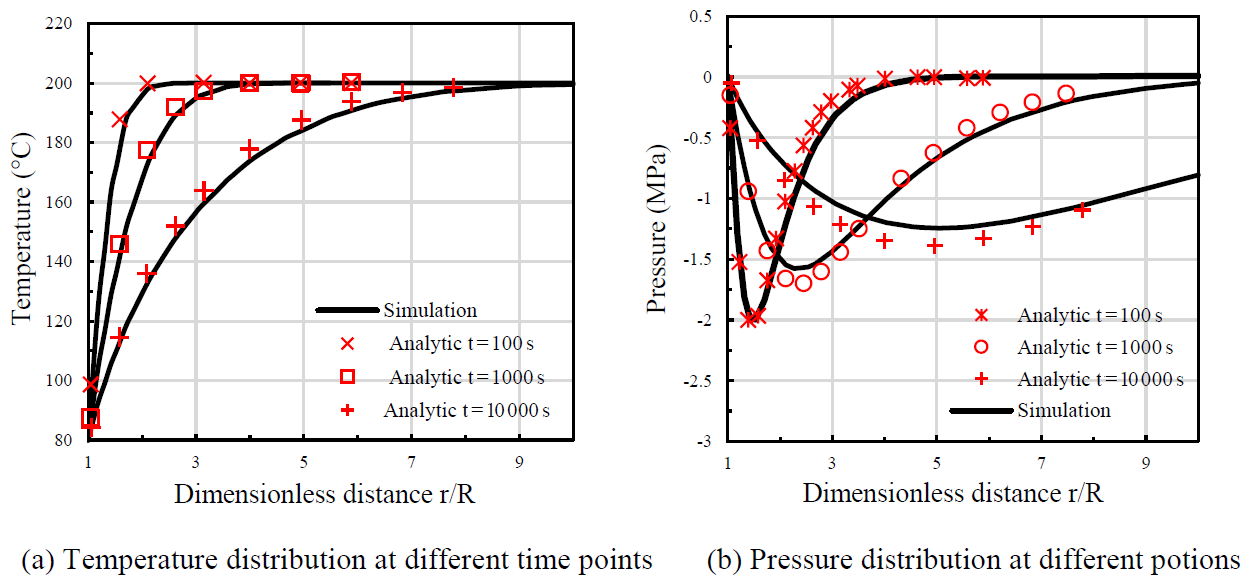
In this case, the variations of pressure and temperature resulting from the thermal consolidation obtained with the numerical model are compared with the analytical solution. The thermal consolidation problem is a typical problem involving coupled THM effects, i.e., temperature variation, pressure dissipation, and mechanical deformation (Guo et al., 2020), which is the same as the THM coupling effect within the fractured porous material underground. The analytical solution is proposed by Ghassemi and Zhang (2004). The geometry of the validation model is presented in Fig. 4. A wellbore with radius R= 0.1 m is located in the middle of the reservoir with an initial temperature of 200∘. The reservoir is assumed to be infinite and fully saturated with water initially. At the beginning of the simulation, the wellbore rapidly is cooled and maintained at 80∘, and the simulation lasts 1×10⁴ s. The other parameters are the same as Ghassemi and Zhang (2004). Figure 5 presents the comparison results. Figure 5a and b illustrate the distributions of temperature and pore pressure at different time points. The simulation results have an excellent agreement with the results from the analytical solution for both the cases, which indicates the accuracy and feasibility of the numerical model and its implementation.
4.2 Mesh sensitivity analysis
Scenario 1 is selected for performing a sensitivity analysis with respect to the mesh size. The results for the sensitivity analysis for the mesh and boundaries are presented in Fig. 6a. For our numerical model, the mesh of the fracture zone is done with cubical elements and for the surrounding rock matrix, tetrahedral elements. The elements are uniformly distributed within the whole domain. It is observed that the pore pressure difference between injection and abstraction wells varies with various finite element grids. The pore pressure difference is 6.87 MPa when the number of elements is 12 702. With the increase of element number, the pressure difference decreases until the mesh number reaches 15 322. From the 15 322 elements, the pressure difference remains approximately constant. Therefore, in this paper, a grid with 15 322 elements is selected.
Figueiredo et al. (2020) study focused on the EGS performance containing a single fracture zone. The authors did investigate the influence of fracture proximity to the simulation domain boundary. Since the distances between the fracture zone and domain boundaries vary between the different scenarios, a sensitivity analysis regarding the distance is performed (Fig. 6b). As expected, the closer to the boundary, the higher the influence is observed, with a high difference between results. The pressure differences increase with increasing distance, and they become smaller (< 0.01 MPa) when the distance equals 250 m. Thus, the distance of 250 m is further used in this work.
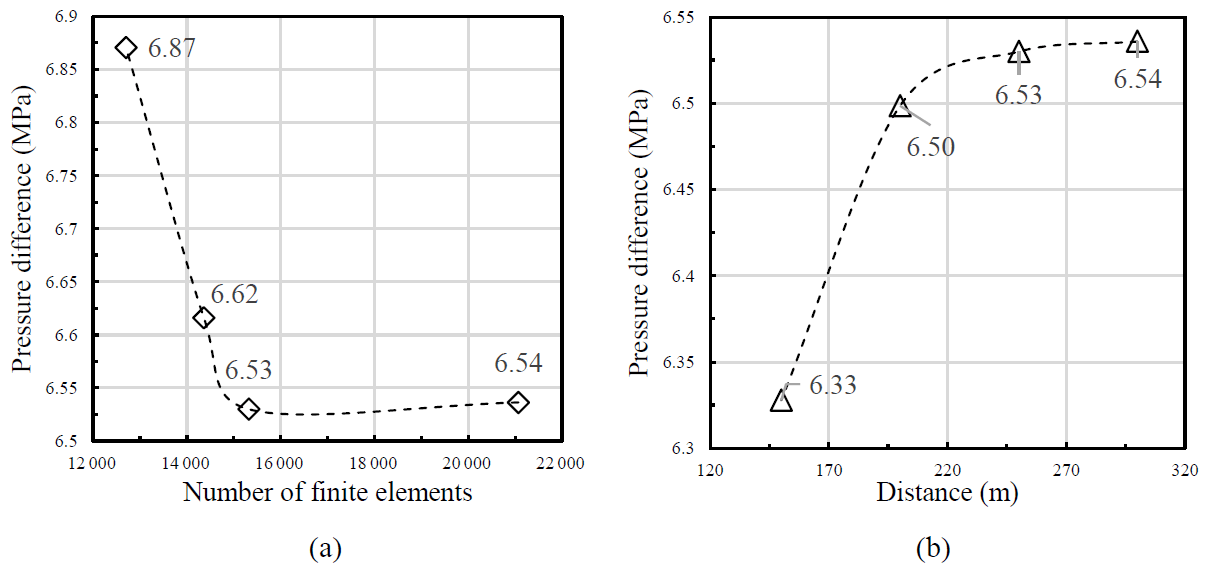
Figure 6(a) Sensitivity analysis with respect to finite element mesh and (b) Sensitivity analysis with respect to distance between fracture zone and domain boundary.
4.3 Validation and verification of the three-dimensional numerical model
The THM coupled processes are nonlinear and very complex; the validations based only on the analytical solutions are insufficient. The comparison with the published THM model is necessary and the agreement between different simulators enhances the confidence for our numerical model. This is the purpose of performing the benchmarks (Zhou et al., 2020).
The results obtained with our THM model are compared with Figueiredo et al. (2020) model. The simulated domain size and the parameters employed for our validation model are set to be the same as Figueiredo et al. (2020), i.e., 2000 m × 2000 m × 110 m with a fractured zone of 1000 m × 1000 m × 10 m located in the middle part. The detailed parameters are presented in Table 1. The finite element mesh setting is the same as the mesh sensitivity analysis, and there are altogether 17 876 elements generated in the validation model.
Figure 7 presents the pore pressure difference between injection and abstraction wells plotted versus time for the two numerical simulators. It is observed that the results are in very good agreement. The pore pressure difference reaches a peak after ten days of injection, where it remains stable and starts decreasing after approximately 1000 d in both models. The good agreement of the results indicates the THM model is reliable.

Figure 7Pore pressure difference with time for the two numerical simulators, i.e. current THM model implemented in COMSOL Multiphysics and Figueiredo et al. (2020) using TOUGH-FLAC
Having the model verified with analytical solutions and published results, we studied the effect of different reservoir characteristics, e.g., single fracture zone compared to the complex (multi-fracture) system on heat production.
Figure 8 presents the temperature distribution in the 30th year for the four scenarios. Besides the fracture zones, a flat perpendicular to the fracture zones is also applied to present the heat distribution among the rock matrix. The y coordinate of the perpendicular plane is the same as the value of the injection well. Obviously, the low-temperature zones mainly exist within the fracture zones, and the decrease of temperature is comparably lower in the surrounding rock matrix than that in fracture zones. This is because, within fracture zones, the heat is transferred by both thermal conduction and convection, while due to the lower permeability of the rock matrix, only thermal conduction works within the rock matrix. Additionally, with the increase of the fracture zone number, the vertical extent of the low-temperature zones decreases, but the horizontal extent increases, indicating the connection and influence from the neighboring fractures are enhanced.
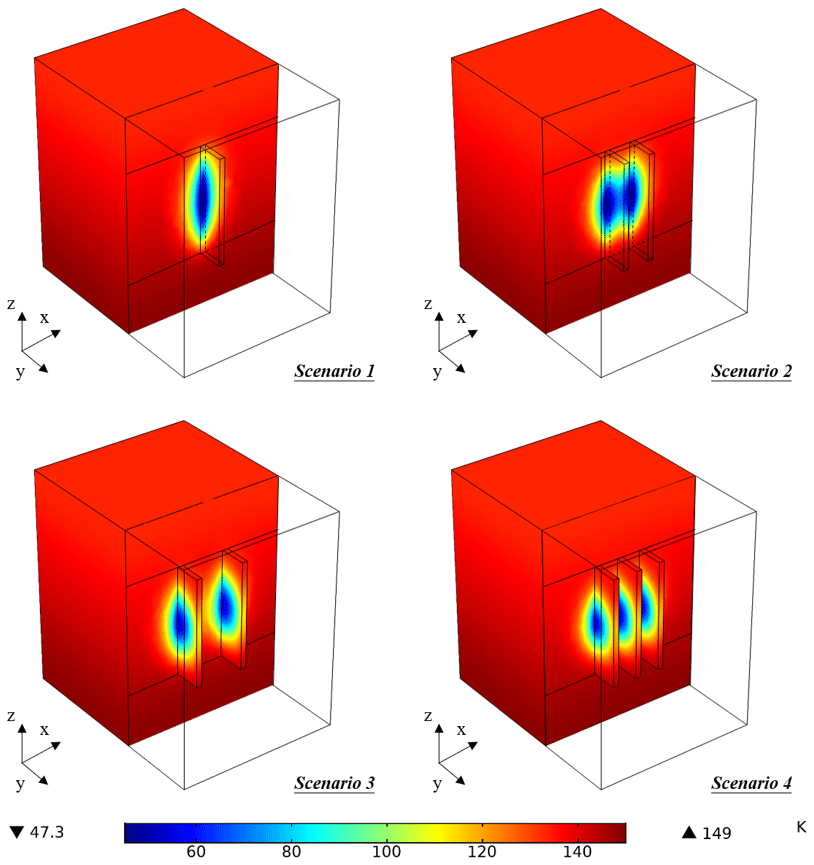
Figure 9a and b presents the comparison of the pore pressure difference between injection and abstraction wells and the abstraction temperature among different scenarios, respectively. It is observed that the pressure difference and production temperature vary with the number, spacing, and location of fracture zones. Scenario 2 and 3 are applied for the investigation of the fracture zone spacing and scenario 4 is used for the fracture zone location. Since the domain is symmetric for scenarios 2, 3, and 4, only the results from one (the one closer to origin) side of the fracture zones are presented here.
As illustrated in Fig. 9a, the overall tendencies for all the scenarios are the same, but the discrepancies are apparent. By comparing scenario 1 with scenario 2, 3 and 4, it can be obtained that the multi-fracture system can decrease the pore pressure difference due to the lower injection and abstraction rate. Comparing scenario 2 and 3, the fracture zone spacing has a noticeable influence on the pore pressure difference. The final values are 4.93 and 6.06 MPa, respectively. This indicates the decrease in the distance between the fracture zones can effectively decrease the pore pressure difference. Furthermore, for the three parallel fracture zone system, it is obtained that the middle fracture zone has a comparably lower pressure difference (3.57 MPa) than that (4.23 MPa) of the side fracture zone.
The temperature evolutions are presented in Fig. 9b. It is observed that during the initial period of the simulation (approx. 500 d), the discrepancies among the scenarios are minimal. This is because, at the beginning of the injection, the energy supply from the near rock matrix is sufficient. The production temperature from scenario 1 firstly decreases at about 500 d. After 2000 d, the production temperatures start to diverge depending on the different fracture zone spacings and their locations. By comparing scenarios 2 with 3, the lower spacing results in a lower temperature at abstraction well. This is because in scenario 2, when the energy stored in the rock matrix between the two fracture zones is consumed, i.e., the temperature of the rock matrix tends to be the same as the cold water; the rock matrix between two fracture zones can still provide the energy for heating the cold water in scenario 3. Therefore, from this time, the abstraction temperature of scenario 2 begins to be lower than that of scenario 3. The same reason can explain the discrepancy for scenario 4; the middle fracture zone obtains less energy from the surrounding rock matrix, resulting in a higher drop of the temperature at abstraction well. Furthermore, the multi- fracture zone system extends the life-span of the geothermal reservoirs. Provided that the reservoir life-span is the period before the abstraction temperature is lower than 120∘ (Guo et al., 2016), the approximately life-span of scenario 1 is the shortest while the life-span of scenario 4 is the longest.

Figure 9(a) Pressure evolution over time and (b) Temperature evolution over time for the four modelling scenarios (the middle and side for scenario 4 indicate the fracture zones located in the middle part and the side parts, respectively).
Figure 10 presents the heat production rates over time for the four scenarios. It can be observed that for all the four scenarios, as time passes, the production rates begin to drop from the initial value of 4637 KW. The tendencies of the production rates are all similar with the production temperature at abstraction. For scenario 1, the production rate begins to decrease after approximately 1000 d and drops to 3544 KW at the end of the simulation (10 000 d). For the scenario 2 and 3, the breakthrough time is slightly later, at approximately 1900 d, the drop starts and finally the production reached 4002 and 4055 kW respectively. The discrepancy of the production rate for the two scenarios results from the different fracture spacing between the neighbouring fracture zones. For scenario 4, the time for the breakthrough is the latest, at approximately 2400 d. After the breakthrough, the production rate gently decreases to 4225 kW at the end of the simulation.
By comparing the four scenarios, it is observed that the number of the fracture zones is of much higher importance for the performance of the heat production in EGS. With the number increasing from 1 to 3, the final production rates increase from 3544 to 4225 kW; the amplitude reaches to nearly 19.2 %. Thus, it can be obtained that the multi-fracture zone system can improve the reservoir heat production rate.

Figure 10Reservoir heat production rates variation with time for the four modelling scenarios.
Table 3Cumulative produced energy for 4 scenarios at 30th year.
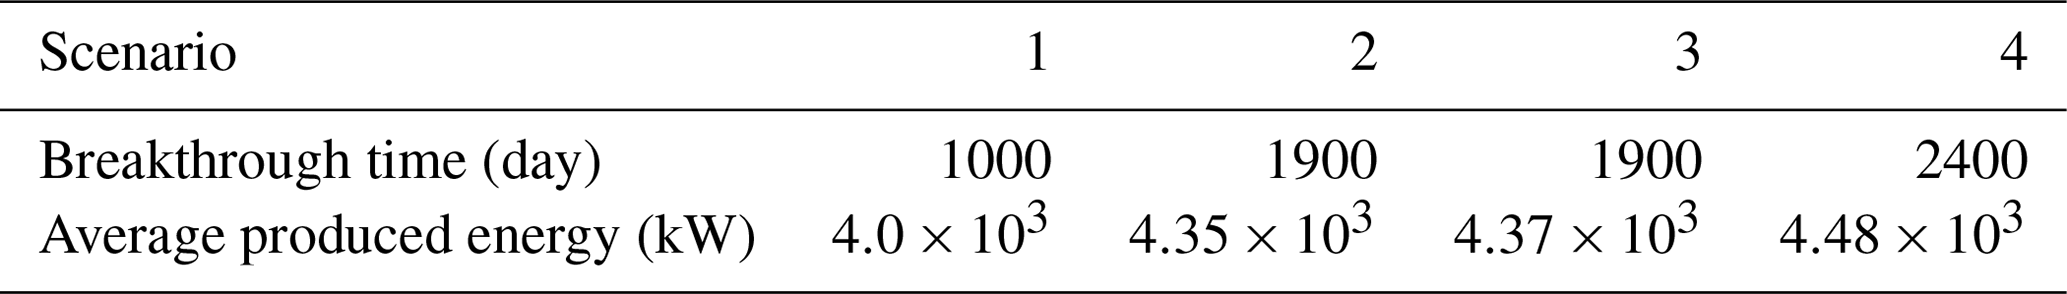
Additionally, the breakthrough time and the cumulatively produced energies of the four scenarios at the 30th year are presented in Table 3. The breakthrough time is proportional to the number of the fracture zone, which indicates the energy production of multi- fracture zone reservoir is more stable and enduring than the single- fracture zone reservoir. It is also observed that after the 30-year service time, the variations for different scenarios are noticeable; the maximum discrepancy is 12 % from scenario 1 and 4. Thus, it can be concluded that the multi- fracture zone system provides a more stable and robust energy output.
The performance of the geothermal reservoirs for different flow rates is presented in Fig. 11. Scenario 2 is employed for the investigation. It is found that the pressure difference has an initial shoot-up and a subsequent decrease as the simulation progresses. Additionally, the shoot-up and steep reduction are related to the flow rate because of the mechanical response of the fracture zone- matrix system. In the injection well, by injecting the working fluid, the overpressure becomes positive, which leads to an increase of permeability and then a reduction of the overpressure and the same for abstraction well. Meanwhile, the larger flow rate leads to a larger hydro-mechanical effect (a more considerable increase of permeability). Therefore, the subsequent steeper reduction in the pressure difference between the two wells is more evident for the larger flow rate. Figure 11b illustrates the evaluation of outlet temperature over time. It is obvious that the outlet temperature and breakthrough time have an inverse relationship with the flow rate, the larger the flow rate is; the higher and later the outlet temperature and breakthrough time are.

Figure 11Evolution of (a) pressure difference and (b) temperature at the production well for different flow rates (Scenario 2).
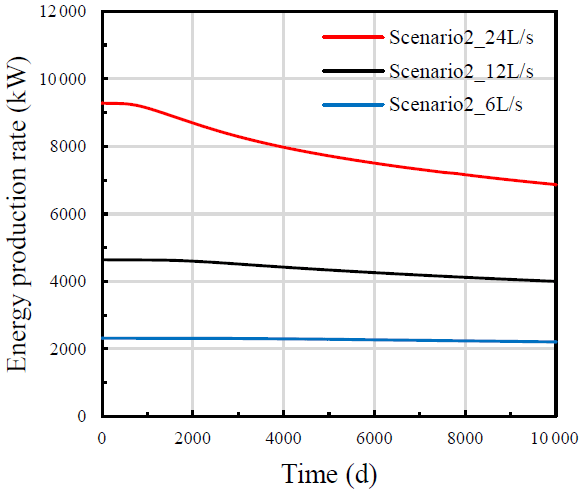
Figure 12 presents energy production rates and their evolution over time for three flow rates (6, 12, and 24 L/s). It is found that the lowest flow rate has the most stable energy production rate. On the other hand, the largest flow rate results in a higher production rate at the initial injection period, which later decreases slowly. The average energy production rates over the whole simulation time are 7929, 4354, and 2278 kW when the flow rates are 24, 12, and 6 L/s, respectively. It shows that the efficiency of reservoir energy production is not strictly proportional to the flow rate, e.g., from 6 to 24 L/s, the flow rate increases 300 %, but the average energy production rate only increases 248 %. Thus, the determination of flow rate is of importance to reach the equilibrium of the performances of energy production and economics.
A thermo-hydro-mechanical (THM) model for studying the cold-water injection in EGS was implemented in a commercial finite element software and here presented. Model validation and verification were conducted by comparing the model results with two analytical solutions for a two-dimensional idealized domain and the comparison with Figueiredo et al. (2020) THM model in a three-dimensional EGS problem. The very good agreements among the results are a good indicator of the reliability of the numerical model to represent the coupled THM processes characteristic for EGS.
Based on the single fracture zone system raised by Figueiredo et al. (2020), in this study, a sensitivity study is implemented to remove the interference from the mesh setting and the narrow distance between the fracture zone and boundaries which strongly affects the results of the numerical simulation. The influences of the multi-fracture zones and their properties on the EGS reservoir performance are also investigated. In this sense, four scenarios were proposed where the fluid flows through a single-fracture, two- and three- parallel vertical fracture zones. The pressure difference between injection and abstraction wells, heat production rate, and average produced energy are calculated and compared. These are important factors mainly for the assessment of the economics of the geothermal production plant. Above all, the following conclusions can be drawn:
-
From Fig. 9a and b, it can be obtained that the temperature at the abstraction well is affected by the fracture zone spacing and its location, but only in a limited way, i.e., a lower spacing results in a lower production temperature; the abstraction temperature of middle fracture zone is lower than that of the side fracture zones. However, during the first period (approx. 2000 d), there is almost no difference in temperatures. On the other hand, the spacing and the locations of the fracture zones strongly influence the pore pressure differences.
-
By comparing the production temperatures among the 4 scenarios in Fig. 9b, it is observed that the multi- fracture zone system can effectively extend the service life-span of the EGS compared with the single fracture system. The heat production rate and average produced energy are proportional to the number of fracture zones. The highest average energy production rate is obtained with scenario 4, the three- parallel fracture zone system, i.e., 4.48×10³ kW over 30 years. Additionally, by comparing the results from scenario 2 and 3 in Fig. 10, the conclusion that a larger spacing between the neighbouring fracture zones leads to a higher heat production rate can be obtained.
-
The numerical sensitivity analysis concerning the operational flow rates of the EGS reservoir (Fig. 11) showed that a larger flow rate results in higher initial pressure difference values, which are subsequently followed by a steeper reduction. Due to the hydro- mechanical effects, the pressure difference from the larger flow rate (24 L/s) can be lower than that from the lower flow rate (12 L/s). The final outlet temperature and the breakthrough time have an inversely proportional relationship with the flow rate.
-
The relationship between flow rate and average energy production rate is not linear (Fig. 12). Higher energy production rates are obtained at higher flow rates but are declining faster than those at lower flow rates.
No data sets were used in this article.
DZ and AT determined the research direction and finished the initial version of the numerical model. DZ finished the original writing of the manuscript, and AT and MS are responsible for the review.
The authors declare that they have no conflict of interest.
This article is part of the special issue “European Geosciences Union General Assembly 2020, EGU Division Energy, Resources & Environment (ERE)”. It is a result of the EGU General Assembly 2020, 4–8 May 2020.
The support provided by China Scholarship Council is acknowledged.
This research has been supported by the China Scholarship Council (grant no. 1).
This open-access publication was funded by the University of Göttingen.
This paper was edited by Maren Brehme and reviewed by two anonymous referees.
Ahlbom, K., Olsson, O., and Sehlstedt, S.: Temperature Conditions in the SKB Study Sites, Stockholm, Svensk kärnbränslehantering AB, 1995.
Armstead, H. C. H. and Tester, J. W.: Heat Mining, E. & F. N. Spon, London and New York, 55–58, 1987.
Barends, F. B.: Complete Solution for Transient Heat Transport in Porous Media, Following Lauwerier's Concept, Paper presented at the SPE Annual Technical Conference and Exhibition, Florence, Italy, September 2010, https://doi.org/10.2118/134670-MS, 2010.
Brown, D.: The US hot dry rock program-20 years of experience in reservoir testing. In Proceedings of the World Geothermal Congress, Florence, Italy, 2607–2611, 1995.
Danko, G., Bahrami, D.: A New T-H-M-C Model Development for Discrete-FractureEGS Studies, Geoth. Res. T., 36, 383–391, 2012.
Figueiredo, B., Tsang, C., and Niemi, A.: The Influence of Coupled Thermomechanical Processes on the Pressure and Temperature due to Cold Water Injection into Multiple Fracture Zones in Deep Rock Formation, Geofluids, 2020, 1–14, https://doi.org/10.1155/2020/8947258, 2020.
Ghassemi, A. and Zhang, Q.: A transient fictitious stress boundary element method for poro-thermoselastic media, Eng. Anal. Bound. Elem., 2004, 1363–1373, 2004.
Guo, B., Fu, P., Hao, Y., Peters, C., and Carrigan, C.: Thermal drawdown-induced flow channeling in a single fracture in EGS, Geothermics, 61, 46–62, https://doi.org/10.1016/j.geothermics.2016.01.004, 2016.
Guo, T., Tang, S., Sun, J., Gong, F., Liu, X., Qu, Z., and Zhang, W.: A coupled thermal-hydraulic-mechanical modeling and evaluation of geothermal extraction in the enhanced geothermal system based on analytic hierarchy process and fuzzy comprehensive evaluation, Appl. Energ., 258, 113981, https://doi.org/10.1016/j.apenergy.2019.113981, 2020.
Kaya, E., Zarrouk, S. J., and O'Sullivan, M. J.: Reinjection in geothermal fields: A review of worldwide experience, Renew. Sust. Energ. Rev., 2011, 47–68, https://doi.org/10.1016/j.rser.2010.07.032, 2011.
Knarud, J. and Geving, S.: Implementation and Benchmarking of a 3D Hygrothermal Model in the COMSOL Multiphysics Software, Energy Proceedia, 78, 3440–3445, https://doi.org/10.1016/j.egypro.2015.12.327, 2015.
Lauwerier, H. A.: The transport of heat in an oil layer caused by the injection of hot fluid, Appl. Sci. Res., 5, 145e150, https://doi.org/10.1007/BF03184614, 1955.
Lei, Z., Zhang, Y., Zhang, S., Fu, L., Hu, Z., Yu, Z., Li, L., and Zhou, J.: Electricity generation from an three-horizontal-well enhanced geothermal system in the Qiabuqia geothermal field, China: Slickwater fracturing treatments for different reservoir scenarios, Renew. Energ., 145, 65–83, https://doi.org/10.1016/j.renene.2019.06.024, 2019.
Li, S., Fan, C., Han, J., Luo, M., Yang, Z., and Bi, H.: A fully coupled thermal-hydraulic-mechanical model with two-phase flow for coalbed methane extraction, J. Nat. Gas Sci. Eng., 33, 324–336, https://doi.org/10.1016/j.jngse.2016.05.032, 2016.
Ogata, S., Yasuhara, H., Kinoshita, N., Cheon, D.-S., and Kishida, K.: Modeling of coupled thermal-hydraulic- mechanical-chemical processes for predicting the evolution in permeability and reactive transport behavior within single rock fractures, Int. J. Rock Mech. Min., 107, 271–281, https://doi.org/10.1016/j.ijrmms.2018.04.015, 2018.
Olasolo, P., Juárez, M. C., Morales, M. P., D'Amico, S., and Liarte, I. A.: Enhanced geothermal systems (EGS): A review, Renew. Sustain. Energ. Rev., 56, 133–144, https://doi.org/10.1016/j.rser.2015.11.031, 2015.
Pan, Z. and Connell, L. D.: A theoretical model for gas adsorption induced coal swelling, Int. J. Coal Geol., 69, 243–252, 2007.
Pandey, S. N., Vishal, V., and Chaudhuri, A.: Geothermal reservoir modeling in a coupled thermo-hydro- mechanical-chemical approach: A review, Earth-Sci. Rev., 185, 1157–1169, https://doi.org/10.1016/j.earscirev.2018.09.004, 2018.
Pashin, J.: Stratigraphy and structure of coalbed methane reservoirs in the United States: an overview, Int. J. Coal Geol., 35, 209–240, 1998.
Rivera Diaz, A., Kaya, E., and Zarrouk, S. J.: Reinjection in geothermal fields – A worldwide review update, Renew. Sust. Energ. Rev., 53, 105–162, https://doi.org/10.1016/j.rser.2015.07.151, 2015.
Rutqvist, J. and Tsang, C.: A study of caprock hydromechanical changes associated with CO2-injection into a brine formation, Environ. Geol., 42, 296–305, https://doi.org/10.1007/s00254-001-0499-2, 2002.
Rutqvist, J., Rinaldi, A., Cappa, F., and Moridis, G.: Modeling of fault reactivation and induced seismicity during hydraulic fracturing of shale-gas reservoirs, J. Petrol. Sci. Eng., 107, 31–44, https://doi.org/10.1016/j.petrol.2013.04.023, 2013.
Sun, Z., Xin, Y., Yao, J., Zhang, K., Zhuang, L., Zhu, X., Wang, T., and Jiang, C.: Numerical Investigation on the Heat Extraction Capacity of Dual Horizontal Wells in Enhanced Geothermal Systems Based on the 3-D 421 THM, Model. Energies, 11, 280, https://doi.org/10.3390/en11020280, 2018.
Yao, J., Zhang, X., Sun, Z., Huang, Z., Liu, J., Li, Y., Xin, Y., Yan, X., and Liu, W.: Numerical simulation of the heat extraction in 3D-EGS with thermal-hydraulic-mechanical coupling method based on discrete fractures model, Geothermics, 74, 19–34, https://doi.org/10.1016/j.geothermics.2017.12.005, 2017.
Zhou, D., Tatomir, A., Tomac, I., and Sauter, M.: Verification benchmark for a single-phase flow hydro – mechanical model comparison between COMSOL Multiphysics and DuMuX, E3S Web Conf 205:02002, https://doi.org/10.1051/e3sconf/202020502002, 2020.
- Abstract
- Introduction
- Mathematical model of the THM coupled processes in the EGS
- Numerical simulation of the heat extraction
- Model validation and verification
- Simulation results
- Conclusion
- Data availability
- Author contributions
- Competing interests
- Special issue statement
- Acknowledgements
- Financial support
- Review statement
- References