 | 10 Dec 2020
A framework for regional smart energy planning using volunteered geographic information
Javier Valdes
Sebastian Wöllmann
Andreas Weber
Grégoire Klaus
Christina Sigl
Matthias Prem
Robert Bauer
Roland Zink
This study presents a framework for regional smart energy planning for the optimal location and sizing of small hybrid systems. By using an optimization model – in combination with weather data – various local energy systems are simulated using the Calliope and PyPSA energy system simulation tools. The optimization and simulation models are fed with GIS data from different volunteered geographic information projects, including OpenStreetMap. These allow automatic allocation of specific demand profiles to diverse OpenStreetMap building categories. Moreover, based on the characteristics of the OpenStreetMap data, a set of possible distributed energy resources, including renewables and fossil-fueled generators, is defined for each building category. The optimization model can be applied for a set of scenarios based on different assumptions on electricity prices and technologies. Moreover, to assess the impact of the scenarios on the current distribution infrastructure, a simulation model of the low- and medium-voltage network is conducted. Finally, to facilitate their dissemination, the results of the simulation are stored in a PostgreSQL database, before they are delivered by a RESTful Laravel Server and displayed in an angular web application.
- Article
(1590 KB) - Full-text XML
- BibTeX
- EndNote


The need to decarbonize the way we consume energy means that energy systems must undergo a major transformation. A restructuring of the distribution and transmission network is needed to combine the use of different sources of distributed generation, in particular renewable energies, and to manage energy supply and demand. In the electricity sector, the concept of smart grids has given way to the concept of smart energy systems, which signals the necessity to develop the whole energy system as a coherent, smart system that integrates different energy carriers and the electricity, thermal, or gas sectors (Krog and Sperling, 2019). This new concept emphasizes that the objective of transitioning to a new energy model must consider the regional energy system as a whole. For energy researchers and modellers, the concept of smart energy systems situates the research focus on a mesoscale, between the larger transmission network and the smaller grids, usually conceived at the local level. In addition to proposing joint solutions for the generation, transmission, and distribution of electricity, a smart energy system approach allows the classic business models of energy generation, transport, distribution, and commercialization to be reframed. However, it is worth asking in what aspects such an approach has advantages and to what extent it is possible to conceive the architecture and operation of this type of system.
When the restructuring of complex processes such as the generation and distribution of electricity is studied, it is necessary to develop an approach that facilitates a systematic framework for the analysis. In the last few years, different tools for the simulation and optimization of energy systems have allowed the exploration of the disadvantages and opportunities that different approaches to the modeling of urban areas offer (Abbasabadi and Ashayeri, 2019). Many of these tools have been developed thanks to recent developments in computer science and the collaboration between electrical engineers and researchers working in geoscience, particularly in geoinformatics. The recent development of new simulation and optimization models is closely linked to the change of paradigm towards a more decentralized and increasingly digitalized energy system based on renewable energy. This change, together with the existence of new databases on weather patterns with which the potential of renewable energies can be calculated using regional and global reanalyses (Kaspar et al., 2020) as well as the existence of algorithms and simulation models, makes it possible to process all these data efficiently.
However, due to the complexity of energy systems, developing a suitable tool for the modeling of electrical systems is not a trivial task. In the literature several works are dedicated to the simulation of realistic electricity systems, focusing on its different subsystems (transmission grid, distribution grids, smart grids), with a local, regional, or national focus (see for instance Grzanic et al., 2019, for a recent review). As a result, different tools of simulation, optimization, and validation methodologies of electrical systems exist and have been developed to cover different needs and levels of analysis (Kriechbaum et al., 2018), with regard to distribution networks. Moreover, the input data needed to simulate systems and their requirements differ depending on the type of model used. By instance, the simulation of new smart energy systems requires considering active and reactive power flows. In the case of distribution networks, as Grzanic et al. (2019) highlight, one of the major problems with the simulation of energy models is that a validation process is needed in order to show that the results are a realistic representation of the underlying system. Nevertheless, at the lower voltage grid level, the validation of energy systems requires access to grid topology data including information about feeders, transformers, and energy consumption data, which are mostly not available. However, the required increase in detail and accuracy increases the complexity of the task and with the data and computer power requirements (Medjroubi, 2017). The existence of new georeferenced data can help to generate more realistic models of the low grid infrastructure of the electricity sector, where data are especially scarce.
Based on previous applications and following Schiefelbein et al. (2019) and Alhamwi et al. (2017), this paper presents an approach to the planning of smart energy systems from a GIS perspective that emphasizes the geographical dimension of the task. The main objective of our approach is to design electricity networks with the simulation of multiple energy systems. In contrast with past applications reviewed in the next section, the approach is strongly based on geoprocessing tools. In our smart energy system approach, the focus lies on the integration of renewable and storage technologies, including power-to-gas technologies (PtG). PtG is regarded as a distribution generator and an electricity storage or negative control energy to counteract overloads in the grid, act as a source of heat, and facilitate the integration of renewable energy sources (Zapf, 2017).
The rest of the article is structured as follows. The next section presents an overview of current energy systems modeling approaches with a focus on open-source tools and the use of volunteered geographic information (VGI). Section 3 presents the main building blocks of the proposed framework for regional smart energy planning using VGI. Section 4 discussed the presented approach with a focus on the advantages and drawbacks, and finally, Sect. 5 presents the main conclusions.
One of the most critical factors when modeling systems is the trade-off between accuracy and simplicity. In a recent review of the available modeling tools for energy and electricity systems specially designed to cope with high shares of renewable energies, Ringkjøb et al. (2018) found at least 75 different software programs (Ringkjøb et al., 2018). In their review, they categorize the different models by their general logic, spatial–temporal resolution, and technological and economic parameters. The existence of so many model approaches shows the practically unlimited possibilities to generate scenario simulations of renewable energy systems by applying top-down, bottom-up, and hybrid models on a global, national, or regional scale.
In Europe, with the installation of the smart meters, it is possible to identify electricity generation and consumption points with minimal latency, which facilitates the generation of highly developed simulation models. Moreover, energy management systems and certificates such as the ISO 50.001 also provide the opportunity gather high-quality data on industrial, commercial, and institutional organizations. Nevertheless, few approaches can introduce detail and flexibility in the geographical dimension as the amount of data and resources required grows exponentially. This is due to the high level of complexity of the transport networks, especially the distribution networks that connect each final consumer to the points of generation.
One of the fundamental problems for researchers simulating button-up energy systems models based on high detailed geographic data dependent on high-quality data input is the access to data. To solve this question, a number of solutions focused on the use of OpenStreetMap (OSM) data have been implemented (Haklay et al., 2008). OSM data are one of the most popular and well-supported examples of volunteered geographic information (VGI). VGI collaborative mapping platforms contain free and open-source user-generated content, with billions of georeferenced data. Gathering information from VGI, especially from OSM data, has been a hot topic in the GIS community since the late 2000s (Mooney et al., 2010, p. 1). Depending on the scope of the investigation area, a high amount of geographic and technical information may be needed. OSM is often chosen and used for GIS modeling, spatial analysis, or spatial statistics. “OSM has evolved to one of the most significant and most famous VGI projects in the past years” (Barron et al., 2014, p. 877) because it is straightforward to get access to the required data. OSM data can be downloaded from the OSM database, or another alternative is to involve a smaller data set size to download an extract for a specific country or region using Geofabrik. Alhamwi et al. (2017) already showed that the quality and availability of OSM data are sufficient for scientific requirements and comparable to commercial geodata (Alhamwi et al., 2017, p. 5). The advantage of using OSM data compared to commercial geodata and other collaborative mapping platforms is that OSM is a completely free open-source database available to everyone (Valdes et al., 2018). As well as this, OSM data are always accessible compared with commercial or administrative data sets, which “are not always accessible due to the lack of availability, contradictory licensing restrictions or high procurement cost” (Barron et al., 2014, p. 877). On the other hand, the disadvantage of OSM data is that the downloaded raw data have to be adapted to the objective of the study.
The use of OSM data has proven a solution for the simulation of other infrastructure sectors, especially the transportation sector, as in Valdes et al. (2018) and Schiefelbein et al. (2019), where the authors investigated the use of points of interest (POIS) from OSM to simulate the demand for e-mobility infrastructures and heat demand respectively. Furthermore, OSM data were used to calculate infrastructural parameters such as district heating by extracting the geometries of individual buildings from OSM data (Geiß et al., 2011, pp. 1447–1471). Finally, McKenna et al. (2018) used OSM data to visualize and estimate the potential of photovoltaic, wind, and biomass power generation for the optimal planning of renewables and energy efficiency in different cities. Allhamwi et al. (2019) use OSM data to estimate the energy demand of urban energy infrastructure of a region under study in Germany. Finally, Grzanic et al. (2019) develop an approach for the generation of an electric power distribution system based on OSM and indicators collected from 99 unbundled distribution system operators (DSOs) in Europe (Prettico et al., 2018) that was validated in a Croatian region.
There are few simulation tools available that deal with energy and power system modeling capable of managing the detail of OSM data (Kriechbaum et al., 2018). In energy systems modeling, power grid simulation on low- and high-level voltage, such as in the open-source models open_eGO and SciGRID, used OSM data as the primary simulation input (Medjroubi et al., 2017 and Amme et al., 2018). Kriechbaum defines multi-energy systems as varying in their characteristics and level of flexibility although there are different frameworks for optimization and simulation. In particular, their review highlights that only three modeling tools allow the optimization of energy systems with a flexible and user-dependent spatial resolution, suited for many scenarios and focused on the optimization of energy networks and multiple regions. These three tools are PyPSA (Brown et al., 2018), Calliope (Pfenninger and Pickering, 2018), and urbs (Dorfner, 2016). All three are in an early stage of development at the moment, and being open-source, they are very dependent on the contributions of their users. Of the three tools, PyPSA and especially Calliope stand out for the abundance of documentation and the existence of a large community of users that facilitates its use and dissemination. Based on these characteristics and their complementarities (both are completely free and open Python modules) the modeling approach presented in the next section makes use of Calliope (Pfenninger and Pickering, 2018) and PyPSA (Brown et al., 2018).
Pickering and Choudhary have seen in Calliope the influence of the power nodes modeling approach developed by Heussen et al. (2010), which is also a multi-energy system simulation framework but only designed for exchanges of one energy carrier, electricity (Pickering and Choudhary, 2018). In the S6ET approach presented in the next section, a first techno-economic analysis is done with Calliope to estimate, for example, system requirements and infrastructure costs, improving power system planning and finding optimal system layouts in the range from local up to international grids (Hilbers et al., 2019; Morgenthaler et al., 2020). Calliope interactively enables this with two easy-to-use technology and location building blocks. Another strength of Calliope is the ability to define and simulate multiple scenarios. Such results can be used as a basis for investment decisions. With the command-line interface or the Python API, the models, which are composed of YAML and CSV input files, can be simulated and analyzed. These files describe the locations, links between locations, technologies, resource potentials, and constraints from which an optimization problem is derived, solved using a variety of optimizers and stored as CSV or NetCDF files (Pfenninger and Pickering, 2018).
Analyzing the power system from the technical point of view is important to show the actual state of the grid, in order, for example, to keep voltage drops in the system to a minimum and to prevent system collapse. Since current versions of Calliope do not compute an in-depth power flow simulation, we use PyPSA to do this calculation. PyPSA is designed to simulate and optimize a grid design using different methods for power flow analysis and offers the possibility to include standard line and transformer types or define specific ones for the corresponding voltage level. The modeling framework PyPSA is used in several projects to simulate networks for renewable energies (Brown et al., 2018) and is the basis of the open_eGO and SciGRID frameworks for grid development based on OSM data cited previously. Moreover, multiple models focus on the whole European Union, like for example the PyPSA-Eur (Hörsch et al., 2018), but it can also be used for smaller regions, for example for countries like South Africa (Hörsch and Calitz, 2017) and Saudi Arabia (Groissböck and Gusmao, 2017).
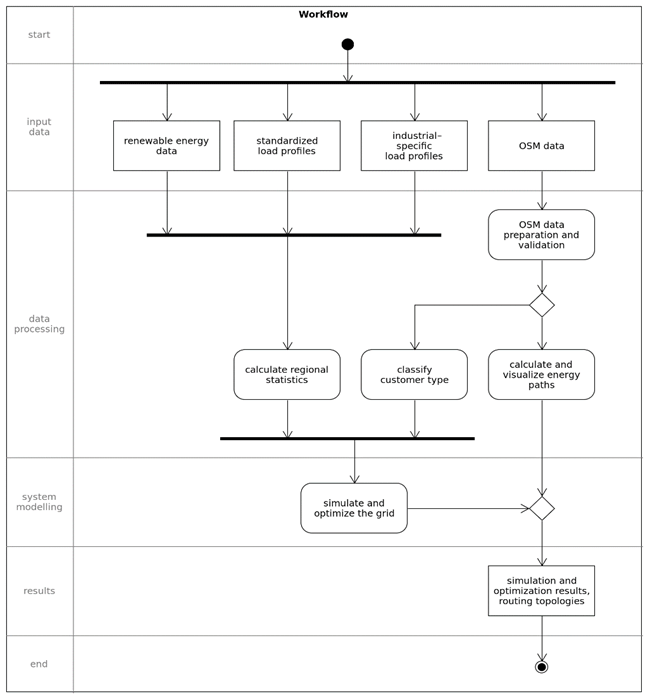
Energy systems modeling is a research area that, thanks to the increase in computing power, has been developed extensively in the last few years, which has allowed the complexity and resolution of the simulations to be increased. Due to the complexity of the simulation task, different simulation tools have been focused on specific questions, offering greater flexibility and resolution in certain areas. Simulation analyses are focused on specific areas such as the energy transport networks, the simulation of energy systems with large renewable shares, or high-resolution space–time simulation. The S6ET approach proposes a framework combining several of these approaches to achieve a broader vision. For this purpose, it proposes a workflow based on a button-up GIS approach founded on a highly granular database designed to simulate energy systems at a local level (Fig. 1). We will briefly describe the key elements of this workflow with an application in Lower Bavaria.
3.1 Geoprocessing input data
The model input data are a central element of our energy system simulation approach and are based on a combination of open data sources and electricity consumption data collected during 2019 and 2020. This electricity consumption data includes data from households, small businesses, and energy-intensive industries and are combined with VGI to geographically identify the location of consumption with a high degree of resolution.
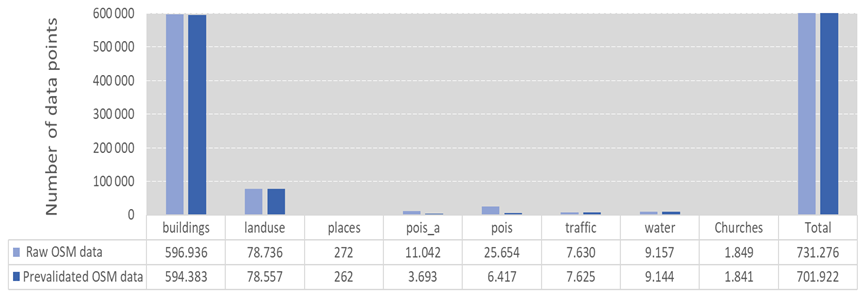
Following the prevalidation data approach of Valdes et al. (2018) and Alhamwi (2017), to identify the location of different electricity consumers, OSM data are enriched and processed together with local energy consumption statistics to establish annual consumption profiles on an hourly basis for each of the locations. Figure 2 shows how the number of OSM data decreases by about 30 000 after the prevalidation methodology of Valdes et al. (2018) in a case study in Lower Bavaria. Most of the elements identified (around 85 %) are presented in the buildings layer, containing information on the building use divided in the f classes residential, industrial, and commercial. Another layer offering a potentially more detailed source of information as the POIS, which provides precise information as the building name or economic activity only accounts for 1 % of the final prevalidated data. The same can be said of the layers traffic, places of worship and water, containing f classes such as fuel, street lamp, christian_catholic, jewish, reservoir, and docks.
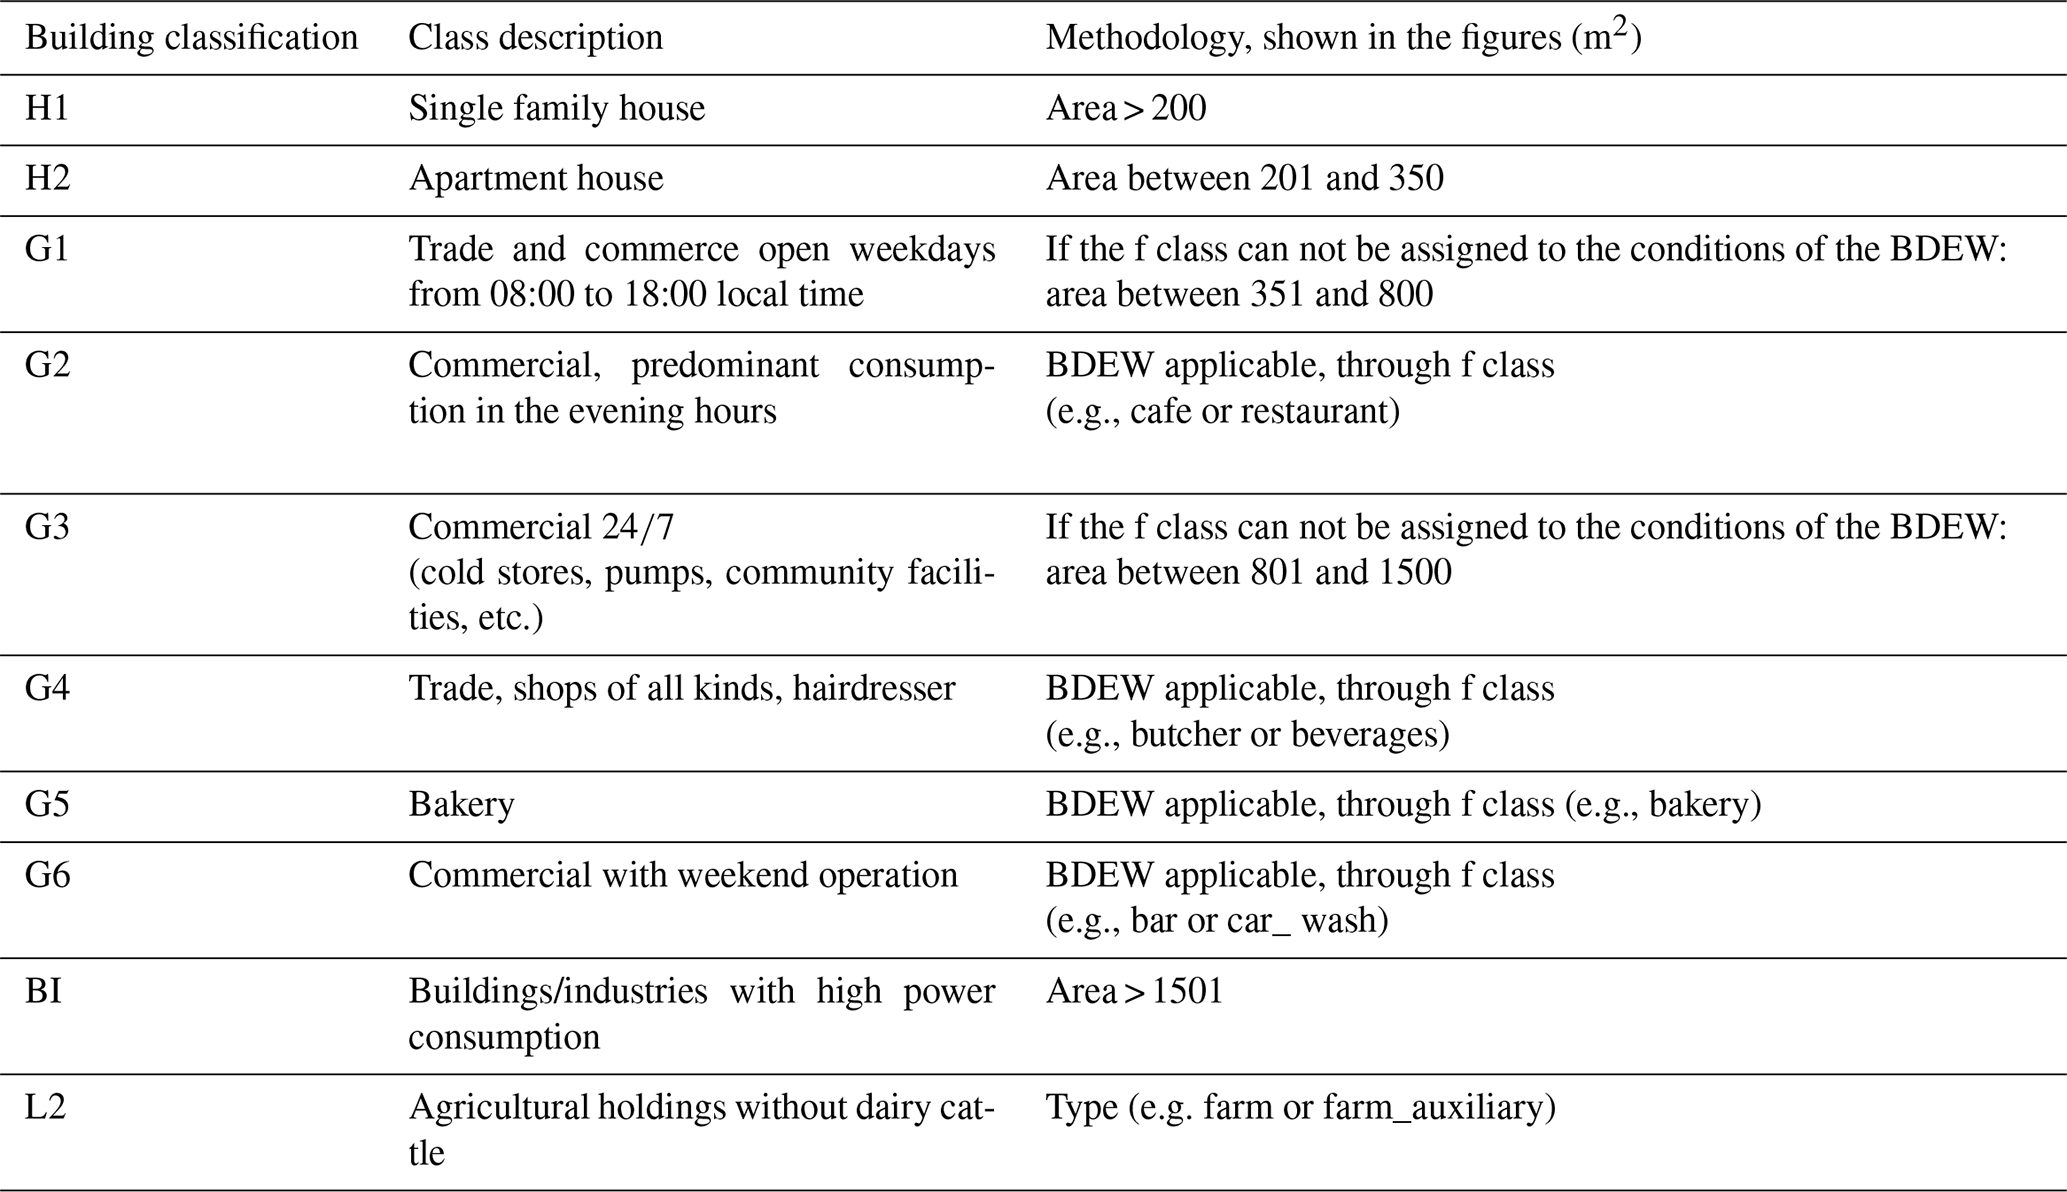
With the prevalidated OSM data, buildings are classified following the predefined parameters of the Bundesverband der Energie- und Wasserwirtschaft, which are shown in the first column of Table 1. To process the OSM data in consideration of the development of the energy model, the building classification was supplemented by three categories: single-family (H1), apartment house (H2), and buildings or industries with high power consumption (BI). The new classifications have been generated based on the scientific literature on building topology in Germany and assumptions; for an overview see the last column on Table 1, following previous research on building classification (Schröder et al., 2011; Möller and Kalusche, 2015; Heinrich, 2019; Krüger et al., 2013).
During the classification, the information from the different layers was validated. The layer land-use was used to have a first overview of the primary usage of the terrain where the buildings stand. The POIS layer contained information on the economic activity, building use, and the specific names of some buildings. There are a few layers that were considered useful during the prevalidation but are not valuable for the building classification. A significant number of the data from the layers traffic, water, land-use, and places could not be used as they contained information on f classes, such as a bridge, reservoir, river, locality, etc., that do not have a power consumption. However, using all these layers together generates several problems, for example, double-counting problems, data without information, and errors. The objective of the approach is a data set with very high information content and in order to achieve this, all processing and selection procedures must be carried out. The final amount of data is 518 505, which represents 70.9 % of the original data (Table 2).

The distribution of the data indicates that most of the OSM data are divided among H1 and H2 classifications. To verify whether the distribution and the number of residential buildings in Lower Bavaria are consistent, a comparison with the database from Zensusdatenbank (Zensus, 2011) confirms the distribution of single-family and apartment houses.
Based on validated OSM data of buildings, an electric grid is calculated using the street network, which represents possible power lines between locations. These routes are used as input data for the energy system simulation and the visualization in a web application. After preparation, the street network is used as the basis for a pgRouting topology in the database. To do that, and as a communication point between the web application and for use in our workflow, a Laravel REST API is developed to get an approximated route of the energy flow between pairs of OSM locations. PgRouting is a PostgreSQL plugin that allows basic routing algorithms to be run on grids as the Dijkstra algorithm, so the shortest possible path based on the geographical length. Nevertheless, as electricity flows do not always take the shortest route, this can be adapted (see Kays et al., 2017 for a discussion). Moreover, other methods such as the uesgraphs library can be used to generate a grid topology (Schiefelbein et al., 2019) or the NetworkX Python library (Hagberg, 2008).
3.2 Consumer profiles data
The scarcity of electricity consumption data for small, medium, and large energy consumers is one of the main barriers to the simulation of energy systems. In Germany, if the annual consumption of electrical power is over 100 000 kWh, the grid operator should measure, store, and provide companies with the right to access their data. For the simulation of consumers with an annual consumption under 100 000 kWh, the grid operators are not obliged to provide such data but customers can be provided with the real power measurement if requested from the grid operator. On the other hand, the BDEW publishes standard load profiles (SLPs) on an annual basis as the effort for real-time measurement is considered too high (Fünfgeld and Tiefemann, 2000).
To solve these issues, the S6ET has been establishing cooperation agreements with several companies, including energy-intensive customers, to use their data in the simulations. Figure 3a shows the differences between a normalized anonymous load profile and the SLPs G0, G1, G3, and G4 from 15 to 21 April 2019. One can see here the sharp fluctuations of the load profile compared to the SLPs, which are very uniform due to their averaging.
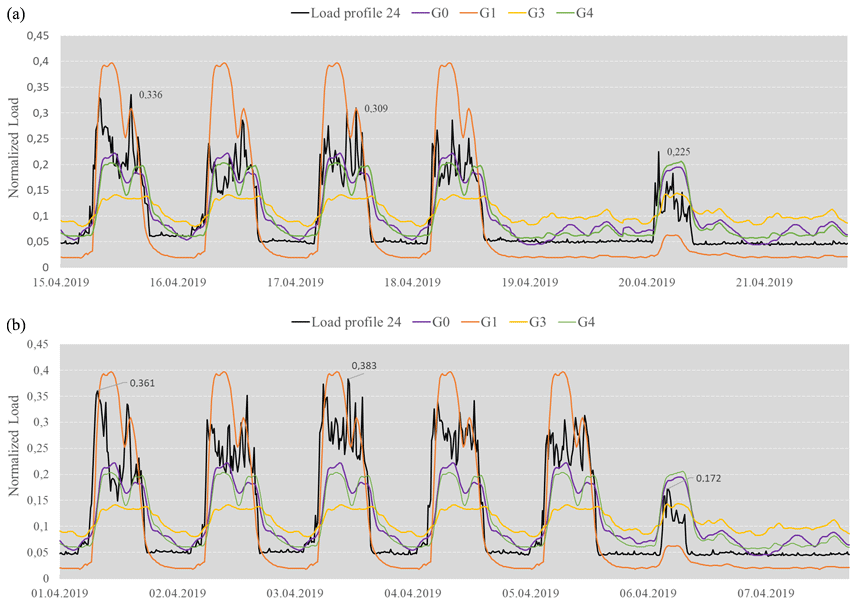
Figure 3Measured load compared to standard load profiles on weekdays (a) and public holidays (b).
Another important factor is the effect of public holidays. Figure 3b shows the Good Friday and Easter public holidays in the region under study. The anonymous load profile shows a lower average consumption and lower peaks (0.361 as opposed to 0.336) in different moments in time. The demand profiles are for days that are public holidays corresponding to the Sunday SLP, but the remaining days of the week are not further adjusted, and average workday profiles are used instead. Moreover, Fig. 4 shows the impact of this standardization on the correlation and RMSE coefficients of four SLPs during these weeks.
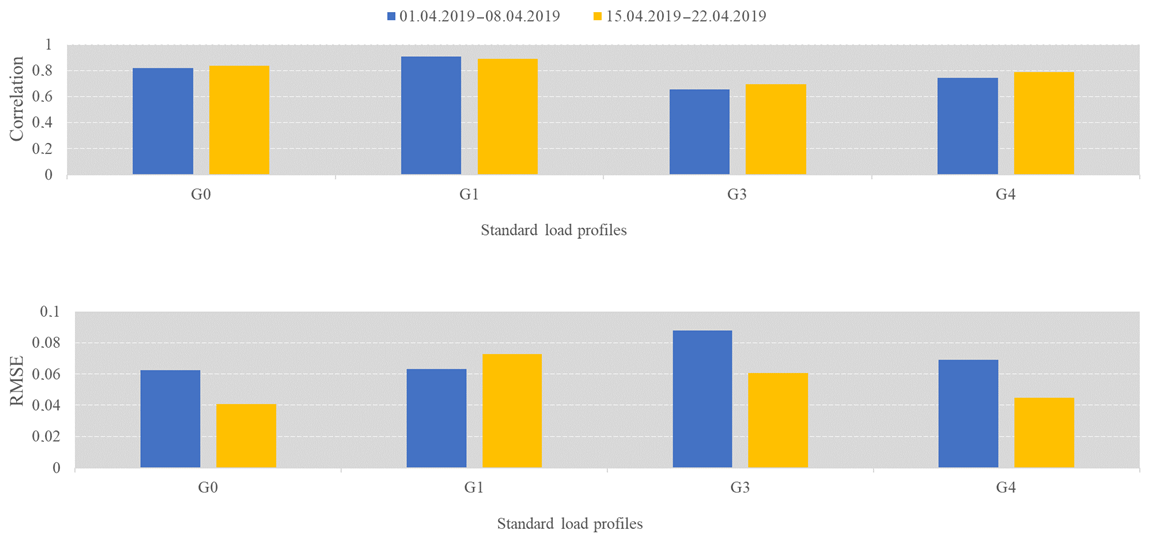
Figure 4Correlation and root mean square error between a measured load compared to standard load profiles in weekdays and public holidays.
The S6ET research approach aims to establish to what extent the use of these standard profiles affects the modeling of energy systems composed of a few consumers. Simulations are carried out to show the effects of using SLPs in comparison with real load profiles and the impact on the techno-economic valuation of different technologies evaluated. Potential effects of the use of SLPs should be expected in the sizing of batteries or photovoltaic systems, the installation of a PtG facility, and the costs they generate.
3.3 Consumer profiles data
The geographic resolution and, therefore, the scope of the analysis is one of the main elements that define the S6ET approach. Recently, multiple applications have developed an approach to spatiotemporal modeling of energy systems. Most of the approaches use regional units based on aggregated energy statistics, while other strands of the literature use microdata or the weather resolution data as units of analysis. All these methods are applicable under the S6ET approach, thanks to the flexibility of the simulation tools. Moreover, thanks to the use of OSM data, the focus can lie in different units of analysis. Figure 5 shows the annual electricity consumption of the village of Straubing, situated in Lower Bavaria with a population of almost 50 000 inhabitants and covering an area of 67.58 km2 divided by a hexagonal grid with a size of 0.4 km2.
To illustrate the power consumption for Straubing, an estimation of the individual power consumption was calculated for each building following a similar methodology to the official Bavarian statistics office (Bavarian Government, 2020). Yearly kilowatt hour consumption per square meter (kWh m−2 a−1) has been calculated for each building classification by dividing the total area of all buildings in a building class by the proportional electricity consumption. The respective electricity consumption of all the buildings situated in Lower Bavaria was calculated by using the energy index and the square meters for each building. To identify the geographical concentration of energy consumption, grid layers are generated, as well as the kilowatt hours per square meter of buildings allocated to the corresponding superimposed grid.
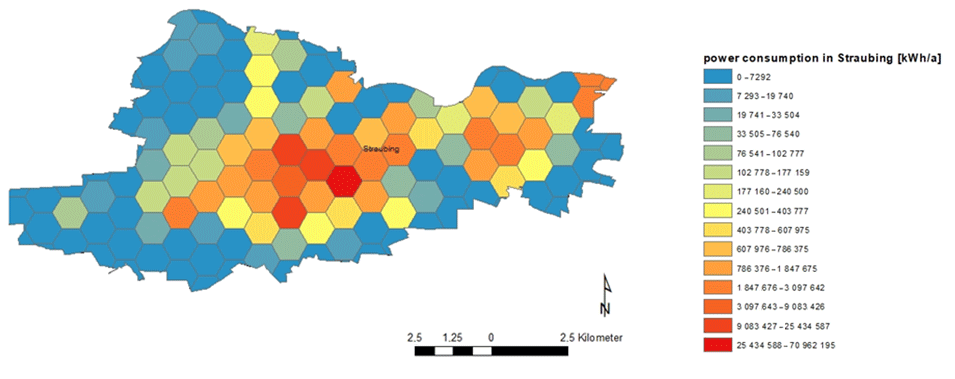
Figure 5Estimated location of the annual electricity consumption of the village of Straubing.
3.4 Energy systems modeling
The impact of the storage and distributed generation technologies on the existing underlying power grid system (physical hardware) is an essential element to ensure a reliable supply of electricity. Since more and more renewable distributed generation systems are attached to the grid locally (e.g., PV on rooftops), the local feed-in rises at the low (and medium) voltage level, generating imbalances as electric grids are generally radial by design and assume single-source in-feed and radial flows. In our approach, one of the focuses is the simulation of local grids (low- or medium-voltage grid) with high shares of renewables and small to medium PtG systems as mean to long-term energy storage.
Based on preprocessed OSM data and standardized load profiles, different scenario simulations in Calliope and PyPSA are generated. We first optimize the system size based on a minimization of cost and simulate the production, consumption, and costs of different energy system configurations to assess their effect on the power grid. The combined data set as input for the models provides a more refined representation of the energy demand and potential than current models together with a grid situation in a specific area.
Calliope presents a balance between energy system flexibility and usability. Following these two principles, the S6ET approach lies in specialisms to contribute to this balance by offering an interface that allows the user to configure different scenarios intuitively and automatically. The basic building blocks of Calliope include four configuration files describing the technologies, locations and connections between locations and scenarios. From a GIS perspective, a major drawback of the current approach is the rigid role of the locations compared to the other building blocks. The location files define which technologies are available in the network and how they are connected. For this reason, they are not easily interchangeable in scenarios. In order to avoid this disadvantage, in the S6ET, the locations were given a new meaning in the simulation. Thanks to the use of OSM data and the YAML format of Calliope input files, locations are no longer considered as a single place but represent a standardized location as a collection of building classes (Table 2). Each building class can be equipped with several predefined technologies, e.g., a detached house with a medium PV system and a small battery.
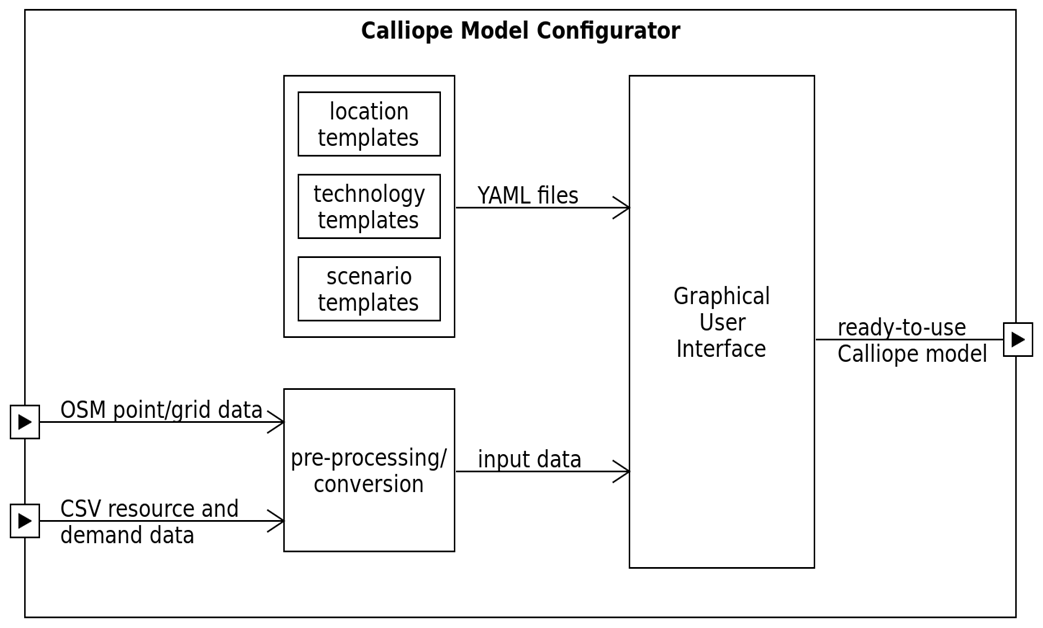
To achieve this goal, a configuration tool for Calliope models was developed (Fig. 6) with a graphical user interface, which itself is configured via Calliope YAML files. In a simple interface, the user can equip the building classes with technologies and select the geographical reference data and the operating mode from several templates. The result is a finished configuration of a Calliope model, which assigns a building class with corresponding technology classes to each georeferenced location from OSM that can be abstracted to a single point structure and configures the scenario. The results of the simulation can then be mapped back to the original map and format as they consider their OSM ID and features.
Besides the economic analysis of the distributed generation and storage technologies, we focus on their impact on the power flow of the modeled grid (including generators, buses, lines, loads, transformers, etc.). For the simulation of our power grid model with attached PtG technology, we need to define different power line types. However, real data on the topology and characteristics of the distribution networks are not public. For this reason, as usually only earth cables are used today for the low-voltage grid in the region under study, we defined a set of standard power lines together with standard cable characteristics for the low and medium grid based on the general grid characteristics of our target area. This allows us to simulate possible congestions and the possibility of installing parallel lines to solve them, for example.
3.5 Power to gas
PtG technology is what in Calliope is defined as a complex technology involving multiple carrier inputs and outputs and, therefore, should not only be conceived as an electricity storage system. Due to its relatively low efficiency of reverse conversion of electricity, a supplementary demand for heat and methane should be added to the model, adding several energy carriers to our model. For this purpose, methanation is required as a second step with the inputs hydrogen from electrolysis, carbon dioxide, and electricity, and the outputs methane and heat. The methane produced can be used as a natural gas substitution for boilers or combined heat and power (CHP) plants. The CO2 required, on the other hand, can be obtained from various sources, including industrial processes and CHP. Depending on the methanation used (chemical-catalytic or biological), CO2 purification may be applied before use. In terms of greenhouse gas emissions, the CO2 bound in this way can be counted positively on the greenhouse gas balance. Finally, from an economic perspective, depending on the CO2 source, this can also have a different positive monetary value, making it easier to achieve potential economic efficiency. Germany, for example, has set a CO2 price of EUR 25 per ton for 2021, which will increase in the coming years (BUM, 2019).
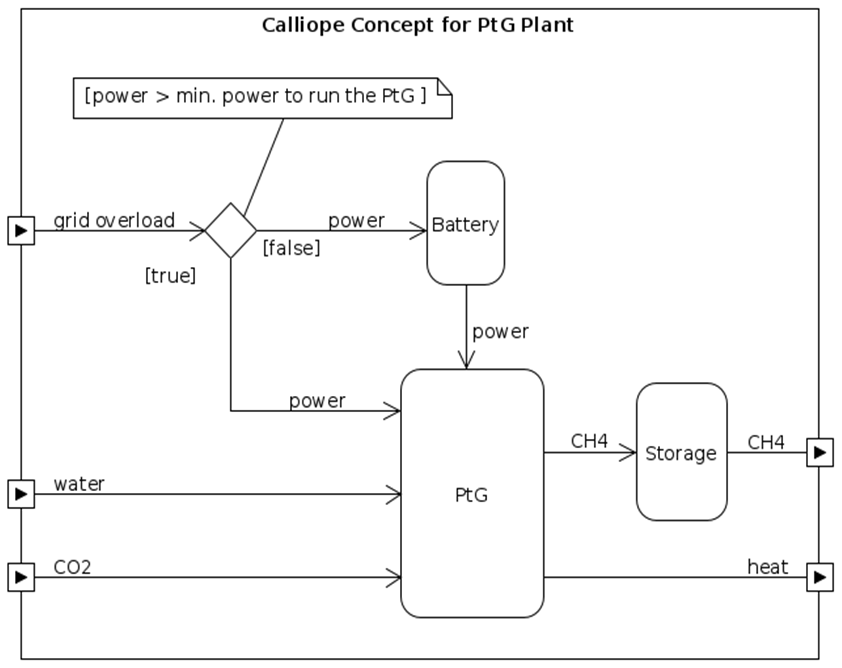
Conceptually, the PtG plant operates together with a battery and CH4 storage (Fig. 7). Depending on the overload size, we either lead it into a battery for fast and short-term storage or operate a PtG plant with it. Since a PtG plant cannot be operated with small on–off cycles, we set the start-up at a specific overload size for different scenarios. Below this value, the current is fed into battery storage. When the PtG plant is operated, electrolysis and methanation generally take place in the model, and methane is produced. As the Calliope model cannot dynamically simulate all the different material flows and interactions of PtG, we will limit ourselves for the time being to a linear consideration with overall efficiencies of electrolysis and methanation based on pilot plants.
Furthermore, some simplifications are applied in the model; e.g., a simulation of an H2 storage facility is not carried out. Instead, it is assumed that methanation is possible directly with every H2 production. This assumption also eliminates the simulation of oxygen production. This intermediate step can indeed be implemented at a later stage since a possible use of oxygen can be an additional source of income depending on the location of the methanation or the CO2 source, e.g., improvement of possible combustion or the input into an aeration tank in a wastewater treatment plant. The input CO2 is integrated into Calliope as a resource, charged with negative costs, and is consumed in the conversion process. The resulting CH4 can be stored or converted to generate heat and power when needed by other technologies integrated into the energy system. As a standard value, it is assumed that 80 % of the waste heat produced can be used (Friedl et al., 2017), but groups of different operating parameters of the plant can be specified and compared in different scenarios
3.6 Visualization
The outputs of the Calliope simulation model are parsed and saved in a PostgreSQL database, which maintains the same underlying schema as the output data from Calliope together with some of the more detailed outputs from the grid simulation in PyPSA. The front end is based on an Angular single-page application. By using the Angular material library, the web application offers not only a modern and simplified design, but also great accessibility features and performance at scale. Also, it ensures that the web application will be compatible not only with desktop PCs but also smartphones and tablets. The main building block of the application is an OpenLayers web map, which uses OSM as a base map. The user should be able to select a particular combination of technologies for a precalculated microgrid, which will then be displayed on top of the map. By clicking on the energy routes and nodes, the user can get detailed information on how much energy is produced and consumed by what technology at a point. The user will also be able to measure distances and areas on the map, which will be useful to get a better understanding of what the numbers of the simulation imply. Figure 8 shows a prototype of a web application.
The S6ET approach combines several “areas” into one framework with a focus on GIS. This combination of approaches gives rise to several advantages but also has its downsides. Using Calliope for economic analysis besides PyPSA allows us to take realistic AC power flows at a particular voltage level into account. Since PyPSA performs power flow calculations, detailed technical information (nominal voltages, nominal power, or active and reactive power) about generators, loads, power lines, etc. is required to achieve more precise results. In contrast, Calliope performs a more abstract energy optimization (no power flow) and hence needs not as much specific information. For example, the component “line_type” can be set in PyPSA for different types of earth cables or overhead lines according to a certain voltage level. As mentioned in Sect. 3.2, in our target area, there is only few freely available data on the grid, and different grid operators exist. For example, there is no information on used and already installed cables (specific type and location) for cities and villages available in public.
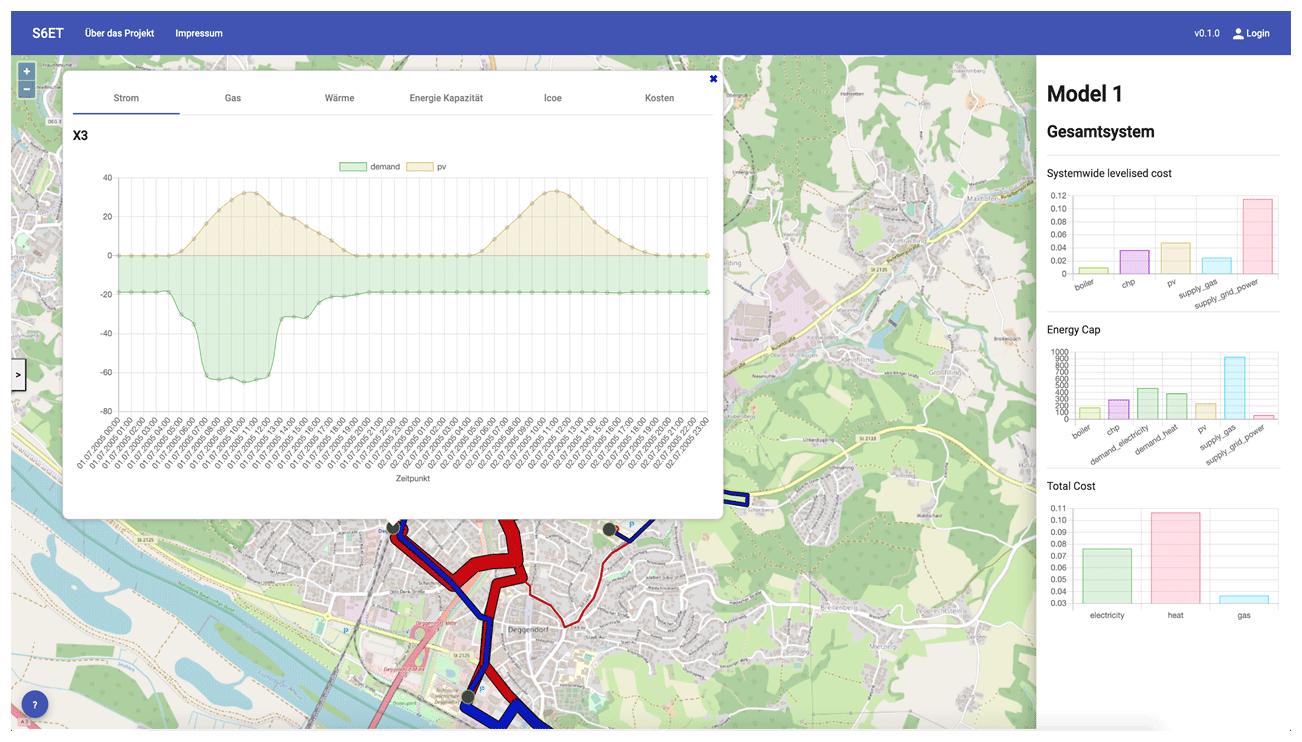
Figure 8Angular web application containing the results of a simulation model.
Nevertheless, there are several standards for the grid infrastructure in Germany that grid operators have to fulfill. This includes various types of normed power lines, earth cables as well as overhead lines, for each voltage level. For simplicity in our approach, we include only one standard type of earth cable for each voltage level in the target area. Hence, one earth cable for the low-voltage grid and one for the middle voltage grid is used according to Witzmann (2013).
Working with these simulation and data tools highlights the importance of high-resolution data. On the other hand, a big challenge in many GIS applications is how much data can be visualized at once without overloading the web application. The simulation of transmission lines may not be an issue for current GIS software (Abdulrahman and Radman, 2020). Nevertheless, for distribution grids, the energy paths are quite detailed, because the structure of the grid goes from building to building. If zoomed out of the map, this resolution may lead to a wholly overloaded map, and the user can not get any information out of it. Also, a way to filter and compare data is needed to allow the user to receive precisely the information he needs.
Another challenge is to model what a realistic energy flow looks like. Due to the absence of real data on distribution grids, there is a need to try different routing algorithms to determine which is the most realistic one, and to deliver reliable results that may or may not be applied to real grid data. This should be possible as the use of GIS for the modeling and simulation of different aspects of energy systems is widespread (Alhamwi et al., 2017). Nevertheless, from the knowledge of the authors, current open-source tools for energy system simulation and optimization are not entirely integrated into GIS. For example, the well-known Qgis and Arcgis do not contain specific libraries, and more work is necessary.
The Framework for Regional Smart Energy Planning involves the simulation and analysis of different energy resources and dimensions of the energy system. The decision to integrate PtG in our model is based on the fact that the natural gas network in Germany is very well developed and that methane can be fed into the grid without any significant problems. The factors used for efficiency are taken from current market offers from electrolysis and methanation manufacturers in Germany (H-Tec systems, MicroPyros). Nevertheless, Calliope as a black-box model can only resolve linear optimization problems, but PtG is a complex technology that would require dynamic simulation. The simplified approach presented here, on the other hand, allows for better handling and faster simulation results. Further applications should consider other technology options to represent real-world situations better. For example, the usability of the waste heat is strongly dependent on the temperature level required by the consumer but can be improved by using heat pumps.
The methodology developed for the classification of OSM building data in the approach is to be discussed. It is already known in the scientific community that OSM data are often collected by amateur geographers and non-specialists, which casts doubts on the quality of the OSM building data used (Mooney et al., 2010, p. 514). In order to improve the quality of the OSM data, due to the lack of information concerning buildings, many processing steps, assumptions, and simplifications need to be made (Alhamwi et al., 2017, p. 5). Apart from this, the methodology for establishing the building classification is based on the assumption that the square meters of the buildings are expressed in gross floor area. This assumption cannot always be verified.
Furthermore, the methodology used to establish the Extended Building Classification (H1, H2, BI) is not confirmed to be correct as it is based on an approach from the field of architecture and construction and is vulnerable in this context. On the other hand, the frequency distribution of buildings in H1 and H2 corresponds to the values in the Zenus 2011. A further aspect, which depresses the exactitude for the energy index calculation, is the fact that the energy consumptions of the individual industries and sectors of business are not known. As already specified, the electricity consumption of each classification is divided by the numerical amount of buildings, introducing a bias.
However, one approach to solving the problem of the gross floor area is to compare a sample of OSM building data from one municipality (e.g., Deggendorf) with the corresponding development plan (Zhou et al., 2019). Moreover, the energy index for the respective building classifications can be improved by requesting individual electricity consumption figures. If, for example, the power consumption of all buildings of category G5 in a municipality could be determined, it would be possible to calculate a precise energy index, which would be applicable to the whole region for this category (Remmen et al., 2018). This would lead to a more accurate visualization of electricity consumption and a more accurate data input for the energy model Calliope.
Although this approach can help with the management and planning of energy systems and the identification of new business opportunities, it does not eliminate all the uncertainties. For instance, the analysis shows that the uncertainties in energy modeling increase by using the standard load profiles. SLPs only reflect average consumption behavior and are only representative if the number of consumers exceeds 400 (von Appen et al., 2014). This bias is a significant problem, especially for simulations of microgrids. No villages or markets can be represented representatively. For households or smaller residential areas, it is impossible to simulate their peak loads correctly without further information in order to correctly dimension the batteries for their supply (Schiefelbein et al., 2019).
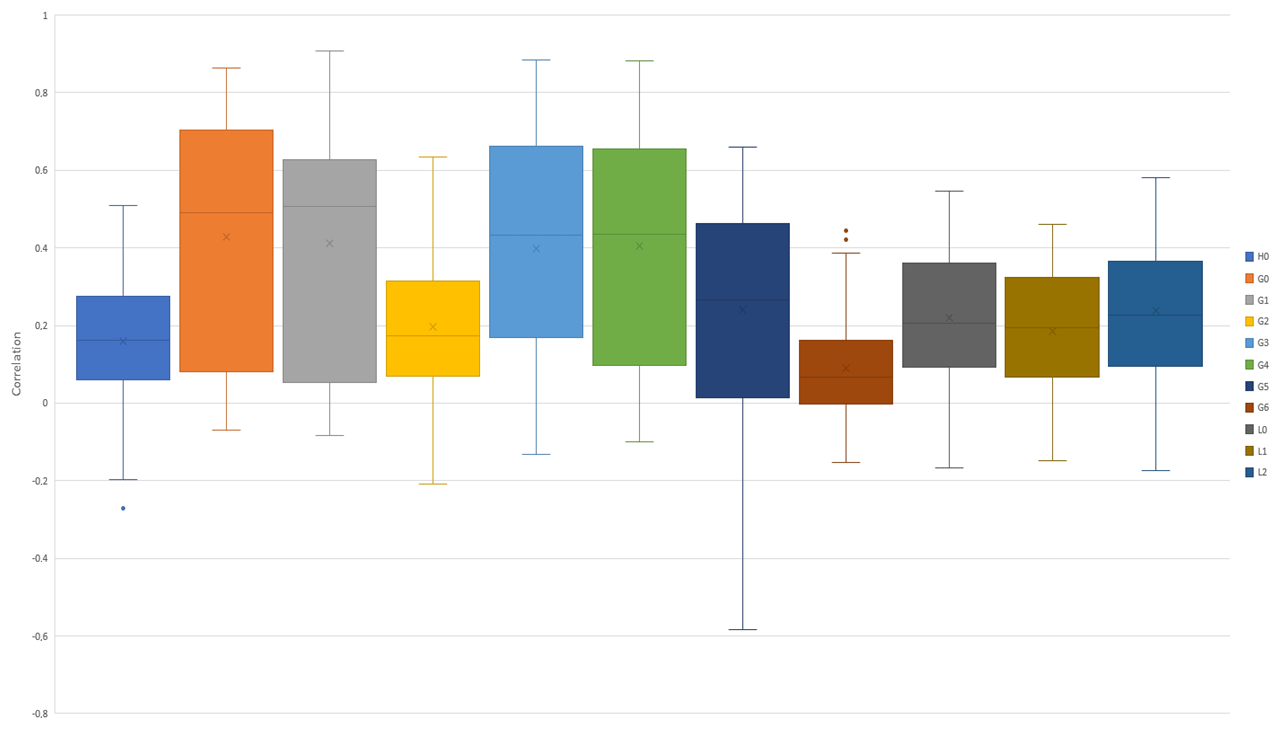
The fact that an exact allocation of the commercial users to the SLPs is not straightforward is shown in Sect. 3.2. From a random data set with 72 real load profiles measured at 72 measuring points every quarter of an hour, only 48 of the original 72 data sets have a correlation coefficient over 0.7 (Ratner, 2009). The boxplots in Fig. 9 show how the correlations of the 48 load profiles are distributed among the 11 SLPs. It can be seen that G0, G1, G3, and G4 have the best values, but no clear allocation is yet possible.
This article presents a framework for regional smart energy planning using volunteered geographic information. One of the main contributions is the generation of a framework that shows the effectiveness of using open-source data and tools developed in different disciplines. As well as this, this article also allows the identification of possible avenues of future study to increase collaboration between different disciplines. Among them, the generation of consumption data at a non-aggregated level that allows the identification of consumption peaks is highlighted. In simulation studies, these consumption peaks, combined with climate data, often play an important role in optimizing energy cell sizes. Without them, the results will be significantly more conservative, as they ignore specific circumstances that repeat cyclically during the year.
The approach presented here can help to contribute to assessing to what extent VGI data can be adapted to the simulation of energy systems. Regarding the use of OSM data, the results for the study area presented here are promising. From the entire OSM data set for Lower Bavaria, which was obtained from the provider Geofabrik, 71 % of the data could be used. Due to the requirement to generate a high-quality data set of building classification and the various work steps of OSM building data processing, the number of data decreased. However, it is uncertain to what extent this data set really includes and correctly represents all final energy consumers in the region. As for the SLP consumption profiles offered by DSOs, results are nonetheless less positive. The analysis of a sample of a group of consumers shows important deviations with respect to the SLPs that are normally used to simulate consumption and establish forecasts. At the time when the methodology for the SLPs was created, the German energy supply was centralized with lignite and nuclear power plants and may not reflect current customer behaviors. In the meantime, the system has moved towards a more decentralized energy supply. Currently, consumers are starting to be regarded as producers (prosumers) as well, which is why the load on the electricity grid is changing, and its stability can be influenced.
However, applications such as PyPsa and Calliope may experience a revolution in the short and medium term as the current lack of data will change. The legislation implemented in the EU countries imposing the full integration of smart meters should be seen as first step in this direction. However, the success of the future energy industry thanks to the availably of richer data depends not only on the production of data but mainly on its processing, evaluation, and interpretation by suitable applications. In countries such as Germany, photovoltaic systems and smart meters are already installed; nevertheless, most of this data cannot be used for modeling energy systems because it is not public.
Regional energy management systems are not just relevant for public planning but also for all the actors interested in exploring the new possibilities associated with real-time power measurement. Nevertheless, if stakeholders do not yet have available data on their consumption behavior, they cannot perform demand management strategies. Moreover, for companies looking for new business opportunities, the uncertainties linked to the use of SLPs increase together with the complexity of the systems, including the increasing share of renewable distributed generation. Therefore, it is important for all actors to have a better representation of the energy systems, in terms of both changing consumption and production behavior.
Data is available upon request.
JV was in charge of the writing of the overall manuscript, review, editing, formal analysis, investigation, and project management. SW contributed to Sect. 3, mostly Sect. 3.6. AW contributed to reviewing the first draft of the paper and Sects. 2 and 3. GK contributed to data acquisition and drafting Sects. 2, 4, and 5. CS mainly contributed to Sects. 3 and 5 as well as the literature review. MP contributed to Sect. 4 and data acquisition. RB contributed to the introduction, drafting Sect. 3 (especially Sect. 3.5), and RZ was in charge of the conceptualization, funding acquisition, and methodology.
The authors declare that they have no conflict of interest.
This article is part of the special issue “European Geosciences Union General Assembly 2020, EGU Division Energy, Resources & Environment (ERE)”. It is a result of the EGU General Assembly 2020, 4–8 May 2020.
We would like to thank two anonymous reviewers, the editor of the special issue and the publisher's correction service. Moreover we would like to thank The German Federal Ministry of Education and Research for their funding support.
This research has been supported by the BMBF FHProfUnt-2016 (grant no. FKZ 13FH245PX6)).
This paper was edited by Viktor J. Bruckman and reviewed by two anonymous referees.
Abbasabadi, N. and Ashayeri, M.: Urban energy use modeling methods and tools: A review and an outlook, Build. Environ., 161, 106270, https://doi.org/10.1016/j.buildenv.2019.106270, 2019.
Abdulrahman, I. and Radman, G.: Power system spatial analysis and visualization using geographic information system (GIS), Spat. Inf. Res., 28, 101–112, https://doi.org/10.1007/s41324-019-00276-y, 2020.
Alhamwi, A., Medjroubi, W., Vogt, T., and Agert, C.: GIS-based urban energy systems models and tools: Introducing a model for the optimisation of flexibilisation technologies in urban areas, Appl. Energ., 191, 1–9, https://doi.org/10.1016/j.apenergy.2017.01.048, 2017.
Alhamwi, A., Medjroubi, W., Vogt, T., and Agert, C: Development of a GIS-based platform for the allocation and optimisation of distributed storage in urban energy systems, Appl. Energ., 251, 113360, https://doi.org/10.1016/j.apenergy.2019.113360, 2019.
Amme, J., Pleßmann, G., Buhler, J., Hulk, L., Kotter, E., and Schwaegerl, P.: The eGo grid model: An open-source and open-data based synthetic medium-voltage grid model for distribution power supply systems, J. Phys. Conf. Ser., 977, 012007, https://doi.org/10.1016/j.ejor.2018.01.036, 2018.
Barron, C., Neis, P., and Zipf, A.: A Comprehensive Framework for Intrinsic OpenStreetMap Quality Analysis: A Comprehensive Framework for Intrinsic OpenStreetMap Quality Analysis, T. GIS, 18, 877–895, https://doi.org/10.1111/tgis.12073, 2014.
Bavarian Government: Geoportal Bayern, available at: https://geoportal.bayern.de/geoportalbayern/, last access: 11 June 2020.
Brown, T., Hörsch, J. and Schlachtberger, D.: PyPSA: Python for Power System Analysis, Journal of Open Research Software, 6, 09913, https://doi.org/10.5334/jors.188, 2018.
BUM, Federal Ministry for the Environment, Nature Conservation, and Nuclear Safety: Eckpunkte zur Ausgestaltung eines nationalen Emissionshandels für Wärme und Verkehr, Klimaschutzprogramm 2030, 9, 2019.
Dorfner, J: Open source modelling and optimisation of energy infrastructure at urban scale, PhD Dissertation, Technische Universität München, München, 2016.
Friedl, M., Meier, B., Ruoss, F., and Schmidlin, L.: Thermodynamik von Power-to-Gas, Hochschule für Technik, Rapperswil, Institut für Energietechnik, 67, Version 2.1, available at: https://www.iet.hsr.ch/fileadmin/user_upload/iet.hsr.ch/Power-to-Gas/scripts/Skript_Power-to-Gas_V2.1.pdf (last access: 11 November 2020), 2017.
Fünfgeld, C. and Tiefemann, R.: Anwendung der Represäntativen VDEW-Lastprofile step-by-step, Vereinigung Deutscher Elektrizitätswerke e.V. (VDEW), Frankfurt am Main, Germany, available at: https://www.bdew.de/media/documents/Umsetzung-der-Analytischen-Lastprofilverfahren-Step-by-step.pdf (last access: 11 November 2020), 2000.
Geiß, C., Taubenböck, H., Wurm, M., Esch, T., Nast, M., Schillings, C., and Blaschke, T.: Remote Sensing-Based Characterization of Settlement Structures for Assessing Local Potential of District Heat, Remote Sensing, 3, 1447–1471, https://doi.org/10.3390/rs3071447, 2011.
Groissböck, M. and Gusmao, A.: Impact of high renewable penetration scenarios on system reliability: two case studies in the Kingdom of Saudi Arabia, arXiv [preprint], arXiv:1709.03761, 2017.
Grzanic, M., Flammini, M. G., and Prettico, G.: Distribution Network Model Platform: A First Case Study, Energies, 12, 4079, https://doi.org/10.3390/en12214079, 2019.
Hagberg, A., Pieter S., and Chult D.: Exploring network structure, dynamics, and function using NetworkX. No. LA-UR-08-05495; LA-UR-08-5495, Los Alamos National Lab.(LANL), Los Alamos, NM (United States), 2008.
Haklay, M. and Weber, P.: “Openstreetmap: User-generated street maps”, IEEE Pervas. Comput., 7.4, 12–18, 2008.
Heinrich, P.: Verkaufsfläche von Vertriebslinien im Lebensmitteleinzelhandel in Deutschland 2018, Statista, available at: https://de.statista.com/statistik/daten/studie/202106/umfrage/ (last access: 30 March 2020), 2019.
Hilbers, A. P., Brayshaw, D. J., and Gandy, A.: Importance Subsampling: Improving Power System Planning under Climate-Based Uncertainty, Appl. Energ., 251, 113114, https://doi.org/10.1016/j.apenergy.2019.04.110, 2019.
Heussen, K., Koch, S., Ulbig, A., and Andersson, G.: Energy storage in power system operation: The power nodes modeling framework, in: 2010 IEEE PES Innovative Smart Grid Technologies Conference Europe (ISGT Europe), Gothenburg, Sweden, 1–8, https://doi.org/10.1109/ISGTEUROPE.2010.5638865, 2010.
Hörsch, J. and Calitz, J.: PyPSA-ZA: Investment and operation co-optimization of integrating wind and solar in South Africa at high spatial and temporal detail, arXiv:1710.11199 [physics], arXiv [preprint], arXiv:1710.11199, 2017.
Hörsch, J., Hofmann, F., Schlachtberger, D. and Brown, T.: PyPSA-Eur: An Open Optimisation Model of the European Transmission System, Energy Strateg. Rev., 22, 207–215, https://doi.org/10.1016/j.esr.2018.08.012, 2018.
Kaspar, F., Niermann, D., Borsche, M., Fiedler, S., Keller, J., Potthast, R., Rösch, T., Spangehl, T., and Tinz, B.: Regional atmospheric reanalysis activities at Deutscher Wetterdienst: review of evaluation results and application examples with a focus on renewable energy, Adv. Sci. Res., 17, 115–128, https://doi.org/10.5194/asr-17-115-2020, 2020.
Kays, J., Seack, A., Smirek, T., Westkamp, F., and Rehtanz, C.: The Generation of Distribution Grid Models on the Basis of Public Available Data, IEEE T. Power Syst., 32, 2346–2353, 2017.
Kriechbaum, L., Scheiber, G., and Kienberger, T.: Grid-based multi-energy systems–modelling, assessment, open source modelling frameworks and challenges, Energ. Sustain. Soc., 8, 35, https://doi.org/10.1186/s13705-018-0176-x, 2018.
Krog, L. and Sperling, K.: A comprehensive framework for strategic energy planning based on Danish and international insights, Energy Strateg. Rev., 24, 83–93, https://doi.org/10.1016/j.esr.2019.02.005, 2019.
Krüger, T., Andres, S., Walther, M., Klein, K., and Segerer, M.: Handelsverband Deutschland (HDE) – Kurzlink Studie Qualifizierte Nahversorgung, available at: https://einzelhandel.de/nahversorgungsstudie (last access: 30 March 2020), 2013.
McKenna, R., Bertsch, V., Mainzer, K., and Fichtner, W.: Combining Local Preferences with Multi-Criteria Decision Analysis and Linear Optimization to Develop Feasible Energy Concepts in Small Communities, Eur. J. Operat. Res., 268, 1092–1110, https://doi.org/10.1016/j.ejor.2018.01.036, 2018.
Medjroubi, W., Müller, U. P., Scharf, M., Marke, C., and Kleinhans, D.: Open Data in Power Grid Modelling: New Approaches Towards Transparent GridModels, Energ. Rep., 3, 14–21, https://doi.org/10.1016/j.egyr.2016, 2017.
Möller, D.-A. and Kalusche, W.: Planungs- und Bauökonomie: Wirtschaftslehre für Bauherren und Architekten, Walter de Gruyter, German Edition, ISBN-13 978-3486721256, 2015.
Mooney, P., Corcoran, P., and Winstanley, A. C.: Towards quality metrics for OpenStreetMap, in: Proceedings of the 18th SIGSPATIAL International Conference on Advances in Geographic Information Systems – GIS '10, p. 514, ACM Press, San Jose, California, 2010.
Morgenthaler, S., Kuckshinrichs, W., and Witthaut, D.: Optimal System Layout and Locations for Fully Renewable High Temperature Co-Electrolysis, Appl. Energ., 260, 114218, https://doi.org/10.1016/j.apenergy.2019.114218, 2020.
Prettico, G., Flammini, M. G., Andreadou, N., Vitello, S., Fulli, G., and Masera, M: Distribution System Operators Observatory, available at: http://publications.jrc.ec.europa.eu/repository/bitstream/JRC113926/jrc113926_kjna29615enn_newer.pdf (last access: 14 September 2020), 2018.
Pfenninger, S. and Pickering, B.: Calliope: a multi-scale energy systems modelling framework, Journal of Open Source Software, 3, 825, https://doi.org/10.21105/joss.00825, 2018.
Pickering, B. and Choudhary, R.: Mitigating risk in district-level energy investment decisions by scenario optimisation, 4th Building Simulation and Optimization Conference, Cambridge, Proceedings of BSO 2018, available at: http://www.ibpsa.org/proceedings/BSO2018/1B-1.pdf (last access: 11 November 2020), 2018.
Ratner, B.: The Correlation Coefficient: Its Values Range between ±1, or Do They?, J. Target. Meas. Anal. Market., 17, 139–142, https://doi.org/10.1057/jt.2009.5, 2009.
Remmen, P., Lauster, M., Mans, M., Fuchs, M., Osterhage, T., and Müller, D.: TEASER: an open tool for urban energy modelling of building stocks, J. Build. Perform. Simu., 11, 84–98, https://doi.org/10.1080/19401493.2017.1283539, 2018.
Ringkjøb, H.-K., Haugan, P. M. and Solbrekke, I. M.: A review of modelling tools for energy and electricity systems with large shares of variable renewables, Renewable and Sustainable Energy Reviews, 96, 440–459, https://doi.org/10.1016/j.rser.2018.08.002, 2018.
Schiefelbein, J., Rudnick, J., Scholl, A., Remmen, P., Fuchs, M., and Müller, D.: Automated urban energy system modeling and thermal building simulation based on OpenStreetMap data sets, Build. Environ., 149, 630–639, https://doi.org/10.1016/j.buildenv.2018.12.025, 2019.
Schröder, F., Altendorf, L., Greller, M., and Boegelein, T.: Universelle Energiekennzahlen für Deutschland: Teil 4: Spezifischer Heizenergieverbrauch kleiner Wohnhäuser und Verbrauchs- hochrechnung für den Gesamtwohnungsbestand, Bauphysik, 33, 243–253, https://doi.org/10.1002/bapi.201110026, 2011.
Valdes, J., Wuth, J., Zink, R., Schröck, S., and Schmidbauer, M.: Extracting Relevant Points of Interest from Open Street Map to Support E-Mobility Infrastructure Models, Bavar. J. Appl. Sci., 4, 323–341, https://doi.org/10.25929/bjas.v4i1.51, 2018.
von Appen, J., Haack, J., and Martin, B.: Erzeugung-zeitlich-hochaufgeloester-Stromlastprofile-fuer-verschiedene-Haushaltstypen, in: IEEE Power and Energy Student Summit, 22–24 January 2014, Stuttgart, Germany, available at: https://www.researchgate.net/profile/Jan_Von_Appen2/ (last access: 18 April 2020), 2014.
Witzmann, R.: Verteilnetzstudie Bayern 2013, München, available at: https://www.energie-innovativ.de/fileadmin/user_upload/energie_innovativ/Dokumente/Energie-Rohstoffe/Verteilnetzstudie_Bayern_02092013.pdf (last access: 28 May 2020), 2013.
Zapf, M.: Stromspeicher Und Power-to-Gas Im Deutschen Energiesystem – Rahmenbedingungen, Bedarf Und Einsatzmöglichkeiten, in: Systems, Storage and Harvesting, Springer Vieweg, Wiesbaden, 2017.
Zhou, Q., Jia, X., and Lin, H.: An approach for establishing correspondence between OpenStreetMap and reference datasets for land use and land cover mapping, T. GIS, 23, 1420–1443, https://doi.org/10.1111/tgis.12581, 2019.