 | 03 Dec 2020
Thermal UAS survey of reactivated hot spring activity in Waiwera, New Zealand
Melissa Präg
Ivy Becker
Christoph Hilgers
Thomas R. Walter
Michael Kühn
The utilization of geothermal reservoirs as alternative energy source is becoming increasingly important worldwide. Through close-range aerial photogrammetry realized by unmanned aircraft systems (UAS), this study investigates the surface expression of a leaking warm water reservoir in Waiwera, New Zealand, that has been known for many centuries but remained little explored. Due to overproduction during the 1960s and 1970s the reservoir has suffered significant pressure reduction, which resulted in the loss of artesian conditions and led to the desiccation of the hot springs in close succession. However, shortly after the recent shutdown of the primary user (Waiwera Thermal Resort & Spa) renewed artesian activity was reported by locals but no hot spring activity has been observed so far. Therefore, this study was carried out in October 2019 to assess the actual conditions of thermal activity in the area of the former hot springs. UAS with coupled thermal infrared cameras were used for thermal mapping and the obtained data show renewed activity of the hot springs on the beachfront of Waiwera. Faults and fractures were identified as important fluid pathways, as well as individual fluid conducting lithologies.
- Article
(13240 KB) - Full-text XML
- BibTeX
- EndNote


Geothermal reservoirs are closely linked to the tectonic structure, porosity and permeability contrasts and may be altered by extrinsic processes, yet the details of surface manifestations are commonly difficult to monitor. By use of unmanned aircraft systems (UAS), the surface expression, morphology and temperature anomalies associated with geothermal activity can be monitored and accessed even in regions difficult to reach (James et al., 2020).
Waiwera is a small coastal village located on New Zealand's North Island, about 40 km north of Auckland (Fig. 1) and was known for centuries by the Maori people for its natural hot springs, which originated from the geothermal aquifer below the village (Kühn and Stöfen, 2005). Due to overproduction during the 1960s and 1970s the reservoir has suffered significant pressure loss, which resulted in the aquifer no longer being artesian and led to the desiccation of the hot springs between 1975 and 1976 (Kühn and Altmannsberger, 2016; Kühn et al., 2016). The Waiwera Thermal Groundwater Allocation and Management Plan, which was adopted by the Auckland Coucil (former Auckland Regional Water Board – ARWB) in 1987 allowed the geothermal system to slowly recover but the production rates did not allow the return to artesian conditions or the reactivation of the hot springs (Kühn and Stöfen, 2005). However, shortly after the primary user (Waiwera Thermal Resort & Spa) shut down in 2018, locals have reported overflowing bores to the Auckland Council. This indicates a progressing recovery of the geothermal system including the return to artesian conditions. So far there have been no reports about renewed activity of the hot springs at the beachfront. Therefore, this study aims at the investigation of possible renewed hot springs activities. To characterize a reservoir, the knowledge of its rock properties (e.g., lithology, porosity and permeability), diagenetic alterations controlling not only porosity and permeability but also affecting mechanical properties, structural inventory as the fracture network, the heat transfer, and all resulting interactions are crucial (Becker et al., 2017, 2019; Busch et al., 2019, 2020). In recent years, outcrop analog studies aiming at providing high-resolution data for a subsurface reservoir model have been increasingly supported by the use of digital techniques as UAS and terrestrial laser scanning to complement traditional fieldwork data (e.g., Becker et al., 2018; Cawood et al., 2017; Hodgetts, 2013; Walter et al., 2020; Wüstefeld et al., 2018). Here, UAS are used to carry out photogrammetic analyses for lithological and structural mapping, combined with infrared thermal cameras to analyze temperature differences in the cliffs and beachfront.
In this paper, we present the first results of the data obtained by the infrared thermal cameras in combination with UAS to show a potentially renewed thermal activity in the Waiwarea area and analyze potential fluid migration pathways.
2.1 Geological setting of the study area
The area of study includes the outcrops at the beachfront of Waiwera and the cliff of the Waiwera Hill Scenic Reserve (Fig. 1). Outcrops and cliffs feature turbiditic sequences of the volcanic-rich flysch of the Miocene Waitemata Group (Allen, 2004), which further represent the host rock of the geothermal aquifer below Waiwera (ARWB, 1980; Kühn and Stöfen, 2005). The turbiditic sequences mainly consist of compacted and cemented sandstones and siltstones of the Waitemata Group. Below Waiwera they reach a thickness of up to 425 m and are extensively folded, faulted and fractured. Unconsolidated alluvial and marine sands, silts and clays with a thickness of approximately 13 m, that form the sand spit on which Waiwera was built overly the aquifer (ARWB, 1980). The recent model assumes that the thermal water enters the aquifer by rapidly rising through a north striking fault zone within the greywacke basement rock (Kühn and Schöne, 2017). However, the existence of this fault zone has not been proven since there is no direct evidence for its existence at the surface (ARWB, 1980).
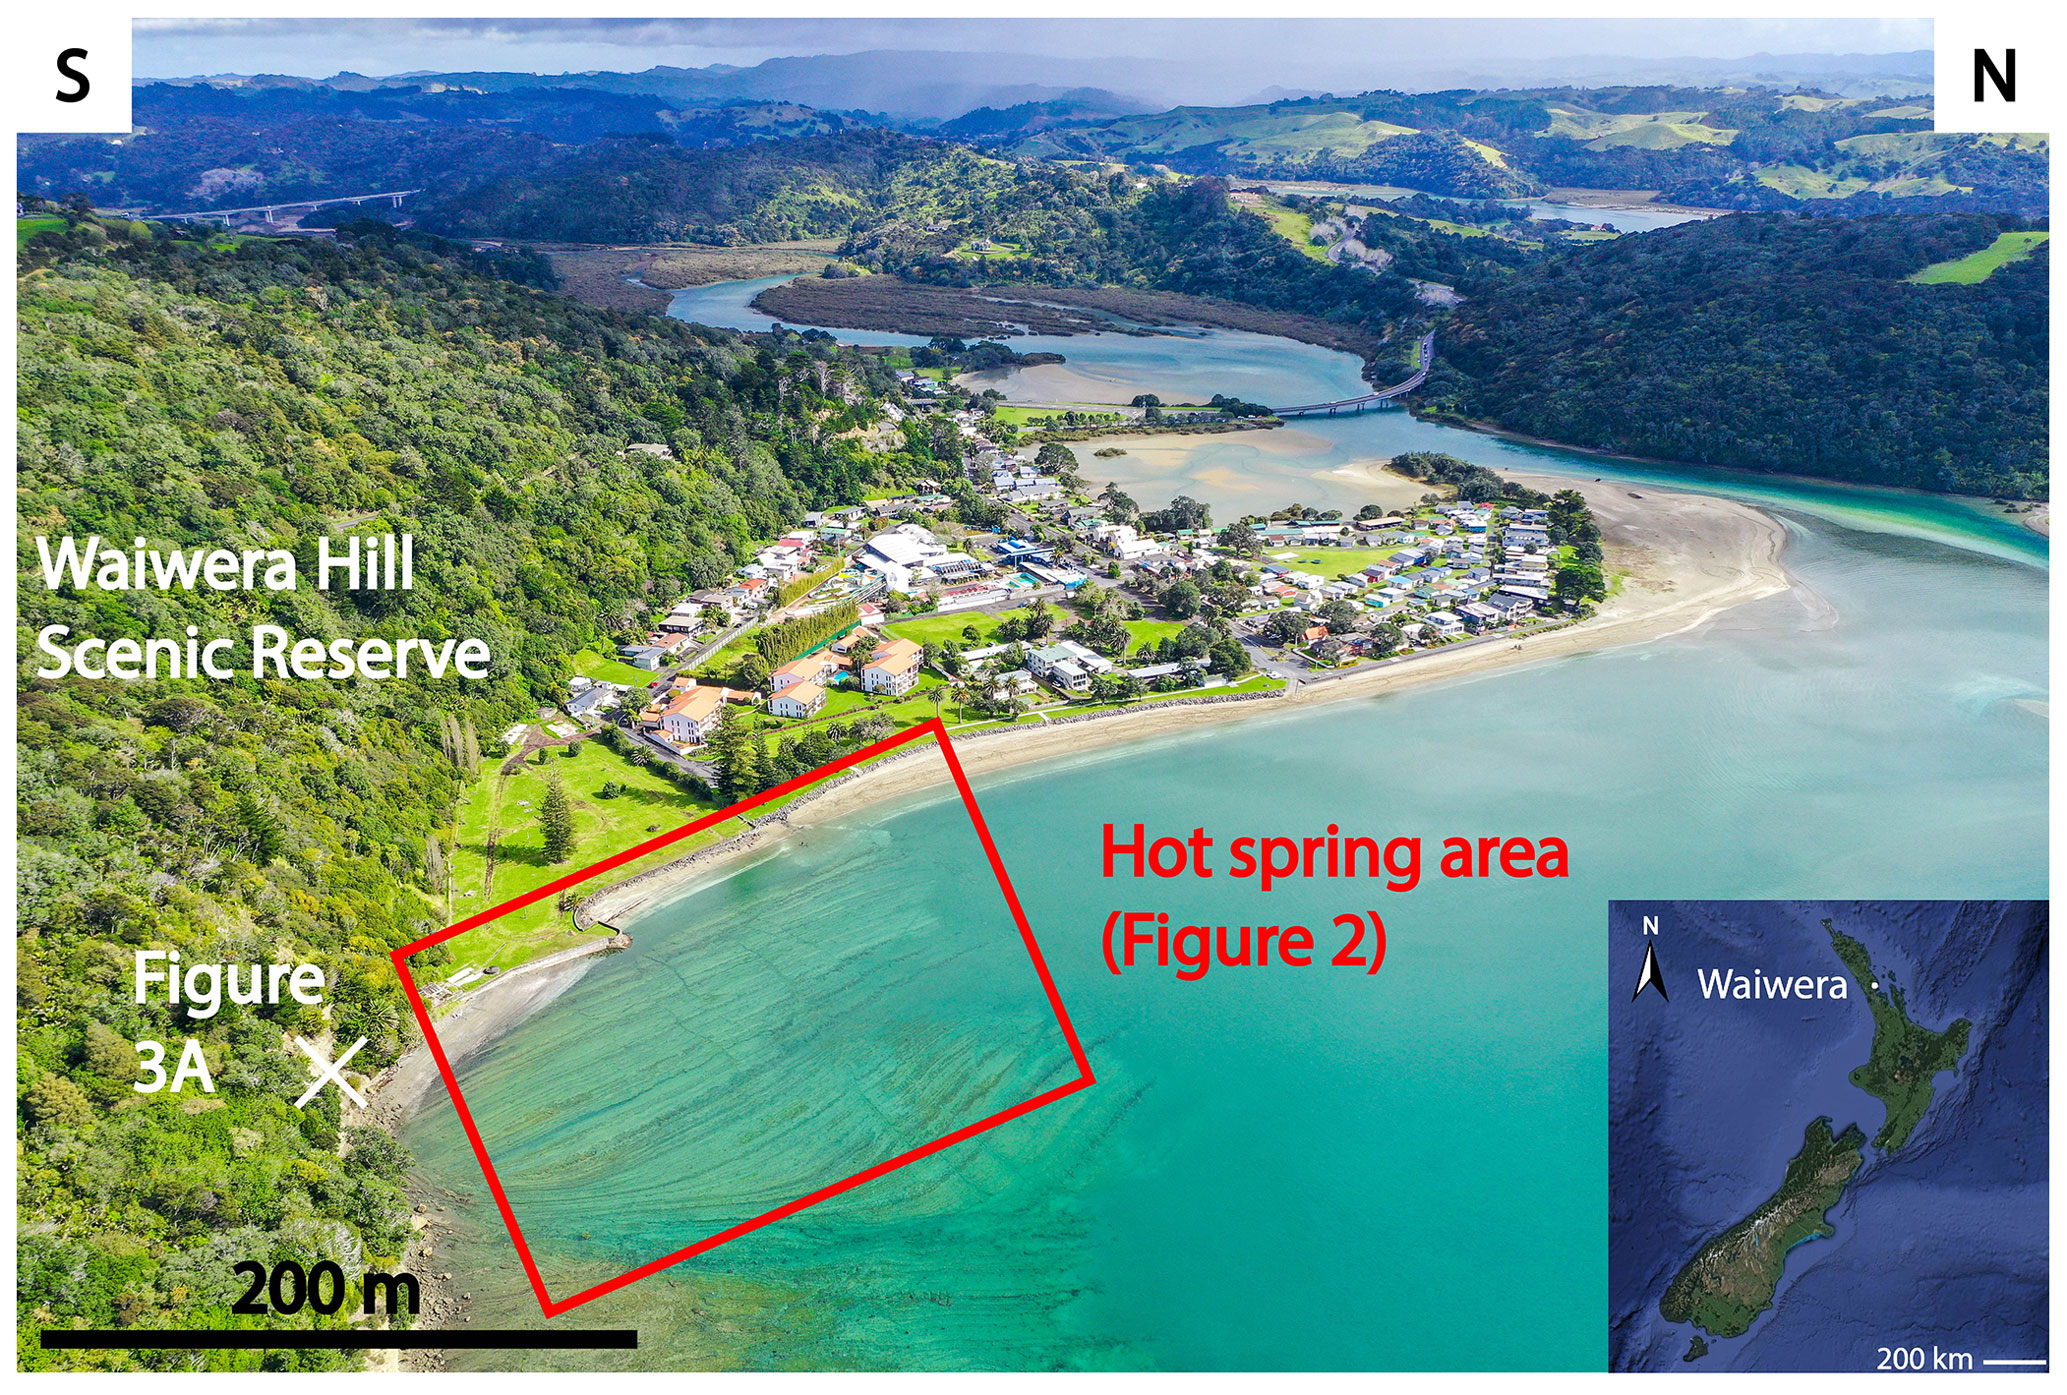
Figure 1Location of Waiwera (bottom right) and overview of the township of Waiwera and the surrounding area with the Waiwera Hill Scenic Reserve and the indicated hot spring area Fig. 2 at the beachfront, as well as the location of Fig. 3a. Insert modified from © Google Maps.
2.2 Methods
To locate flow paths and possible outlet positions of thermal water infrared cameras were used. For the thermal UAS mapping a MAVIC 2 PRO drone by DJI was used, carrying a longwave thermal infrared thermal camera of the type Tau™ 2 by FLIR, with a 9 mm lens, a scene range calibrated from −25 to +135 ∘C (high gain), an accuracy of measurement of up to 2 K and a spectral window of 7.5–13.5 µm. The thermal camera was attached to a frame grabber ThermalCapture 2.0 (640) by TEAX Technology, set to record radiometric and geotagged images at 12 frames per second. Additional thermal pictures of the main structures within the cliff were taken using a handheld thermographic camera of the type VarioCAM® HD head 800 by InfraTec, with a 60 mm telephoto lens, a temperature range from −40 to 1200 ∘C, an accuracy of measurement of ±1.5 K, a thermal resolution of up to 0.03 K at 30 ∘C, a spectral window of 7.5–14 µm, and an IR-Pixel upgrade VarioCAM® HD to 2048×1536 IR-Pixel (3.1 megapixel). The thermal data used for analyses was carried out pre-dawn in the early morning of the coldest night (∼ 6 ∘C) to ensure the best possible contrast between the ambient temperature and possible heat signatures. The FLIR thermal data was preprocessed using the ThermoViewer software by TeAx Technology, to investigate and correct various object and environmental properties. These are mainly represented by the emissivity of the object, the distance to the object, solar reflection, viewing angle, and the presence of particles/gases/steam in the electromagnetic radiation path (Spampinato et al., 2011), which all need to be adjusted to the situation to improve the results (Ball and Pinkerton, 2006). A constant emissivity of 0.95 and a constant flight height of approximately 200 m were assumed in this study. The remaining environmental effects were defined in accord to the measured outside temperature, a transmissivity of 0.7, an environmental and path temperature of 8 ∘C, and a humidity of 50 %. Subsequently the color representation of the images was adjusted to allow further processing using the Structure-from-Motion (SfM) workflow. For the SfM processing of the drone data the Agisoft PhotoScan Professional software by Agisoft© was used, to align the drone pictures and create tiled models of the area around Waiwera. To process the pictures of the VarioCAM® HD head 800 the IRBIS® 3 software by InfraTec was used with a colour range conform to the rainbow colour range used with ThermoViewer.
To additionally derive structural fracture data from the area, traditional manual compass measurements and photogrammetry were applied. A PHANTOM 4 Advanced drone by DJI with a 12.4 MP camera was used to create a detailed 3D model to gain additional digital fracture data since the accessibility of the cliff area by hand was restricted. In this paper, we present some digitally derived fault and fracture data to add information regarding fluid paths derived from the thermal imaging analyses. Therefore, fault and fracture data are only given as strike orientations since the correct derivation of the dip angle on image data needs further manual verification which goes beyond the scope of the presented study results. Fractures and faults can be differentiated on the images due to observed changes in bedding along faults or dragged bedding into faults.
3.1 Beachfront Waiwera
The results of the thermal infrared mapping of the outcrops at the beachfront of Waiwera show multiple outflows of geothermal water, which become visible during low tide. Apparent outflow temperatures vary between approximately 15.7 to 33.3 ∘C with an average apparent ground temperature of ∼ 11 ∘C and at an ambient temperature of ∼ 8 ∘C (Fig. 2). The warmest outflow with a maximum apparent temperature of 33.3 ∘C is not of natural occurrence but represents a wastewater outlet, the pipes of which can be followed towards the west on the thermal map (Fig. 2). Other observed outflows show maximum apparent temperatures between 15.7 and 25.2 ∘C (Fig. 2) and appear to mainly be located along (intersecting, W–E and NNW–SSE trending) faults and fractures. The low variety in temperature results in minor distortions of the thermal image, and thus, the fracture orientations derived from the thermal image appear to differ slightly from the manually and digitally measured orientations which are given above (cp. measured values in brackets above). In the south of this fracture zone the observed apparent temperature reaches 16.6 ∘C (Fig. 2), while the apparent temperatures in the centre of the fracture zone appear to be slightly cooler with 15.7 and 15.9 ∘C (Fig. 2). The north of the fracture zone shows the highest apparent temperatures with 16.7, 17.4, 18.2 and 19.6 ∘C (Fig. 2). It is uncertain if the apparent temperature of 25.2 ∘C, that was measured on the western beach margin (Fig. 2), is of natural occurrence. Field observations show, that the outflows along the fracture zone are geomorphologically separated from the wastewater outlet with 33.3 ∘C, as well as the outflow of uncertain origin with 25.2 ∘C. The warm (yellow) areas in the east of the thermal map represent the margins of the tidal seawater level during low tide (Fig. 2).
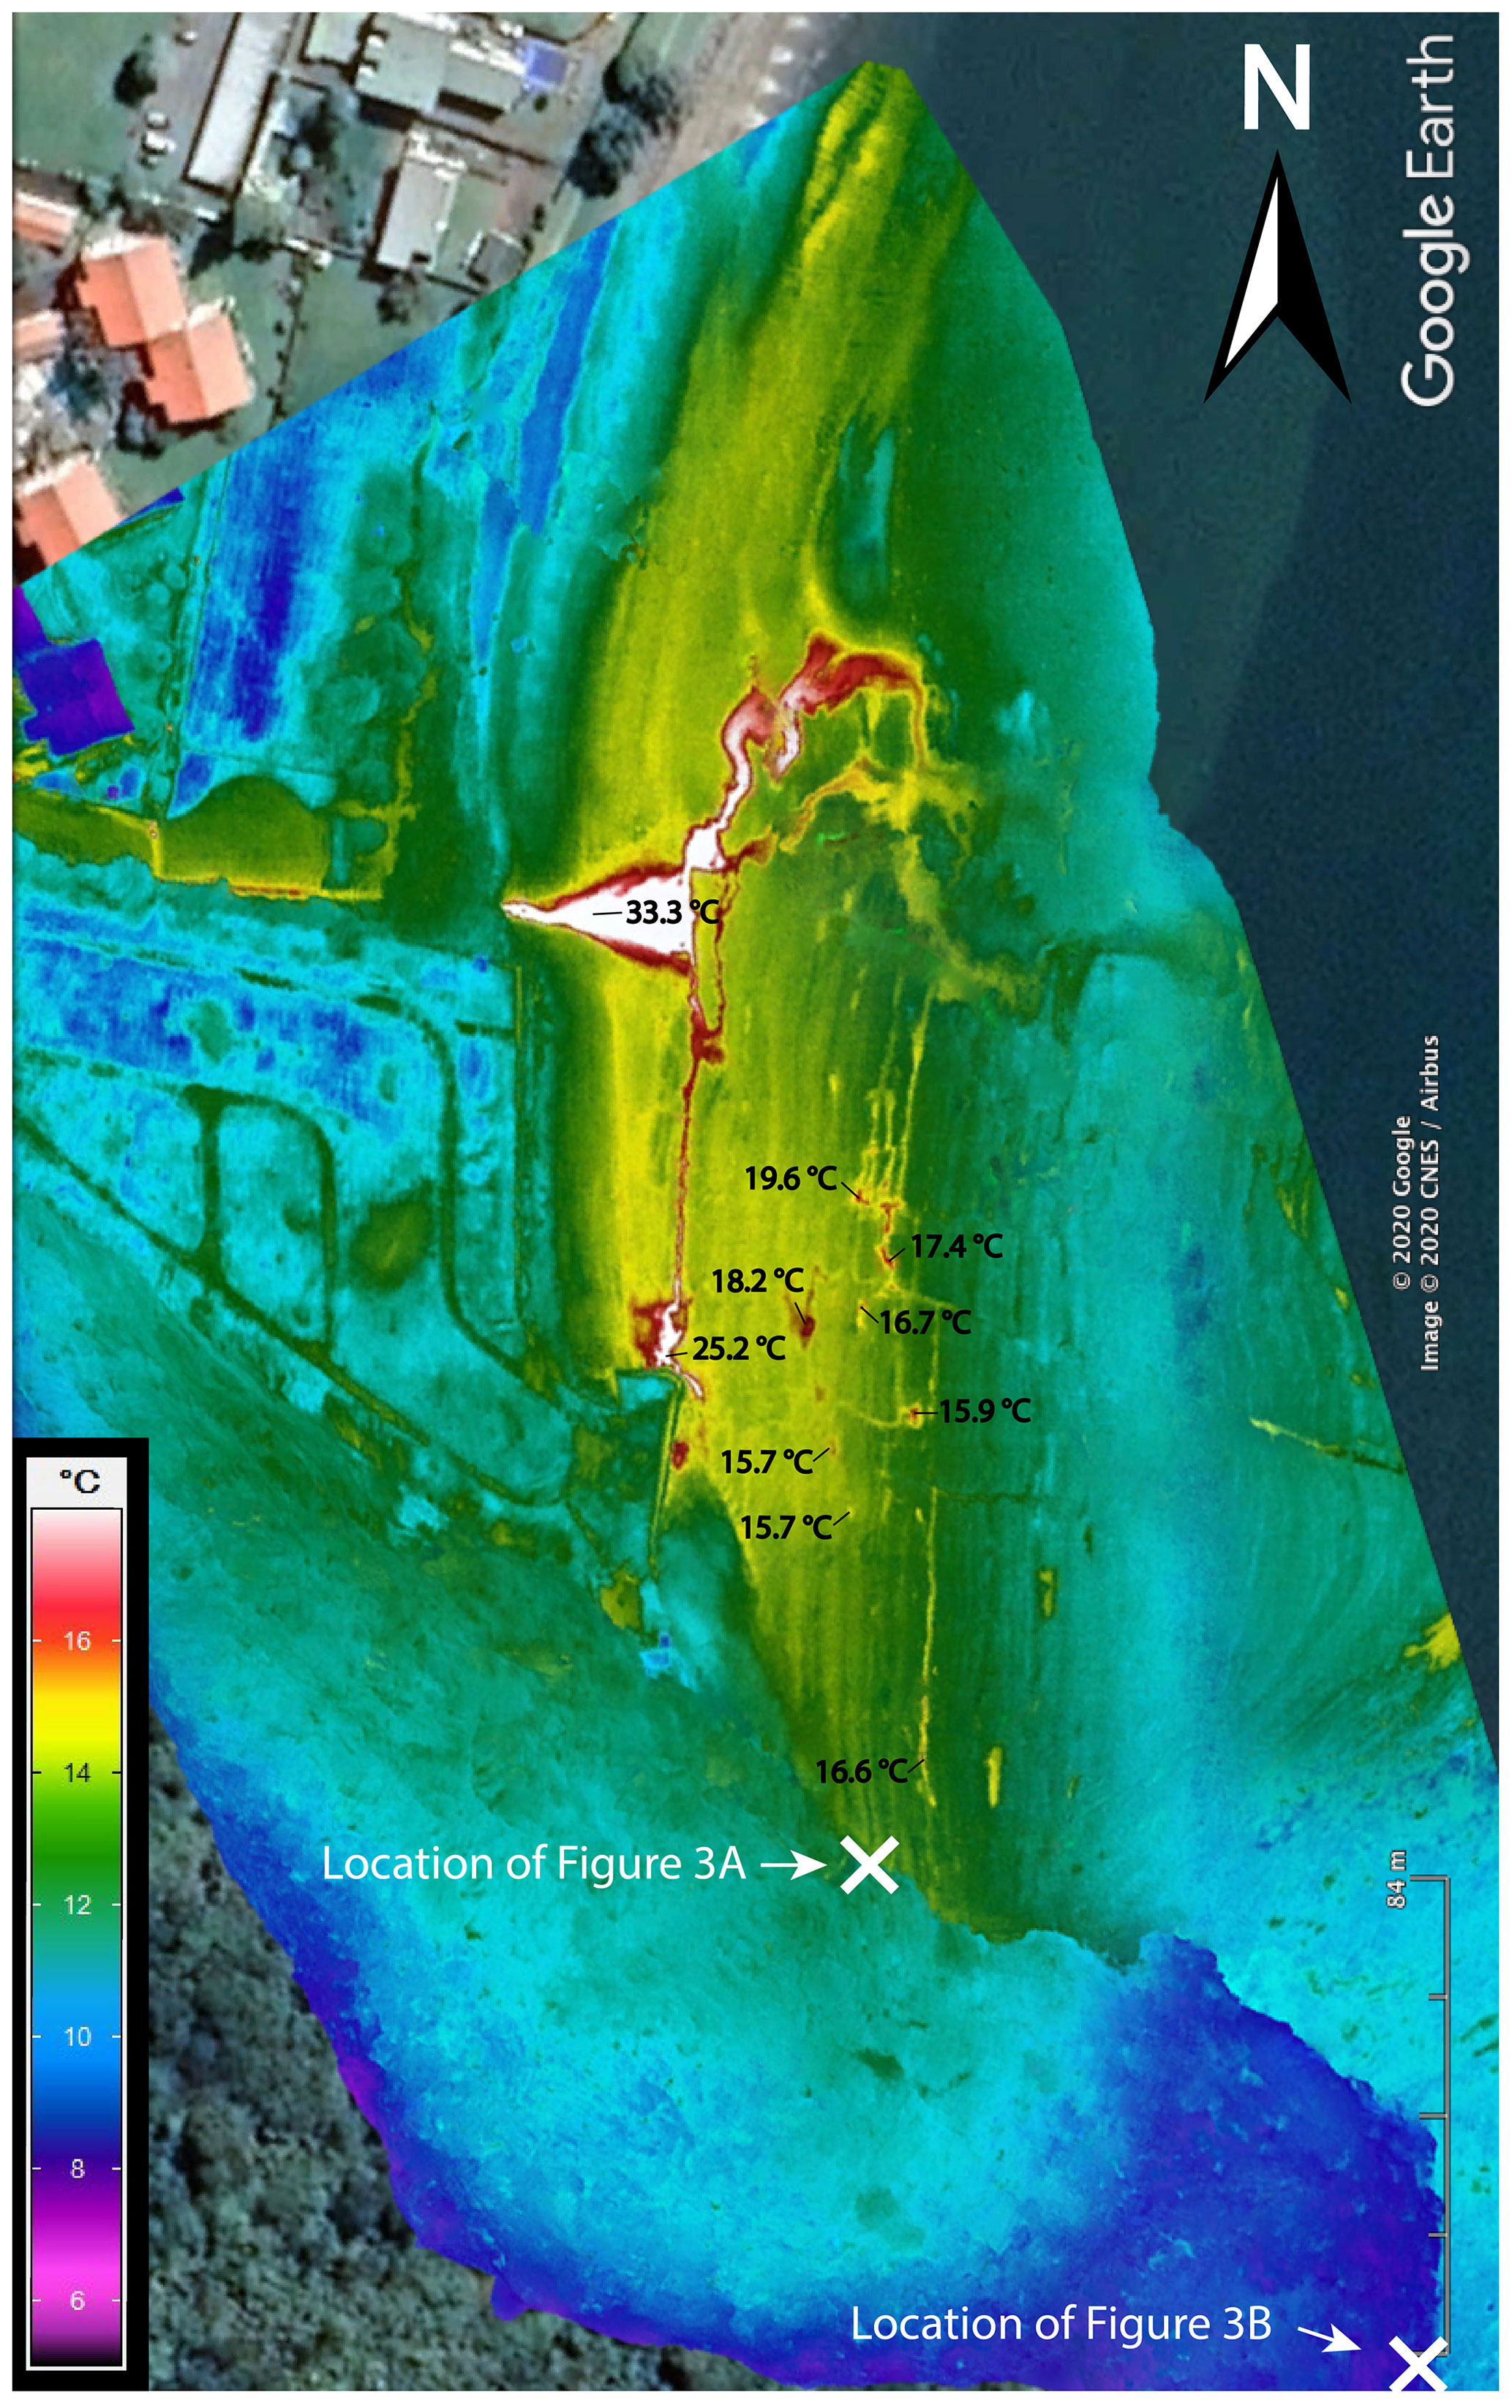
Figure 2Thermal infrared mapping of the outcrops at the beachfront of Waiwera, showing occurrence of geothermal water with apparent temperatures between 15.7 and 33.3 ∘C (ambient temperature ∼ 8 ∘C). The average apparent ground temperature is ∼ 11 ∘C. The map shows a slight contortion in the northern part, which does not influence the area of interest, containing the outlets of geothermal water. Thermal image overlain on © Google Earth image.
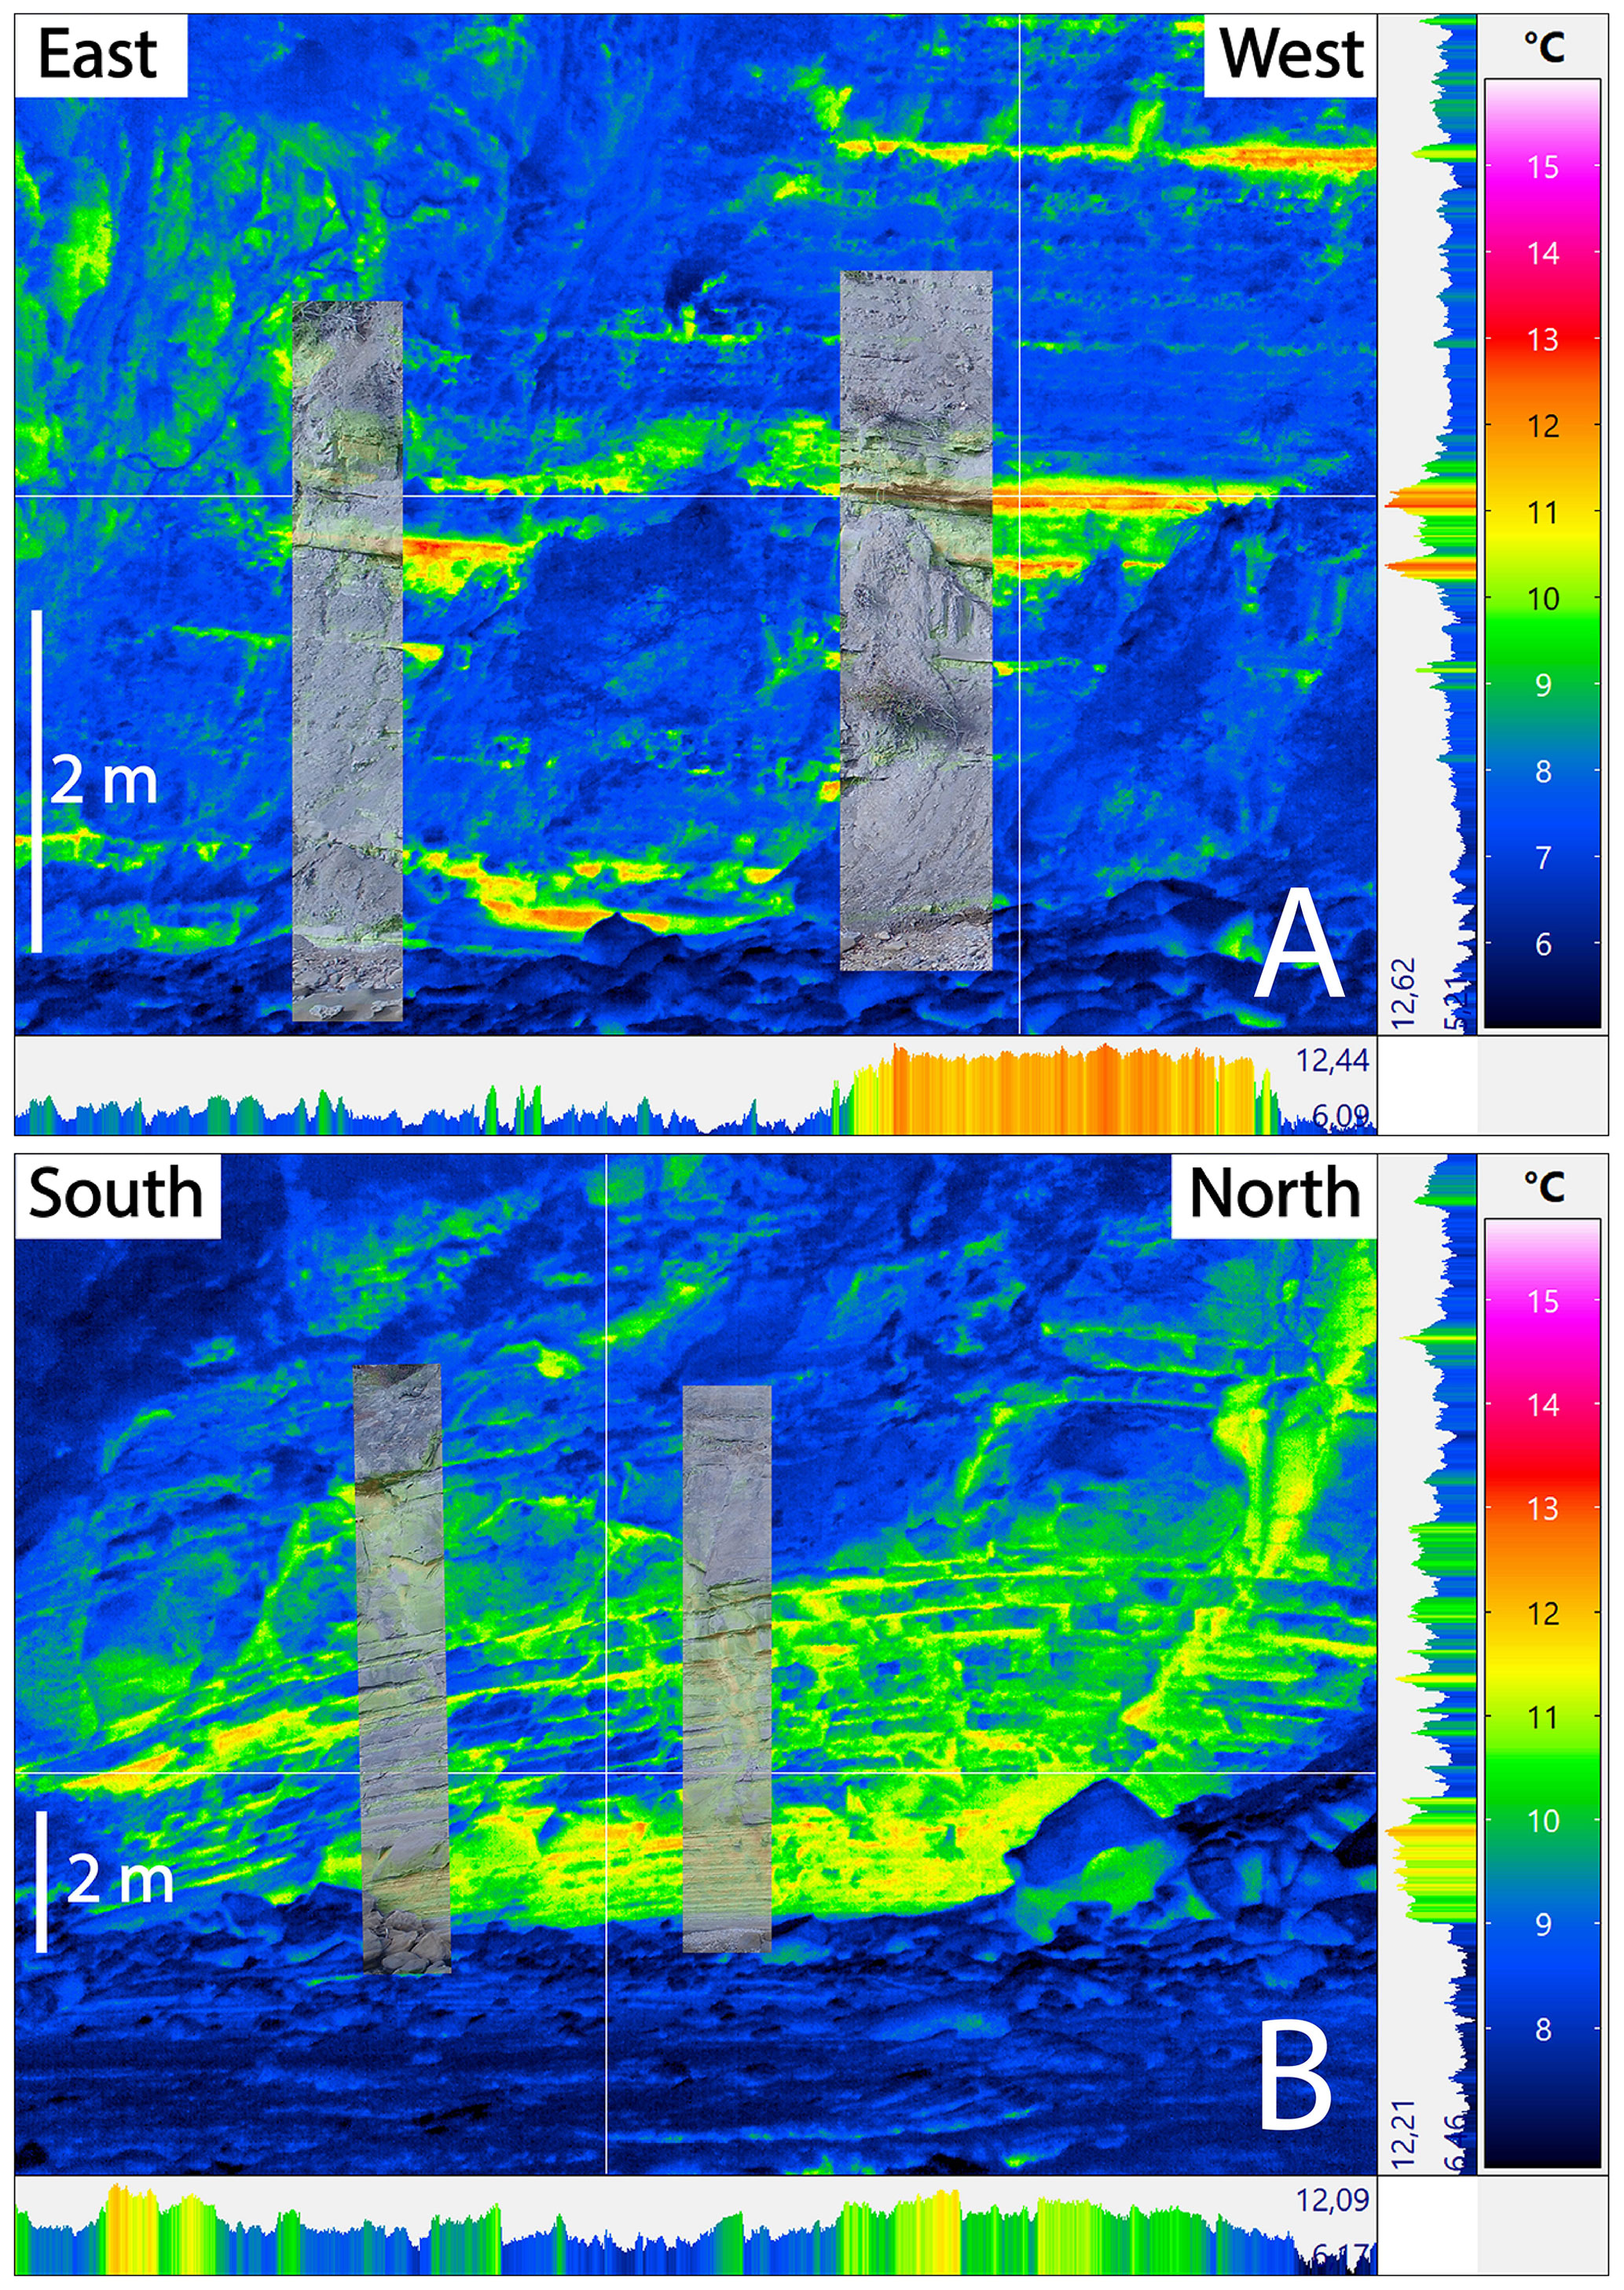
Figure 3Infrared picture of the western part of the northwards facing cliff side (a) and of the anticline at the southern end of the eastwards facing cliff side (b) with two 85 % opaque cutouts of a photographic picture for reference. The infrared picture was taken at an ambient temperature of ∼ 8 ∘C and shows apparent surface temperatures between 6 and 13 ∘C. Apparent rock surface temperatures range between 6 and 9 ∘C while higher apparent temperatures between 10 and 13 ∘C indicate fluid (groundwater) presence. Higher apparent temperatures are mostly observed in the bottom part of protruding sandstone beds (a) and are displayed along certain fractures (b). Individual beds show significant differences in temperatures.
3.2 Waiwera Hill Scenic Reserve cliff
The thermal recordings of the Waiwera Hill Scenic Reserve cliff show apparent surface temperatures between 6 and 13 ∘C at an ambient temperature of ∼ 8 ∘C. Apparent temperatures surpassing the average rock surface temperatures of 6 to 9 ∘C indicate fluid (groundwater) presence at an approximate range from 10 to 13 ∘C (in the following referred to as high apparent temperatures). Individual beds show great differences in temperature (Fig. 3). It is generally difficult to match the exact beds to the areas of high apparent temperature due to the resolution of the infrared pictures, the often very thin bed thicknesses and the (fine grained) debris on vast parts of the cliff surface, especially in the western part of the northwards facing cliff side (Fig. 3a). Cutouts of photographic pictures where therefore added to the infrared pictures for reference and to help distinguish individual beds. The cutouts have an 85 % opacity that allows to identify beds while still being able to follow areas of high temperature. In Fig. 3a the cutouts show that in areas covered by debris, high apparent temperatures can mainly be observed within the bottom sections of protruding sandstone beds, which are free of debris. Additionally, high apparent temperatures can be observed vertically along minor fractures, while there is no thermal indication for faults in Fig. 3a. High apparent temperatures can further be observed throughout the anticline in Fig. 3b, especially along fractures and faults, which are traceable by the high apparent temperatures displayed along them and following them vertically throughout beds. Another area displaying high apparent temperatures throughout the anticline is represented by the sandstone beds in the lower section of the anticline that consists of thin beds varying in thicknesses of up to 10 cm (Fig. 3b). Within these sandstone beds, the high apparent temperatures appear not to be confined to the bottom section of the individual bed (as seen in Fig. 3a) but can be observed throughout the bed. However, due to the low thicknesses of the beds within this section of the anticline and the limited resolution of the infrared picture, these observations contain uncertainty. The upper section of the anticline contains a number of slightly protruding sandstone beds of greater thickness (∼ 10 to 30 cm) with interbedded, very thin sandstone and siltstone beds (∼ 1 to 5 cm) between them. High apparent temperatures within this section of the anticline are mainly confined to these interbedded, very thin beds (Fig. 3b). However, it is not possible to distinguish between individual sandstone and siltstone beds, since they are too thin. The thicker sandstone beds generally show lower apparent temperatures except for fractured sections (Fig. 3b).
The UAS survey shows that the highest observed temperature results from a wastewater outlet (Fig. 2). The second warmest outlet with a maximum apparent temperature of 25.2 ∘C could be of natural origin or represent a possible leakage of one of the old and shut down bores. Undoubtedly the observed thermal anomalies represented by apparent temperatures of 15.7 to 19.6 ∘C along the NNW–SSE striking fault zone and several W–E striking faults at the beachfront, indicate revived thermal activity. This is proven by their occurrence at locations which are geomorphologically detached from overflow sources and seawater contact during low tide, as well as by the fact that their observed temperatures being distinguishably higher than the measured ground surface temperature of ∼ 11 ∘C, the measured ambient temperature of ∼ 8 ∘C, which marks an exceptionally cold night for October at Waiwera (Worldweatheronline, 2020), the ambient groundwater temperature of ∼ 15 ∘C (Kühn and Stöfen, 2005) and the average seawater temperature of 15 ∘C for the start of October (Surf-forecast, 2020). As for the thermal observations of the Waiwera Hill Scenic Reserve cliff the fluid pathways marked by higher temperatures must represent groundwater pathways or pathways used by meteoric water, since the temperature displayed along them is too low for geothermal water and the elevation off the cliff is too high for seawater to intrude.
The thermal survey of the cliff and beachfront at Waiwera has led to the following observations: (1) Fluid migration mainly occurs vertically along faults and fractures, and horizontally in sandstone beds, while the siltstone beds act as a permeability barrier. (2) Horizontal fluid movement mainly occurs along the bottom section of the sandstone beds, and (3) renewed geothermal activity is present along certain (intersecting) faults and fractures at the beachfront, which proves that these structures are at least partly open for fluid flow.
However, there are a number of possible inaccuracies that need to be taken into account when working with thermal infrared cameras regarding the results of the recorded apparent temperatures. These include emissivity and surface roughness of the object, viewing angle, atmospheric effects, pathlength, solar reflection and solar heating, the presence of gas or aerosols, instrumental noise and aberrations, and thermal heterogeneity of the target at the sub-pixel scale. Significant underestimation of the actual thermodynamic temperature of the target is generally the result of these inaccuracies (Spampinato et al., 2011). All settings were chosen in a way to keep these uncertainties to a minimum in this study.
The results of the thermal survey show the importance of open faults and fractures as fluid pathways and confirm renewed activity of the hot springs at the beachfront with naturally discharging geothermal water of ∼ 15 to 20 ∘C along certain (intersecting) faults and fractures. Combining these results with the rock properties and fracture network characterization of the study area will provide the base for a reservoir model to improve the understanding of the Waiwera geothermal reservoir.
The very large data sets can only be viewed and progressed using commercial software. For access to the raw data contact the corresponding author.
CH and MK conceptualized the research work; MK acquired the funding for the field trip; MP, IB, TRW and MK did the field and/or laboratory work; IB and MK were responsible for the project administration; IB and TW supervised the field activities; MP and TRW visualised the results; MP wrote the original draft and finalised the paper; IB, CH, TRW and MK contributed with reviews and editing.
The authors declare that they have no conflict of interest.
This article is part of the special issue “European Geosciences Union General Assembly 2020, EGU Division Energy, Resources & Environment (ERE)”. It is a result of the EGU General Assembly 2020, 4–8 May 2020.
The research reported in this paper was supported by the Auckland Council. The authors wish to thank Kolt Johnson from the Auckland Council as well as Lorna Strachan and Bernhard Spörli from the Department of Environment at the University of Auckland for their support during the field studies of the Waiwera geothermal reservoir.
The article processing charges for this open-access publication were covered by a Research Centre of the Helmholtz Association.
This paper was edited by Johannes Miocic and reviewed by two anonymous referees.
Allen, S. R.: The parnell grit beds revisited: Are they all the products of sector collapse of western subaerial volcanoes of the northland volcanic arc?, New Zeal. J. Geol. Geop., 47, 509–524, https://doi.org/10.1080/00288306.2004.9515073, 2004.
ARWB: Waiwera water resource survey – Preliminary water allocation/management plan, Auckland Regional Water Board, Technical Publication, Issue 17, 154236496 178 pp., 1980.
Ball, M. and Pinkerton, H.: Factors affecting the accuracy of thermal imaging cameras in volcanology, J. Geophys. Res., 111, B11203, https://doi.org/10.1029/2005JB003829, 2006.
Becker, I., Wüstefeld, P., Koehrer, B., Felder, M., and Hilgers, C.: Porosity and permeability variations in a tight gas sandstone reservoir analogue, Westphalian D, Lower Saxony Basin, NW Germany: Influence of depositional setting and diagenesis, J. Petrol. Geol., 40, 363–389, 2017.
Becker, I., Koehrer, B., Waldvogel, M., Jelinek, W., and Hilgers, C.: Comparing fracture statistics from outcrop and reservoir data using conventional manual and t-LiDAR derived scanlines in Ca2 carbonates from the Southern Permian Basin, Germany, Mar. Petrol. Geol., 95, 228–245, 2018.
Becker, I., Busch, B., Koehrer, B., Adelmann, D., and Hilgers, C.: Reservoir quality evolution of Upper Carboniferous (Westphalian) tight gas sandstones, Lower Saxony Basin, NW Germany, J. Petrol. Geol., 42, 371–392, 2019.
Busch, B., Becker, I., Koehrer, B., Adelmann, D., and Hilgers, C.: Porosity evolution of two Upper Carboniferous tight-gas-fluvial sandstone reservoirs: Impact of fractures and total cement volumes on reservoir quality, Mar. Petrol. Geol., 100, 376–390, 2019.
Busch, B., Hilgers, C., and Adelmann, D.: Reservoir quality controls on Rotliegend fluvio-aeolian wells in Germany and the Netherlands, Southern Permian Basin – Impact of grain coatings and cements, Mar. Petrol. Geol., 112, 104075, https://doi.org/10.1016/j.marpetgeo.2019.104075, 2020.
Cawood, A. J., Bond, C. E., Howell, J. A., Butler, R. W. H., and Totake, Y.: Lidar, UAV or compass-clinometer? Accuracy, coverage and the effects on structural models, J. Struct. Geol., 98, 67–82, 2017.
Hodgetts, D.: Laser scanning and digital outcrop geology in the petroleum industry: A review, Mar. Petrol. Geol., 46, 335–354, 2013.
James, M. R., Carr, B., D'Arcy, F., Diefenbach, A., Dietterich, H., Fornaciai, A., Lev, E., Liu, E., Pieri, D., Rodgers, M., Smets, B., Terada, A., von Aulock, F., Walter, T. R., Wood, K., and Zorn, E.: Volcanological applications of unoccupied aircraft systems (UAS): Developments, strategies, and future challenges, Volcanica, 3, 67–114, 2020.
Kühn, M. and Altmannsberger, C.: Assessment of Data Driven and Process Based Water Management Tools for the Geothermal Reservoir Waiwera (New Zealand), Energy Proced., 97, 403–410, https://doi.org/10.1016/j.egypro.2016.10.034, 2016.
Kühn, M. and Schöne, T.: Multivariate regression model from water level and production rate time series for the geothermal reservoir Waiwera (New Zealand), Energy Proced., 125, 571–579, https://doi.org/10.1016/j.egypro.2017.08.196, 2017.
Kühn, M. and Stöfen, H.: A reactive flow model of the geothermal reservoir Waiwera, New Zealand, Hydrogeol. J., 13, 606–626, https://doi.org/10.1007/s10040-004-0377-6, 2005.
Kühn, M., Altmannsberger, C., and Hens, C.: Waiweras Warmwasserreservoir – Welche Aussagekraft haben Modelle?, Grundwasser, 21, 107–117, https://doi.org/10.1007/s00767-016-0323-2, 2016.
Spampinato, L., Calvari, S., Oppenheimer, C., and Boschi, E.: Volcano surveillance using infrared cameras, Earth-Sci. Rev., 106, 63–91, https://doi.org/10.1016/j.earscirev.2011.01.003, 2011.
Surf-forecast: Orewa Beach Water Temperature and Wetsuit Guide (Auckland, New Zealand), available at: https://www.surf-forecast.com/breaks/Orewa-Beach/seatemp, last access: 31 October 2020.
Walter, T. R., Jousset, P., Allahbakhshi, M., Witt, T., Gudmundsson, M. T., and Hersir, G. P.: Underwater and drone based photogrammetry reveals structural control at Geysir geothermal field in Iceland, J. Volcanol. Geoth. Res., 391, 106282, https://doi.org/10.1016/j.jvolgeores.2018.01.010, 2020.
Worldweatheronline: Upper Waiwera Monthly Climate Averages, available at: https://www.worldweatheronline.com/upper-waiwera-weather-averages/nz.aspx, last access: 31 October 2020.
Wüstefeld, P., de Medeiros, M., Koehrer, B., Sibbing, D., Kobbelt, L., and Hilgers, C.: Evaluation of a workflow to derive t-LiDAR fracture statistics of a tight gas sandstone reservoir analog, AAPG Bull., 102, 2355–2387, 2018.