 | 23 Nov 2020
Storm Xaver over Europe in December 2013: Overview of energy impacts and North Sea events
Anthony James Kettle
Storm Xaver on 5–6 December 2013 was a serious winter storm in northern Europe with important impacts on societal and energy infrastructure. The storm's low pressure centre passed eastward north of Scotland, across the North Sea and southern Scandinavia, and into the Baltic region. The trajectory resulted in strong northwest winds and a cold air outbreak southward across the North Sea. The resultant convection system was associated with powerful wind gusts and freezing precipitation that impacted the UK, Belgium, the Netherlands, Germany, Poland, Denmark, Sweden, and Norway. The storm caused coastal flooding that was comparable with the most serious North Sea surge events of the 20th century. The primary impact for energy meteorology was a large scale electrical power loss in the northern part of the British Isles, Sweden, Poland, and parts of Germany. Petroleum production was reduced as offshore platforms were evacuated ahead of the storm. For wind energy, a number of onshore turbines were damaged by the gust field. Other societal impacts included travel and transport interruptions, building damage, forest damage, and coastal erosion. Because of the high water levels and sea state in the North Sea, the storm was important for offshore wind energy. The wind energy research tower FINO1 sustained unexpected damage during the storm, similar to previous wave strikes during Storm Britta (2006) and Storm Tilo (2007). A closer analysis is made of the tide gauge records across the North Sea to understand the progression of the storm surge and identify high amplitude, short-period features that may be linked to unusual seiches, meteotsunamis, or infragravity waves. Similar to previous storms, there is an indication that large infragravity waves during Storm Xaver may have had an impact on North Sea transport and energy infrastructure as well as coastal erosion. The review of information from different sources permits the met-ocean conditions and resultant societal/energy impacts to be related in time and space.
- Article
(3662 KB) - Full-text XML
-
Supplement
(5878 KB) - BibTeX
- EndNote


Weather systems have important impacts on energy generation and transmission infrastructure. Important goals of energy meteorology are to characterize the environmental conditions for the normal operating conditions and also to understand weather extremes for the survivability of energy infrastructure. Hydropower, petroleum infrastructure, nuclear power, and wind energy all have some exposure and susceptibility to dangerous weather conditions. These may include extremes of temperature, winds, rain, snowfall, ice storms, and flooding. Offshore wind energy may be more susceptible to environmental damage than other sectors of the energy industry, being exposed to both wind and wave forces in a shallow water environment.
Only a few studies have addressed the damage that offshore wind turbines may incur in coastal regions. Reviewing the North Sea offshore wind energy experience for U.S. developers, Diamond (2012) noted special cases of damage that were not foreseen by the industry. The most important of these were failed foundation grout connections which had affected 80 % of offshore wind turbines during the first decade of North Sea development. Shifting sea bed and migrating sand waves were identified as serious problems that led to exposed power transmission cables and required remedial action. Both problems indicated that the nature of the dynamic forces from waves and currents during the maritime storms were more serious than previously suspected from onshore wind energy experience. Other potential problems were port flooding during storm surges and ship collision risk especially during poor weather. Diamond (2012) highlighted that hurricane damage would be a special problem for US offshore wind energy development. Offshore wind turbines are designed to withstand Category 1 hurricanes but have significant risk of sustaining serious damage during hurricanes of Category 3 and higher. Using a database of hurricane landings and a probabilistic model, Rose et al. (2012) quantified the risk of wind turbine destruction by hurricanes at different locations along the U.S. coasts of the Atlantic Ocean and Gulf of Mexico. There was a high expected destruction rate due to hurricane encounters over the 20-year lifetime of a wind farm. In northern Europe, where most offshore wind energy infrastructure is currently located, extreme 10 m wind speeds during winter storms do not generally exceed the strength of a Category 1 hurricane, and this is currently survival design standard in the industry (Rose et al., 2012; Buchana and McSharry, 2019).
The issue is highlighted by cases of destruction of energy infrastructure during hurricanes and typhoons. Rose et al. (2012) framed the hurricane risk to U.S. offshore wind turbines with the damage caused to the oil and petroleum industry in the Gulf of Mexico by Hurricane Katrina in August 2005. Hurricane Katrina reached Category 5 intensity and was a Category 3 hurricane when it made landfall near New Orleans. It destroyed 44 petroleum platforms and severely damaged 21 others. Waves were an important factor in the destruction cases with a large number of platforms destroyed in shallow water <60 m deep (Cruz and Krausmann, 2008). Although there has been no comparable damage to offshore wind farms, there are a number of reports of severe damage to coastal onshore wind farms during storms of hurricane strength. These include wind farms at Porbandar during the Gujarat cyclone of June 1998 (Winther-Jensen and Jørgensen, 1999), Okinawa during Typhoon Maemi in September 2003 (Ishihara et al., 2005), eastern China during super typhoon Saomai in August 2006 (Li et al., 2013), and southern China during super typhoon Usagi in September 2013 (Chen and Xu, 2016). Turbine tower collapse occurred in most of these cases during conditions of high wind speeds (stronger than a category 1 hurricane) and large changes in wind direction. Offshore wind farms have been in operating in the North Sea since 2000 (Buchana and McSharry, 2019), but there have been no reports of extensive wind turbine collapse in this area comparable with the worst coastal cases from east and south Asia. Mostly this is because the largest historical wind speeds in the region seldom exceed the threshold at which the wind turbine tower has been threatened (Buchana and McSharry, 2019). On the other hand, there have been media reports of unusual isolated accidents at certain offshore sites. At the Danish offshore Samsø wind farm in the Kattegat, a nacelle fell off the top of a wind turbine tower into the sea on 3 December 2015 (4Coffshore, 2015). At the Alpha Ventus wind farm in the German Bight, the nacelle cover fell off one of the turbines in April 2018 (Wind Action, 2018). The brief media reports of the events are not clear on what mechanical or environmental factors may have been responsible for these accidents. For the Alpha Ventus incident there was speculation that atmospheric turbulence, corrosion, or fatigue failure may have played a role.
Winter storms are a challenge for energy meteorology in Europe for the threat to energy generation and transmission systems. This contribution focuses on the impact of Storm Xaver in northern Europe on 5–6 December 2013. There is a general literature overview of the infrastructure and societal impacts, and a more comprehensive reference list is presented in the Supplement. This is followed by a focus study of the tide gauge data around the North Sea to understand the storm surge and short period oscillations, which may be linked with unusual wave phenomena (e.g., infragravity waves or rogue waves). Ever since the wave strike damage to the research platform FINO1 during Storm Britta on 31 October–1 November 2006, the offshore wind energy community has been sensitized to the issue of extreme waves in the North Sea (Pleskachevsky et al., 2012). Wave statistics do not usually reveal information on rogue wave incidents, but their presence may be inferred from damage reports from shipping and offshore platforms. This contribution follows on two previous studies of the Storm Britta in 2006 (Kettle, 2018) and Storm Tilo in 2007 (Kettle, 2019), which were also important for energy meteorology.
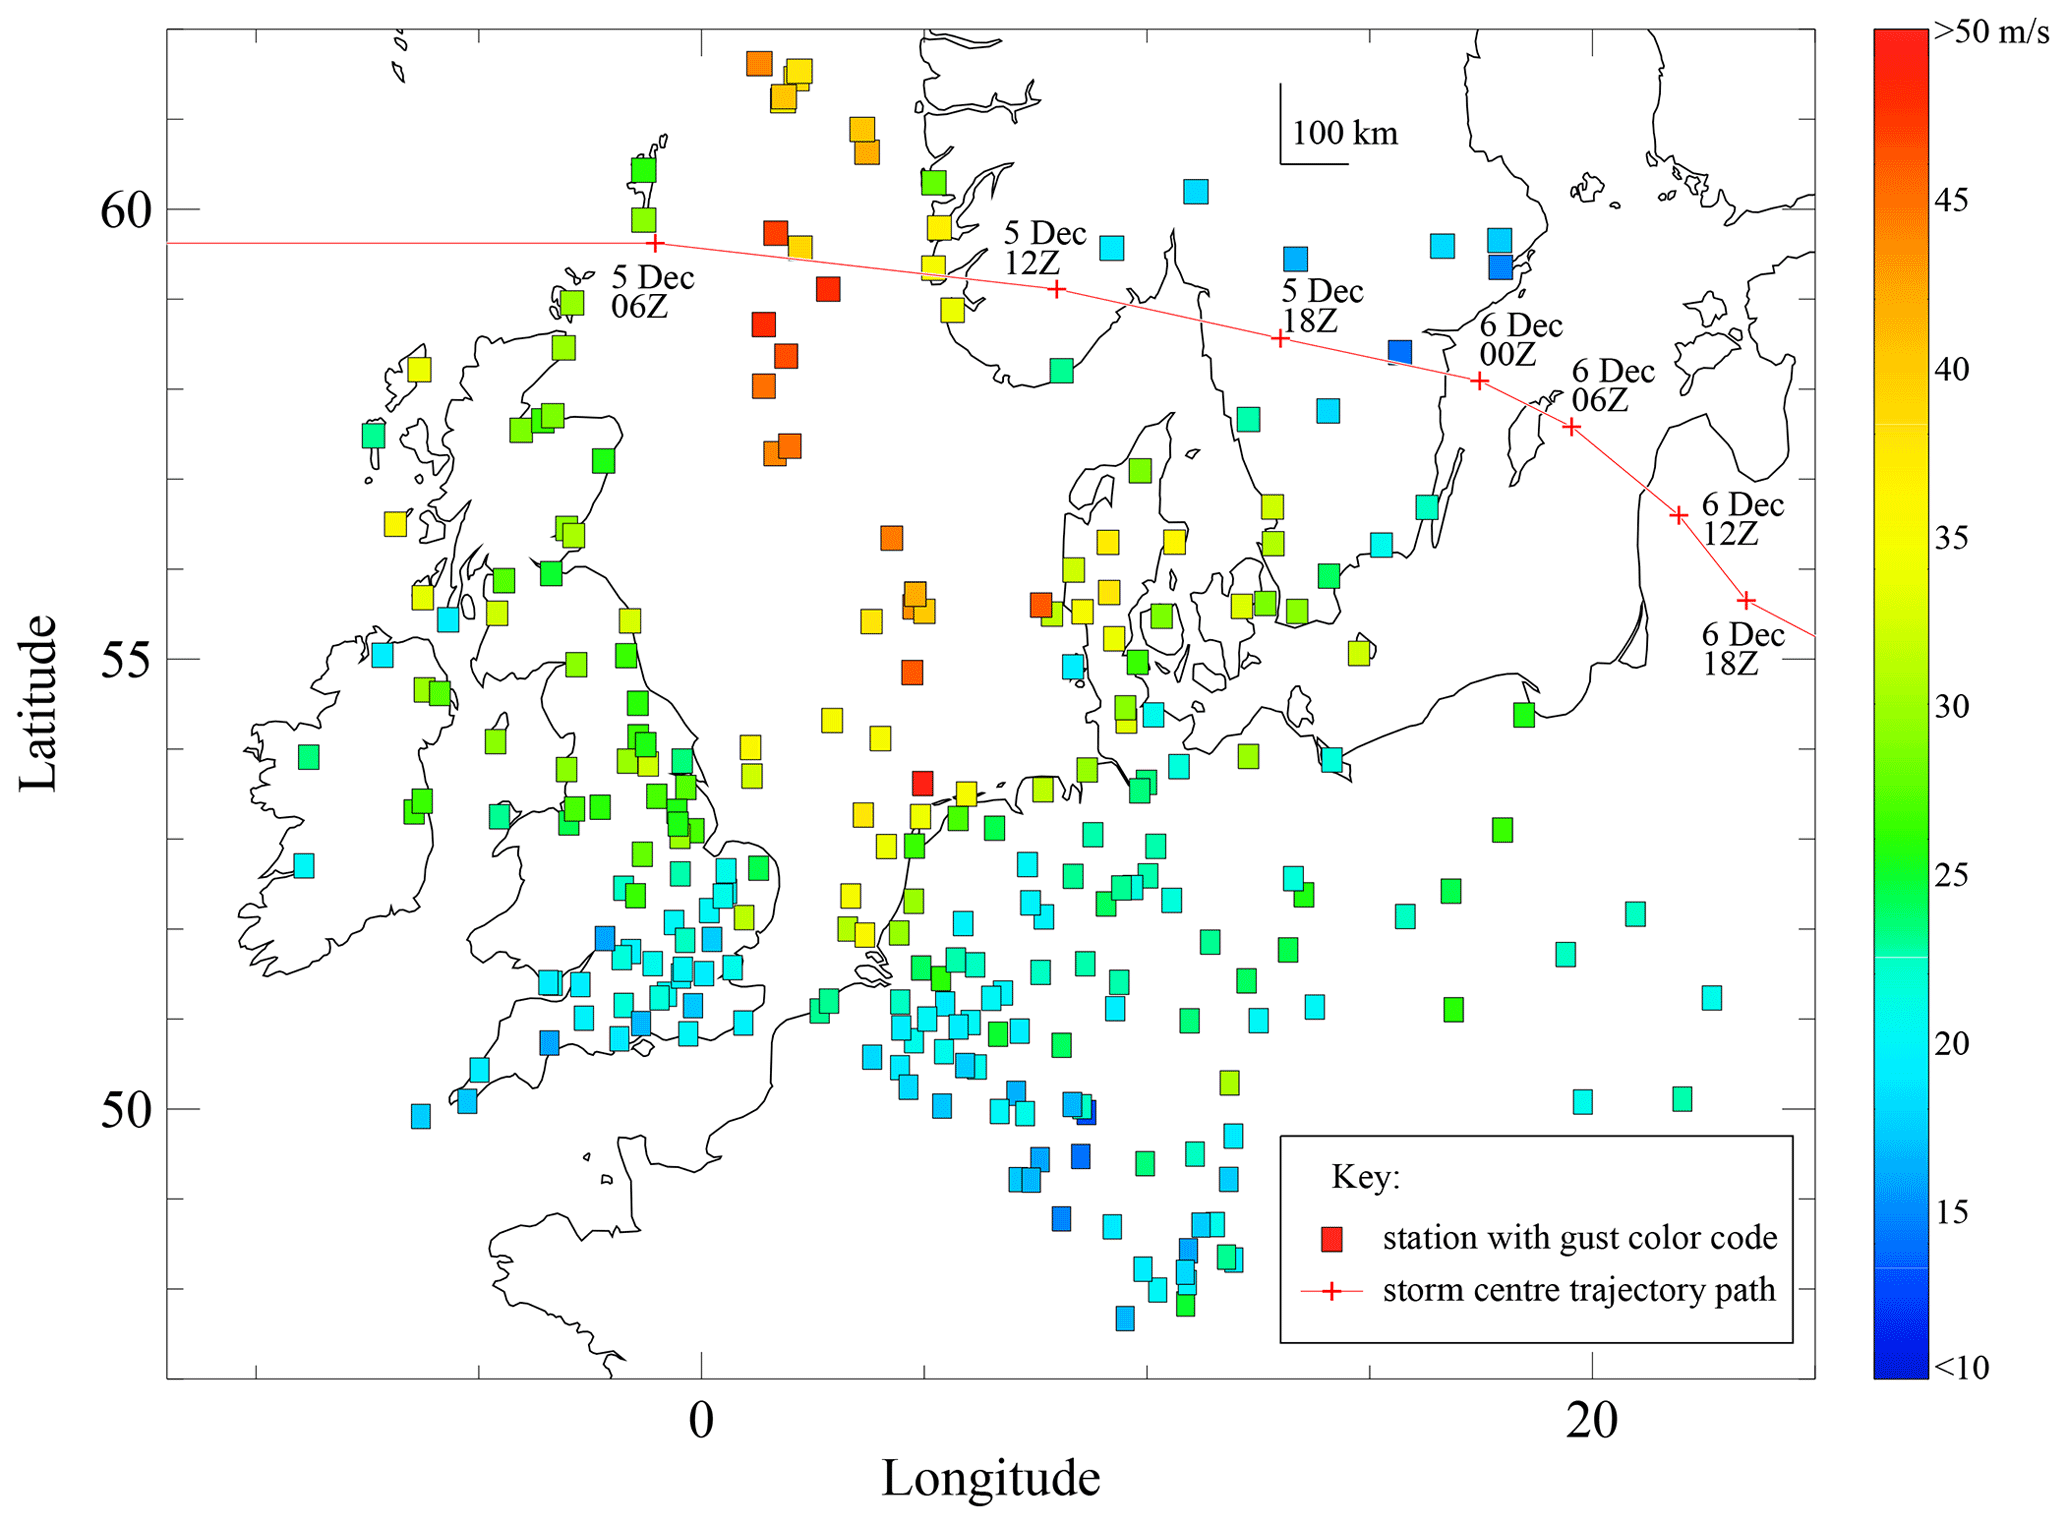
Figure 1Maximum gusts over the two-day period 5–6 December 2013 from selected airports, offshore platforms, and coastal stations. The trajectory of the low pressure centre is indicated (digitized from the Supplement of Fenoglio-Marc et al., 2015).
Storm Xaver formed as a low pressure centre southeast of Greenland on 4 December 2013. It moved on an eastward path north of Scotland, across the North Sea and southern Scandinavia on 5 December 2013 and into the Baltic Sea area the following day (Fig. 1). The trajectory of the storm across the northern North Sea led to a cold air outbreak and powerful northwest winds across the North Sea. The combination cold Arctic air passing over relatively warm water caused the development of an atmospheric convection field that was visible in satellite images as a pattern of open cell cloud structures. The primary storm hazard was associated with the gust field (Fig. 1). This struck Scotland first early on the 5 December 2013 and then the Netherlands and German North Sea coasts during the late afternoon as a southward moving squall line. The strong atmospheric convective field was associated with heavy rain showers in Germany, significant snow accumulations in Germany and Scandinavia, lightning strikes, and reports of tornadoes (Wikipedia, 2020a). The strong northwest winds (see Fig. S1 of the Supplement) pushed water southward along the north-south axis of North Sea and contributed to a strong coastal storm surge, which was identified as a secondary storm hazard. The flooding threat was exacerbated by the fact that the storm surge occurred during a spring tide at a time in the month when the sun-Earth-moon alignment results in an especially high water level (Pugh, 1987, p. 82). High waves were generated in the North Sea (see Fig. S2), which worsened the storm surge flooding effects and contributed to certain offshore infrastructure incidents. Some stations on the east coast of England registered their highest water levels since the start of records. These levels exceeded even the storm surge of 31 January–1 February 1953, which was the worst coastal flooding event in northwest Europe in the twentieth century and resulted in approximately 2000 fatalities.
Storm Xaver had serious impacts on societal infrastructure. These are summarized in thematic maps in the Supplement for energy (Fig. S3), transport (Fig. S4), and coastal impacts (Fig. S5). The maps have been assembled from a number of literature sources that are presented in the Supplement. The most important of these were the Wikipedia summaries of original media reports in English, German, Danish, and Swedish (Wikipedia, 2020a, b, c, d). The most prominent energy impact was the loss of electrical power across large areas of the UK, Ireland, Poland, southern Sweden, and areas of northern Germany. This was mostly due to the wind gust field, although a region around Middlesbrough in northeast England experienced a power loss due to storm surge flooding of an electrical substation. Petroleum production in the North Sea was reduced as several platforms were evacuated ahead of the storm. For onshore wind energy, there were several cases of damaged wind turbines in Ireland, the UK, and Germany. Turbines collapsed or lost blades during the strong winds, and there was one report of a lightning strike on a turbine blade in the Shetland Islands (Caithness WindFarm, 2016). One benefit of the strong wind field was that Germany registered its highest wind energy production rate (i.e., onshore plus offshore). On the other hand, the strong wind field over the North Sea exceeded the safety cut-off threshold of 25 m s−1 so that many offshore wind farms in this area were shut down for a period during the storm for safety reasons (Christakos et al., 2016). Analyzing the met-ocean data from the FINO research platforms in the North Sea and Baltic Sea, Leiding et al. (2014) note there were several periods when the measured turbulence intensity exceeded the IEC 61400-1 guidelines, and there was an implication that offshore wind turbines may have been at risk from vibrational forces. The FINO1 wind energy research platform in the German Bight north of Borkum was also damaged at 15 m above sea level (FINO1, 2014). The damage report and geophysical information (Mai, 2014; Mai et al., 2014) are not clear, but the incident was possibly caused by a rogue wave strike. The incident is similar to previous FINO1 accidents in 2006 (Neumann and Nolopp, 2006; Pleskachevsky et al., 2012), 2007 (Outzen et al., 2008), and 2009 (Fischer et al., 2010). On the basis of these types of rogue wave accident statistics, Rosenthal and Lehner (2007) have advised a reconsideration of the extreme wave height return period that is used as a design basis for North Sea infrastructure.
The storm had significant impacts on the transport networks in northern Europe, mostly due to the gust field. A number of airports reported delayed or cancelled flights, including Amsterdam, Hamburg, Bremen, and Berlin-Tegel. Copenhagen airport closed from the early evening of 5 December 2013. One passenger airliner was struck by lightning while flying from Bristol to Edinburgh and diverted to Newcastle. Rail transport networks were shut down in Scotland, Denmark, southern Sweden, and in the Schleswig-Holstein region of the northern Germany, mostly due to wind-blown objects on the rails. In eastern England, the rail network servicing Lowestoft was shut down due to storm surge flooding of the tracks. Road traffic was interrupted by a large number of bridge and tunnel closures, and by snow conditions in Germany and Sweden. Port operations were affected by flooding in Hamburg and Immingham, and the Kiel Canal was closed. A number of maritime incidents were reported in the southern North Sea and Baltic Sea (see the Methods section and Supplement for more information on this list). Rough sea state conditions were cited in most of the reports, and this is relevant to understand met-ocean loading conditions for offshore wind farms operating in the region. Single large wave impacts were not explicitly identified in the maritime reports, but in one case, two crew men were swept from the deck of a Dutch cargo ship off Ystad in southern Sweden and lost (Wikipedia, 2020a, b, c, d).
Coastal problems associated with high water levels and waves were reported across the southern North Sea, but also the Irish Sea, Kattegat, and Baltic Sea. This included quayside flooding and inundation of residential and business properties (Wadey et al., 2015). There was widespread coastal damage of the dunes and gravel structures that form most of the coastline across the southern North Sea, Denmark, and the Baltic coasts of Germany and Poland. Initial surveys indicated that coastline retreat of sand cliffs was up to 20–40 m in certain locations (Spencer et al., 2015; Brooks et al., 2016; Matelski, 2016). In eastern England and the northwest coast of Jutland in Denmark, a number of cliff-top houses fell on the beach after cliffs were eroded back by a combination of strong wave activity acting on top of extreme water levels (Eggert, 2013; Haugh, 2014). More detailed investigations indicated that there was spatial inhomogeneity in the coastal damage suggesting the importance of wave run-up effects at some locations (Spencer et al., 2014, 2015). Also, coastal cutback was not spatially homogeneous but tended to have along-shore repeating patterns on the scale of 100–1000 m (Brooks et al., 2016). It is unclear if the spatial pattern of damage indicates bathymetric focusing of wave energy, or if the coastal cutback features are due to small groups of large waves. Another case study of dune damage at Het Zwin on the south coast of the Netherlands highlighted the important impact of long-period infragravity waves during storm events (Carrión Aretxabala, 2015). The Netherlands water authority storm surge report made reference to a meteo-tsunami on the Dutch coast (RWS, 2014). Along with relevance to shifting sea bed sediments and bottom scour, the suggestion of anomalous waves has implications for the met-ocean loading characteristics of offshore wind turbines.
Water level data from tide gauges around the North Sea are analysed to trace the progress of the storm surge wave and to investigate the short period component, which may be linked with high wave events. The data originate mostly from the national water level monitoring agencies of the UK, Netherlands, Germany, Denmark, and Norway, and have been downloaded from public websites, except for the data from Germany, which were emailed by Wilfried Wiechmann of the Bundesanstalt für Gewässerkunde (BAFG). Several additional data sets were obtained from the online Global Extreme Sea Level Analysis (GESLA) data base for France and from the Intergovernmental Oceanographic Commission (IOC) webpage for several different countries around the North Sea. The data from most stations had 10 min resolution, except for the UK (15 min), France (1 h), Germany (1 min), and the stations for Belgium and Sweden on the IOC website (about 5 min). Data sets with a time discretization of the less than 10 min (i.e., 1 min or 5 min) were averaged onto a standard 10 min grid. Data sets with time discretization of 10, 15, or 60 min were used without modification. Preliminary checks were made to ensure that there were no data gaps or data irregularities across a two-week period (from the start of 26 November 2013 to the start of 10 December 2013) encompassing the storm period. The Denmark and IOC datasets had some short gaps of mostly 10–20 min duration (but up to 50 min in one instance). These were linearly interpolated so that complete data arrays were available for the spectral analysis, described below. The presence of data gaps longer than one hour eliminated several stations that might have showed interesting trends during the storm, like the Norwegian offshore platforms and the UK station at Immingham (malfunction after flooding at the port). Altogether, 77 stations were included in the analysis after this quality control, and these are shown on the map in Fig. 2 with additional information in Table S1.
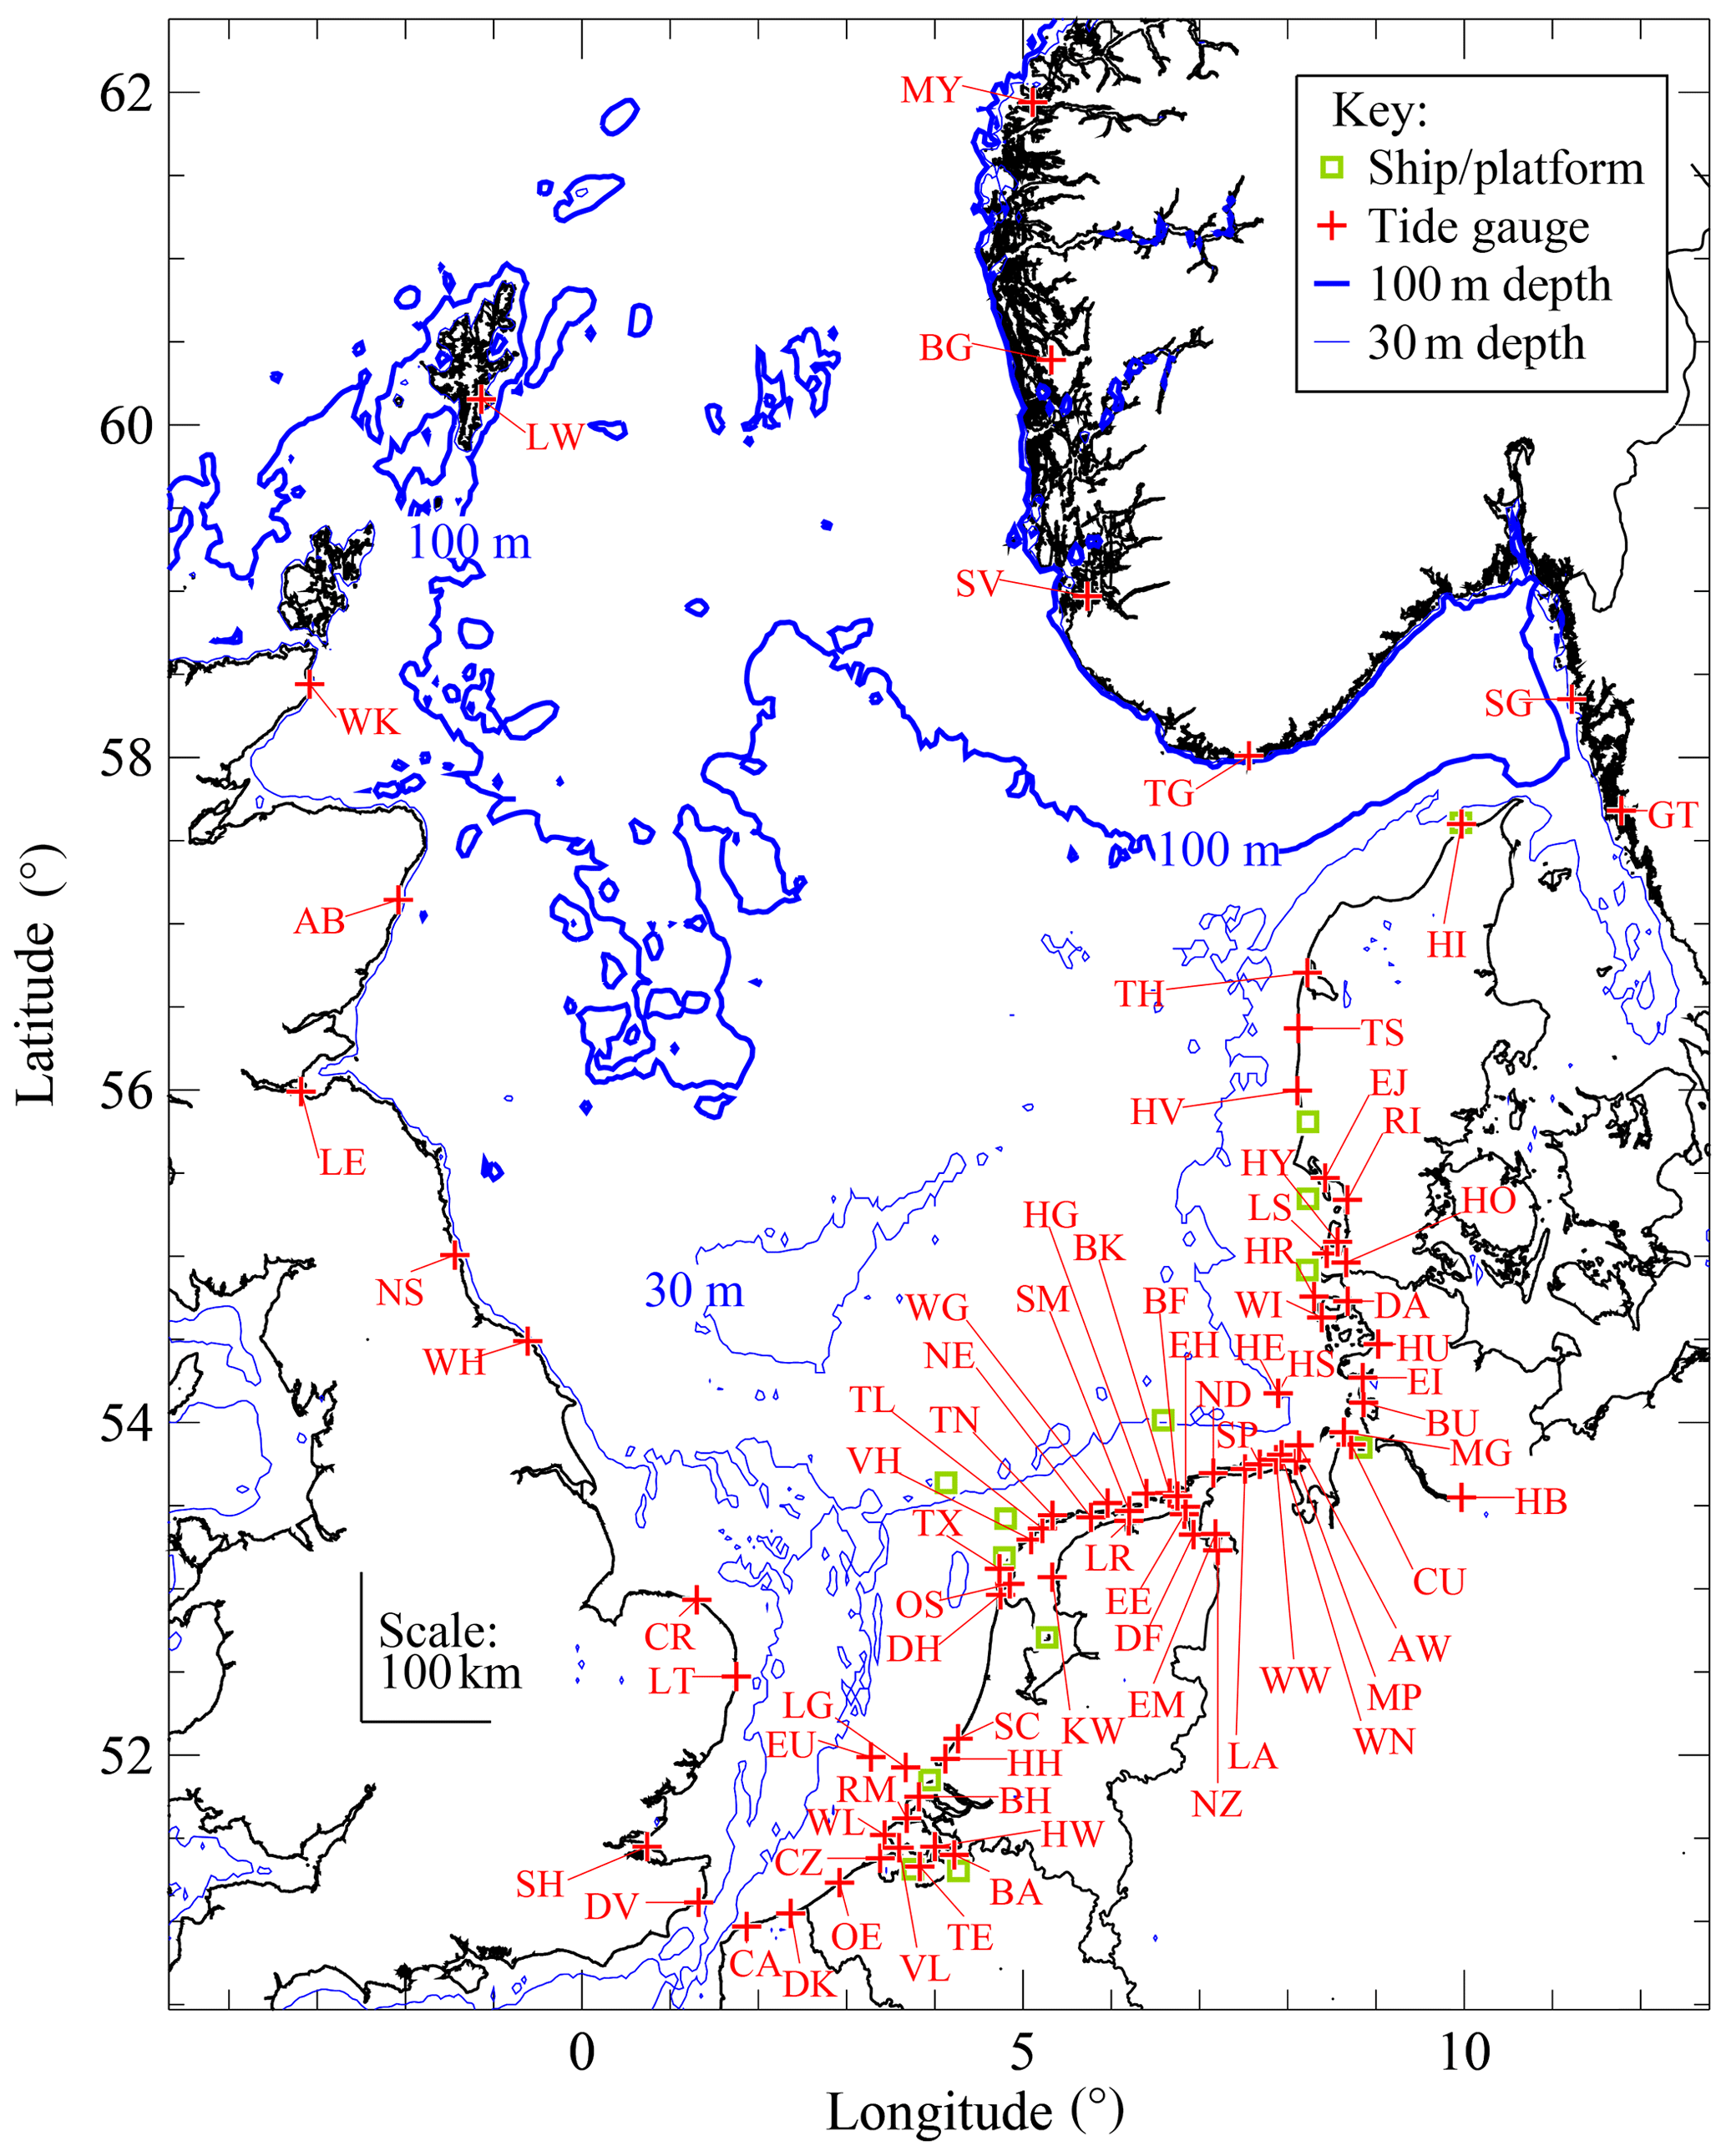
Figure 2Location of tide gauges analysed in this study and of North Sea maritime incidents that were reported over the period 5–6 December 2013.
A spectral analysis technique was used to separate the water level time series into different components corresponding to the long period (mostly storm surge), short period (mostly harbour seiche or meteo-tsunami), and tidal (diurnal plus semidiurnal, combined) contributions. The analysis follows similar tide gauge studies of Gönnert et al. (2004) and Kettle (2018, 2019). A discrete Fourier transform was used to convert the detrended time series data into a power spectrum (Stull, 1988), similar to the example for Lerwick in Fig. 3. The spectral plots were used to empirically assess the frequency thresholds for the different water level components. Figure 3 shows the narrow bands that were used to clip out the tidal component from the long-period water level reconstruction. The 0.2 d threshold was arbitrarily chosen to separate the long-period and short-period reconstructions. This choice of threshold is similar to previous studies that have aimed to isolate meteo-tsunami signals in water level data showing a strong tidal component (Monserrat et al., 2006; Pattiaratchi and Wijeratne, 2015). For many cases in this North Sea storm analysis, the short period reconstructions showed evidence of large oscillations or noise at certain times with some spatial coherence among stations.
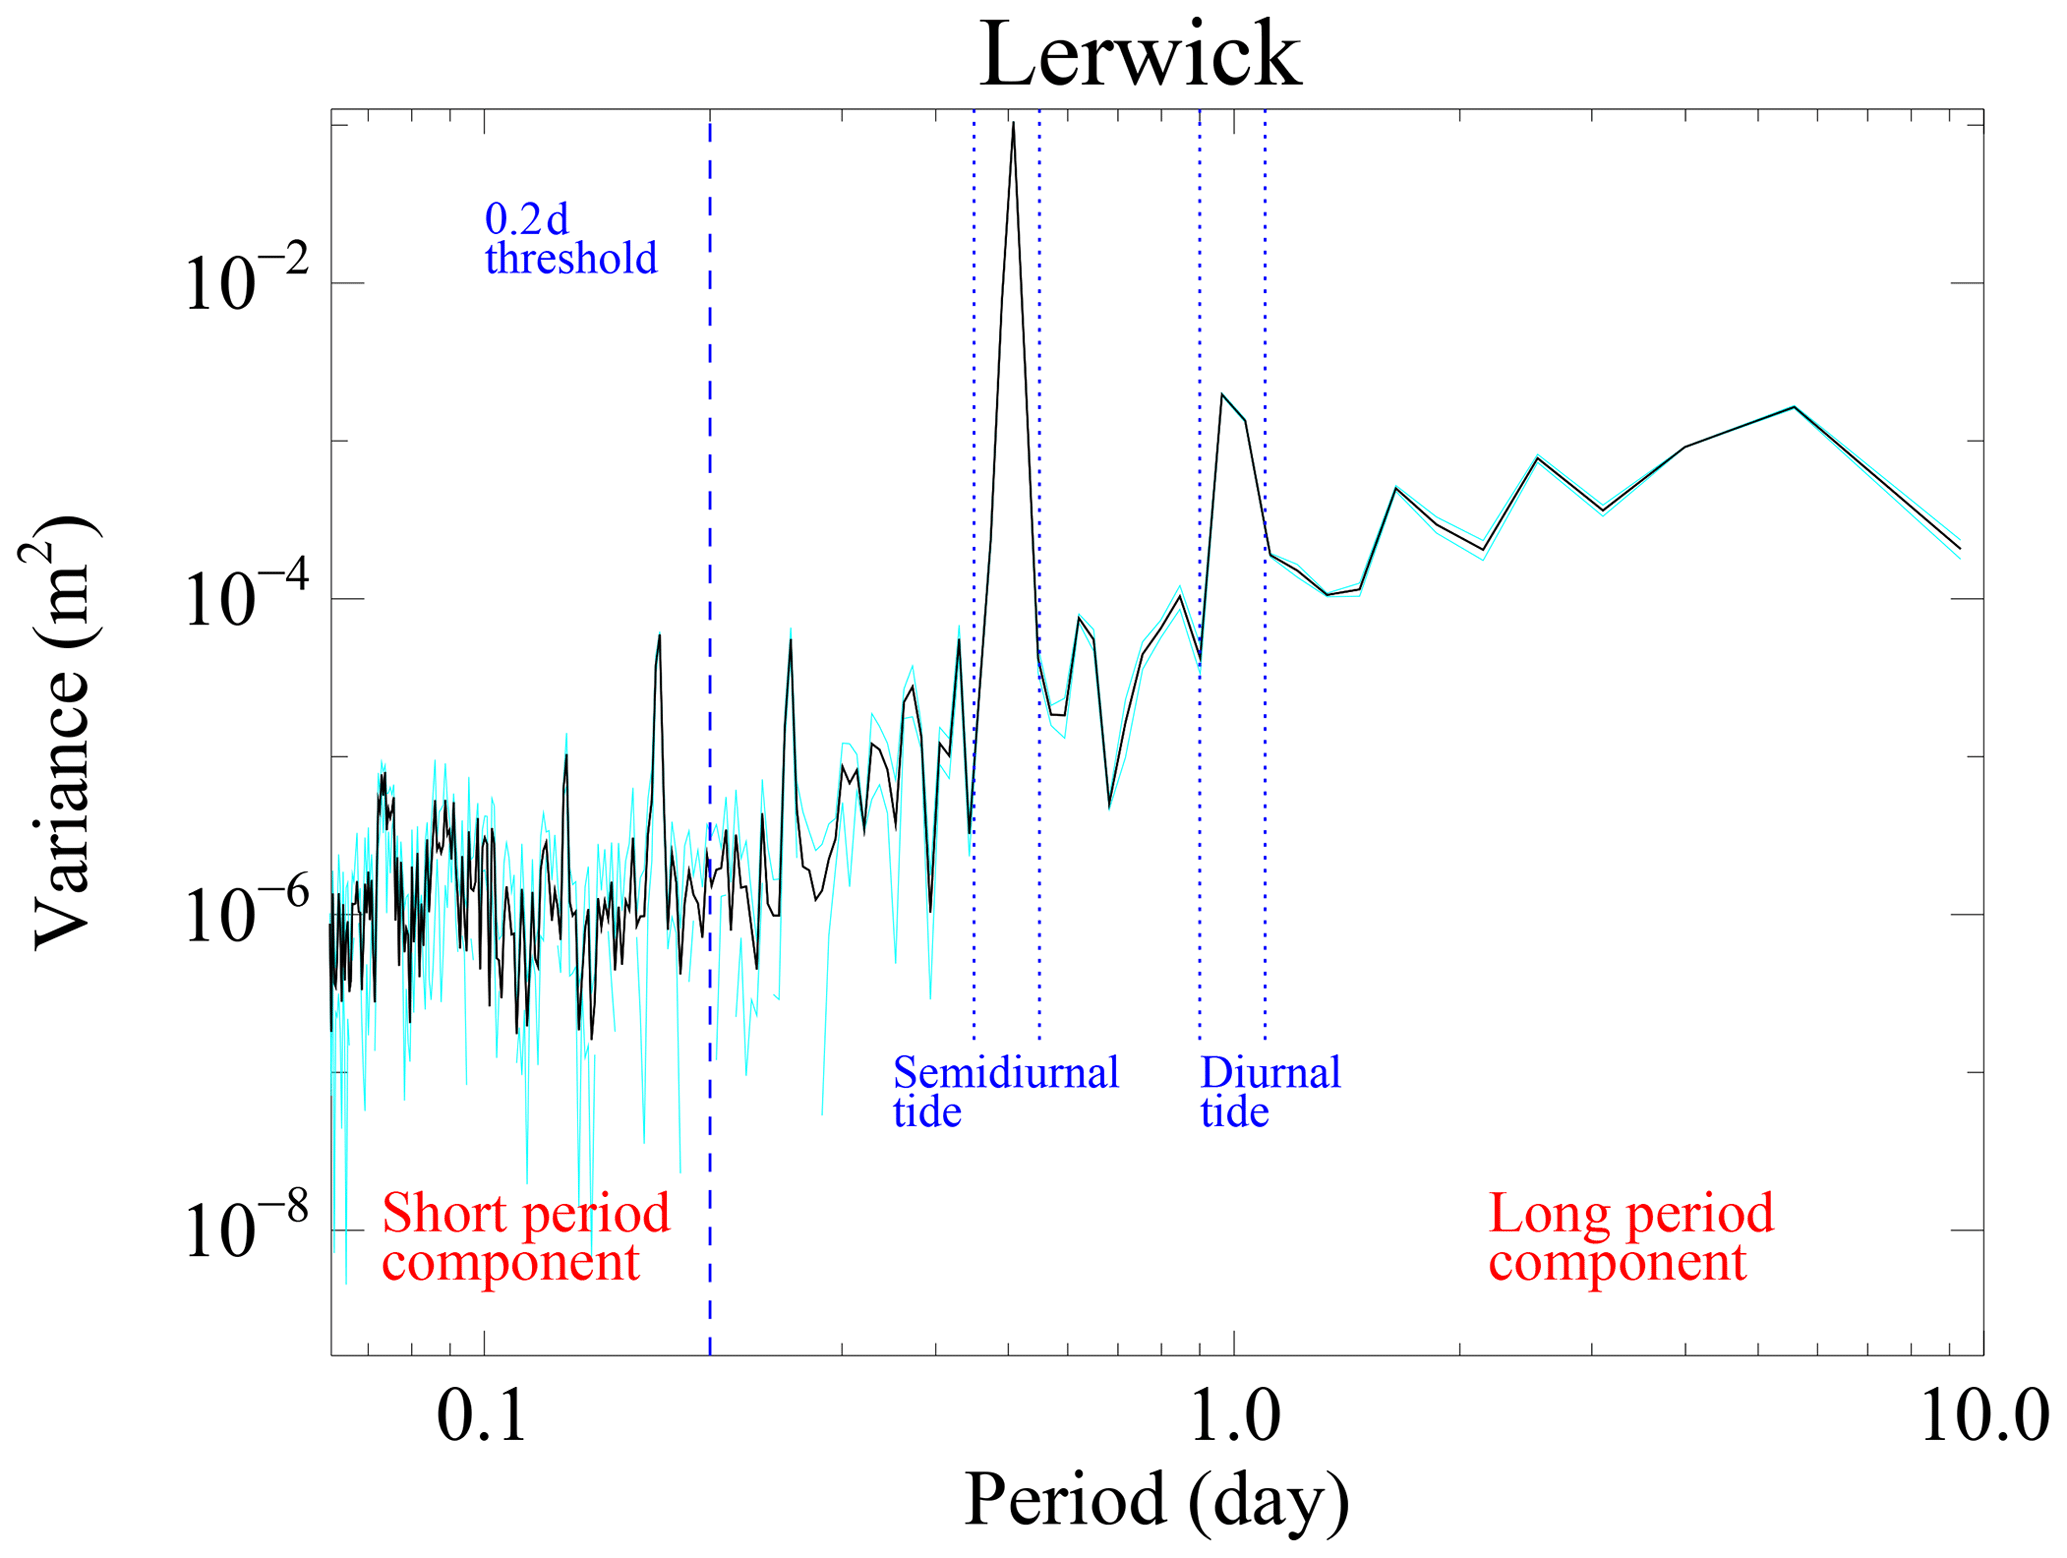
Figure 3Sample spectrum of a 14 d time series of water level for Lerwick. The 0.2 d threshold separating the short period and long period components of the time series reconstructions is shown, as well as the thresholds defining the diurnal and semidiurnal components that were used to de-tide the time series. The uncertainty in the spectrum (light blue line) is calculated as the standard deviation of three spectra derived from re-sampling the time series at every third point.
A short database of maritime incidents was compiled to compare with the largest events in the short period reconstruction of the water level time series (i.e., with characteristic periods <0.2 d). These were gathered by email contact with search and rescue centres in the Netherlands and Germany, and supplemented with media reports and an online blog website. Some wave buoy measurement records from Germany and Denmark also showed evidence of unusually high waves at certain times, and these were also included in the event list. Altogether, 20 offshore incidents and wave events were identified in the North Sea. The location of these is shown in Fig. 2 with additional information in Table S2 and Fig. S6 of the Supplement.
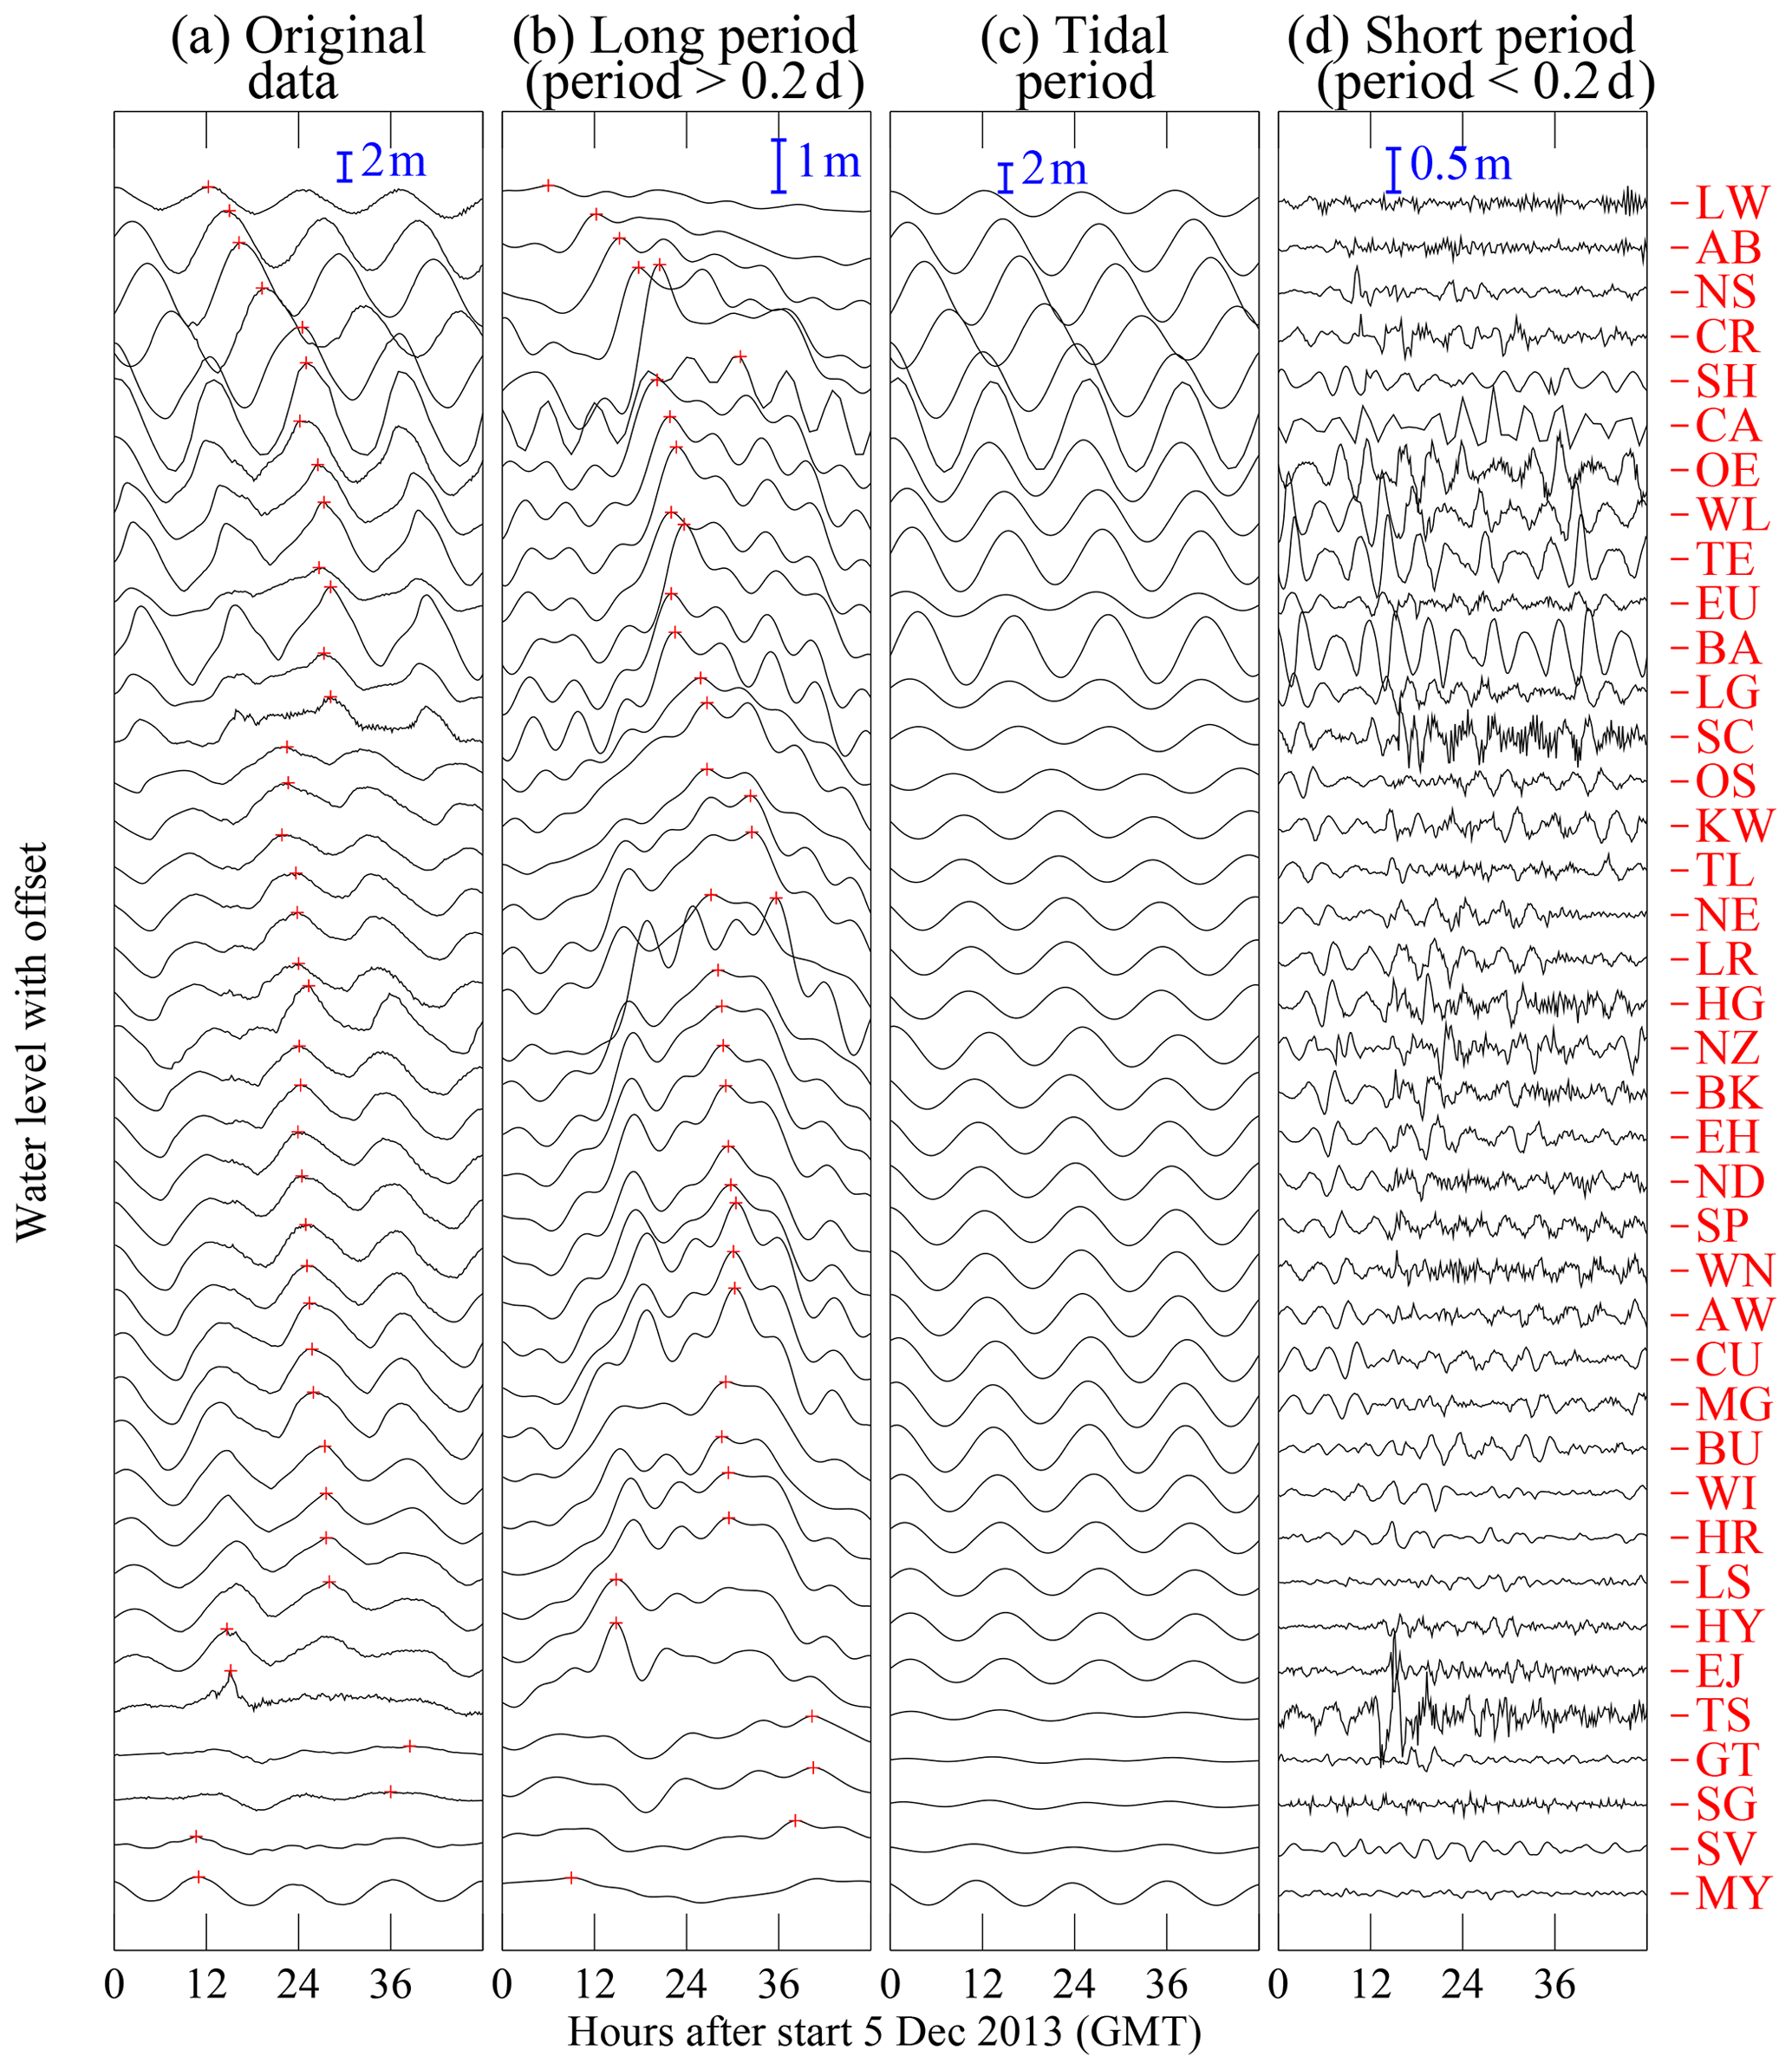
Figure 4Time series of the (a) original water level data, and reconstructions of the (b) long period, (c) diurnal plus semi-diurnal tide, and (d) short period components of the original time series. For presentation clarity, the panels show a subset of half of the number of stations that were analysed. The station identifications are given by two letter codes along right hand side of the last panel, and the stations have been vertically offset according to counter-clockwise location around the North Sea starting from Lerwick in Scotland at the top and ending with Maløy on the Norwegian coast at the bottom.
The results of the water level analysis are shown in Fig. 4 for half of the tide gauge stations used in the analysis. (See Fig. S7 for a similar panel diagram with all of the stations). The time series are arranged in order of counter-clockwise placement around the North Sea starting from Lerwick in Scotland with vertical offsets for presentation clarity. The first panel (Fig. 4a) shows the original time series with the maximum water levels shown by red plus symbols. The long period component of the time series is shown in the second panel (Fig. 4b), also with the maximum levels shown by red plus symbols. The tidal component is shown in Fig. 4c. The semi-diurnal tide is prominent in most stations with its peak about every 12 h. A comparison of this tidal reconstruction with the BODC tidal model data (calculated as the difference between the measured water level and the surge residual that was supplied with the BODC data sets) revealed a median root mean square difference of about 0.11 m for the collection of UK stations.
The short period component of the water level measurements is shown in Fig. 4d. Many stations show oscillation characteristics although the zero crossing periods vary, and for some stations the period is so short that the time series resembles noise. Several stations on the northwest coast of Denmark showed a sudden onset of the oscillations, as if the seiche ringing is caused by a single forcing event. For each station, a statistical analysis of the oscillations was conducted following the conventions used for high resolution recordings of wind waves. The sequence of oscillations was separated according to the zero-crossing times and assessment was made of the zero-crossing wave period, minimum/maximum amplitude, and oscillation range. The maximum oscillation range was identified, and the stations were ranked according to this maximum value. The maximum range was about 97 cm for Thorsminde (Havn) in Denmark on the late afternoon of 5 December 2013, and five other stations had maximum ranges greater than 50 cm during the 2 d storm period (Table S3 of the Supplement gives a complete list of maximum oscillations). Care must be taken in comparing stations around the North Sea as the data discretization conventions differ among countries, and the one hour discretization of the two French stations would not show sudden onset of short period events like the other stations. Even though the oscillation ranges are smaller than for the tidal or long period components of the tide gauge signal, they are important for understanding the coastal flooding that was reported. At many locations, water levels were at the design thresholds of the flood defences, so that additional perturbations introduced by short period heaving motions might have been enough to trigger the failures that were starting to occur.
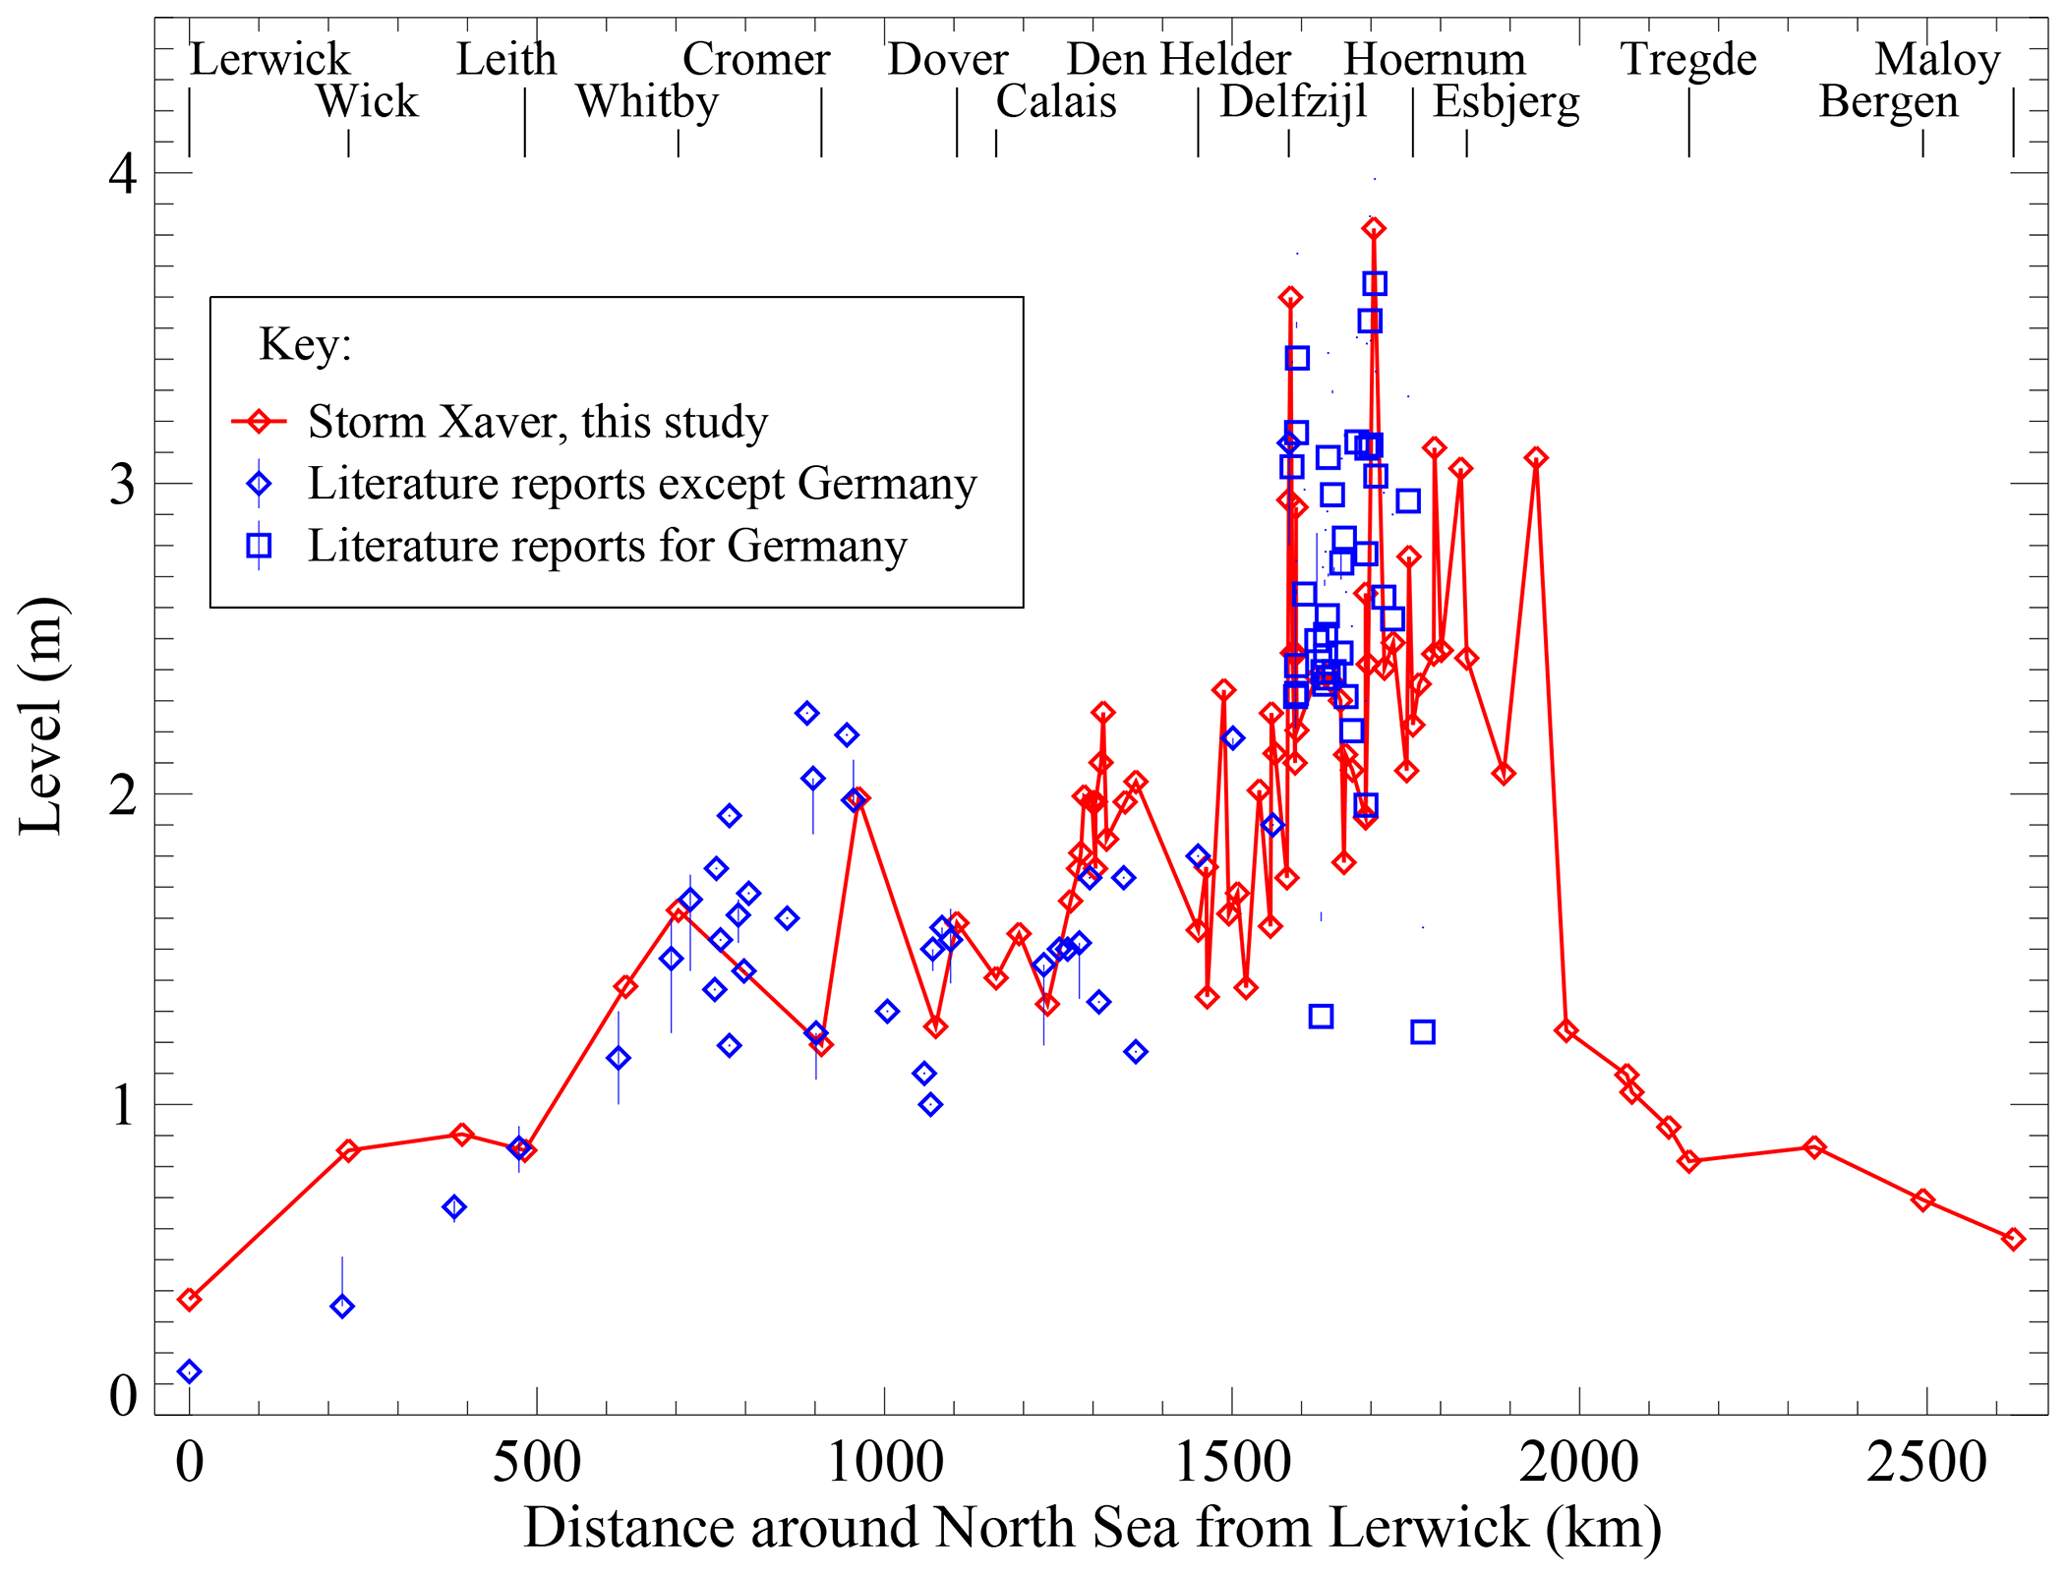
Figure 5Skew surge during Storm Xaver on 5–6 December 2013. The values are calculated from tide gauge records and arranged by counter-clockwise distance around the North Sea starting from Lerwick. Literature reports are included for comparison.
The highest skew surge for the tide gauge stations around the North Sea is shown in Fig. 5 for the results of the present analysis and literature reports. Skew surge is the most common way that storm water levels are presented in the media, and it denotes the difference between the maximum measured water level and model predictions of the expected high tide. The plot was derived from the time series information presented in Fig. 4. Consideration had to be taken into account that ambient sea level was offset high across the 14 d period of the spectral analysis compared to the long-term mean. A correction was applied to the German skew surge reports to overcome a bias that resulted from the country convention to present the skew surge concept as the difference between the maximum measured water level during the storm and the long term mean of high tide levels. Because Storm Xaver took place during a spring tide, the German literature reports are biased high unless consideration is taken into account of the difference between the spring tide and the long term average high tide. After this correction, there is mostly good agreement between the literature reports and the results of the present analysis. There are large differences in the skew surge values around the North Sea, with stations in the German Bight and northern Netherlands approaching 4 m in some instances. This partially due to the strong northwest winds that pushed water into the southern areas of the North Sea. As well, the propagating surge pulse has similar physical characteristics as the semidiurnal tide, and the trends in surge heights would have been comparable to the different tidal ranges around the North Sea (Pugh, 1987). The reported coastal flooding in eastern England occurred at water levels 1 to 2.2 m above the expected spring tide, but the coastal damage in Germany and flooding in Hamburg occurred at water levels about 3 m above the expected spring tide. The second feature of Fig. 5 that was not highlighted in the media reports was the large differences in skew surge levels between near-lying tide gauge stations along the coast, especially in the German Bight. The absolute water levels relative to mean sea level are shown in Fig. S8, and this figure shows the main features of the skew surge. However, Fig. S8 also shows the results of intensive beach surveys that were carried out in Lincolnshire, Norfolk, and Suffolk soon after the storm (Spencer et al., 2014, 2015). The maximum water levels measured during these surveys were up to 2 m higher than levels registered at nearby tide gauge stations. Most tide gauge data are low-pass filtered to remove waves and seiches with periods less than about 10 min. The UK beach survey results point to wave run-up and other dynamical effects, and Dreier and Fröhle (2018) found comparable wave run-up features in the German Bight. The original tide gauge data for Germany, which were recorded at one minute intervals, may give an indication of shorter period dynamical features that may be masked by longer sampling intervals of normal tide gauge records. Figures S9 and S10 show that the range of water levels over 10 min intervals reached almost 0.4 m for some cases in the German Bight.
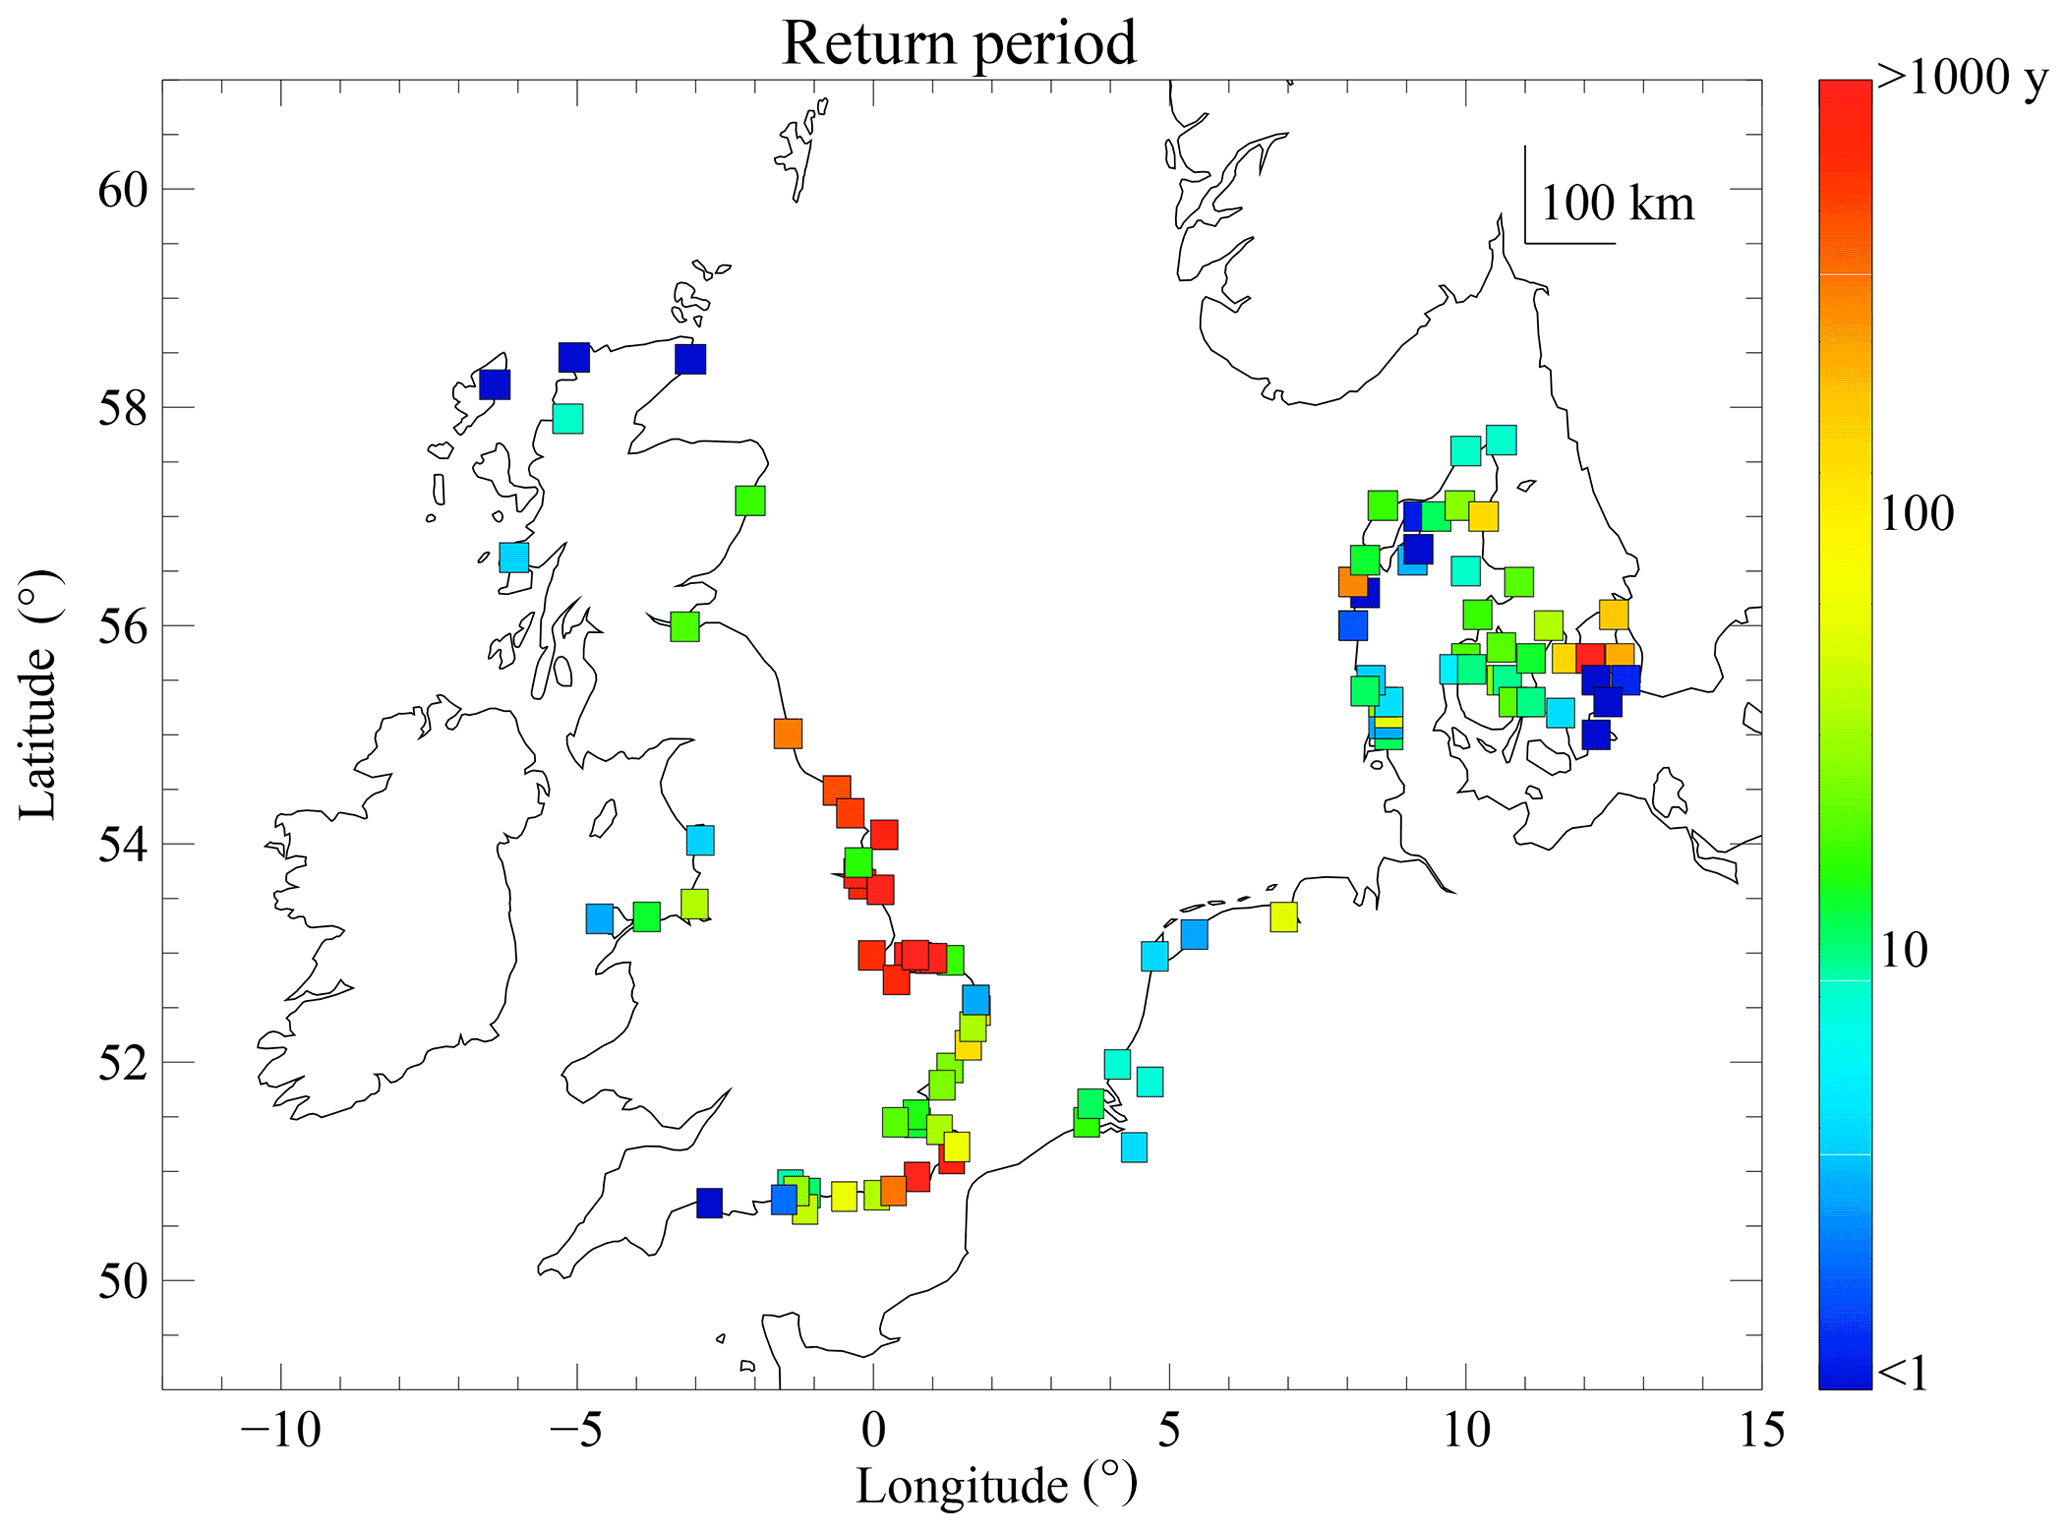
Figure 6Map of literature reports of the return period (in years) of the maximum water level during Storm Xaver on 5–6 December 2013. The values are based on statistical analysis of measured extreme storm surge water levels from station records that extend back to the 19th century in some cases. Table S4 presents the data used to construct this figure and a reference list of the source information.
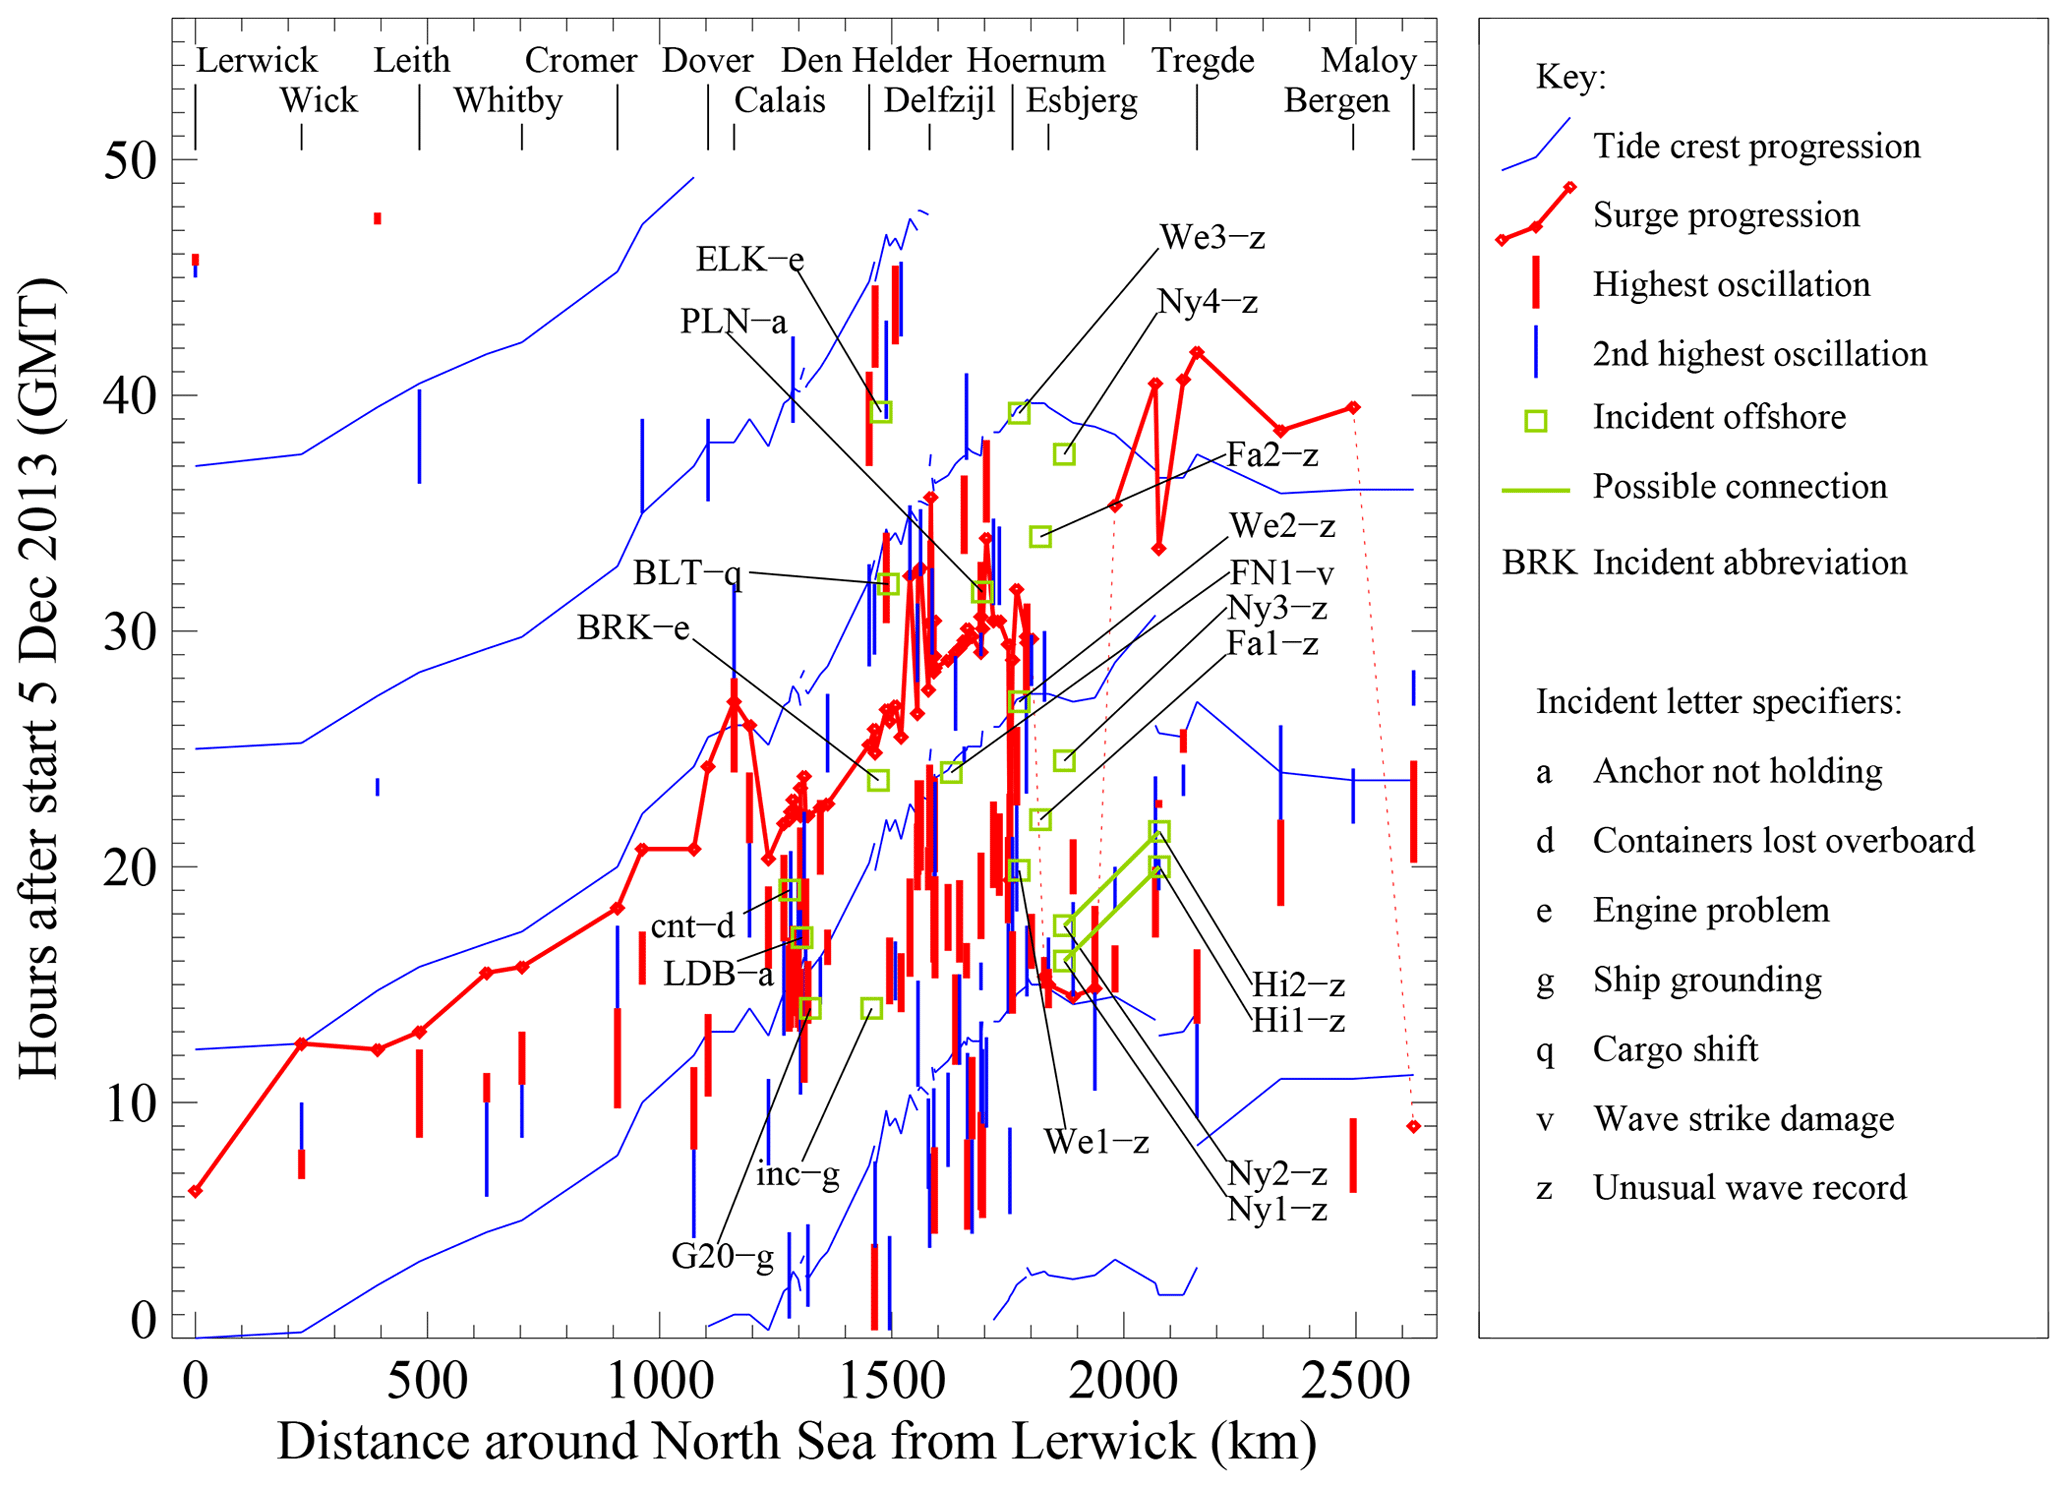
Figure 7Summary of the progression of the tidal crests and storm surge peak around the North Sea on 5–6 December 2013, and spatial-temporal relationship of the highest short period oscillations in the tide gauge record and maritime incidents/accidents. The data are plotted on axes of time versus counter-clockwise distance around the North Sea starting from Lerwick. (These data are separated and plotted as simplified diagrams in Figs. S11 and S12.)
The significance of the water levels shown in Fig. 5 are placed in a historical context by expressing absolute water levels in terms of their return period of recurrence. This requires a data base of past storm surges or at least a report of the last time that a given water level was exceeded. For cases where there is no precedent of an extreme measured water level within the measurement record, statistical extrapolation techniques are used to derive a return period. The return periods of water level for Storm Xaver are shown in Fig. 6. This map has been constructed mostly from the information in Ditlevsen et al. (2018), RWS (2014), and Wadey et al. (2015), and additional information about the data is given in Table S4. For some stations in the UK and Denmark, water levels during Storm Xaver exceeded the level of a 1000-year event with no higher flood level in the measurement record (Wadey et al., 2015; Ditlevsen et al., 2018). To place the Storm Xaver surge event in context, the Thames Barrier is designed to withstand a 1000 year event (Horner, 1979). For most of the Netherlands, coastal defenses are constructed to a 10 000 year standard (de Jong, 2012; Gautier et al., 2014). Coastal defence structures in the UK and Denmark are otherwise designed to a 100 year return period standard (Gönnert et al., 2012, p. 123), and the reports of dike failures and defence overtopping – especially from the UK – were not unexpected.
Figure 7 shows the crests of the tidal wave and storm surge plotted on axes of time versus counter-clockwise distance around the North Sea. Because these long waves travel as coastally-trapped Kelvin waves counter-clockwise around the North Sea, the presentation format permits easy viewing of the progress of water levels between the stations. It also allows the time relationships between the different water level components to be compared. This diagnostic quantity was highlighted by Pugh (1987) to illustrate the relative timing of the surge and tide peaks. For Storm Xaver, Fig. 7 indicates that the storm surge peak was associated with three different tidal maxima during its movement around the North Sea. Along the east coast of the UK, the storm surge maximum came shortly before the high tide. Along coasts of the Netherlands and Germany, the surge accelerated to the point where its crest occurred between two successive tidal maxima. Along the west coast of Denmark, it appears to have taken an anomalous jump to the early afternoon of the previous day (5 December 2013). This corresponds to the surge maximum on the east coast of Scotland about the same time, and is due to the direct action of the wind field rather than the travelling external storm surge. Niehüser et al. (2018) point out that there were two peaks in the surge residual along the German North Sea coast due to the effects of the external surge and wind setup acting independently. Not all North Sea storm surges exhibit large phase jumps along the Danish west coast, but Storm Britta on 31 October–1 November 2006 (Kettle, 2018) was similar to Storm Xaver. By contrast, the surge for Storm Tilo on 8–9 November 2007 (Kettle, 2019) and the 1949 surge reviewed by Pugh (1987) were mainly associated with one semidiurnal tide peak.
The timing of the extreme short period oscillations and maritime incidents/accidents are plotted on same axes of time versus counter-clockwise coastal distance around the North Sea also in Fig. 7. The figure shows the timing of the highest and second highest short period up-crossing oscillation for each of the 77 stations around the North Sea. Along the east coast of the UK, the highest oscillation occurred in association with the surge peak, preceding it by 4–6 h. For the North Sea coasts of the Netherlands and Germany, the situation is more complicated as extreme oscillations are found across the entire two-day storm period from the large collection of stations included in the analysis. Along the coasts of Norway and Denmark, the oscillation extremes occur mainly during the afternoon and evening of 5 December 2013, one complete tidal cycle before external surge progressed through. Most of the reported shipping accidents took place along a short segment of the North Sea coast of the Netherlands and Germany, while the large wave events were recorded in the northern German Bight and west coast of Denmark. They were spread out over a period longer than 24 h across the storm period. In many instances, the waves occurred in association with the highest oscillations from the short period tidal reconstructions. The arrangement of the sparse wave features appears to suggest that some large wave events may have been travelling northward along the Danish west coast in association with the moving surge.
Storm Xaver was a serious storm that impacted societal and energy infrastructure in northern Europe. In the aftermath of the storm, there were scientific studies to assess the damage and ramifications of the event. The actual damage during Storm Xaver was small compared with historic events. Gust damage was mostly limited to minor roof damage and tree falls. In certain places, the coastal surge levels of Storm Xaver had exceeded the defining southern North Sea storm surge of 31 January–1 February 1953. However, the coastal flooding impacts for Storm Xaver were much less than the earlier event, and the number of fatalities and interruptions of transport networks and energy production/transmission systems were also much less. This was ascribed to improvements in coastal defences that had been carried out in the wake of the serious North Sea storm surges of the second half 20th century (RMS, 2014; Wadey et al., 2015). Also, there had been large improvements of surge forecasting (Hewson et al., 2014), along with improved communications and civil protection measures so that vulnerable areas could be evacuated ahead of the surge event (North Norfolk District Council Coastal Team, 2019). A closer examination of the water level records highlights the large coastal water levels and gives some indication of the importance of dynamical wave and coastal run-up effects on different temporal and spatial scales. The largest surge levels occurred in the southern North Sea along the coasts of the Netherlands and Germany. However, the high water levels in eastern England were important because they had not been encountered in the past century. The short period component of the water level reconstructions showed a geographic clustering of stations with enhanced noise/oscillation features with peak-to-trough ranges that exceeded 0.5 m in several instances. For Thorsminde in northern Denmark, the peak-to-trough range of the oscillations approached one meter, and offshore measurement buoys registered large waves at about the same time. The storm damage to the FINO1 platform emphasized the importance of large waves on offshore wind energy infrastructure that had previously been highlighted during Storm Britta in 2006 (Pleskachevsky et al., 2012).
In the aftermath of the storm, there were efforts to repair the immediate damage and also prevent the recurrence of the dangers of this type of event. For example, Boston in Lincolnshire was badly affected by surge flooding, and a new surge barrier was constructed that gives protection levels that are comparable to the Thames Barrier (BAM, 2019). An important part of the economics of this type of engineering solution is understanding the return period of the flooding event. For the scientists and engineers concerned with coastal defences, Storm Xaver had been identified as a game-changer, in terms of significantly changing the return period water level statistics that are used for engineering design (Dangendorf et al., 2016). The water level return period issue even entered the UK political arena with a parliamentary member on record stating: “There is a strong sense in (eastern England) that Parliament has not considered properly this narrowly averted national crisis. It is wrong to dismiss these floods as a once in 500 year occurrence. There were floods six years ago (Lowestoft Journal, 2014)”. Questions were also raised about the worst case surge flood that might hit the North Sea coasts – the so-called Black Swan event that no one has ever seen before – and model studies suggest that this might be >1 m higher than any event in the measurement record (Ulm et al., 2018).
Storm Xaver was the first of a series of storm systems to impact north western Europe during the unusually stormy winter of 2013–2014. The trajectory of the storms across the North Atlantic was linked to the fixed position of the Jet Stream and in turn associated with a cold air mass over North America and anomalous precipitation patterns in the tropical Pacific Ocean (Slingo et al., 2014). The antecedent conditions for Storm Xaver were different from the serious North Sea surge of 31 October–1 November 2006, when there had been record-breaking high temperatures during the preceding summer and autumn in Europe (Nielsen, 2007; Rosenorn, 2007). A review of the sequence of winter storm events in the UK for 2013–2014 concluded that these could not be unambiguously ascribed to climate change (Slingo et al., 2014). On the other hand, the static Jet Stream configuration during the winter was unusual. It invoked concern of a potential climate change tipping point (Lenton et al., 2008) associated with a re-ordering of the atmospheric circulation that could lead to northwest Europe routinely experiencing stormy winters (Slingo, 2019).
The water level data for this study was measured by the national tide gauge networks of the UK, France, Belgium, the Netherlands, Germany, Denmark, Sweden, and Norway. The data were downloaded from publicly accessible websites maintained by the national authorities, except for France (datasets obtained through the GESLA online archive), Germany (datasets sent by Wilfried Wiechmann of the Federal Institute of Hydrology in Germany), and a few miscellaneous datasets for different countries (data sets obtained through the IOC online archive). Further information on the URL internet addresses is given in Table S1 of the Supplement.
The supplement related to this article is available online at: https://doi.org/10.5194/adgeo-54-137-2020-supplement.
The author declares that there is no conflict of interest.
This article is part of the special issue “European Geosciences Union General Assembly 2020, EGU Division Energy, Resources & Environment (ERE)”. It is a result of the EGU General Assembly 2020, 4–8 May 2020.
The author gratefully acknowledges data from national tide gauge networks of the UK, Netherlands, Germany, Denmark, and Norway, and also the GESLA and IOC archives for other stations in the North Sea area. The tide gauge data for the UK, France, Netherlands, Denmark, and Norway were downloaded from Internet servers. For Germany, Wilfried Wiechmann of the Bundesanstalt für Gewässerkunde (BAFG) kindly provided tide gauge data by email. Antke Reemts of Die Seenotretter (German Maritime Search and Rescue Service) and Edwin Granneman of Kustwacht (Netherlands coastguard) provided information on many of the offshore incidents during Storm Xaver. Gerda van Vliet provided additional information on rescues by the Koninklijke Nederlandse Redding Maatschappij (KNMI, the Dutch lifeboat service) along the Netherlands coast. A number of people (see Supplement) were contacted and provided information about the storm. Meteorological station data were obtained from the National Climate Data Center (NCDC) website. The author appreciated online chat interactions with the session conveners and conference participants during EGU2020 ERE Energy Meteorology session. The insightful comments of two anonymous referees (see Sect. IV of the Supplement) were appreciated to improve the manuscript.
This paper was edited by Christopher Juhlin and reviewed by two anonymous referees.
4Coffshore: Samsø turbine collapse, available at: https://www.4coffshore.com/news/sams%C3%B8-turbine-collapse-nid2932.html, 3 December 2015.
BAM: Safe arrival of Boston Barrier for tidal flood alleviation scheme, 15 November 2019, BAM Nuttall Ltd, available at: https://www.bam.com/en/press/press-releases/2019/11/safe-arrival-of-boston-barrier-for-tidal-flood-alleviation-scheme (last access: 9 October 2020), 2019.
Brooks, S. M., Spencer, T., McIvor, A., and Möller, I.: Reconstructing and understanding the impacts of storms and surges, southern North Sea, Earth Surf. Proc. Land., 41, 855–864, https://doi.org/10.1002/esp.3905, 2016.
Buchana, P. and McSharry, P. R.: Windstorm risk assessment for offshore wind farms in the North Sea, Wind Energy, 22, 1219–1229, https://doi.org/10.1002/we.2351, 2019.
Caithness Windfarm: craigdr, Detailed accidents to 31 December 2015, 175 pp., available at: http://www.caithnesswindfarms.co.uk/AccidentStatistics.htm (last access: 9 October 2020), document time stamp 5 January 2016.
Carrión Aretxabala, B. I.: Morphological impact of the Sinterklaas storm at Het Zwin. Numerical modelling with Xbeach, M.Sc. Civil Engineering, Delft University of Technology, 75 pp., 2015.
Chen, X. and Xu, J. Z.: Structural failure analysis of wind turbines impacted by super typhoon Usagi, Eng. Fail. Anal., 60, 391–404, https://doi.org/10.1016/j.engfailanal.2015.11.028, 2016.
Christakos, K., Cheliotis, I., Varlas, G., and Steeneveld, G.-J.: Offshore wind energy analysis of Cyclone Xaver over North Europe, 13th Deep Sea Offshore Wind R&D Conference, EERA DeepWind'2016, 20–22 January 2016, Trondheim, Norway, Energy Proced., 94, 37–44, https://doi.org/10.1016/j.egypro.2016.09.187, 2016.
Cruz, A. M. and Krausmann, E.: Damage to offshore oil and gas facilities following hurricanes Katrina and Rita: An overview, J. Loss Prevent. Proc., 21, 620–626, https://doi.org/10.1016/j.jlp.2008.04.008, 2008.
Dangendorf, S., Arns, A., Pinto, J. G., Ludwig, P., and Jensen, J.: The exceptional influence of storm 'Xaver' on design water levels in the German Bight, Environ. Res. Lett., 11, 054001, https://doi.org/10.1088/1748-9326/11/5/054001, 2016.
de Jong, M. S.: Developing a parametric model for storm to determine the extreme surge level at the Dutch coast, M.Sc., Delft University of Technology, June, 109 pp., 2012.
Diamond, K. E.: Extreme weather impacts on offshore wind turbines: Lessons learned, American Bar Association Section of Environment, Nat. Resour. Environ., 27, 39–41, 2012.
Ditlevsen, C., Ramos, M. M., Sorensen, C., Ciocan, U. R., and Pionkowitz, T.: Hojvandsstatistikker 2017, Miljo- og Foedevaremnisteriet, Kystdirektoratet, Lemvig, Februar, 86 pp., 2018.
Dreier, N. and Fröhle, P.: Operational wave forecast in the German Bight as part of a sensor- and risk based early warning system, in: Proceedings from the International Coastal Symposium (ICS) 2018 (Busan, Republic of Korea), edited by: Shim, J.-S., Chun, I., and Lim, H.S., J. Coast. Res., Special Issue No. 85, 1161–1165, 2018.
Eggert, M.: Offer for Bodil: Koebte huset 15 August – nu er det vaek, BT, available at: https://www.bt.dk/danmark/offer-for-bodil-koebte-huset-15.-august-nu-er-det-vaek (last access: 13 October 2020), 2013.
Fenoglio-Marc, L., Scharroo, R., Annuziato, A., Mendoza, L., Becker, M., and Lillibridge, J.: Cyclone Xaver seen by geodetic observations, Geophys. Res. Lett., 42, 9925–9932, https://doi.org/10.1002/2015GL065989, 2015.
Fischer, J., Herklotz, K., Senet, C., Outzen, O., and Hahn, R.: Oceanographic observations at FINO1 and the “Alpha Ventus” offshore wind farm, 10th German wind energy conference, DEWEK 2010, Bremen, 2010.
FINO1: 15-m wave damaged FINO1, report date stamp 08 January 2014, available at: http://www.fino1.de/de/aktuelles/meldung/15-meter-welle-beschaedigt-fino1.html, last access: 13 October 2020.
Gautier, C., Camarena, A., and van Nieuwkoop, J.: SWAN hindcasts Wadden Sea, December 2013. Tidal inlet of Ameland and eastern Wadden Sea, Deltares, 197 pp., Project 1209433-007, Reference 1209433-007-HYE-0005, 2014.
Gönnert, G., Isert, K., Giese, H., and Plüss, A.: Charakterisierung der Tidekurve, Die Küste, 68, 99–141, 2004.
Gönnert, G., Gerkensmeier, B., and Mueller, J. M.: Ermittlung des Sturmflutbemessungswasserstandes für den öffentlichen Hochwasserschutz in Hamburg, Berichte des Landesbetriebes Strassen, Brücken und Gewässer, No. 12, 2012.
Haugh, R.: East coast surge: What happened next?, BBC, 5 December 2014.
Hewson. T., Magnusson, L., Breivik, O., Prates, F., Tsonevsky, I., and de Vries, H. J. W.: Windstorms in northwest Europe in late 2013, ECMWF Newsletter, No. 139, Spring, 22–28, 2014.
Horner, R. W.: The Thames Barrier Project, Geogr. J., 145, 242–253, 1979.
Ishihara, T., Tamaguchi, A., Takahara, K., Mekaru, T., and Matsuura, S.: An analysis of damaged wind turbines by Typhoon Maemi in 2003, The sixth Asia-Pacific Conference on Wind Engineering (APCWE-VI), Seoul, Korea, 12–14 September, 2005.
Kettle, A. J.: The North Sea surge of 31 October–1 November 2006 during Storm Britta, Adv. Geosci., 45, 273–279, https://doi.org/10.5194/adgeo-45-273-2018, 2018.
Kettle, A. J.: Storm Tilo over Europe in November 2007: storm surge and impacts on societal and energy infrastructure, Adv. Geosci., 499, 187–196, https://doi.org/10.5194/adgeo-49-187-2019, 2019.
Leiding, T., Tinz, B., Rosenhagen, G., Lefevre, C., Haeseler, S., Hagemann, S., Bastigkeit, I., Stein, D., Schwenk, P., Mueller, S., Outzen, O., Herklotz, K., Kinder, F., and Neumann, T.: Meteorological and Oceanographic Conditions at the FINO platforms during the severe storms Christian and Xaver, DEWI Magazin, No. 44, 16–25, 2014.
Lenton, T. M., Held, H., Kiegler, E., Hall, J. W., Lucht, W., Rahmstorf, S., and Schellnhuber, H. J.: Tipping elements in the Earth's climate system, P. Natl. Acad. Sci., 105, 1786–1793, 2008.
Li, Z.-Q., Chen, S.-J., Ma, H., and Feng, T.: Design defect of wind turbine operating in typhoon activity zone, Eng. Fail. Anal., 27, 165–172, https://doi.org/10.1016/j.engfailanal.2012.08.013, 2013.
Lowestoft Journal: Suffolk MP hits out at environment secretary in statement about the floods, (correspondent: Annabelle Dickson), available at: https://www.lowestoftjournal.co.uk/news/, 14 December 2013.
Mai, S.: Sea state at the research platform FINO1 during the winter storm “Xaver”, BFG, Bundesamt für Gewasserkunde, pdf document date stamp 16 May 2014.
Mai, S., Wilhelmi, J., Zenz, T., and Barjenbruch, U.: Orkan “Xaver” – Seegangsstatistik an den Stationen FINO1 und Borkum-Südstrand, 19. KFKI-Seminar, Bremerhaven 11 November 2014 (presentation slides), pdf document date stamp 17 November 2014.
Matelski, B.: Erfahrungen aus der Sturmflut Xaver von 5. und 6 December 2013 und dem Weihnachshochwasser 2014 in Schleswig-Holstein, in: IWASA 2016 Tagungsbeitrag, (46. IWASA, 7–8 Januar 2016; Internationales Wasserbau-Symposium Aachen), 2013.
Monserrat, S., Vilibić, I., and Rabinovich, A. B.: Meteotsunamis: atmospherically induced destructive ocean waves in the tsunami frequency band, Nat. Hazards Earth Syst. Sci., 6, 1035–1051, https://doi.org/10.5194/nhess-6-1035-2006, 2006.
Neumann, T. and Nolopp, K.: Three years operation of far offshore measurements at FINO1, DEWI Magasin, 30, 42–46, 2007.
Niehüser S., Dangendorf, S., Arns, A., and Jensen, J.: A high resolution storm surge forecast for the German Bight, in: Proceedings of the 9th Chinese-German Joint Symposium on Coastal and Ocean Engineering, Tainan, Taiwan, 2018.
Nielsen, N. W.: Om stormflod og eftersårsvejr i Danmark anno 2006, Vejret, 110, 24–33, 2007.
North Norfolk District Council Coastal Team: Sheringham Sea Defences; Repair and Recovery from the December 2013 storm surge, available at: https://www.northnorfolk.org/coastal, photo taken of information plaque on wall in Sheringham UK, 30 December 2019.
Outzen, O., Herklotz, K., Heinrich, H., and Lefebvre, C.: Extreme waves at FINO1 research platform caused by storm “Tilo” on 9 November 2007, DEWI Magazin No. 33, August 2008.
Pattiaratchi, C. B. and Wijeratne, E. M. S.: Are meteotsunamis an underrated hazard?, Philos. T. R. Soc. A, 373, 2140377, https://doi.org/10.1098/rsta.2014.0377, 2015.
Pleskachevsky, A. L., Lehner, S., and Rosenthal, W.: Storm observations by remote sensing and influences of gustiness on ocean waves and on generation of rogue waves, Ocean Dynam., 62, 1335–1351, https://doi.org/10.1007/s10236-012-0567-z, 2012.
Pugh, D. T.: Tides, Surges, and Mean Sea-Level, John Wiley and Sons, Chichester, 486 pp., 1987.
RMS: 2013–2014 Winter Storms in Europe, An Insurance and Catastrophe Modeling Perspective. RMS White Paper, 2014.
Rose, S., Jaramillo, P., Small, M. J., Grossmann, I., and Apt, J.: Quantifying the hurricane risk to offshore wind turbines, P. Natl. Acad. Sci. USA, 109, 1–6, https://doi.org/10.1073/pnas.1111769109, 2012.
Rosenorn, S.: Efterarsvejret 2006, Vejret, 110, 20–23, 2007.
Rosenthal, W. and Lehner, S.: Individual wave height from SAR, in: Proceedings of the “Envisat Symposium 2007”, Montreux, Switzerland, 23–27 April 2007.
RWS: Stormvloedrapport van 5 t/m 7 December (SR91) Sint-Nicolaasvloed 2013, Watermanagementcentrum Nederland, Rijkswaterstaat, prepared by: Ing. J. Kroos, 19 March 2014, 48 pp., 2014.
Slingo, J.: EPA Climate Change Lecture: Facing up to Climate Change: Where next for Climate Science? public lecture at The Round Room, The Mansion House Dublin, 2019.
Slingo J., Belcher, S., Scaife, A., McCarthy, M., Saulter, A., McBeath, K., Jenkins, A., Huntingford, C., Marsh, T., Hannaford, J., and Parry, S.: The Recent Storms and Floods in the UK, Met Office, Fitzroy Road, Exeter, Devon, EX1 3PB, UK, February, 29 pp., 2014.
Spencer, T., Brooks, S. M., Moller, I., and Evans, B. R.: Where local matters: Impacts of a major North Sea storm surge, EOS, 95, 269–270, 2014.
Spencer, T., Brooks, S. M., Evans, B. R., Tempest, J. A., and Möller, I.: Southern North Sea storm surge event of Dec.5, 2013: Water levels, waves, and coastal impacts, Earth Sci. Rev., 146, 120–145, https://doi.org/10.1016/j.earscirev.2015.04.002, 2015.
Stull, R. B.: An Introduction to Boundary Layer Meteorology, Kluwer Academic Publishers, Dordrecht, 295–345, 1988.
Ulm, M., Arns, A., and Jensen, J.: Assessing consequences of extreme events for the German Bight, 36th International Conference on Coastal Engineering 2018 – Coastal Protection and Risk – ID 1527, Baltimore, MD, 3 August 2018.
Wadey, M. P., Haigh, I. D., Nichols, R. J., Brown, J. M., Horsburgh, K., Carroll, B., Gallop, S.L., Mason, T., and Bradshaw, E.: A comparison of the 31 January–1 February 1953 and 5–6 December 2013 coastal flood events around the UK, Front. Mar. Sci., 2, 27 pp., https://doi.org/10.3389/fmars.2015.00084, 2015.
Wikipedia: Cyclone Xaver, available at: https://en.wikipedia.org/wiki/Cyclone_Xaver, last access: 3 June 2020a.
Wikipedia: Orkan Xaver, available at: https://de.wikipedia.org/wiki/Orkan_Xaver, last access: 3 June 2020b.
Wikipedia: Stormen Bodil, available at: https://da.wikipedia.org/wiki/Stormen_Bodil{#}cite_note-39, last access: 3 June 2020c.
Wikipedia: Stormen Sven, available at: https://sv.wikipedia.org/wiki/Stormen_Sven{#}cite_note-15, last access: 3 June 2020d.
Wind Action: Massive damage in the wind farm – cause unclear, NDR.de, Christina Gerlach, available at: http://www.windaction.org/posts/48258-massive-damage-in-the-wind-farm-cause-unclear#.XsD_dDl7nIU, 2018.
Winther-Jensen, M. and Jørgensen, E. R.: When real life wind speed exceeds design wind assumptions, in: Proceedings of the 1999 European Wind Energy Conference, 1–5 March 1999, Nice, France, 220–223, 1999.