 | 19 Nov 2020
Full-Waveform based methods for Microseismic Monitoring Operations: an Application to Natural and Induced Seismicity in the Hengill Geothermal Area, Iceland
Camilla Rossi
Francesco Grigoli
Simone Cesca
Sebastian Heimann
Paolo Gasperini
Vala Hjörleifsdóttir
Torsten Dahm
Christopher J. Bean
Stefan Wiemer
Luca Scarabello
Nima Nooshiri
John F. Clinton
Anne Obermann
Kristján Ágústsson
Thorbjörg Ágústsdóttir
Geothermal systems in the Hengill volcanic area, SW Iceland, started to be exploited for electrical power and heat production since the late 1960s. Today the two largest operating geothermal power plants are located at Nesjavellir and Hellisheiði. This area is a complex tectonic and geothermal site, located at the triple junction between the Reykjanes Peninsula (RP), the Western Volcanic Zone (WVZ), and the South Iceland Seismic Zone (SISZ). The region is seismically highly active with several thousand earthquakes located yearly. The origin of such earthquakes may be either natural or anthropogenic. The analysis of microseismicity can provide useful information on natural active processes in tectonic, geothermal and volcanic environments as well as on physical mechanisms governing induced events. Here, we investigate the microseismicity occurring in Hengill area, using a very dense broadband seismic monitoring network deployed in Hellisheiði since November 2018, and apply sophisticated full-waveform based method for detection and location. Improved locations and first characterization indicate that it is possible to identify different types of microseismic clusters, which are associated with either production/injection or the tectonic setting of the geothermal area.
- Article
(4502 KB) - Full-text XML
- BibTeX
- EndNote


The Hengill volcanic system is located in Iceland in the southern end of the western volcanic zone (WVZ), at the triple junction between the WVZ, the Reykjanes Peninsula (RP), the landward extension of the Reykjanes spreading ridge, and the South Iceland Seismic Zone (SISZ), i.e. the left-lateral transform zone (Saemundsson, 1979; Einarsson, 2008). Therefore, the area is characterized by a complex local geology and tectonic setting, and intense seismicity.
The Hengill complex is primarily composed by three main volcanic systems, which are, from SE to NW with decreasing age, Grændalur (0.3–0.5 My), Hrómundartindur (Ölkelduháls) in decline, and Hengill, with the present-day volcanic activity (Arnason et al., 2010).
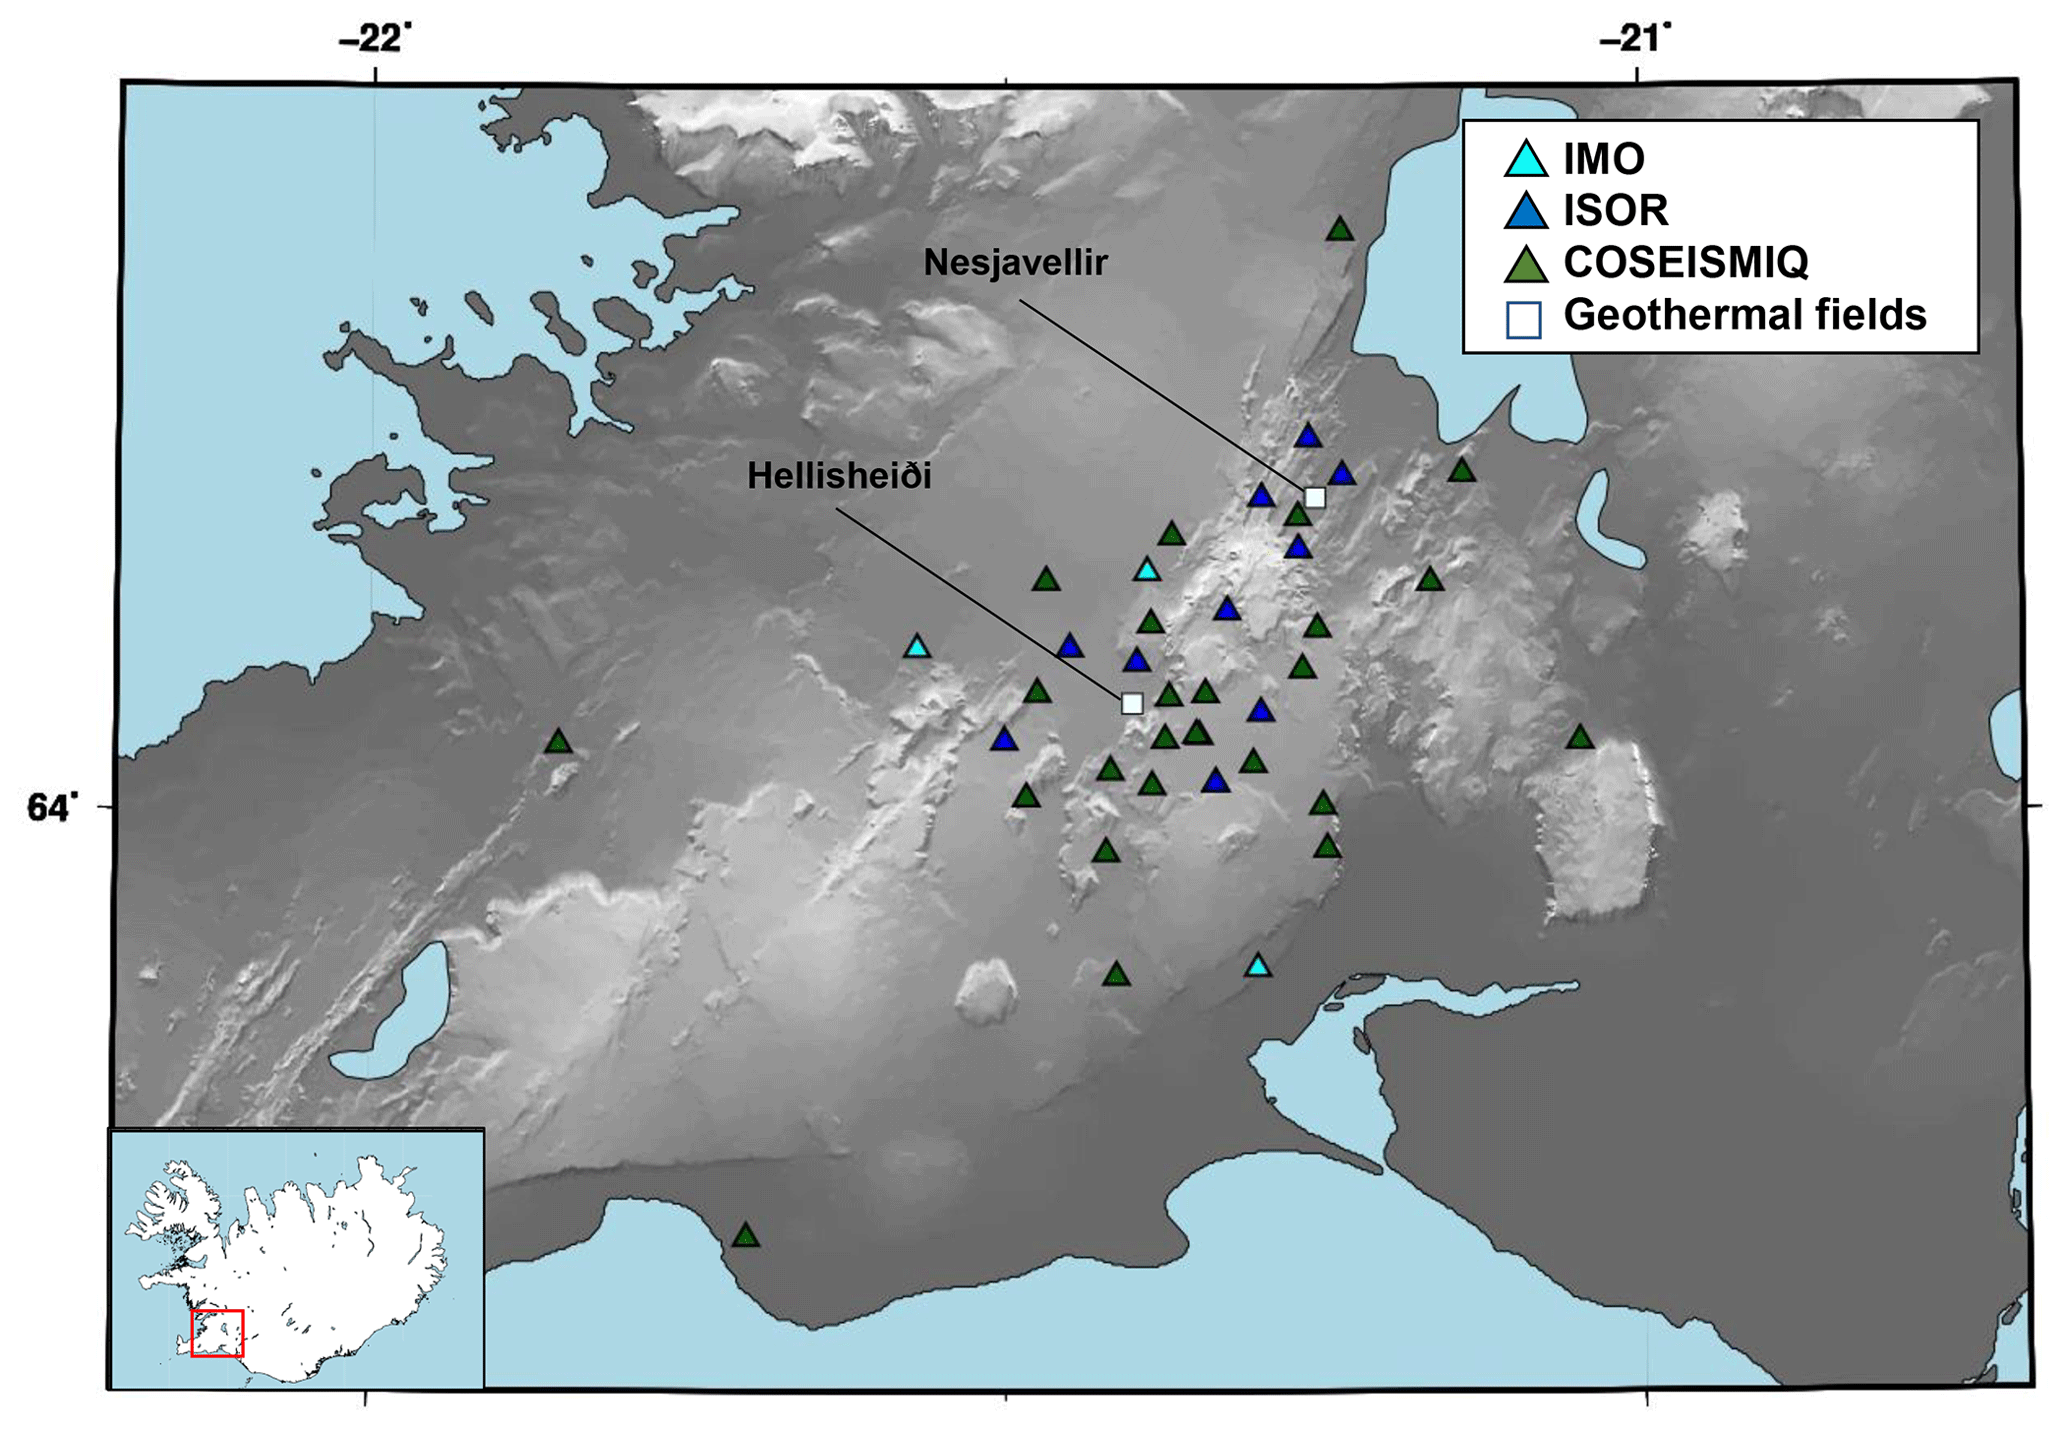
Figure 1Seismic network considered here is composed by stations from IMO (light blue), ISOR (blue) and COSEISMIQ (green). The two Nesjavellir and the Hellisheidi geothermal field are marked with white squares.
The dominant tectonic trend of the area is extensional, with the distribution of major faults and eruptive fissures oriented NNE, parallel to the accretionary zones (Foulger and Toomey, 1989). South of 64∘ N, in the SISZ, the area is characterized by a transform faulting with the main tectonic structures striking N–S.
The Hengill geothermal system has been exploited for electrical power and heat production since the late 1960s (Gunnarsson et al., 1992). The natural geothermal activity is expressed by numerous hot springs and fumaroles spread throughout the area around the volcanic system (Saemundsson, 1995; Arnórsson et al., 2008). In this region, the two largest operating geothermal power plants, respectively at NE and SW of Hengill area, are the Nesjavellir and the Hellisheiði geothermal plants, where electricity and hot water are extracted.
Due to its complex tectonic setting, this area is highly seismically active with several thousand earthquakes located yearly. In this region, earthquakes have M>6 in the neighbouring SISZ, and M>5 in the Hengill area (Rögnvaldsson et al., 1998; Árnadóttir et al., 2001; Vogfjörd and Slunga, 2003; Pedersen et al., 2003; Jakobsdóttir, 2008; Hreinsdóttir et al., 2009; Decriem et al., 2010). According to previous studies (Julian et al., 1997; Miller et al., 1998; Foulger, 1988a, b; Foulger and Toomey, 1989; Sigmundsson, 1997), the seismic activity at the Hengill triple junction can be mostly divided in two groups. First, infrequent intense episodes, occurring along the accretionary plate boundary and the transform zone (SISZ), outside the high temperature geothermal area. Second, background of small-magnitude earthquake activity that occurs more frequently a potentially related to geothermal energy exploitation activities. Since both anthropogenic and natural seismicity occur at the Hengill area, it is important to understand the relationship between the seismic activity and geothermal exploitation, as well as discriminating between natural and induced seismicity. There are already a few reported cases of induced seismicity such as the M 4.0 induced events in 2011 (Bessason et al., 2012) and the Hverahlíð cluster (Kristjánsdóttir et al., 2020). The 2011 earthquakes occurred during rapid changes in the injection rates, but their triggering mechanism is still disputed. It may either be related to Coulomb stress changes, due to the depletion effects associated to the geothermal production operations, or to pore pressure transients from fluid injection.
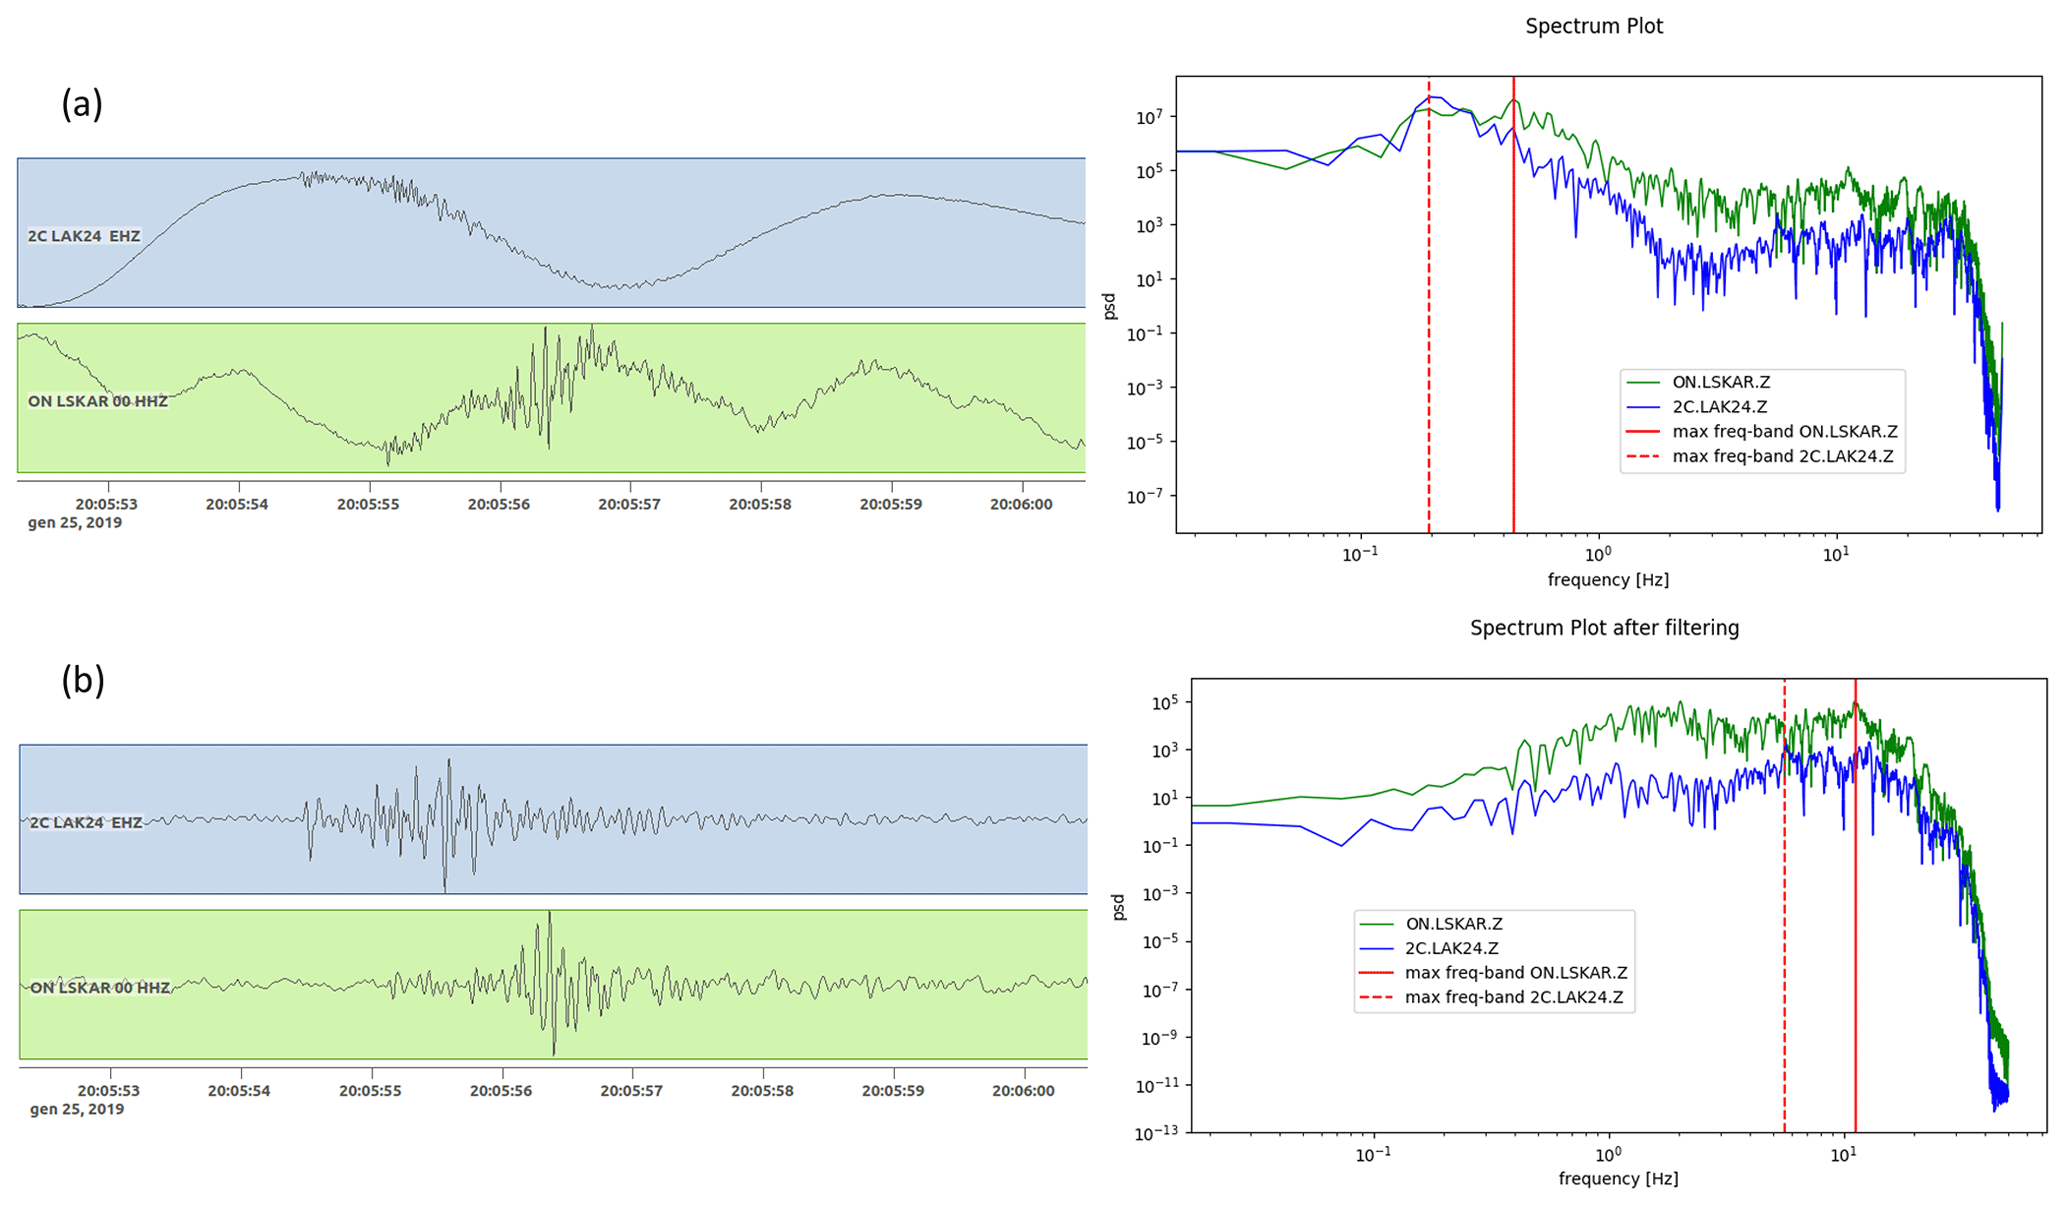
Figure 2Recorded seismograms and power spectra of the event occurred on 25 January 2019 with magnitude 1.1 in raw (a) and after filtering between 2–15 Hz (b). Green box and lines are related to short period station (LSKAR), while blue ones refer to broad-band stations (LAK24, in green). Red solid and dashed lines indicate the most energetic frequency band recorded respectively by short period and broad-band stations.
The analysis and characterization of microseismicity requires a seismic monitoring infrastructures allowing to record a massive number of low SNR events. However, the analysis of microseismicity is challenging since recorded seismic signals are often characterized by low amplitude, high-frequency content and strong seismic noise contamination, with low signal-to-noise ratio. Therefore, to improve the performance for the analysis of large microseismicity dataset, alternative methods (i.e. detection, location, magnitude and source mechanisms determination) have been recently proposed (e.g. Cesca and Grigoli, 2015, and references therein). This is particularly true for induced seismicity applications in seismically active areas, where seismic events can have natural origin or can be linked to several industrial activities such as: hydrocarbon extraction and natural gas storage operations, shale gas exploitation, geothermal energy exploitation, mining operations, and water impoundment (Grigoli et al., 2017).
Here, we focus on microseismicity analysis at Hengill geothermal area; we use a dense seismic network deployed since November 2018 with support of the GEOTHERMICA project COSEISMIQ (COntrol SEISmicity and Manage Induced earthQuakes) and apply an automated waveform-based techniques to locate seismic events. The method is based on the stacking of the Short Time Average to Long Time Average ratio (STA ∕ LTA) traces at all stations using both P and S phases. The main advantages of this method are (1) phase identification and picking are not required, (2) it can be successfully applied to noisy data, (3) it is fully-automated (Grigoli et al., 2013) and (4) it can be used to compare the quality of different velocity models for a particular area.
Seismicity in Hengill area is monitored by the regional seismic network (the SIL network) operated by the Icelandic Meteorological Office (IMO) since 1990s (Böðvarsson et al., 1996). In October 2016 seismic network has been extended with additional permanent seismic stations by Iceland GeoSurvey (ÍSOR) and ON Power (ON). Since September 2018, within the EU-GEOTHERMICA project COSEISMIQ (COntrol SEISmicity and Manage Induced earthQuakes), the number of stations operating in the Hengill geothermal area has increased to 40 (Fig. 1). The core objective of COSEISMIQ project is to monitor and control induced seismicity, combining advanced seismological methods for seismicity characterization and subsurface imaging with geomechanical modelling techniques and risk analysis tools. The Hengill area was chosen as a demonstration site due to (1) the fully operational and commercially successful Hellisheiði geothermal power plant, (2) both natural and induced seismicity is common; (3) the area is uninhabited with a low population density in the area's vicinity leading to lower risk. The dense seismic network allows a better monitoring, and microseismic analysis and testing of data intensive techniques. The seismic network consists of combined permanent and temporary short (5 and 1 s) – and broad-band (120 and 60 s) sensors, installed by the COSEISMIQ team, with overall local 40 stations within an area of about 35×35 km2 (Fig. 1). Data sampling rate is 100 Hz.
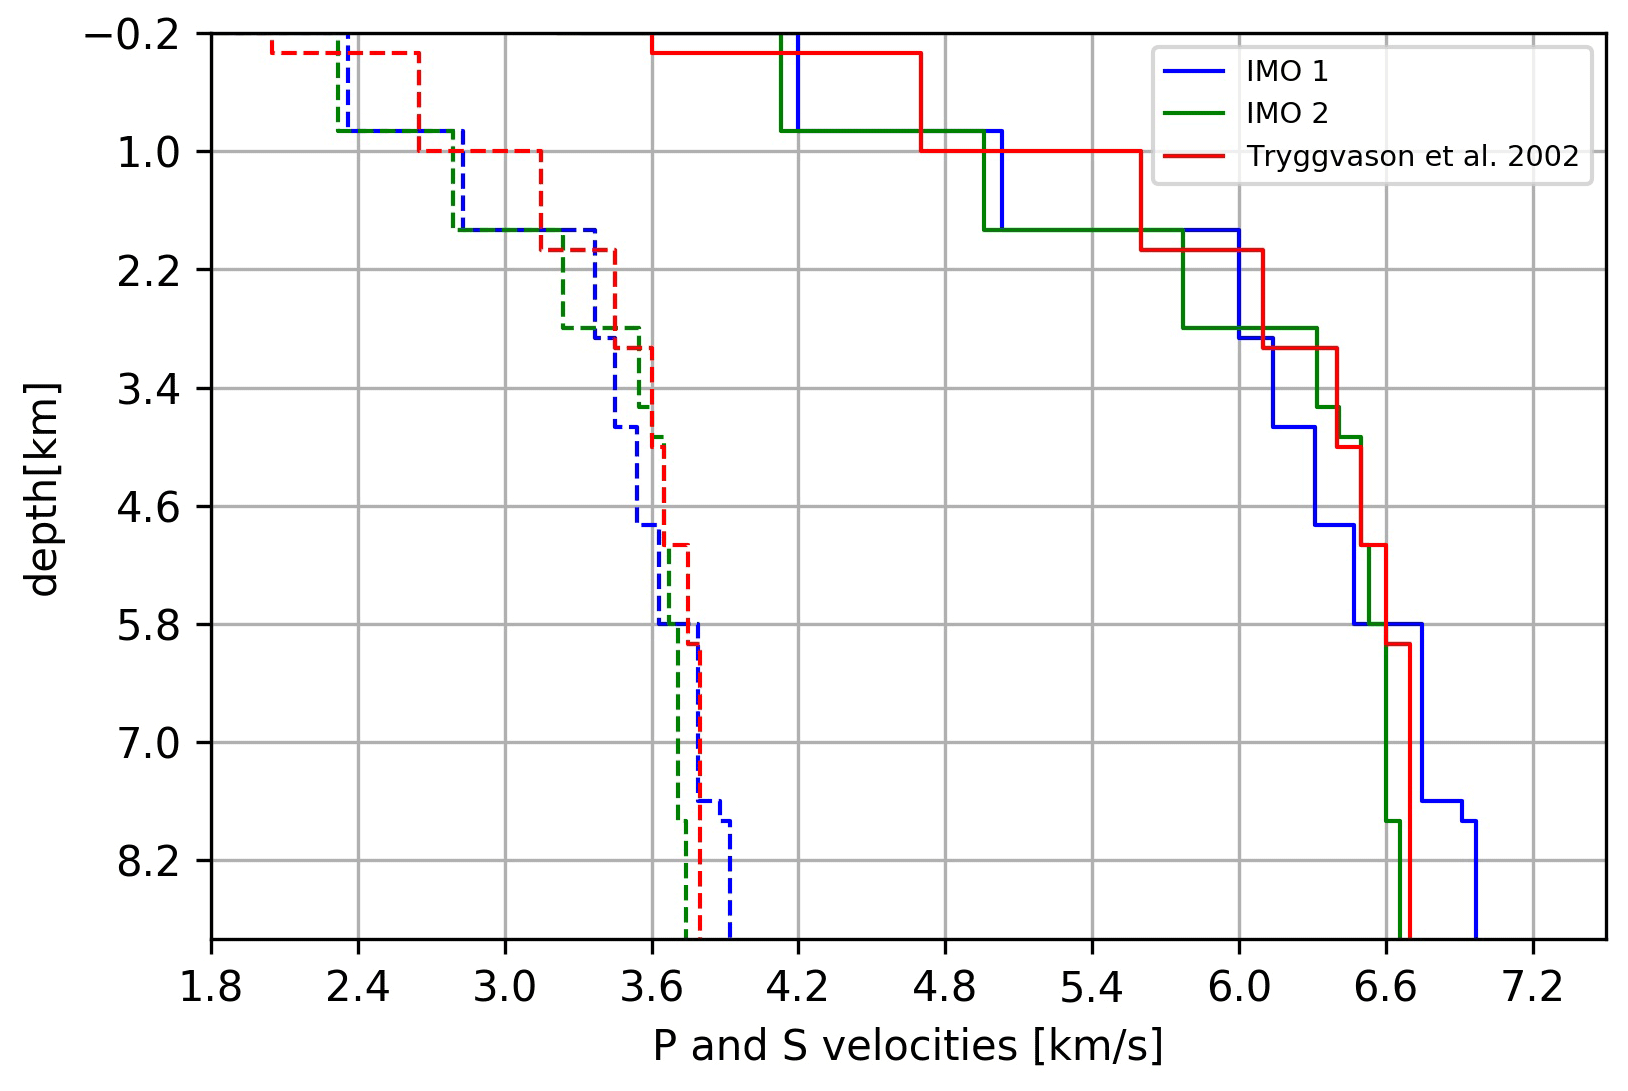
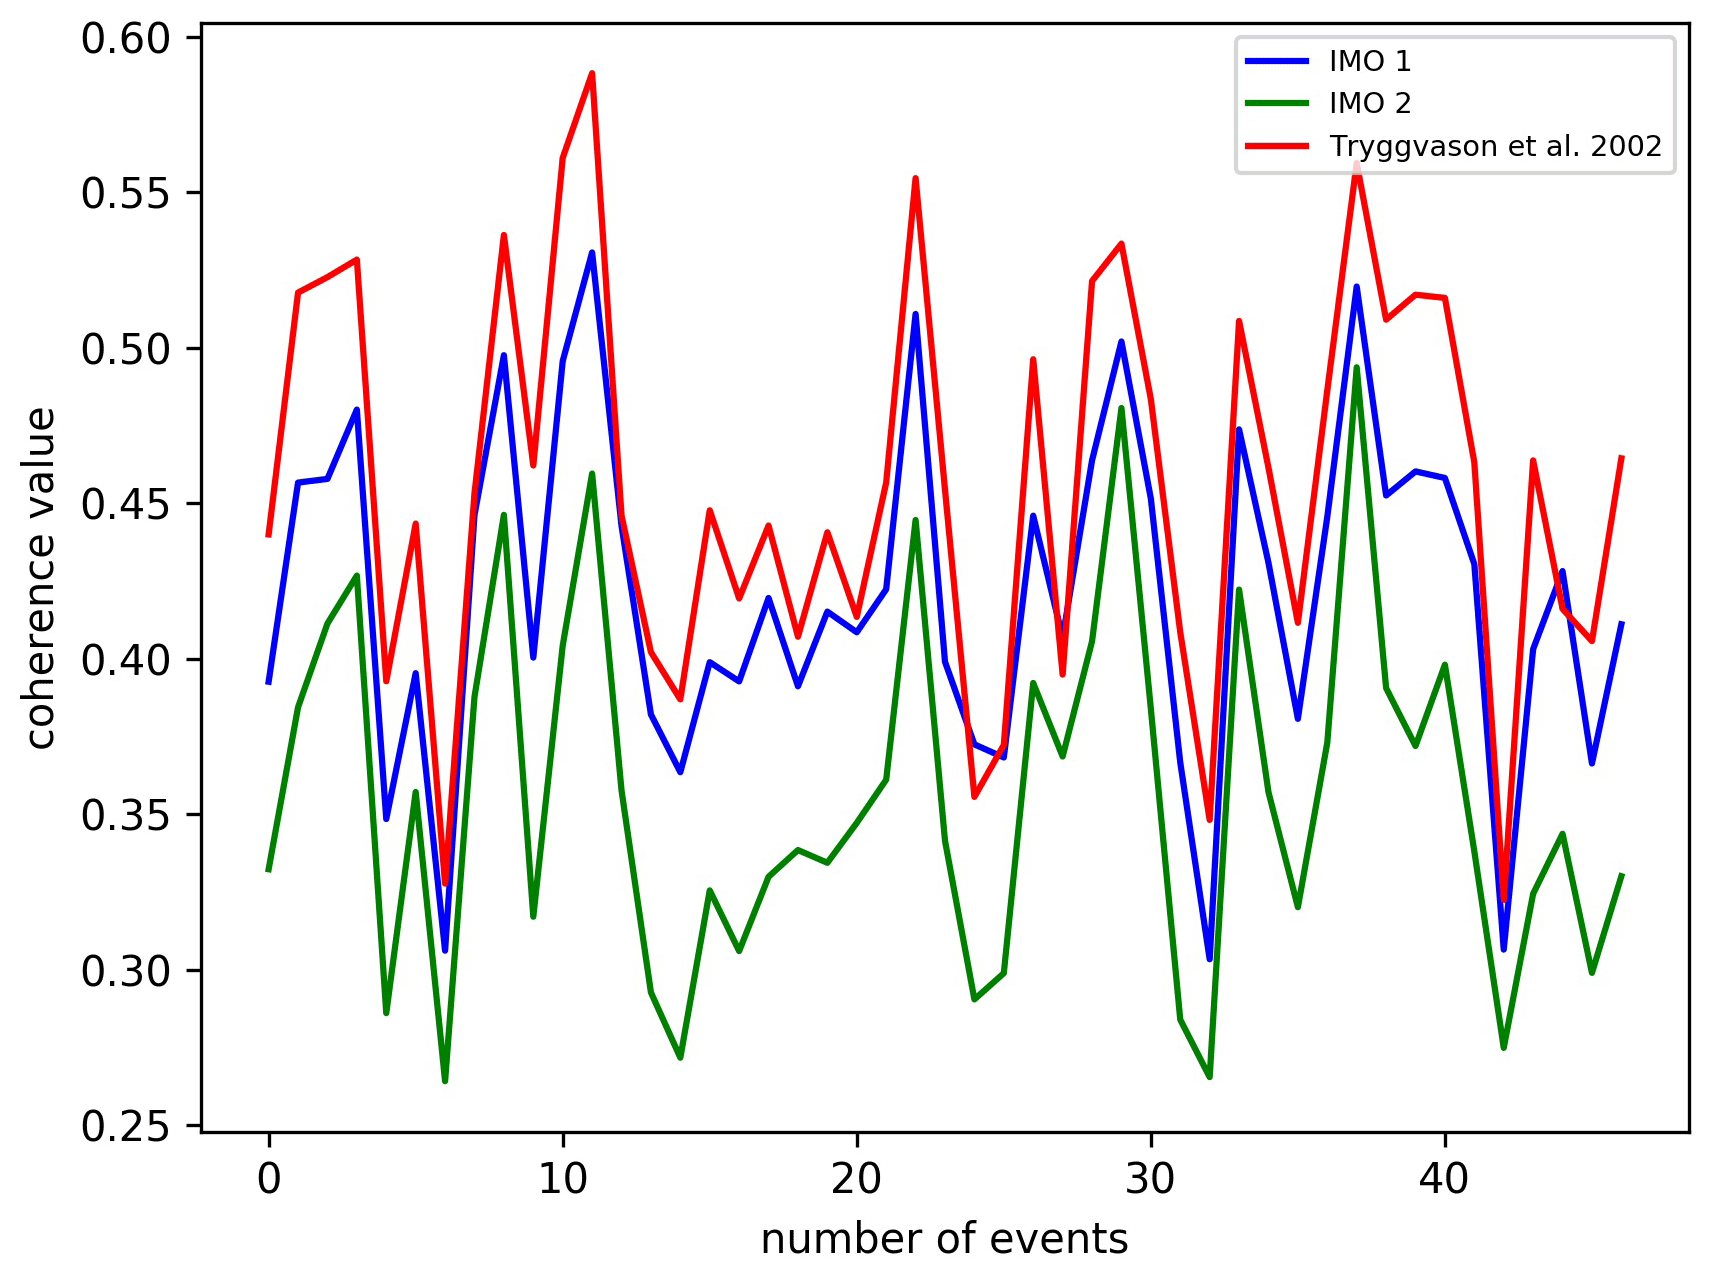
Figure 4Coherence values for the three velocity models. The Tryggvason et al. (2002) model shows the best values of coherence.
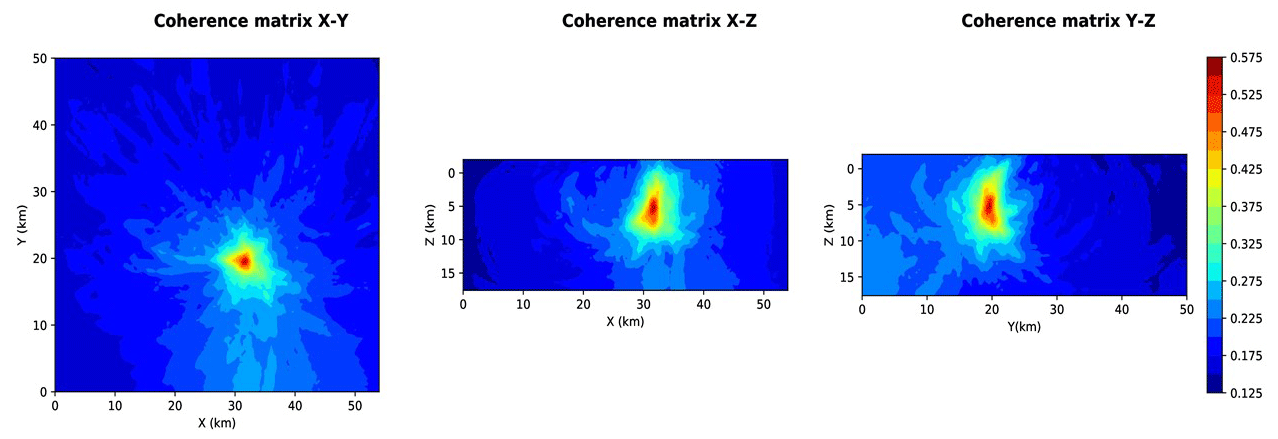
Figure 5Example of coherence matrix related to ML1.6 earthquake occurred on 30 December 2018. The coherence matrix XY is obtained by projecting, for each (X, Y) point, its maximum along Z direction (coherence matrices XZ and YZ are obtained in similar way). Coherence values are represented in color scale.
The dataset considered here consists of about 637 events with 0.8<ML<4.7 recorded between 22 December 2018 and 31 January 2019. The dataset includes a seismic sequence occurred at the end of December, with the ML4.7 mainshock that took place on 30 December 2018. We discuss the seismicity recorded in the Hengill area, starting few days before the mainshock and until end of January 2019. With the exception of the ML4.7 mainshock, the dataset is characterized by low-magnitude earthquakes (ML<3), with high frequency (f>1 Hz) and noise contaminated signals, which underline the need of robust automated analysis techniques. Seismic noise (frequency range of 0.2–0.4 Hz) strongly affect events with ML<2 and has a more effect on the broad-band seismic stations (Fig. 2a).
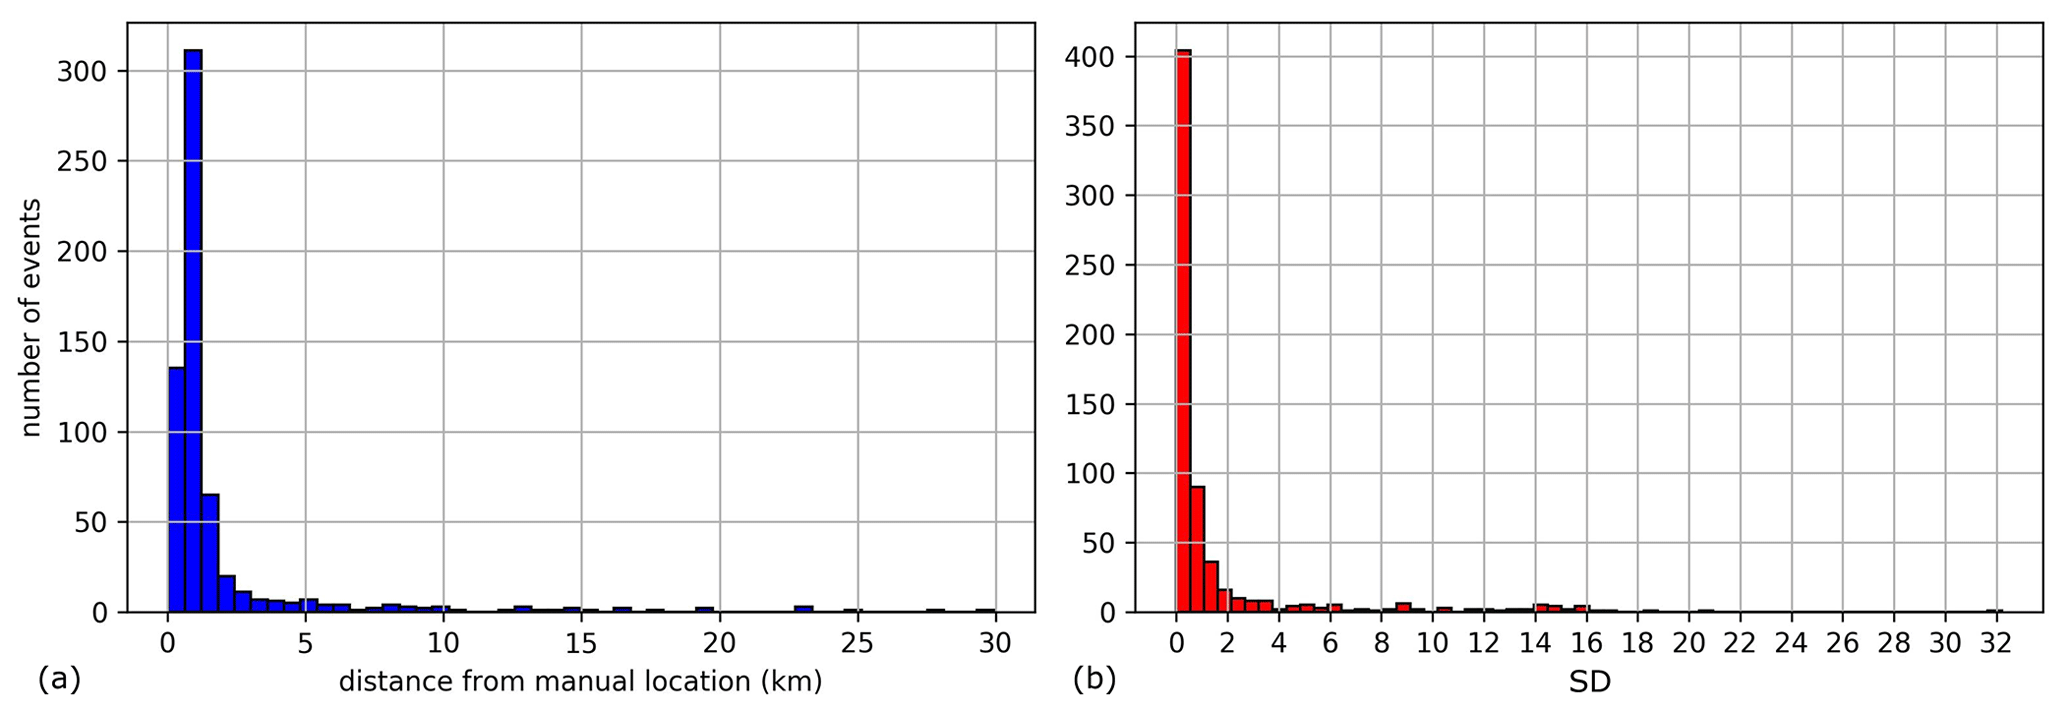
Figure 6Histogram plots show (1) the number of events automated located (blue bars) within a given distance from the manual locations (a) and (2) standard deviation of results (red bars, b).

Figure 7Map and two orthogonal NS and EW vertical sections of 637 earthquakes occurred between 22 December 2018 and 31 January 2019. Located seismic events are color-coded according to depth, arrows in crsoss sections indicate the location of Hellisheidi and Nesjavellir geothermal plants, the coloured triangles represent the seismic stations of different networks.
Here, we computed earthquakes location using the LOKI algorithm (Location of seismic events through traveltime staking, Grigoli et al., 2013), a modified version of Source Scanning Algorithm (SSA) method developed by Kao and Shan (2004) and specifically designed for microseismic monitoring. Basically, LOKI performs a grid-search on a discrete volume and for each grid-point (i.e. potential earthquake hypocenter) evaluate a coherence level by stacking processed waveforms along the calculated traveltimes corresponding to that grid-point (Grigoli et al., 2013).
In order to locate the seismic events, LOKI uses non-negative processed waveforms (that we call stacking functions) based on the Short Time Average to Long Time Average ratio (STA ∕ LTA) traces of all available stations. The algorithm first compute two characteristic functions, a first one sensitive to the P-phase onset and a second one sensitive to S-phase arrival. The P stacking function is defined as the STA ∕ LTA of energy of vertical component of seismic trace, whereas the S stacking function is the STA ∕ LTA of the maximum eigenvalue of the instantaneous covariance matrix of the horizontal components traces. To locate an event, we need to define a grid space containing the seismogentic zone, where each grid point respresents a potential source location (x, y, z). For each possible trial source location, the theoretical arrival times for P and S onset at all stations of recording network have been computed. Then, the stacking of STA ∕ LTA traces have been performed along theoretical P and S arrival times and estimating their coherence. To remove the attenuation effect due to geometrical spreading, waveform normalization is required; in this way we avoid that stations close to source dominate the stacking (Gigoli et al., 2013).
Iterating this procedure on a 3-D grid, it is possible to retrieve a coherence function, which is bounded between 0 (no coherence) and 1 (perfect coherence for both P and S phases). This function is a measure of the coherence of the seismic wavefield for different source locations and origin times, estimated along both the P and S theoretical travel time surface. At the correct location and time step the waveform-stacking process gives an absolute maximum in terms of coherence, corresponding to the earthquake spatial coordinate.
The uncertainties of solutions are estimated by perturbing the STA ∕ LTA parameters (i.e. the length of both long- and short- time windows) and relocating each event several times. From the location distribution, weighted mean and standard deviation have been computed. The weighted mean provides the best estimation of the hypocentral location, while uncertainties information can be directly extracted from standard deviation.

Figure 8Cumulative plot shows the standard deviation of the location results for shallow in-network (in red) an deep outside-network (green) events.
3.1 Application to Hengill dataset
To increase the signal-to-noise ratio, a bandpass filter from 2 to 15 Hz has been applied to the entire dataset (Fig. 2b).
Before analysing the whole dataset, we first tested three different velocity models available for the Hengill area (Fig. 3): two local velocity models from IMO (Icelandic Meteorological Office) (Kristín Vogfjörð and Sigurlaug Hjaltadóttir, 2007), and a third one extracted from Tryggvason et al. (2002). Thus, we performed earthquake locations comparing the performance of the three velocity models with a small dataset consisting of ∼50 seismic events homogeneously distributed within the target area. In analogy, with the velocity analysis performed in reflection seismics, the coherence among waveforms can be used to evaluate the “goodness” of a particular velocity model with respect to other ones. While RMS values strongly depend on the quality of pickings and on the number of phases considered, the use of coherence values and waveform-based techniques (which are picking free) allows to automatize this step and provide robust comparison of the quality of different velocity models.
To compute P and S travel-times for each velocity model we use the Eikonal finite difference scheme of Podvin and Lecomte (1991) implemented within NonLinLoc (Lomax et al., 2000).
Taking into account the size of seismogenic zone, we defined a 3D cartesian grid space set to km3 with 0.4 km grid spacing. For each possible trial source location, the theoretical arrival times for P and S onset at all 40 stations of the recording network have been computed. The STA ∕ LTA traces were computed using a short-time window length in range of 0.1–0.15 s, the long-time window is twice as long. Uncertanties have been estimated by random perturbation (5 times) of STA and LTA windows length ranges.
Hence, based on maximum estimated coherence values, providing direct information of the best estimation of hypocentral location, we choose the best velocity model and then perform the location of all 637 earthquakes.
On the basis of the maximum estimated coherence values, we have chosen the best velocity model; the higher values of coherence belong to locations computed using the Tryggvason et al. (2002) velocity model (Fig. 4).
The location of all 637 seismic events was successfully obtained with an average of maximum coherence value of about 0.6. Figure 5 shows and example coherence matrices XY, XZ, and YZ related to the earthquake occurred on 2018 December 30 with ML=1.6; coherence values are represented in colour scale, showing a clear absolute maximum.
Uncertanties of solutions, as standard deviation, and the comparison of our location results with those obtained with manual procedure are shown in Fig. 6; ∼80 % of automated located events are within 1 km from the reference manual location.
Figure 7 shows the map with located events and two ortogonal vertical cross-sections along latitude and longitude. Events are color-coded according to their depth. Seismicity appears clustered with most of hypocentre-depths distributed between 1 and 8 km. In particular, we note that shallower events (with hypocentre <4 km) are mostly located in the geothermal area, whereas most of deeper events appear as a big separate cluster in the southern part of the area, in the neighbouring SISZ.
We applied an automated waveform-based method for earthquake location to a dataset characterized by a significant number of low-magnitude events in the Hengill geothermal area, which provide robust results even with low signal-to-noise ratio datasets (Grigoli et al., 2018).
We first tested three different velocity models choosing the best one (Tryggvason et al., 2002) on the base of maximum estimated coherence values, and then we computed earthquake locations.
Hypocentral distribution map and cross-section views (Fig. 7) highlight the depth distribution of seismicity: (1) shallower events, with depth less than 4 km, occurred in the proximity of the geothermal fields and seem to be clustered in three small clusters; (2) most of deeper events appear as a bigger separate cluster located outside the geothermal area.
Thus, based on the earthquakes location results, we can divide the seismicity in two main groups. The first group is composed by shallower events and could be associated, at some exten, to geothermal energy exploitation operations in the area. The second one, occurring deeper and at the edge of geothermal area, might be associated to tectonic transform zone SISZ. In particoluar, the deepest and separate cluster of events occured in the south of study area, shows a depth-trend E-dipping (see cross-sections in Fig. 6). Separate clusters further south of geothermal area have been already observed in previus studies (Foulger, 1988a, b) and associated to tectonic process in the SISZ.
Our results are in agreement with those obtained by manual location, with high resolution results, especially in the depth estimation (Grigoli et al., 2018). We computed uncertainties providing information about the quality and stability of the solutions (i.e. larger uncertainties are related to less stable solutions). The comulative plot (Fig. 8) shows the standard deviation of locations of the two depth groups: shallow events (in red), mostly located in center of geothermal site, have lower values of uncertaintes than deep events (in green). Shallow events are better constraned by all network, highlighting that the quality of solutions also depends on the number of stations used for the STA ∕ LTA stacking process.
Our results indicate that we have a fully automated and robust tool for the location of microseismic data, whose solutions are directly used for seismological analysis and advanced interpretation in a complex tectonic and geothermal site.
The data used in this paper are available from the authors upon request.
CR analysed the data, wrote the manuscript and created the figures, FG, SC and SH provided support with the data analysis and contributed to write the manuscript. All the authors reviewed and contributed in writing the manuscript.
The authors declare that they have no conflict of interest.
This article is part of the special issue “European Geosciences Union General Assembly 2020, EGU Division Energy, Resources & Environment (ERE)”. It is a result of the EGU General Assembly 2020, 4–8 May 2020.
The authors would like to thank editors and any two anonymous reviewers for valuable comments and suggestions and for careful review of manuscript. This research has been supported by the CO-SEISMIQ project (project no. 170167-44011) and the University of Bologna. Francesco Grigoli is funded by the European Union's Horizon 2020 research and innovation program under the Marie Skłodowska-Curie grant agreement no. 790900.
This research has been supported by the CO-SEISMIQ project (project no. 170167-44011). Francesco Grigoli is funded by the European Union’s Horizon 2020 research and innovation program under the Marie Skłodowska-Curie grant agreement no. 790900
This paper was edited by Antonio Pio Rinaldi and reviewed by two anonymous referees.
Árnadóttir, T., Hreinsdóttir, S., Gudmundsson, G., Einarsson, P., Heinert, M., and Völksen, C.: Crustal deformation measured by GPS in the South Iceland Seismic Zone due to two large earthquakes in June 2000, Geophys. Res. Lett, 28, 4031–4033, https://doi.org/10.1029/2001GL013332, 2001.
Árnason, K., Eysteinsson, H., and Hersir, G. P.: Joint 1D inversion of TEM and MT data and 3D inversion of MT data in the Hengill area, SW Iceland, Geothermics, 39, 13–34, https://doi.org/10.1016/j.geothermics.2010.01.002, 2010.
Arnórsson, S., Axelsson, G., and Saemundsson, K.: Geothermal systems in Iceland, Jökull, 58, 269–302, 2008.
Bessason, B., Ólafsson, E. H., Gunnarsson, G., Flóvenz, Ó. G., Jakobsdóttir, S. S., Björnsson, S., and Árnadóttir, Þ: Verklag vegna örvaðrar skjálftavirkni í jarðhitakerfum, Orkuveita Reykjavíkur, 2012.
Böðvarsson, R., Rögnvaldsson, S. Th., Jakobsdóttir, S. S., Slunga, R., and Stefánsson, R.: The SIL data acquisition and monitoring system, Seis. Res. Lett., 67, 35–46, 1996.
Cesca, S. and Grigoli, F.: Chapter Two – Full Waveform Seismological Advances for Microseismic Monitoring, Adv. Geophys., 56, 169–228, https://doi.org/10.1016/bs.agph.2014.12.002, 2015.
Einarsson, P.: Plate boundaries, rifts and transforms in Iceland, Jökull, 58, 35–58, 2008.
Foulger, G. R.: Hengill triple point, SW-Iceland: 1. Tectonic structure and the spatial and temporal distribution of local earthquakes, J. Geophys. Res., 93, 13493–13506, https://doi.org/10.1029/JB093iB11p13493, 1988a.
Foulger, G. R.: Hengill triple point, SW Iceland: 2. Anomalous earthquake focal mechanisms and implications for process within the geothermal reservoir and at accretionary plate boundaries, J. Geophys. Res. 93, 13507–13523, https://doi.org/10.1029/JB093iB11p13507, 1988b.
Foulger, G. R. and Toomey, D. R.: Structure and evolution of the Hengill-Grensdalur central volcano complex, Iceland: Geology, geophysics and seismic tomography, J. Geophys. Res., 94, 17511–17522, https://doi.org/10.1029/JB094iB12p17511, 1989.
Grigoli, F., Cesca, S., Vassallo, M., and Dahm, T.: Automated seismic event location by travel-time stacking: An application to mining induced seismicity, Seismol. Res. Lett., 84, 666–677, https://doi.org/10.1785/0220120191, 2013.
Grigoli, F., Cesca, S., Priolo, E., Rinaldi, A. P., Clinton, J. F., Stabile, T. A., Dost, B., Fernandez, M. G., Wiemer, S., and Dahm, T.: Current challenges in monitoring, discrimination, and management of induced seismicity related to underground industrial activities: A European perspective, Rev. Geophys., 55, 310–340, https://doi.org/10.1002/2016RG000542, 2017.
Decriem, J., Árnadóttir, T., Hooper, A., Geirsson, H., Sigmundsson, F., Keiding, M., Ófeigsson, B. G., Hreinsdóttir, S., Einarsson, P., LaFemina, P., and Bennett, R. A.: The 2008 May 29 earthquake doublet in SW Iceland, Geophys. J. Int., 181, 1128–1146, https://doi.org/10.1111/j.1365-246X.2010.04565.x, 2010.
Grigoli, F., Scarabello, L., Böse, M., Weber, B., Wiemer, S., and Clinton, J. F.: Pick-and waveform-based techniques for real-time detection of induced seismicity, Geophys. J. Int., 213, 868–884, https://doi.org/10.1093/gji/ggy019, 2018.
Gunnarsson, A., Steingrimsson, B., Gunnlaugsson, E., Magnusson, J., and Maack, R.: Nessjavellir geothermal co-generation power plant, Geothermics, 21, 559–583, https://doi.org/10.1016/0375-6505(92)90007-V, 1992.
Hreinsdóttir, S., Árnadóttir, T., Decriem, J., Geirsson, H., Tryggvason, A., Bennett, R. A., and LaFemina, P. A: complex earthquake sequence captured by the continuous GPS network in SW Iceland, Geophys. Res. Lett., 36, https://doi.org/10.1029/2009GL038391, 2009.
Jakobsdóttir, S. S.: Seismicity in Iceland: 1994–2007, Jökull, 58, 75–100, 2008.
Julian, B. R., Miller, A., and Foulger, G. R.: Non-double couple earthquake mechanisms at the Hengill-Grensdalur volcanic complex, Geopys. Res. Lett., 24, 743–746, https://doi.org/10.1029/97GL00499, 1997.
Kao, H. and Shan, S. J.: The source-scanning algorithm: Mapping the distribution of seismic sources in time and space, Geophys. J. Int., 157, 589–594, 2004.
Kristjánsdóttir, S., Guðmundsson, Ó., Ágústsson, K., Ágústsdóttir, Þ., Tryggvason, A., and Fehler, M.: Induced seismicity during reinjection of wastewater in Hellisheidi geothermal field, SW Iceland, Proceedings of the World Geothermal Congress 2020, 27 April–1 May 2020, Reykjavík, Iceland, 2020.
Lomax, A., Virieux, J., Volant, P., and Berge-Thierry, C.: Probabilistic earthquake location in 3D and layered models, in: Advances in Seismic Event Location, 101–134, Springer, Netherlands, https://doi.org/10.1007/978-94-015-9536-0_5, 2000
Miller, A., Julian, B., and Foulger, G. R.: Three-dimensional seismic structure and moment tensors of non-double couple earthquakes at the Hengill-Grensdalur volcanic complex Iceland, Geophys. J. Int., 133, 309–325, https://doi.org/10.1046/j.1365-246X.1998.00492.x, 1998.
Pedersen, R., Jónsson, S., Árnadóttir, T., Sigmundsson, F., and Feigl, K. L.: Fault slip distribution of two June 2000 Mw6.5 earthquakes in South Iceland estimated from joint inversion of InSAR and GPS measurements, Earth Planet. Sci. Lett., 213, 487–502, 2003.
Podvin, P. and Lecomte, I.: Finite difference computation of traveltimes in very contrasted velocity models: a massively parallel approach and its associated tools, Geophys. J. Int., 105, 271–284, https://doi.org/10.1111/j.1365-246X.1991.tb03461.x, 1991.
Rögnvaldsson, S. Th., Gudmundsson, G. B., Ágústsson, K., Jakobsdóttir, S. S., Slunga, R., and Stefánsson, R.: Overview of the 1993–1996 seismicity near Hengill, Vedurstofa Íslands, report VÍ-R98006-JA05, Reykjavík, 16 pp., 1998.
Sæmundsson, K.: Outline of the geology of Iceland, Jökull, 29, 7–28, 1979.
Sæmundsson, K.: Hengill, geological map (bedrock) 1:50000, Nat. Energy Auth., Reykjavík, Iceland, Hitaveita Reykjavíkur, and Icelandic Geodetic Survey, Reykjavík, 1995.
Sigmundsson, F., Einarsson, P., Rögnvaldsson, S. T., Foulger, G. R., Hodgkinson, K. M., and Thorbergsson, G.: The 1994–1995 seismicity and deformation at the Hengill triple junction, Iceland: triggering of earthquakes by minor magma injection in a zone of horizontal shear stress, J. Geophys. Res., 102, 15151–15161, https://doi.org/10.1029/97JB00892, 1997.
Tryggvason, A., Rögnvaldsson, S. Th., and Flóvenz, Ó. G.: Three dimensional imaging of P- and S-wave velocity structure and earthquake locations beneath Southwest Iceland, Geophys. J. Int., 151, 848–866, https://doi.org/10.1046/j.1365-246X.2002.01812.x, 2002.
Vogfjörd, K. and Slunga, R.: Rupture in the South Iceland Seismic Zone forced by magmatic intrusion in the Hengill area, EGS – AGU – EUG Joint Assembly, 6–11 April 2003, Nice, France, 2003.
Vogfjörð, K. and Hjaltadóttir S.: Kortlagning skjálftavirkni við Hverahlíð á Hellisheiði í febrúar 2006, Unnið fyrir Orkuveitu Reykjavíkur, VÍ-ES-04, Reykjavík, ágúst 2007.