 | 25 Aug 2020
Repeated absolute gravity measurements on a dense network at Campi Flegrei – a reliable tool for volcano monitoring
Giovanna Berrino
Giuseppe Ricciardi
Since 1981, relative gravity measurements have routinely carried out at the Campi Flegrei caldera, a densely populated area. The gravity network also includes two absolute stations periodically measured with a laboratory absolute gravimeter, which does not permit field measurements.
At the end of 2014, the Osservatorio Vesuviano, Section of Napoli of the Istituto Nazionale di Geofisica e Vulcanologia (INGV-OV), acquired a portable absolute gravimeter that allows field operations on outdoor sites. Therefore, in 2015 a dense absolute gravity network was established in Campi Flegrei. This will permit an advanced approach for volcano monitoring. The net consists of 36 stations, 34 of which located inside the caldera and placed upon or very close to gravity stations belonging to the relative network. Five surveys were carried out on June 2015, on February and November 2017, on October 2018 and on October 2019. The comparison with height changes suggests that significant Δg are partly due to the uplift occurred over the same time intervals and mostly to shallow processes associated to the dynamic of the local hydrothermal system. The comparison with the gradients observed during the last large uplift (1982–1984) and the following subsidence (1985–2003) confirms this observation. These results suggest that the present activity may be due to a transient or pulsating phenomenon as the alternating recharge/discharge of fluids in the surface hydrothermal system. Gravity changes detected by absolute measurements are in good agreement with those obtained by relative ones, and confirms the feasibility of this methodology for volcano monitoring. Finally, they also encourage replacing the relative networks with absolute ones, with all the consequent advantages.
- Article
(4325 KB) - Full-text XML
- BibTeX
- EndNote


Measurements of the time-space changes of the gravity field are a powerful approach to detect the mass change/redistribution in the underground, such as those occurring at active volcanoes. The most common approach to detect gravity precursory signals is the use of repeated high-precise relative measurements. The combination of relative and absolute measurements has been demonstrated as a reliable way to reduce some uncertainties on the relative measurements (e.g. Berrino et al., 1999, 2013; Berrino, 2000; Sugihara and Ishido, 2008; Greco et al., 2012; Sofyan et al., 2016). Relative measurements have some limitations (i.e. the need of a stable in time reference station, the long-term changes of the instrumental characteristics and the demanding field procedures). The absolute ones have several advantages: they are independent from any reference, are directly linked to standards of time and length so they are independent from instrumental references and drift. Moreover, the absolute value of gravity can be used without loop reductions, post processing and benchmark links.
The best solution is the establishment of a dense network of absolute stations in the dynamic area, but this is often difficult, mainly on volcanoes, if laboratory instruments are used because they does not permit field measurements since they need the availability of buildings/like-laboratory sites to be protected. Actually, there are some examples of the use of a portable instrument (i.e. the micro-g_LaCoste FG5) for outdoor measures, but this required more logistics and precautions mainly due to the length of the measure session (e.g. Kazama and Okubo, 2009; Greco et al., 2012, 2015; Kazama et al., 2015; Carbone et al., 2017).
The availability of a portable field absolute gravimeter (Micro-g_LaCoste A10), helps overcome these difficulties. It has the advantage respect to the portable laboratory absolute gravimeters to perform faster and easier measurements also maintaining the characteristics of a laboratory instrument.
During the last decade several researches provided the high efficiency and accuracy of A10 and its suitability for modernizing gravity change detection (e.g. Ferguson et al., 2008; Krynski and Sekowski, 2010; Dykowski et al., 2014). Many researchers have already carried out encouraging applications in geodesy and geophysics to: set up reference absolute gravity networks (e.g. Pujol, 2005); monitor geothermal fields on volcanoes (e.g. Sofyan et al., 2014, 2015); characterize the groundwater storage changes (e.g. Koth and Long, 2012; Hinderer et al., 2009); study Fennoscandia Postglacial rebound and/or gravity changes due to ice mass distribution (e.g. Makinen et al., 2013; Nielsen et al., 2014).
This paper presents the results of several absolute gravity measurements carried out with an A10 gravimeter on a wide network at the Campi Flegrei.
The Campi Flegrei caldera, located west of Naples (Southern Italy), is an active densely populated volcanic complex, worldwide known as a site of notable slow vertical ground movements (bradyseism). The most recent big and rapid bradyseismic episodes occurred in 1970–1972 and 1982–1984 producing 170 and 180 cm of maximum uplift respectively (Corrado et al., 1977; Berrino et al., 1984; Dvorak and Berrino, 1991). Large horizontal ground displacement, intense seismic activity, significant changes in geochemical parameters and significant gravity changes accompanied those events; gravity changes also helped to detect underground mass changes/movements during the 1982–1984 crisis. A sinking phase followed both uplifts, associated with annual oscillations of variable amplitude in the first case (e.g. Corrado and Luongo, 1981; Berrino et al., 1984) or interrupted by some occasional minor uplift episodes of the order of few centimeters during the second (e.g. Berrino, 1998; Del Gaudio et al., 2010).
In 2005, an arising seismicity and large compositional variations of the main fumaroles accompanied a new and still ongoing slow uplift phase (e.g. Chiodini et al., 2015). This uplift shows a different behavior respect to the 1970–1972 and 1982–1984 uplifts being slow and not continuous. In addition, the accompanying seismicity is different, remaining low. After a one year period of no ground deformation and almost null seismicity, both uplift and seismicity increased again from 2014 (e.g. Chiodini et al., 2017).
The analyses of recent seismic activity and geochemical data (e.g. D'Auria et al., 2011; Cardellini et al., 2017; Chiodini et al., 2017; Siniscalchi et al., 2019) suggest that the source may be associated to a transient and increasing upward migration of fluids from the deeper magmatic source into the shallower hydrothermal system up to the surface.
Moreover, Chiodini et al. (2017) also indicate that at the beginning of the new millennium the behavior of the system changed. Gravity data also showed that behavior (e.g. Todesco et al., 2006).
Gravity changes during the strong 1982–1984 uplift and the subsequent subsidence, till the beginning of 1990s, showed at all time (both on the long and the short periods) an inverse correlation with the elevation changes (Fig. 1a), and the same space distribution as the observed height changes. The latter show a quasi-bell-shaped symmetry (Fig. 1b), constant during both uplift and subsidence phases, as detected by levelling data since 1970 (e.g. Corrado et al., 1977; Berrino et al., 1984; Berrino, 1994) and confirmed by present day continuous GPS data. Figure 1a shows, as an example, the time gravity and elevation changes at the station Pozzuoli Serapeo (in the center of the caldera); it also shows the trend of the gravity residuals, obtained after removing the effect of height changes. Gravity variations allowed hypothesizing magma replenishment not sufficient to trigger an eruption during rapid uplift between 1982 and 1984, and a combination of magma drainage and removal of fluids from a deep hydrothermal system for the deflation phase till 2001 (Berrino et al., 1984, 1992; Berrino, 1994; Gottsmann et al., 2003; Camacho et al., 2011; Trasatti et al., 2011). Otherwise, some authors suggested hydrothermal variations also as the trigger for the uplift phase (Bonafede and Mazzanti, 1998).
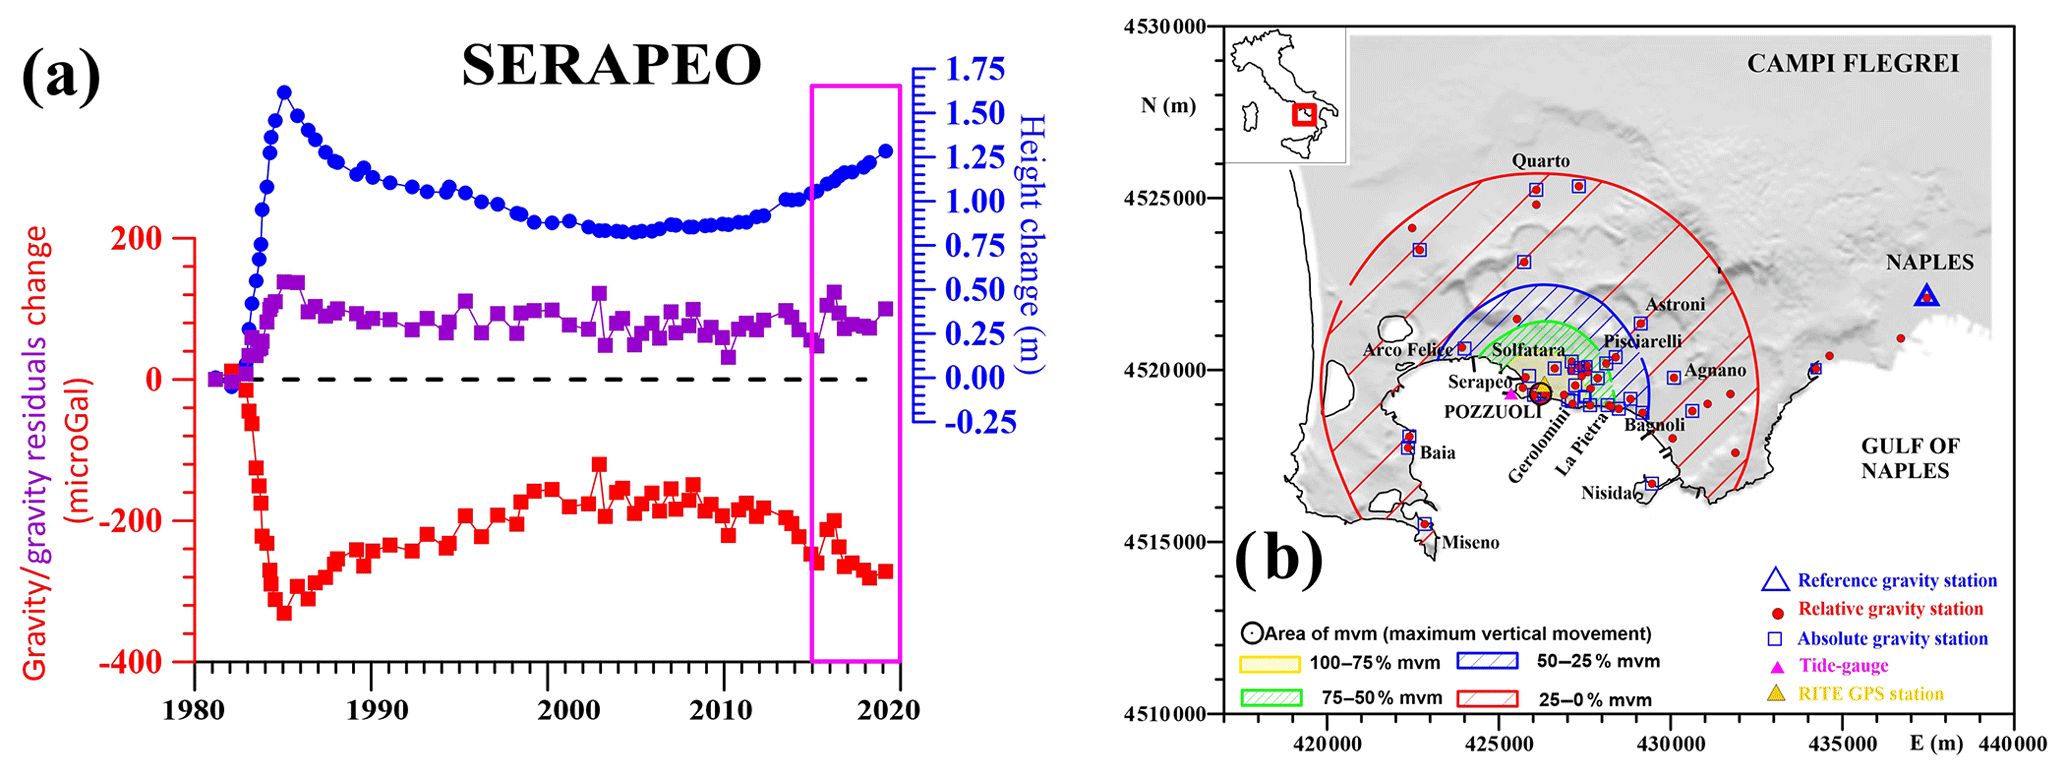
Figure 1(a) Gravity (red full squares) and height (blue full points) changes from 1982 up today at the Serapeo station (see text for details) and related gravity residuals (violet full squares) after that the effect of the elevation changes have been subtracted. The pink rectangle highlightes the discussed time interval. (b) Present day relative (red full points) and absolute (blue open squares) gravity networks at the Campi Flegrei. The blue open triangle indicates the absolute gravity station in Naples that is the reference station for the relative network. The pink and yellow triangles in Pozzuoli (along the coast in the center of the caldera) respectively indicate the tide-gauge in Pozzuoli Harbor and the RITE permanent GPS station. The hatched concentric circles show the schematic representation of the vertical ground movements pattern (see text for details). The area is divided into four sub-areas represented in terms of percentage of the maximum vertical deformation (mvm) occurring in the center of the caldera and indicated with a black open circle.
Since the mid of 1990s, but mostly evident from 2000, the inverse Δg∕Δh correlation is observed only over the long-term, except that during some short periods of renewed uplifts when it is visible also on the short-term changes (e.g. 2013–2015 and 2016–2017) (Fig. 1a). In the period 2000-2017 the gravity changes, sometimes at the limits of statistical significance, generally affect very limited areas occurring mostly along the east coastal strip of Pozzuoli and in the Solfatara-Pisciarelli area, suggesting the effect of localized and rather shallow sources. Starting from June 2013, temporal oscillations are visible in the ratio Δg∕Δh which suggest the alternation of filling/ emptying phenomena in shallow systems and also that the effects due to deep sources may be excluded at least for short periods.
From 1981 gravity changes are detected by means of relative gravity measurements carried out on a dense network presently formed by 44 stations (Fig. 1b) each coinciding with, or very close to, benchmarks of the levelling circuits (e.g. Berrino et al., 1984; Berrino, 1994). The reference point is the absolute gravity station in Naples (blue open triangle in the Fig. 1b), outside the volcanic area, whose longtime stability has been periodically checked through the repetition of the absolute measurements, firstly carried out on 1986 (Berrino, 1995). It is also checked indirectly by the comparison between gravity changes independently obtained by relative and absolute measurements at the station on Mt. Vesuvius (e.g. Berrino et al., 2013, 2015). The reference station also belongs to the “Italian Zero Order Gravity Net” (IZOGN-1995; Berrino et al., 1995; Berrino, 2020). Two absolute stations were also set up in the center of the Campi Flegrei caldera on selected benchmarks to validate the long-term gravity changes obtained by relative measurements.
Absolute measurements, performed on the Neapolitan volcanoes from 1986 to 2012, were commissioned or carried out in the framework of cooperation with the Istituto Nazionale di Ricerche Metrologiche (INRiM – Turin) using their transportable instrument (IMGC and since 2005 the new IMGC-02, D'Agostino et al., 2008). The replacement of relative gravity networks with the absolute ones on Neapolitan volcanoes is one of the target to improve the volcano monitoring system. This has been now possible due to the availability of a portable field absolute gravimeter (the micro_g-LaCoste A10#39) owned by the Osservatorio Vesuviano, Section of Napoli of the Istituto Nazionale di Geofisica e Vulcanologia (INGV-OV), at the end of 2014 (Berrino et al., 2015). This instrument, permitting very fast and easier field operations, will allow a more frequent measurements and more frequent integration of relative and absolute measurements, much more monitored sites and the opportunity to replace the relative networks with absolute ones. This avoid loss of long-term information and is a big benefit for repeated measurements on networks that are necessary to detail the space-time evolution of gravity and the associated processes. All this can be translated into large advantages, such as saving of human resources, survey's time and costs.
Therefore, in June 2015 we established the first absolute gravity network of the Neapolitan volcanoes in Campi Flegrei. This is one of the few cases of dense absolute gravity network, since at most, as in the case of the Italian active volcanoes, absolute measures are carried out on few stations in strategic points or on a large-scale network (e.g. Berrino, 1995, 2000; Behncke et al., 2006; Berrino and Corrado, 2008; D'Agostino et al., 2008; Greco et al., 2012, 2013).
Data acquired and absolute gravity changes over the 2015–2019 time interval (enclosed in the pink rectangle in Fig. 1a) are presented and discussed with the aim of determining the real development that field absolute measures can bring to a monitoring system.
The Campi Flegrei absolute gravity network presently consists of 34 sites coinciding with, or close to, the relative gravity sites and distributed over the whole area inside the caldera (Fig. 1b). From 2015 to 2019 some stations that showed a very high local noise, mostly of anthropic origin, have been discarded (e.g. Miseno, Serapeo, Pozzuoli promenade) and settled again in very close sites. Furthermore, by the end of 2017, 3 sites in the Solfatara crater are no longer measurable due to the temporary inaccessibility of the site. Two additional stations are located in Naples outside the edge of the caldera; one of them (blue triangle in Fig. 1b) is the reference station for the relative gravity network. A greater concentration of sites is along the coastline, from Bagnoli to the Pozzuoli Serapeo, and in the area from the coastline to Solfatara-Pisciarelli (Fig. 1b). Those are the areas where respectively fall the zone of maximum uplift and where the seismic/geochemical activity is concentered. Here, 20 stations are located on an area of about 2×3.5 km (7 km2 with a distribution of about 3 stations per km2).
Absolute gravity field surveys were carried out on the whole network in June 2015 (in between two consecutive relative campaigns), in February 2017 (just before the annual relative gravity survey), in October 2018 and in October 2019. At the end of October 2017, we also measured some selected sites of the network. During the time interval 2015–2019 a phase of slow uplift (about 1 cm yr−1 – Bulletins of Volcanic Monitoring – http://www.ov.ingv.it/ov/it/bollettini.html, last access: 21 August 2020) restarted accompanied by a small increasing seismicity.
Absolute gravity measurements are collected with a ballistic absolute gravimeter that works using a free-fall method (i.e. a test mass is dropped in a vacuum dropping chamber) and the absolute g value is obtained through the reconstructed trajectory of the dropping mass, subjected to the gravity field, and measuring the time it takes to fall a specified distance. Because the final g value is a statistical one, enough drops are necessary in order to obtain an absolute g value whose statistical precision is less than the system uncertainty (∼10 µGal). Data have acquired during several sets; the typical set up parameters for field measurements in high-speed mode, length about 30 min as suggested by the Manufactures, is made by 6–8 sets each with 100–150 drops. If we use this, 8 sets and 120 drops (for a total of 960 drops) are set up. However, more frequently and due to the high level of noise, the instrument parameters are set up for sessions of 1 h (20 sets each with 120 drops for a total of 2400 drops) to obtain reliable values of g.
The dedicated software “g9” automatically acquires absolute gravity data, provides the real time processing and the automatic data storage. It also automatically corrects the measured g value for the gravity changes due to the solid Earth tides, selecting the Tide Correction ETGTAB routine, and oceanic loadings, polar motion and local atmospheric pressure change effect (for details see micro-g_LaCoste “g9” User's manual; http://www.microglacoste.com/pdf/g9Help.pdf, last access: 21 August 2020). The values are not reduced to the ground, but are referred to the instrumental constant height of measure (0.72 m). This is possible because we use the absolute values exclusively for the evaluation of the temporal variations of g, and thanks to the fact that all g values measured at all benchmarks refer to a fixed instrumental measurement height, it permits to avoid an additional error due to the reduction to the ground or to another height.
The distribution of the absolute gravity changes (Δg) measured during the three consecutive time intervals when data were collected on the whole network, i.e. June 2015–February 2017, February 2017–October 2018 and October 2018–October 2019, are shown in the Fig. 2. The gravity changes plotted with a contour interval of 10 µGal in consideration of the errors on the measurements, resulted in general of few µGals, anyway within the declared accuracy and repeatability for this type of instrument that are ±10 µGal. The considered error, variable from station to station mainly according to the local noise, is the final combined uncertainty and, being it a statistical uncertainty, also depends by the acquisition set up of the instrumentation. The final uncertainty is calculated considering both the statistical uncertainty (given by the set scatter – i.e. the standard deviation- divided by the square root on the number of sets) and the total systematic uncertainty (based on the estimated uncertainties for many different components of the measurement: Modelling, System, Environmental and Set-up). For the latter, we consider a value of 3.34 µGal as the best representative value of the sum of all these contributions; in this value, the estimated uncertainty for the Gradient, (i.e., the measured local value), is not considered. Later, we apply this reduction in a non-automatic way and if necessary only for specific use of the measured absolute value, also to be free to reduce the measured g value at the most convenient height; we calculate the related uncertainty in function of the error on the measured local vertical gravity gradient.
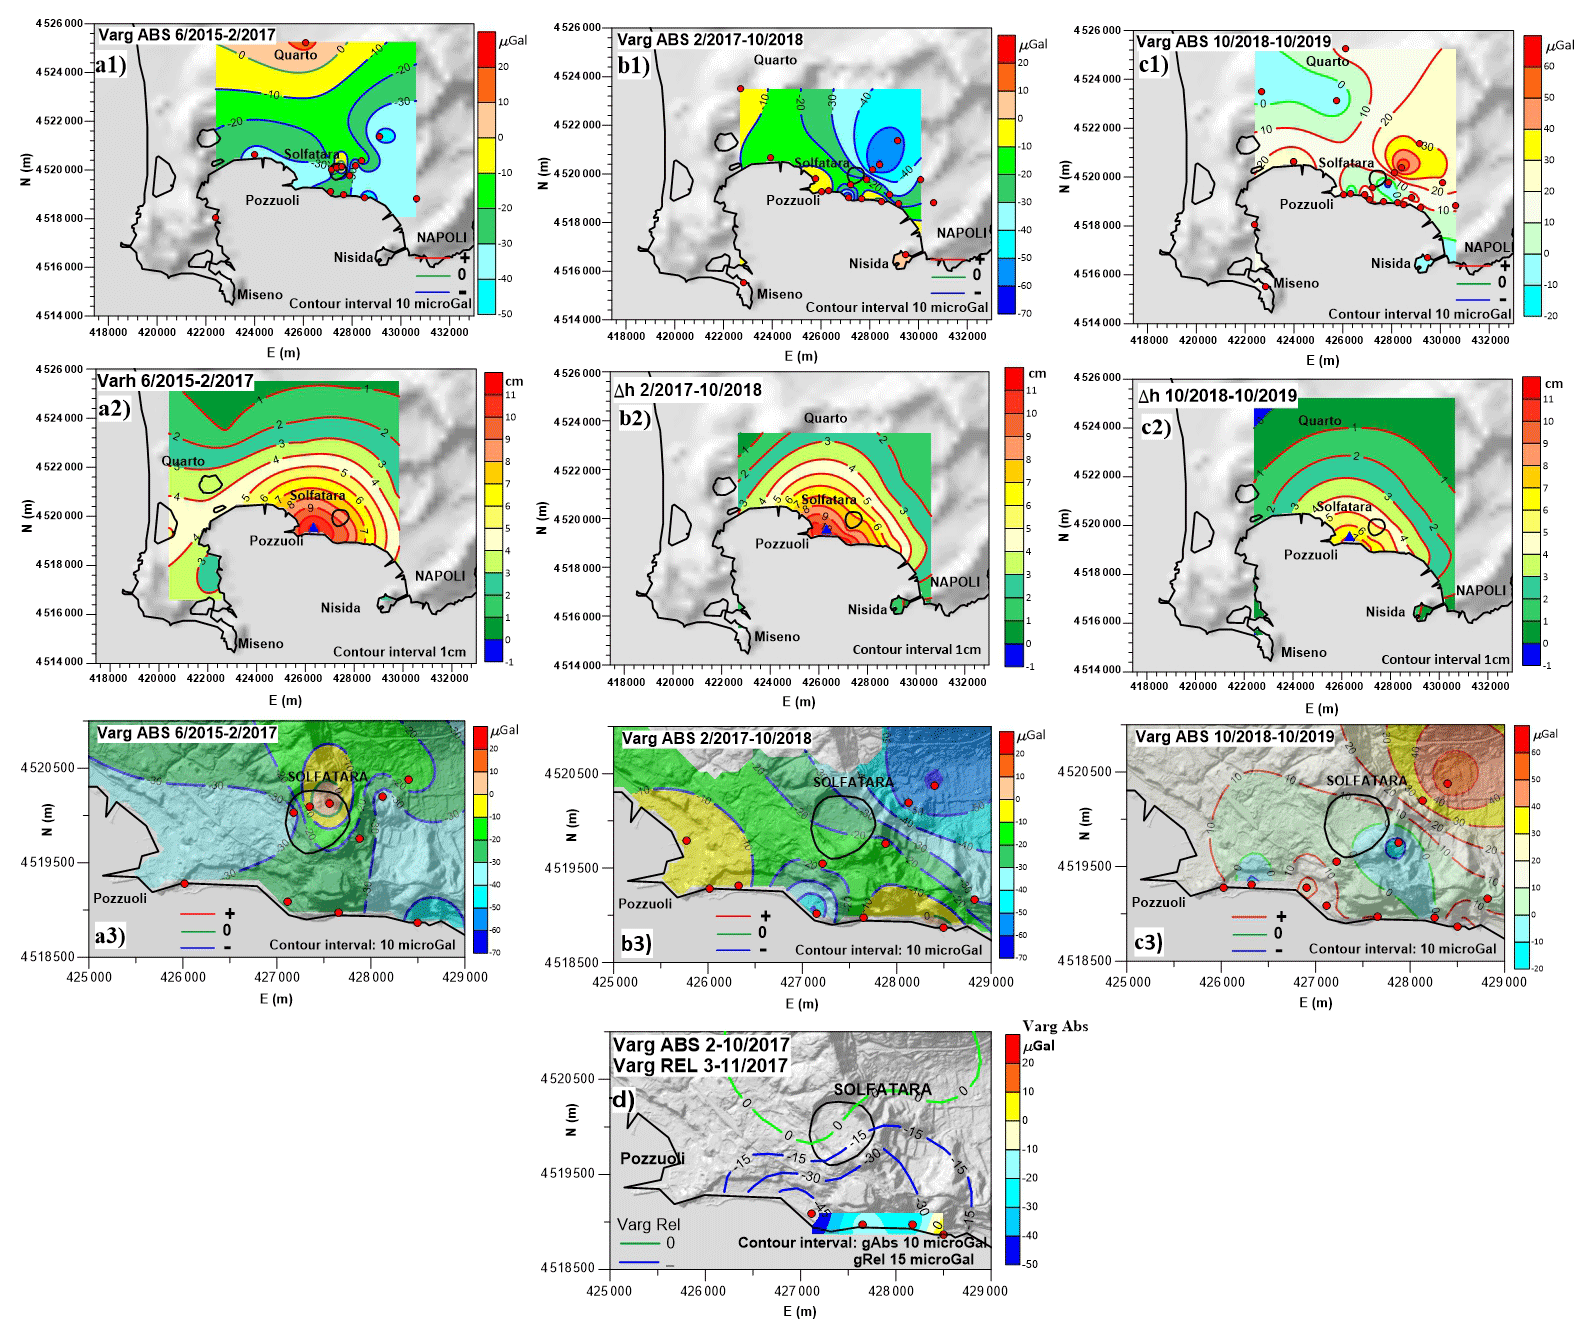
Figure 2Areal pattern of the absolute gravity changes from June 2015 to October 2019, represented with a contour interval of 10 µGal considering the uncertainties on measures. In each column are respectively shown (from the top to the bottom) the absolute gravity changes, the height changes (see text for details) and a zoom of the gravity changes over the Pozzuoli East coastline-Solfatara-Pisciarelli-Astroni area. Columns (a), (b) and (c) respectively refer to changes over the June 2015–February 2017, February 2017–October 2018 and October 2018–October 2019 time intervals. The red full points in (a1), (b1), (c1) and (a3), (b3), (c3) indicate the absolute gravity stations used for plotting; the blue full triangle in (a2), (b2), (c2) represents the RITE permanent GPS station. At the bottom of the figure, in (d), the areal pattern of the February–October 2017 absolute gravity changes (filled field) at four stations (red full points) along the east coastline of Pozzuoli is shown. In it the space distribution of relative gravity changes in the period March–November 2017 is also represented for comparison; the blue and green contour lines respectively indicate negative and null gravity changes.
Finally, even if the combined uncertainty is in general less than 10 µGal, but considering A10 is designed to be a 10 µGal field instrument, the significant gravity change is considered to be 10–15 µGal.
Figure 2, for each time interval, also shows:
-
the elevation changes (Δh – panels a2, b2 and c2) computed at each gravity benchmark from the RITE permanent GPS data in the way later described;
-
a zoom of each Δg (panels a3, b3 and c3) in the area of major interest (from the east coast of Pozzuoli to Solfatara – Pisciarelli zone).
During the analyzed periods, and if levelling data were not available, data acquired at the RITE permanent GPS station (Fig. 1b) were used to compute the height changes at any gravity station. Those last are computed using coefficients calculated for each gravity station by means of the linear regression correlating the height at the RITE permanent GPS station and that measured by levelling surveys at the gravity stations from 2000 to 2012, as was done in past using the tide-gauge data recorded at the Pozzuoli harbor (Berrino, 1994, 1998). The error on the vertical component of the GPS is declared to be ±3 mm.
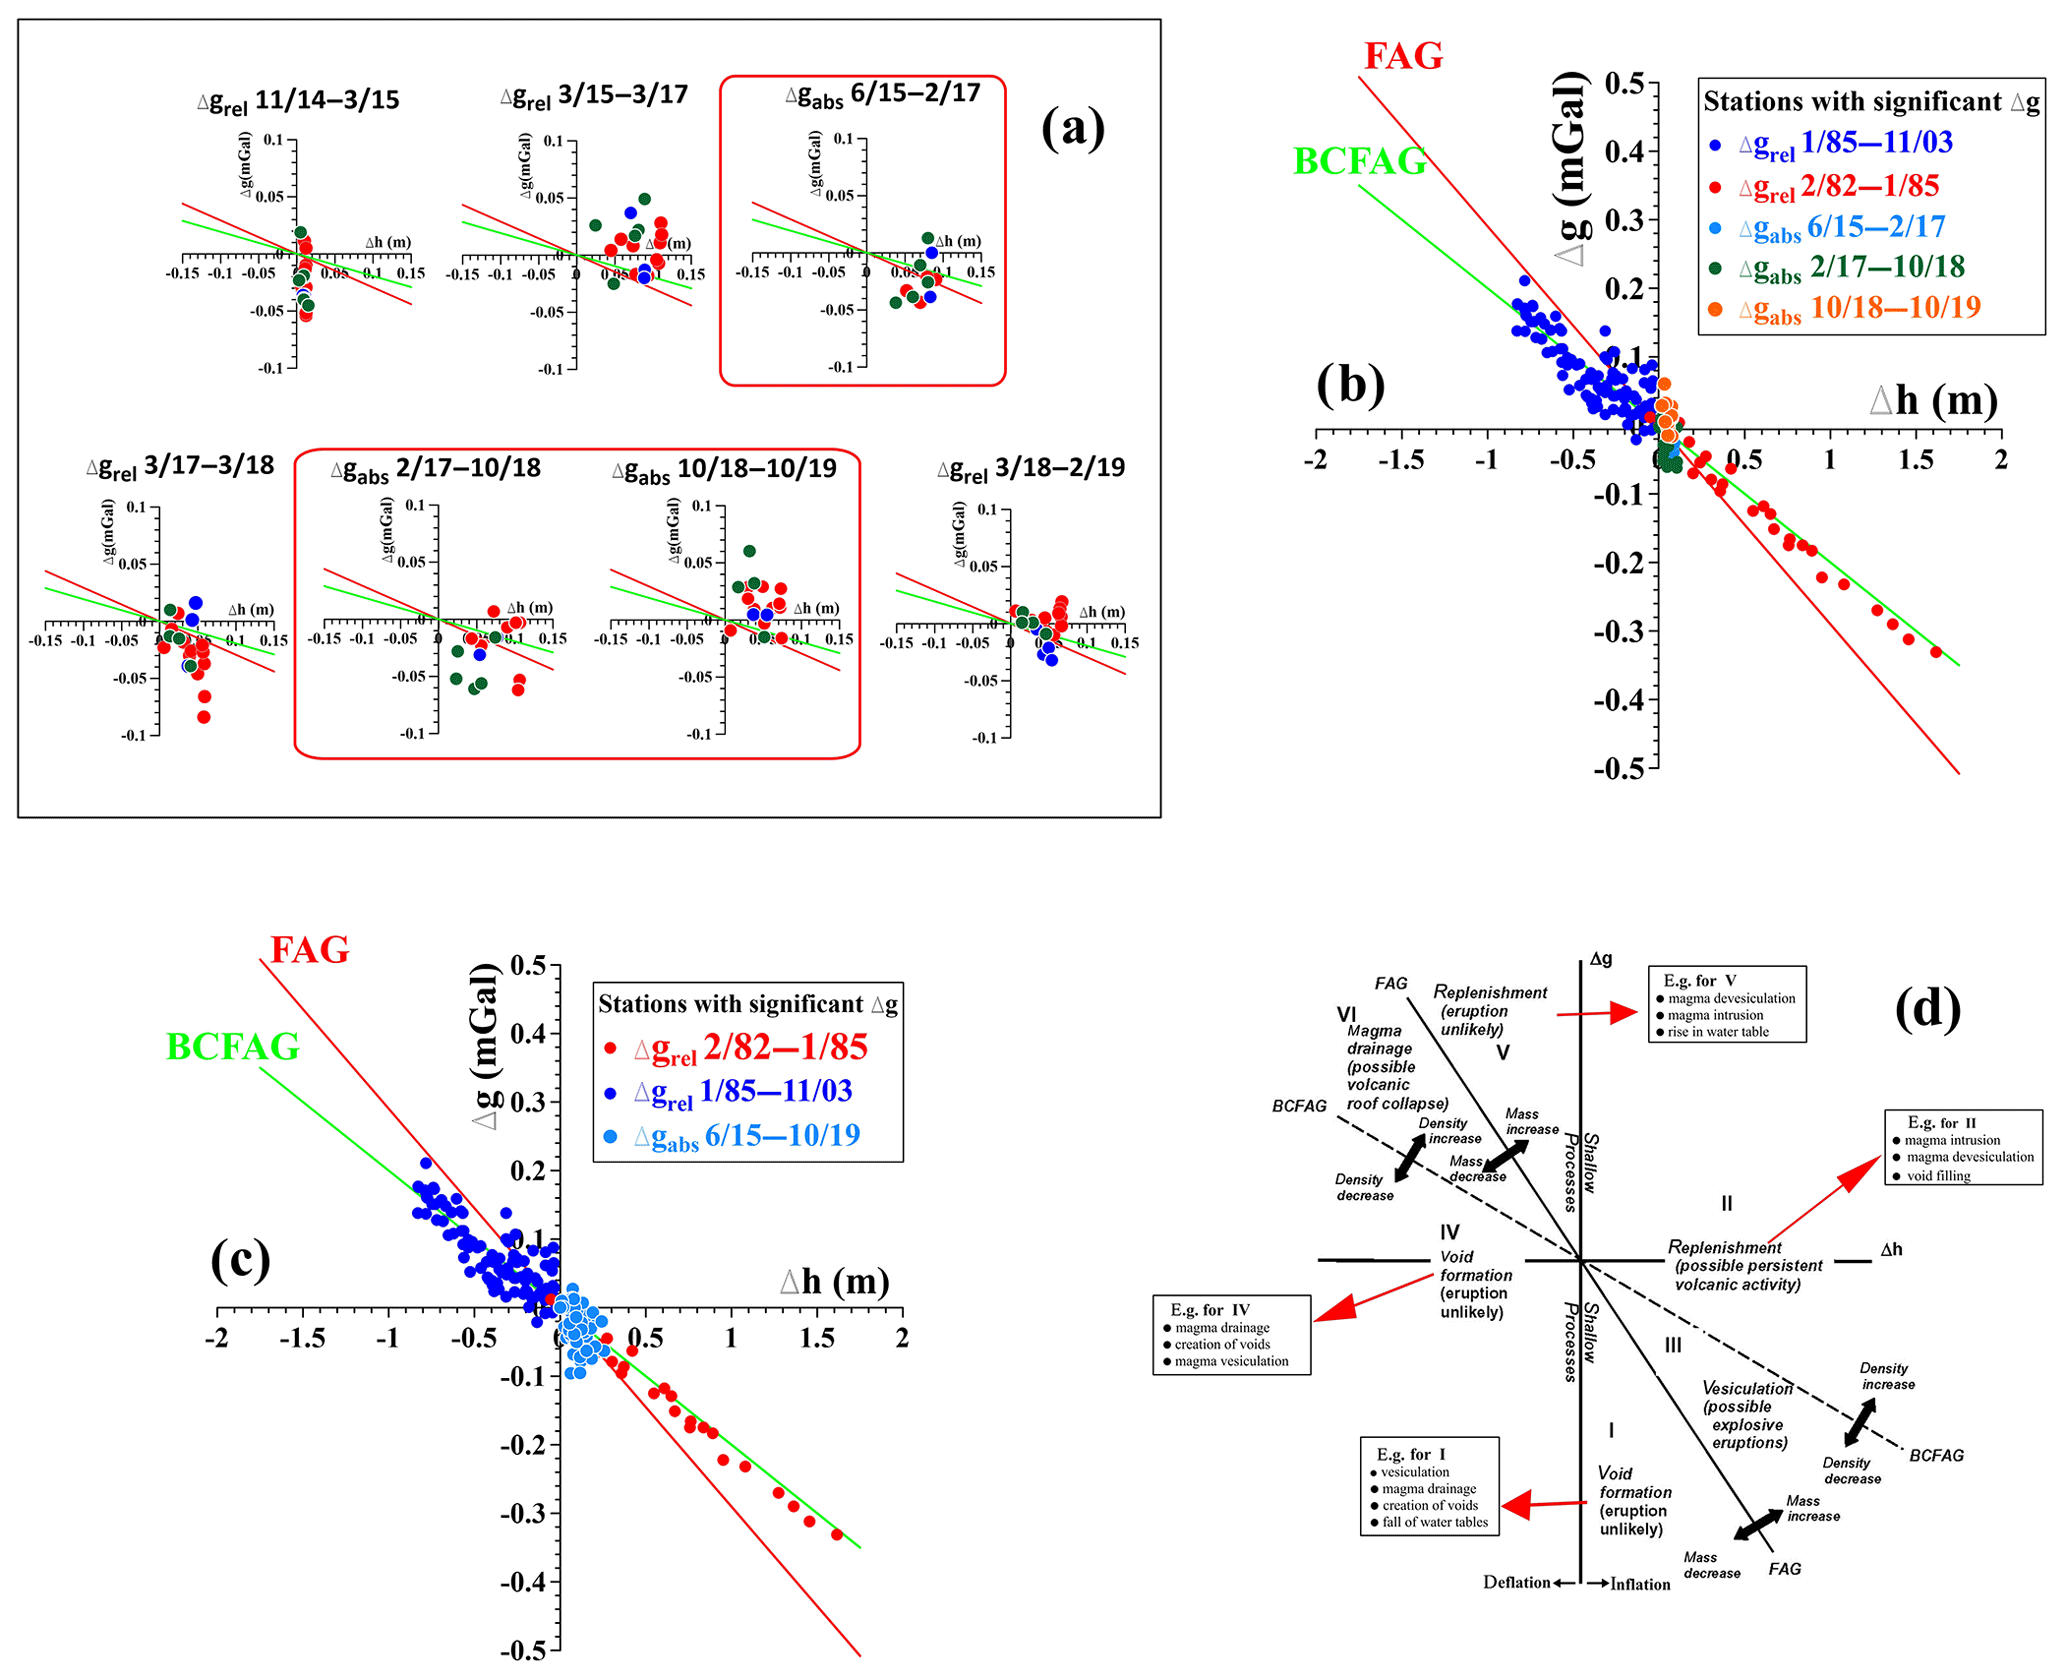
Figure 3Δg∕Δh correlation for several time intervals compared with observed Free-air gradient (FAG – red line) and corrected Bouguer gradient (BCFAG – green line). The errors are contained in the size of the symbols. In (a) the ΔgABS∕Δh regression (enclosed in a red rounded rectangle) on the time intervals of surveys extended to the whole network are shown together to some ΔgREL∕Δh regression close in time. In (b) and (c) the short-term and the cumulative June 2015–October 2019 ΔgABS∕Δh regressions are compared with the gradients observed during intense uplift and subsidence phases. In (d) the diagram for interpreting the variations in gravity/height changes (Δg∕Δh) in terms of mass changes (after Brown and Rymer, 1991; Berrino et al., 1992; Gottsmann et al., 2003) is also inserted; it is the combination of the diagrams in the two last mentioned papers (for all see text for details).
At the bottom of the figure, the areal gravity changes detected on few stations on February–October 2017 time interval are shown (Fig. 2d) together with the results from relative gravity measurements over a very close time interval and zoomed on the area covered by absolute measurements.
A description and discussion of what observed during each period, including the time interval February–October 2017, follows.
3.1 June 2015–February 2017 gravity changes
The comparison among absolute g values measured in June 2015 and February 2017 was possible only for 14 stations because some sites mostly located along the coastline and at the edge of the caldera, showed abnormal or dubious changes and some stations were relocated or new. Anyway, the 14 useful stations permitted to define the background field and to detail it in the presently most active areas Solfatara-Pisciarelli.
The space distribution of the gravity changes are represented in the map of Fig. 2a1, where also the useful stations are shown with red full points. The absolute gravity change field has been drawn with a contour interval of 10 µGal taking into account the total uncertainty on each final g value (generally between 2 to 6 µGal) and the instrumental repeatability, as declared by the instrument Manufacturer and also verified in instrumental testing (Berrino et al., 2015).
The comparison shows that during the time interval June 2015–February 2017 a general gravity decrease occurred in the whole Campi Flegrei area. The background field defines a NS linear trend showing changes from +10 to −30 µGal (Fig. 2a1), respectively at the North edge of the caldera and in its center along the coastline; this last is the area mostly affected by the significant elevation changes. The field is disturbed by a well-defined and closed area located in the Solfatara-Pisciarelli zone with null gravity changes or within the error, which however respect to the surrounding area is characterized by a high horizontal gradient leading to a relative increase of about 30 µGal (gravity values rapidly change in a narrow area from −30 to 0 µGal). The larger gravity decrease (−40 µGal) is restricted to the Astroni station, at NE of the Solfatara crater (Fig. 2a1). Figure 2a3 shows a zoom over the central area, from the coastline to Solfatara-Pisciarelli zone.
The background gravity decrease and its pattern are in a good agreement with the uplift occurred during the same time interval (maximum of 11.5 cm), as deduced by GPS network (Fig. 2a2). Elevation change field shows that the maximum uplift is positioned along the east coast of downtown Pozzuoli (in correspondence of the RITE GPS station – Fig. 1b) and symmetrically decreases to the edge of the caldera where is practically null. This replicates the same quasi-bell-shaped geometry detected during the big uplift and the following subsidence episodes (Corrado et al., 1977; Berrino et al., 1984; Dvorak and Berrino, 1991). It may justify almost totally the background gravity changes, particularly the most significant ( µGal) from the coastline to the Solfatara-Pisciarelli (excluding the Astroni site which shows a very local effect). In fact, the uplift in this area varies from +11.5 to about 5 cm (Fig. 2a2) that is equivalent to a gravity change ranging from −33 to about −15 µGal, calculated using the value of the locally measured vertical gravity gradient (Berrino et al., 1984; Berrino, 1994).
An attempted interpretation of the general pattern of both background gravity and elevation change fields using a simple geometrical mass (e.g. a spherical body) suggests that its depth is about 3 km. It has been estimated considering the simple formulas that take into account the shape of the Δg field and the distance at which it is the half of Δgmax (e.g. Grant and West, 1965; Sazhina and Grushinsky, 1971).
On the contrary, the localized gravity variation in the Solfatara-Pisciarelli area (that is a relative gravity increase respect to the surrounding area), is not justified by the local height changes, indicating positive gravity residuals, of +20 and +30 µGal, which may be associated to a small underground mass redistribution in a restricted area. We obtained gravity residuals after removing the effect of the elevation change from gravity changes, using the measured local vertical gravity gradient. The error on the residuals is variable as it depends on the errors on the correction of the height change, on the vertical gradient and on the variations of g. We evaluated the error on the residuals in ±8 µGal, considering the maximum elevation change occurred over the analyzed time interval and the maximum error on gravity value.
The amplitude of residuals and the limited extension of the anomalous area suggest that the replenishment might occurred in a very shallow and small area and can be most likely associated to the dynamics of the local hydrothermal system, such as fluid injections at shallow depth. In fact, an evaluation from gravity residuals around the Solfatara area, using again a simple source as mentioned above, indicates a depth of about 300 m b.s.l. (that is about 400 m b.s.l. respect to the ground).
3.2 February–October 2017 gravity changes
At the end of October 2017, measurements were carried out at few stations located along the east coastline of Pozzuoli (Fig. 2d). Unfortunately, an instrumental malfunction did not allow checking the entire network. The small areal distribution of the absolute gravity changes (filled field in Fig. 2d) shows a gravity decrease with a main E–W trend. The maximum gravity decrease is about −55 µGal at the station closest to the area of maximum vertical deformation. This is confirmed by relative measurements carried out over the whole network at the beginning of November 2017 (few days later), which respect to March 2017 show a general gravity decrease mostly concentrated along the east coastline of Pozzuoli (blue and green contour lines in Fig. 2d). Errors on the relative field survey were respectively ±13 and ±4 µGal. The maximum value of about −50 µGal occurs at the same station affected by the maximum absolute gravity decrease. Taking into account the errors and the resolution of the two different methods, it results that absolute and relative measurements are in a very good agreement, in terms of both amplitude and distribution. The detected gravity changes suggest the occurrence of loss of mass (e.g. loss of mass due to the escape of fluids in a porous medium) which, as confirmed by relative measures, is mainly concentrated along the coastline, at a depth of about 1.7 km if considering a simple source (e.g. a sphere) for an attempt of interpretation. Obviously, we cannot exclude seasonal effects (e.g. fall in the water table) due to the analyzed time interval (and considering that severe drought characterized the 2017 summer).
3.3 February 2017–October 2018 gravity changes
25 sites were measured during the field survey carried out on October 2018, including two new benchmarks (along the coastline and along Via Campana, halfway between Serapeo and Quarto) and the replacement of some others because damaged or proved to be affected by high anthropogenic and/or meteo-marine noise. The collected data have been compared with those acquired in February 2017 and October 2017.
The comparison between October 2017 and October 2018 surveys was possible for only four sites along the east coast line of Pozzuoli, and did not show any significant gravity change.
On the contrary, the comparison of data on 19 stations (Fig. 2b1) over the whole network and a longer time interval (February 2017–October 2018 – Fig. 2b1) indicates a general gravity decrease and an extension of the field observed in the previous period towards the central-eastern area of the caldera. It has an almost SW-NE background trend and is mostly concentrated on few stations along the east coast line of Pozzuoli (maximum gravity decrease of about −53 µGal) and in the Pisciarelli area (−60 µGal). A restricted and closed area of maximum gravity decrease is detectable in the Pisciarelli area. As for the previous discussed cases, a zoom of the space distribution of gravity changes over the coast line-Solfatara–Pisciarelli area is shown in the Fig. 2b3. The general field of the gravity changes does not inversely reflect the vertical deformation pattern (Fig. 2b2) as in the previous time interval; this suggests that the measured gravity variations are not compensated by elevation changes and may be almost totally considered as gravity residuals. This also suggest the occurrence of mass/density decrease, possibly an empting process like for example the escape of fluids (void “formation”) in a porous medium. Taking into account the extension of the area affected by the most significant changes, the deduced process may occur at rather shallow depth (i.e. some hundreds of meters). In this case also, we cannot exclude seasonal effect (e.g. fall of water table) due to the compared months.
3.4 October 2018–October 2019 gravity changes
We measured 30 stations but only 24 of them were useful for comparison in October 2019. Generally, we observed no significant gravity changes (Fig. 3c1) over the whole caldera during this time interval. However, we measured a statistically significant gravity increase only at four stations in the central-eastern sector of the caldera (Pisciarelli Tennis Hotel, Pisciarelli Soffione, Agnano, Astroni), on two not close stations along the east coast line of Pozzuoli (La Pietra Villa Anna and Lungomare Chiesa Sacro Cuore) and at the stations in Arco Felice, west of Pozzuoli.
The significant increases are between 28 and 32 µGal; except at the Pisciarelli Tennis Hotel station where an increase of 60 µGal was measured which cancels the decrease of the same amplitude observed over the period February 2017–October 2018 (Ref. Fig. 2b1). In addition, the variometric field is in general opposite to that all negative one previously observed. Also during this time interval, the significant gravity change in the Pisciarelli area does not show a clear inverse linear correlation with the height changes. Therefore, we can assume it mostly indicates an inverted process of mass/density increase, like a small replenishment (i.e. injection of fluids) in a rather shallow source, in general of the order of hundreds of meters as mentioned above.
We can conclude that also the absolute measurements, as suggested by the relative measures since 2013, indicate an ongoing process characterized by alternated periods of decrease/increase in mass/density in rather shallow depth of some hundreds of meters (e.g. removal/injection of fluids from/to the local hydrothermal system through existing fractures/voids).
This is coherent with the results of several authors, as for example Siniscalchi et al. (2019), who suggest the presence in the central-eastern part of the caldera of a conductive clay cap interrupted beneath the Solfatara-Pisciarelli area due to the presence of faults related to the geochemical emission. They also suggest the presence, at the eastern outer flank of the Solfatara, of a resistivity vapour-dominated reservoir whose top is located at about 500 m b.s.l.
In addition, Carlino et al. (2012) indicate, from data of an old drill close to the Pisciarelli area, a shallow aquifer in the upper 200 m and a deeper one at 1400 m. Results from a recent deep drilling in the eastern sector of the caldera indicate high permeability and porosity values. This suggest the presence of underground fractures/voids of relatively hard rocks at relatively shallow levels (<1000 m) also confirmed by an inverted temperature gradient below 400 m and the increasing total gas monitored during drilling (Carlino et al., 2018). Moreover, repetitive drops of pressure recorded during several tests of the drilling have been related to fluid flow through the contacting rocks between 422 and 501 m depth. The effects of hydrothermal fluids circulating in a highly fractured system was also deduced by heat flow data measured in Campi Flegrei (Corrado et al., 1998); those authors also indicated that a good estimate of the thickness of the aquifer is about 1 km.
To verify and refine the previous interpretations, we drew the direct correlation between absolute gravity and height changes for all the analyzed time intervals. We interpreted the gravity/height gradient in terms of changes in mass or in density when it departs respectively from the free-air (FAG) and the Bouguer + Free-air (BCFAG) gradients, indicating the effect of height changes and of the deformation, respectively (e.g. Berrino et al., 1992). The diagram shown in the Fig. 3d, added to understand quickly the distribution of recent data, explained this. Brown and Rymer (1991) proposed that diagram also applied to Campi Flegrei (Berrino et al., 1992), and later developed (Gottsmann et al., 2003). The diagram shown in the Fig. 3d is a combination of the diagrams in Berrino et al. (1992) and Gottsmann et al. (2003).
Diagrams in Fig. 3a show the Δgabs∕Δh correlations, highlighted in a red box; only data from field surveys carried out overall the network and the stations that generally show the most significant variations, i.e., those located in the center of the caldera, are considered. For this analysis, the selected stations have been divided into three groups, according to the area in which they are located, and namely:
-
the coastal strip (from Nisida/Bagnoli to Arco Felice – red symbols) called “zone1”;
-
the road crossing between the coastline and the area of Pisciarelli (from Agnano – Accademia Aeronautica to the entrance of the Solfatara – blue symbols), called “zone 2”;
-
the area including the stations located on the internal north (when measured) and the eastern outer edges of the Solfatara crater, and those in the Pisciarelli-Astroni-Agnano area (green symbols), called “zone 3”.
In order to verify the evolution of the dynamics on short time, we considered separately the single intervals among consecutive absolute field surveys. Absolute field surveys were sometimes carried out far from the relative ones; however, the comparison with the relative data acquired before and after the absolute measures allows better defining the time interval during which the observed events happened. Therefore, we compared the Δgabs∕Δh correlations with the closest Δgrel∕Δh correlations from relative measurements.
The analyzed gradients (Fig. 3a) do not show in general a clear linear regression; they are difficult to interpret in terms of mass/density changes and can reflect noise during the gravity survey, as also suggested by Gottsmann et al. (2003) for gravity/height correlation at Campi Flegrei in previous time intervals when similar gradients have been observed. In other volcanoes (e.g. Askja, Krafla and Kilauea), similar gradients have been suggested as reflecting shallow processes of hydrothermal system (fluid migration) or dyke emplacement (Rymer and Tryggvason, 1993; Rymer et al., 1998, 2000).
Although they are very scattered, it is clear that in general the overall uplift get along with an “excesses” gravity decrease or increase. Anyway, their constant distribution rather close to the vertical axis and their alternating fall into regions I and II suggest shallow processes (as previously said depths of some hundreds of meters, sometimes within 2 km), as also deduced by the space distribution of gravity changes, also reflecting an overall alternation of sub-surface replenishment and emptying.
The absolute gravity/height gradient displayed by the June 2015–February 2017 changes (Fig. 3a) shows that the most of the significant gravity changes fall in the region I, corresponding to stations mostly located in “zone 1” and “zone 2”. This suggests that these areas are subjected to an emptying process (e.g. void “formation” due to escape/migration of water/fluids in a porous medium). The rest of the points shows a distribution close to the Free-air (FAG) and the corrected Bouguer (BCFAG) gradients, or not significant values being within the errors (like the only one point in region II). This supports what said above that the general gravity decrease and its pattern are in good agreement with the uplift. Anyway, considering the amplitude of both gravity and elevation changes, the global distribution of the points also indicates that the absolute gravity changes are due to rather shallow processes. In order to delimit the period in which this phenomenon occurred, the gradients obtained during a very close period (March 2015–March 2017 – Fig. 3a) from relative measures, including the time interval of absolute measurements, has been considered. The relative gravity changes show again a not clear linear correlation with the height changes, and show themselves as a little cloud departing from the vertical axis. Most of the points fall in the region II suggesting a possible mass/density increase, like a replenishment process. As previously suppose, looking at the regression from absolute measurements during the June 2015–February 2017 time interval, this replenishment probably occurred in a time interval between March and June 2015. It has been later followed by a possible loss of mass (emptying process), as detected by absolute measurements. The defined time interval for the replenishment (March–June 2015) is also confirmed by the Δgrel∕Δh correlation of the immediately preceding period (November 2014–March 2017 – Fig. 3a) showing points mainly concentrated in the region I, suggesting a possible emptying process. They are located mainly along the vertical axis, indicating that gravity changes are due to processes occurring at shallower depth (always no less than some hundreds of meters) respect to those implied during the following time. We can conclude that from 2014 to 2017 an alternating process of emptying and filling occurred. Anyway, the distribution of points close to the axes does not indicate the effect of deep sources.
The mass/density decrease process seems to continue in the time interval February 2017–October 2018 even if mainly affecting the “zone 3” and only 2 points in the “zone 2”. The rest of the points fall on the FAG – BCFAG gradients or they are not significant being within the error. The comparison with the regression between relative gravity and elevation changes over a shorter period (March 2017–March 2018) confirms what said and suggests that this phenomenon initially affected mainly the “zone 1”.
We observed an increase of mass/density extending the analysis until October 2019, indicating a replenishment process. It mainly affects “zone 1” and “zone 3”, and the comparison with relative measurements over the period March 2018–February 2019, straddling the two absolute measures, suggests it lasted until February 2019. The Δgrel∕Δh March 2018–February 2019 regression shows a cloud of points mainly close to the FAG-BCFAG regressions suggesting a main effect from height changes, apart from few points in “zone 1” and “zone 2”.
Once again, there is still an alternation of decrease/increase in mass/density, suggesting an alternation of emptying/replenishment processes, and the distribution of the points rather close to the axes again suggests processes occurring at shallower depth (always no less than some hundreds of meters), so excluding the effect of deep sources.
To reinforce how much previously deduced, confiding in the ascertained good agreement between relative and absolute gravity measurements and considering both, we tried to calculate the space-time intermediate gravity changes (i.e. March–October 2018, October 2018–February 2019 and February–October 2019) by the global temporal trend of the gravity changes at all the useful stations. In Fig. 4 we plotted the corresponding variometric fields and the curves represented with a contour interval of 15 µGal in consideration of the errors on the two types of measurements.

Figure 4Calculated gravity field integrating relative and absolute gravity changes and the related Δg∕Δh regression over the period March 2018–October 2019 are represented. In the Δg∕Δh diagrams in (e) the errors on Δg are also represented; the error on Δh is contained in the size of the symbols.
This attempt confirms the conclusions previously deduced, clearly indicating that during 2019 (Fig. 4c) the entire area has been affected by not statistically significant changes, except on two distant stations located on the eastern coast of Pozzuoli. On the contrary, significant gravity changes occurred prevalently during the 2018, also showing the alternation of general gravity decrease (March–October 2018 – Fig. 4a) and gravity increase (October 2018–February 2019 – Fig. 4b). These two calculated fields show almost the same shape and the same amplitude; their sum is practically null as confirmed by the global field obtained by relative measurements (March 2018–February 2019 – Fig. 4d) showing no significant change over the longer term. The calculated fields in Fig. 4 also confirm the occurring of alternated period of mass/density decrease to mass/density increase. Of course, considering the compared periods, we cannot neglect seasonal effects. A computation of the seasonal effect in the area is not very simple due to the local complex hydrological situation. Anyway, considering the extreme of the annual/seasonal fluctuation of the shallower water table level in several wells (e.g. Valentino and Stanzione, 2004; Allocca et al., 2019), and taking into account the high value (about 40 %; e.g. Carlino et al., 2018) of porosity in shallower medium, this effect can be evaluated ranging from 2 to 16 µGal in different areas. The Δgcalc∕Δh regressions have been also plotted for each calculated time interval (Fig. 4e); they confirm the occurrence of inverted processes of mass/density increase/decrease in time and in different zones, evidencing their differential behavior. They also highlight that no significant changes occurred during 2019, apart from a small “replenishment” effect on two single stations on the coast.
Once again the distribution of points does not show in general a clear inverse linear correlation between gravity and height changes and the proximity to the vertical axis continues to suggest the dynamic of rather shallow sources, an alternation of emptying/replenishment processes, and a rather shallow depth of the phenomenon.
The Δgabs∕Δh gradients have been compared with the gradients observed during the long-term February 1982–January 1985 and 1985–2003 (Fig. 3b respectively red and blue points) obtained by relative gravity measurements at the stations in the central areas that were affected by the most significant changes. This in order to emphasize the occurrence of shallow processes during the analyzed time interval and on short time. They indicate that the 1982 uplift and the following 1985–2003 subsidence phases can be in general due to deeper sources (about 3 km) in which mass and density changes respectively occur (Ref. for details Berrino et al., 1992; Berrino 1994; Gottsmann et al., 2003).
In the Fig. 3b the represented Δgabs∕Δh regressions are very close to the vertical axis supporting the interpretation that the observed gravity changes are due to the effect of shallower sources respect to those involved during intense bradyseismic crises both during short and long periods. This is confirmed when the cumulative Δgabs∕Δh 2015–2019 regression is considered (Fig. 3c). In both representations, the most recent distributions are similar to those observed at the beginning of the 1985 deflation phase, when the ground movement reversed (Berrino, 1994).
Many times since 2003 the alternation of superficial emptying and filling phenomena has been hypothesized in the short term (e.g. Berrino and Corrado, 2008; Minet et al., 2012a, b). This has never been observed over short-term from 1982. Also considering the area where the most significant changes occur, it suggests that the present ongoing phenomenon is a pulsating and/or transient shallow processes due for example to alternating recharge/discharge of fluids in the surface hydrothermal system, as well as suggested by other authors (e.g. D'Auria et al., 2011; Chiodini et al., 2017; Cardellini et al., 2017).
This paper presents and discusses the absolute gravity changes collected on a dense absolute gravity network at the Campi Flegrei active caldera. This is the first absolute network deployed on the Neapolitan active volcanoes where only few absolute stations have been checked since 1986.
The results of the field surveys carried out during a period of renewed slow uplift do not show in general a clear inverse linear correlation between gravity and height changes indicating a predominantly mass/density change process at rather shallow depth. In addition, a time alternation of gravity decrease/increase has been detected; it suggests an alternation of emptying/replenishment processes.
Absolute gravity data and related gravity variations show a very good agreement with those acquired by means of relative gravity measurements. Their integration has also permitted to better define the evolution of the space-time involved processes, also confirming the interpreted process of alternating fluids recharge/discharge in the superficial hydrothermal system.
Therefore, these results exclude, at least over short time and during the analyzed time interval, the direct effects due to deeper sources and then to magmatic masses.
The acquired data and their quality demonstrate the reliability of absolute gravimetric measurements even if acquired with a field instrument and in very urbanized areas heavily disturbed mainly by anthropogenic noise. They also demonstrated and confirmed the feasibility of this methodology for volcano monitoring, and that it implies large advantages, such as saving of human resources, survey's time and costs. Actually, as regard the length of the field surveys, for the present absolute and relative networks at Campi Flegrei and without snags, respectively about 5/6 and about 15 working days are usually necessary.
Finally, these results encourage the replacing of relative gravity networks with absolute ones, with all the advantages that derive from it also involving an advanced approach in the study of dynamic areas.
Data have been acquired by Giovanna Berrino and Giuseppe Ricciardi (INGV-OV). Last survey was carried out in 2019. Data are available on request at INGV-OV via e-mail to Giovanna Berrino (giovanna.berrino@ingv.it). Data will be available after approval of the Direction of the INGV-OV.
GB is responsible for the experiment, designed gravity networks, planned fields surveys, also participating to some of them, and operative procedures, carried out final analyses of data, graphics representation (maps and plots) and interpretation of results, prepared the manuscript with the contribution of the co-author. GR organized and carried out field surveys and performed preliminary analyses of data.
The authors declare that they have no conflict of interest.
This article is part of the special issue “Understanding volcanic processes through geophysical and volcanological data investigations: some case studies from Italian sites (EGU2019 GMPV5.11 session, COV10 S01.11session)”. It is not associated with a conference.
The data were been collected during field surveys co-financed by the Italian Department of Civil Defense. Data analysis and interpretation have not benefited from any financing.
A10#39 absolute gravimeter had acquired in the framework of the “VULCAMED” PON Project “Ricerca e Competitività” 2007–2013 aimed to infra-structural developments.
The Authors are very grateful to Vincenzo d'Errico for his support during field surveys, to Prospero De Martino and Carlo Del Gaudio who respectively furnished GPS and levelling data.
The Authors also thanks very much Hazel Rymer and an anonymous Referee for their useful comments and suggestions. A special thanks to the Topical Editor Simona Petrosino for her exquisite support.
This paper was edited by Simona Petrosino and reviewed by Hazel Rymer and one anonymous referee.
Allocca, V., Coda, S., De Vita, P., Di Rienzo, B., Ferrara, L., Giarra, A., Mangoni, O., Stellato, L., Trifuoggi., M., and Arienzo, M.: Hydrogeological and hydrogeochemical monitoring in the Cumae archaeological site (Phlegrean Fields, southern Italy), Rend. Online Soc. Geol. Ita., 47, 18–23, 2019.
Behncke, B., Berrino, G., Corrado, G., and Velardita, R.: Ground deformation and gravity changes on the Island of Pantelleria in the geodynamic framework of the Sicily Channel, J. Volcanol. Geoth. Res., 150, 146–162, 2006.
Berrino, G.: Gravity Changes induced by height-mass variations at Campi Flegrei caldera, J. Volcanol. Geoth. Res., 61, 293–309, 1994.
Berrino, G.: Absolute gravimetry and gradiometry on active volcanoes of Southern Italy, B. Geofis. Teor. Appl., 146, 131–144, 1995.
Berrino, G.: Detection of vertical ground movements by sea-level changes in the Neapolitan volcanoes, Tectonophysics, 294, 323–332, 1998.
Berrino, G.: Combined gravimetry in the observation of volcanic processes in Southern Italy, J. Geodyn., 30, 371–388, 2000.
Berrino, G.: The state of the art of gravimetry in Italy, Rendiconti Lincei. Scienze Fisiche e Naturali, 14 pp., https://doi.org/10.1007/s12210-020-00924-8, 2020.
Berrino, G. and Corrado, G.: 1981–2007 gravity monitoring of Italian volcanoes, in: Proceedings of the International Symposium on Terrestrial Gravimetry: Static and Mobile Measurements (TG-SMM2007), Saint Petersburg, Russia, 20–24 August 2007, 208–212, 2008.
Berrino, G., Corrado, G., Luongo, G., and Toro, B.: Ground deformation and gravity changes accompanying the 1982 Pozzuoli uplift, B. Volcanol., 47, 187–200, 1984.
Berrino, G., Rymer, H., Brown, G. C., and Corrado, G.: Gravity-height correlations for unrest at calderas, J. Volcanol. Geoth. Res., 53, 11–26, 1992.
Berrino, G, Marson, I., Orlando, L., Balestri, L., Balia, R., Bonci, L., Bozzo, E., Carrozzo, M.T., Cerutti, G., Cesi, C., Ciminale, M., Crespi, M., De Maria, P., Ferri, F., Loddo, M., Luzio, D., Pinna, E., and Rossi, A.: Rete gravimetrica Italiana di Ordine Zero. Stato di avanzamento, Proc. 14 Meeting GNGTS, 453–460, 1995.
Berrino, G., Cerutti, G., Corrado, G., De Maria, P., and Riccardi, U.: Gravity studies on active italian volcanoes: a comparison between absolute and relative gravimetry, B. Geofis. Teor. Appl., 40-3/4, 497–510, 1999.
Berrino, G., d'Errico, V., and Ricciardi, G.: Thirty years of precise gravity measurements at Mt. Vesuvius: an approach to detect underground mass movements, Ann. Geophys.-Italy, 56, S0436, https://doi.org/10.4401/ag-6442, 2013.
Berrino, G., d'Errico, V., and Ricciardi, G.: Toward Absolute Gravity Networks to Monitor the Neapolitan Volcanoes. International Workshop on “Advanced Monitoring of Active Volcanoes” (AMAV), Naples, 28–30 September 2015, Poster session, in: Earthprint Repository, available at: http://hdl.handle.net/2122/10170 (last access: 21 August 2020), 2015.
Bonafede, M. and Mazzanti, M.: Modelling gravity variations consistent with ground deformation in the Campi Flegrei caldera (Italy), J. Volcanol. Geoth. Res., 81, 137–157, 1998.
Brown, G. C. and Rymer, H.: Microgravity monitoring of active volcanoes: a review of theory and practice, Cah. Cent. Eur. Géodyn. Séismol., 4, 279–304, 1991.
Camacho, A. G., González, P. J., Fernández, J., and Berrino, G.: Simultaneous inversion of surface deformation and gravity changes by means of extended bodies with free geometry. Application to deforming calderas, J. Geophys. Res., 116, B10410, https://doi.org/10.1029/2010JB008165, 2011.
Carbone, D., Poland, M. P., Diament, M., and Greco, F.: The added value of time-variable microgravimetry to the understanding of how volcanoes work, Earth Sci. Rev., 169, 146–179, https://doi.org/10.1016/j.earscirev.2017.04.014, 2017.
Cardellini, C., Chiodini, G., Frondini, F., Avino, R., Bagnato, E., Caliro, S., Lelli, M., and Rosiello, A.: Monitoring diffuse volcanic degassing during volcanic unrest: the case of Campi Flegrei (Italy), Sci. Rep.-UK, 7, 6757, https://doi.org/10.1038/s41598-017-06941-2, 2017.
Carlino, S., Somma, R., Troise, C., and De Natale, G.: The geothermal exploration of Campanian volcanoes: Historical review and future development, Renew. Sust. Energ. Rev., 16, 1004–1030, https://doi.org/10.1016/j.rser.2011.09.023, 2012.
Carlino, S., Piochi, M., Tramelli, A., Mormone, A., Montanaro, C., Scheu, B., and Klaus, M.: Field-scale permeability and temperature of volcanic crust from brehole data: Campi Flegrei, souther Italy, J. Volcanol. Geoth. Res., 357, 276–286, https://doi.org/10.1016/j.jvolgeores.2018.05.003, 2018.
Chiodini, G., Vandemeulebrouck, J., Caliro, S., D'Auria, L., DeMartino, P., Mangiacapra, A., and Petrillo, Z.: Evidence of thermal-driven processes triggering the 2005–2014 unrest at Campi Flegrei caldera, Earth Planet. Sc. Lett., 414, 58–67, 2015.
Chiodini, G., Selva, J., Del Pezzo, E., Marsan, D., De Siena, L., D'Auria, L., Bianco, F., Caliro, S., De Martino, P., Ricciolino, P., and Petrillo, Z.: Clues on the origin of post-2000 earthquakes at Campi Flegrei caldera (Italy), Sci. Rep.-UK, 7, 4471, https://doi.org/10.1038/s41598-017-04845-9, 2017.
Corrado, G. and Luongo, G.: Ground deformation measurements in active volcanic areas using tide gauges, Bull. Volcanol., 44, 505–511, 1981.
Corrado, G., Guerra, I., Lo Bascio, A., Luongo, G., and Rampoldi, F.: Inflation and microearthquake activity of Phlegraean Fields, Italy, B. Volcanol., 40, 169–188, 1977.
Corrado, G., De Lorenzo, S., Mongelli, F., Tramacere, A,. and Zito, G.: Surfac heat flow density at the Phlegrean Fiedls caldera “Souhern Italy”, Geothermics, 16, 358–373, 1998.
D'Agostino, G., Desogus, S., Germak, A., Origlia, C., Quagliotti, D., Berrino, G., Corrado, G., d'Errico, V., and Ricciardi, G.: The new IMGC-02 transportable absolute gravimeter: measurements apparatus and applications in Geophysics and Volcanology, Ann. Geophys.-Italy, 51, 39–49, 2008.
D'Auria, L., Giudicepietro, F., Aquino, I., Borriello, G., Del Gaudio, C., Lo Bascio, D., Martini, M., Ricciardi, G. P., Ricciolino, P., and Ricco, C.: Repeated fluid-transfer episodes as a mechanism for the recent dynamics of Campi Flegrei caldera (1989–2010), J. Geophys. Res., 116, B04313, https://doi.org/10.1029/2010JB007837, 2011.
Del Gaudio, C., Aquino, I., Ricciardi, G. P., Ricco, C., and Scandone, R.: Unrest episodes at Campi Flegrei: a reconstruction of vertical ground movements during 1905–2009, J. Volcanol. Geoth. Res., 195, 48–56, 2010.
Dvorak, J. J. and Berrino, G.: Recent ground movement and seismic activity in Campi Flegrei, Southern Italy: episodic growth of a resurgent dome, J. Geophys. Res., 96, 2309–2323, 1991.
Dykowski, P., Krynski, J., and Sekowski, M.: Testing the Suitability of the A10-020 Absolute Gravimeter for the Establishment of New Gravity Control in Poland, in: Gravity, Geoid and Height Systems, edited by: Marti, U., International Association of Geodesy Symposia 141, Springer International Publishing Switzerland, https://doi.org/10.1007/978-3-319-10837-7_2, 2014.
Ferguson, J. F., Klopping, F. J., Chen, T., Seibert, J. E., Hare, J. L., and Brady, J. L.: The 4D microgravity method for waterflood surveillance: Part 3–4D absolute microgravity surveys at Prudhoe Bay, Alaska, Geophysics, 73, WA163–WA171, https://doi.org/10.1190/1.2992510, 2008.
Gottsmann, J., Berrino, G., Rymer, H., and William-Jones, G.: Hazard assessment during unrest caldera at the Campi Flegrei, Italy: a contribution from gravity-height gradients, Earth Planet. Sc. Lett., 211, 295–309, 2003.
Grant, F. S. and West, G. F.: Interpretation theory in applied geophysiscs, McGraw-Hill Book Company, New York, USA, 584 pp., 1965.
Greco, F., Currenti, G., D'Agostino, G., Germak, A., Napoli, R., Pistorio, A., and Del Negro, C.: Combining relative and absolute gravity measurements to enhance volcano monitoring, B. Volcanol., 74, 1745–1756, https://doi.org/10.1007/s00445-012-0630-0, 2012.
Greco, F., Germak, A., Currenti, G., Biolcati, E., Napoli, R., Origlia, C., Sicari A., and Del Negro, C.: Six years of repeated absolute gravity measurements at Etna vulcano (Italy), Proc. IAG Symposium on “Terrestrial gravimetry: Static and mobile measurements (TG-SMM13), Saint Petersburg, Russia, 17–20 September 2013.
Greco, F., Biolcati ,E., Pistorio, A., D'Agostino, G., Germak, A., Origlia, C., and Del Negro, C.: Absolute gravity measurements at three sites characterized by different environmental conditions using two portable ballistic gravimeters, Eur. Physical J. Plus, 38, 130, https://doi.org/10.1140/epjp/i2015-15038-0, 2015.
Hinderer, J., de Linage, C., Boy, J. P., Gegout, P., Masson, F., Rogister, Y., Amalvict, M., Pfeffer, J., Littel, F., Lucka, B., Bayerb, R., Champollion, C., Collard, P., Le Moigne, N., Diament, M., Deroussi, S., de Viron, O., Biancale, R., Lemoine, J. M., Bonvalot, S., Gabalda, G., Bock, O., Genthon, P., Boucher, M., Favreau, G., Séguis, L., Delclaux, F., Cappelaere, B., Oi, M., Descloitres, M., Galle, S. , Laurent, J.P., Legchenko A., and Bouin, M. N.: The GHYRAF (Gravity and Hydrology in Africa) experiment: Description and first results, J. Geodyn., 48, 172–181, 2009.
Kazama, T. and Okubo, S.: Hydrological modeling of groundwater disturbances to observed gravity: Theory and application to Asama Volcano, Central Japan, J. Geophys. Res., 114, B08402, https://doi.org/10.1029/2009JB006391, 2009.
Kazama, T., Okubo, S., Sugano, T., Matsumoto, S., Sun, W., Tanaka, Y., and Koyama, E.: Absolute gravity change associated with magma mass movement in the conduit of Asama Volcano (Central Japan), revealed by physical modeling of hydrological gravity disturbances, J. Geophys. Res., 120, 1263–1287, https://doi.org/10.1002/2014JB011563, 2015.
Koth, K. R. and Long, A. J.: Microgravity Methods for Characterization of Groundwater-Storage Changes and Aquifer Properties in the Karstic Madison Aquifer in the Black Hills of South Dakota, 2009–2012, USGS Scientific Investigations Report 2012–5158, 32 pp., 2012.
Krynski, J. and Sekowski, M.: Surveying with the A10-20 absolute gravimeter for geodesy and geodynamics – first results, EGU General Assembly 2010, 2–7 May 2010, Vienna, Austria, Reports on Geodesy, Warsaw University of Technology, Geophysical Research Abstracts Vol. 12, EGU2010-8167, 27–35, 2010.
Makinen, J., Sekowski, M., Krynski, J., Kuokkanen, J., Naranen, J., Raja-Halli, A., Ruotsalainen, H., and Virtanen, H.: Gravity change in Finland 1962–2010 from the comparison of new measurements using the outdoor absolute gravimeter A10-020 with legacy relative measurements, Geophys. Res. Abstr., 15, EGU2013-11644, EGU General Assembly, 2013.
Minet, C., Goel, K., Aquino, I., Avino, R., Berrino, G., Caliro, S., Chiodini, G., De Martino, P., Del Gaudio, C., Ricco, C., Siniscalchi, V., and Borgstrom, S.: High resolution monitoring of Campi Flegrei (Naples, Italy) by exploiting TERRASAR-X data: an application to Solfatara crater, Proc. “Fringe 2011 Workshop”, Frascati, Italy, 23 September 2011, ESA SP-697, January 2012, 2012a.
Minet, C., Goel, K., Aquino, I., Avino, R., Berrino, G., Caliro, S., Chiodini, G., De Martino, P., Del Gaudio, C., Ricco, C., Sansivero, F., Siniscalchi, V., Terranova, C., Vilardo, G., and Borgstrom, S.: Measuring non-linear deformation of the Campi Flegrei caldera (Naples, Italy) using a multi-method InSar geophysical approach, Proc. IGARSS Symposium, Munich, Germany, 22–27 July 2012, IEEE, 2012b.
Nielsen, J. E. J., Forsberg, R., and Strykowski, G.: Measured and modelled absolute gravity changes in Greenland, J. Geodyn., 73, 53–59, 2014.
Pujol, E. R.: Absolute Gravity Network in Spain, Física de la Tierra, 17, 147–163, 2005.
Rymer, H. and Tryggvason, E.: Gravity and elevation changes at Askja, Iceland, B. Volcanol., 55, 362–371, 1993.
Rymer, H., Cassidy, J., Locke, C., and Sigmundsson, F.: Post eruptive gravity changes from 1990 to 1996 at Krafla volcano, Iceland, J. Volcanol. Geoth. Res., 87, 141–149, 1998.
Rymer, H., Cassidy, J., Locke, C. A., Barboza, M. V., Baquero, J., Brenes, J., and Van der Laat, R.: Geophysical studies of the recent 15-year eruptive cycle at Poas Volcano, Costa Rica, Volcanol. Geoth. Res., 97, 425–442, 2000.
Sazhina, N. and Grushinsky, N.: gravity prospecting, MIR Publisher, Moskow, 491 pp., 1971.
Siniscalchi, A., Tripaldi, S., Romano, G., Chiodini, G., Improta, L., Petrillo, Z., D'Auria, L., Caliro, S., and Avino, R.: Reservoir structure and hydraulic properties of the Campi Flegrei geothermal system inferred by audiomagnetotelluric, geochemical and seismicity study, J. Geophys. Res.-Sol. Ea., 124, 5336–5356, https://doi.org/10.1029/2018JB016514, 2019.
Sofyan, Y., Nishijima, J., Yoshikawa, S., Fujimitsu, Y., Kagiyama, T., and Fukuda, Y.: Combined absolute and relative gravity measurement for microgravity monitoring in Aso volcanic field, Geophys. Res. Abstr., 16, EGU 2014-1146, EGU General Assembly, 2014.
Sofyan, Y., Daud, Y., Nishijima, J., Fujimitsu, Y., Kamah, Y., Yani, A., Fukuda, Y., and Taniguchi, M.: The first repeated absolute gravity measurement for geothermal monitoring in The Kamojang Geothermal Field, Indonesia, Geothermics, 53, 114–124, 2015.
Sofyan, Y., Nishijima, J., Fujimitsu, Y., Yoshikawa, S., Kagiyama, T., and Ohkura, T.: The oscillation model of hydrothermal dynamics beneath Aso volcano, southwest Japan after small eruption on May 2011: A new understanding model using repeated absolute and relative gravity measurement, J. Volcanol. Geoth. Res., 310, 172–185, 2016.
Sugihara, M. and Ishido, T.: Geothermal reservoir monitoring with a combination of absolute and relative gravimetry, Geophysics, 73, WA37–WA47, https://doi.org/10.1190/1.2991105, 2008.
Todesco, M., Chiodini, G., and Berrino, G.: Modeling of gas composition and gravity signals at the Phlegrean Fields caldera, Proc. TOUGH Symposium 2006, Lawrence Berkeley National Laboratory, Berkeley, California, 15–17 May 2006.
Trasatti, E., Bonafede, M., Ferrari, C., Giunchi, C., and Berrino, G.: On deformation sources in volcanic areas: Modeling the Campi Flegrei (Italy) 1982–84 unrest, Earth Planet. Sc. Lett., 306, 175–185, 2011.
Valentino, G. M. and Stanzione, D.: Geochemical monitoring of the thermal waters of the Plegraean Fields, J. Volcanol. Geoth. Res., 133, 261–289, 2004.