 | 19 Mar 2021
Topography and structural heterogeneities in surface ground deformation: a simulation test for Somma-Vesuvius volcano
Umberto Riccardi
Vittorio Romano
Michele Meo
Paolo Capuano
We simulate the deformation of Somma-Vesuvius volcano due to some overpressure sources by means of a finite element 3D code. The main goal of these simulations is to investigate the influence of topography and structural heterogeneity on ground deformation. In our model the sources of deformation are embedded in an elastic linear isotropic medium and located at various depths. Geometry (shape and lateral extension) of the sources is mainly constrained by the results coming from recent seismic tomography studies. The structural heterogeneity has been modelled in terms of dynamic elastic parameters (Young's modulus) retrieved from previous seismic tomography and gravity studies. A high-resolution digital terrain model is used for the topography of the volcano subaerial edifice. Evidences from our results suggest that real topography and structural heterogeneities are key factors governing the ground deformation, which often turns being one of the most relevant problems in volcano monitoring. A large deviation from the axially symmetrical model of the displacement field is the main result of our modelling. Such an asymmetry is routinely unaccounted for when Mogi's simplistic modelling in a homogeneous medium with simplified topography is used. Our study clearly demonstrate that a better knowledge of deformation patterns can significantly help in the location of monitoring sensors as well as in the design of an efficient geodetic network.
- Article
(3035 KB) - Full-text XML
- BibTeX
- EndNote


The volcanic complex of Somma-Vesuvius is a stratovolcano located in the Campania Plain. It consists of an older edifice, partly dismantled by a caldera process, Mount Somma and a younger one, Mount Vesuvius, that is located within the caldera of Mount Somma, formed about 18 000 year BP (Landi et al., 1999). It has a rim (maximum altitude 1131 m a.s.l.) well preserved in the northern sector. Instead, Mount Vesuvius is almost symmetrical cone, with maximum altitude of 1281 m a.s.l. It was formed by means the accumulation of ash, scoria and lava flows, given off mainly from the central vent.
Somma-Vesuvius is known worldwide for the devastating Plinian eruption (79 AD) that destroyed Herculaneum and Pompeii. In 472 AD, a subplinian eruption occurred, followed by a persistent activity of about 700 years (Mastrolorenzo et al., 2002; Rolandi et al., 2004). From the 12th century to 1631 there was a period of low activity, which ended with a subplinian eruption. It was followed, until 1944, by a period characterized by medium and small-size eruptions. Since the last eruption in 1944, the Somma-Vesuvius volcano is in a quiescent phase. It has an activity consisting of hundreds of low energy earthquakes per year (Bianco et al., 1998; De Natale et al., 1998, 2004), generally characterized by earthquake swarms (Bianco et al., 1999), fumarolic activity at the summit crater (Chiodini et al., 2001) and subsidence (Tammaro et al., 2013; Pingue et al., 2013). The largest earthquake (MD = 3.6) was recorded on October 1999 (Del Pezzo et al., 2004; De Natale et al., 2004; Galluzzo et al., 2004; Cubellis et al., 2007).
Among the various geophysical parameters monitored, the ground deformations play an important role, because they contribute to the unrest assessment of eruptive activity in medium-term (Dvorak and Dzurisin, 1997; Dzurisin, 2000; 2003). The hypothesis of a shallow magma chamber, coaxial with the crater axis, and the hypothesis that Mogi's model (Mogi, 1958) adequately described the ground deformation field, influenced the design of the geodetic networks. In fact, in 1972 a leveling network was built to control the medium-high altitude (from 600 to 1200 m) of the Gran Cono. In 1975, the EDM (Electronic Distance Measurement) network was built with four vertices on the crater. With the progress of scientific knowledge in the physics of volcanism, this approach has been gradually abandoned. For a long time now, the continuous monitoring networks, such as GNSS network, have covered the entire volcanic apparatus, aimed to have information on a deformation field that includes areas also outside the volcano.
Moreover, the continuous geodetic monitoring networks also guarantee timely detection of the change in the state of the volcano and, in the advanced stages of the pre-eruptive process, allow the identification of the areas more highly prone to the opening of eruptive vents. However, during rest periods, such as the current one of Somma-Vesuvius, the deformation of the volcano can be very elusive (Dzurisin, 2000).
Therefore, the location of the sensors is of paramount importance. In fact, as shown by Dzurisin (2003), sensors located too close to the area of the deformation, would not allow to distinguish between an inflation dyke and a deflation sphere (Dzurisin, 2003), because both sources of deformation would produce subsidence in a confined area. A sparse and wide network of sensors might fail to record localized deformation caused by a shallow source.
Simulations of the ground displacements due to overpressure sources have proven to be very useful for the design of networks. In this way, the expected deformation field is simulated and therefore inferences can be made on the most suitable location of the sensors. Due to the harsh topography and structural heterogeneities, the simulation of ground displacements due to overpressure sources embedded in a domain closely representing the Somma-Vesuvius volcano is very challenging. In this study, which represents a development of Meo et al. (2008), through a 3D finite element modelling, we target to simulate, the deformation of Somma-Vesuvius volcano caused by some overpressure sources. Under the assumption of linear elastic material behaviour, the volcano deformation sources are located at various depths and their geometry (shape and lateral extension) is mainly constrained by the results of seismic tomography studies (Zollo et al., 1996; Capuano et al., 2003).
The paper is organized as follows. The Sect. 2 illustrates briefly the Finite Element Method (FEM). In Sect. 3, we describe the Structural heterogeneities and FEM model for Somma-Vesuvius volcano. Section 4 reports on the 3D simulations. In Sect. 5 results are discussed and conclusions are drawn.
The finite element method (FEM) is a numerical technique for solving problems which are described by partial differential equations or can be formulated as functional minimization. The FEM has been used to investigate a wide range of complex physical phenomena, particularly those with geometrical and material nonlinearities (such as those often encountered in the real-world geosciences). The principle of minimization of energy forms the primary backbone of the finite element method. When a body is subject to a particular boundary condition, this can lead to several configurations, but yet only one particular configuration is realistically possible or achieved governed by the principle of minimization of potential energy. It states that when forces and boundary conditions are applied, among the numerous possible configurations that the body can assume, the configuration of minimum total energy is chosen.
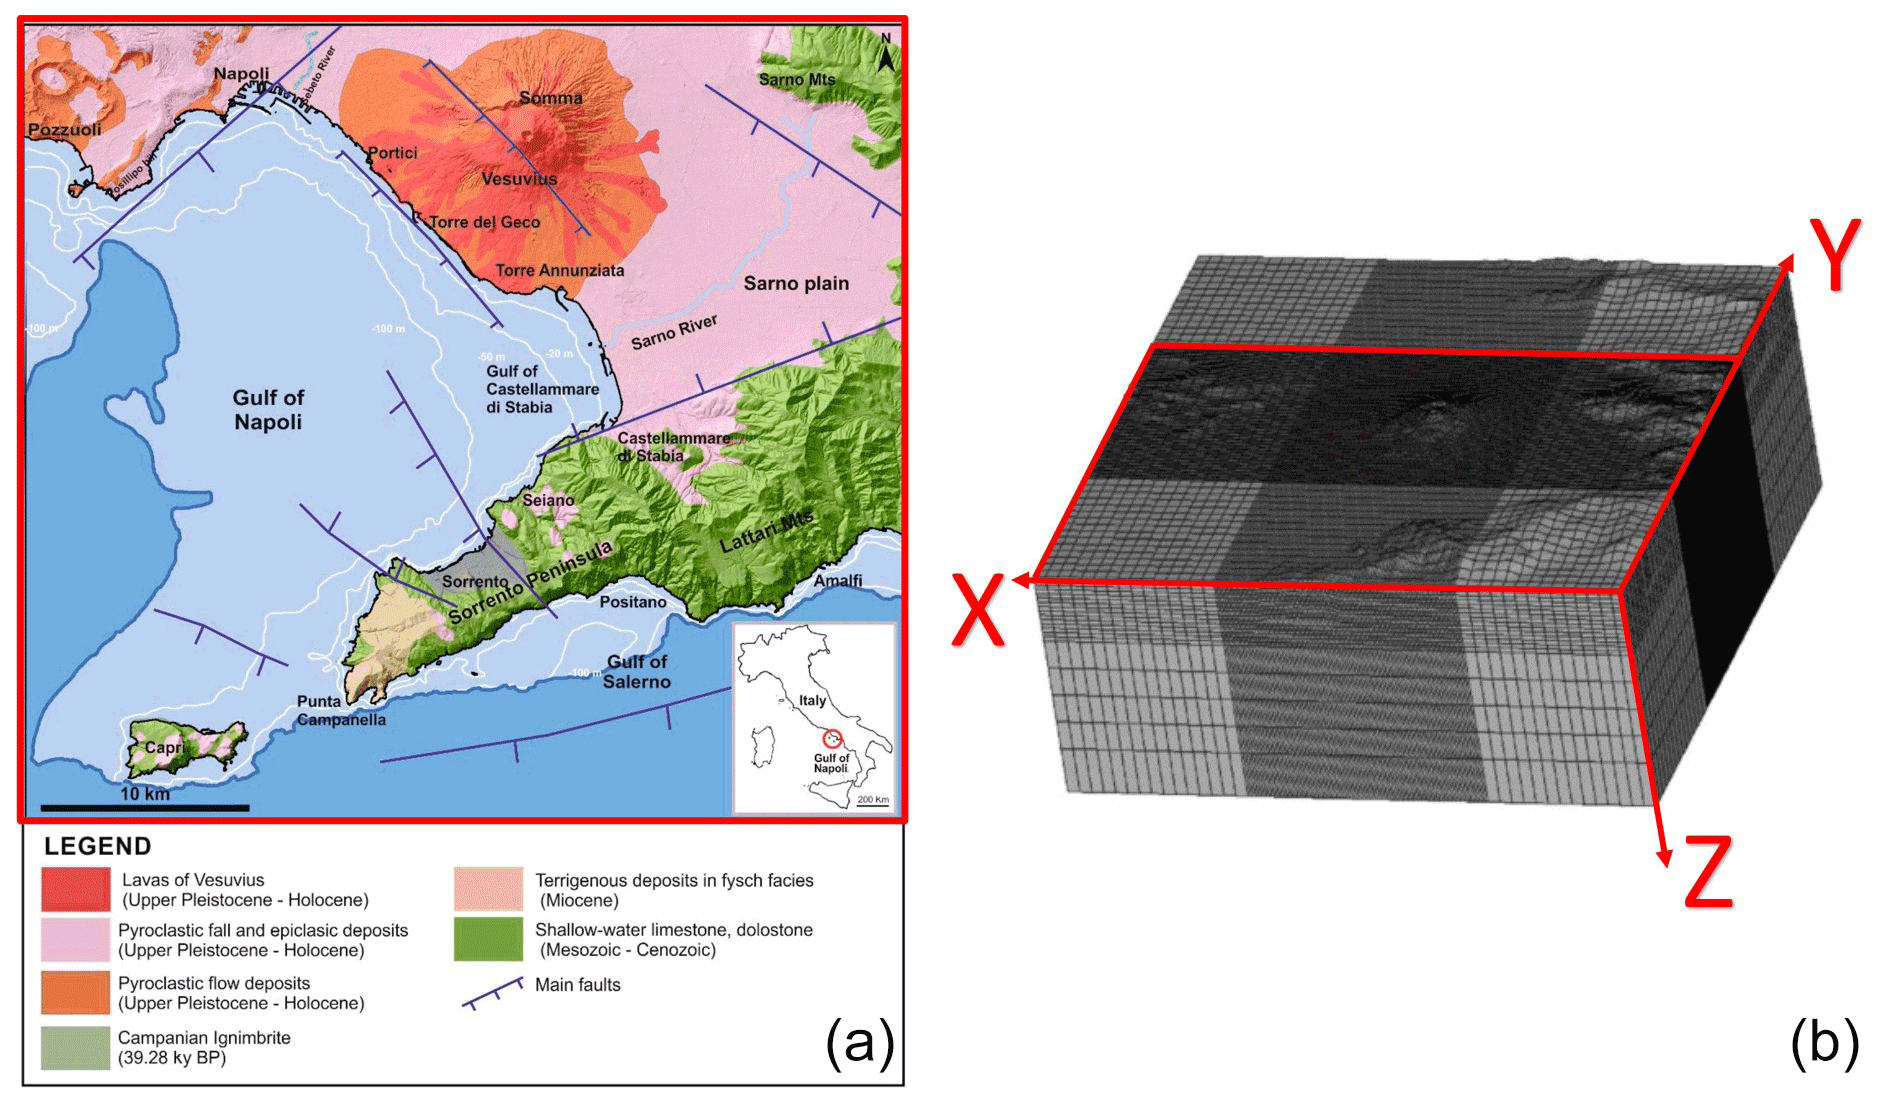
Figure 1(a) Geological map relating to the part of the domain enclosed in the red box (from Pennetta, 2018). It includes Gulf of Napoli and the Somma-Vesuvius volcano, southern Italy. Inset shows a geographical sketch of southern Italy, the circle indicates study area. (b) Finite element model used in this study. The directions of the y-axis and x-axis coincide with the geographic North and East-West verse, respectively. The z-axis is perpendicular to the x−y plane.
In the finite element analysis, a domain of interest is divided into small pieces known as “elements” and the corner point of each element is known as a “node”. Approximating functions in finite elements are determined in terms of nodal values of a physical field, in our study the displacement field. A continuous physical problem is transformed into a discretized finite element problem with unknown nodal values. Basically the unknown displacement field is calculated at the nodal points. Interpolation functions are defined for each element to interpolate, for values inside the element, using nodal values. These interpolation functions are also often referred to as shape functions. For examples, the relation (1) show the case 1D
where d is the nodal displacement, N is the shape function and function of x and u(x) is the global displacement function. For a linear problem, a system of linear algebraic equations should be solved. Values inside finite elements can be recovered using nodal values. The piece-wise approximation of physical fields on finite elements can provide good precision even with simple approximating functions. However, mesh sensitivity studies should be carried out where increasing the number of elements a better accuracy can be achieved. Moreover, the locality of approximation leads to sparse equation systems for a discretized problem helping to solve problems with very large number of nodal unknowns as in our case.
The FEM allowed us to transform the domain of interest, the Somma-Vesuvius volcano in this case, into elements with discrete nodes in space. The properties of the domain are obtained combining those of the elements. The FEM is also suited to dealing with strong variations of stiffness properties, such as those expected for a volcano. In this study, we have used heterogeneous material properties for the different part of the investigated domain and to evaluate the effect of these structural heterogeneities in surface ground deformation. The element stiffness matrix, for 3D elements, has the generic form presented in Eq. (2)
where [B] is the strain displacement matrix and [D] the material properties' matrix. The displacement over the domain of interest can be calculated from Eq. (3)
where [K] is the global stiffness matrix containing the stiffness of each area and element connectivity information and F the applied loads.
In this study, the Finite Element Model has been implemented in the commercial code ANSYS, taking into account real topography of the Somma-Vesuvio volcano as inferred from a detailed digital elevation model. The mesh (Fig. 1) was built, as in Meo et al. (2008), by using elements with smaller edge length in regions of high stress gradient while a coarser mesh was used away from the main crater. In particular, in the main area of about 10 km2 with a side of 10 km enclosing the volcano, brick elements have an edge length of 80 m. A coarser mesh was used for the remaining domain with elements having edge length of 240 and 480 m. The main characteristics are summarized in the Table 1.
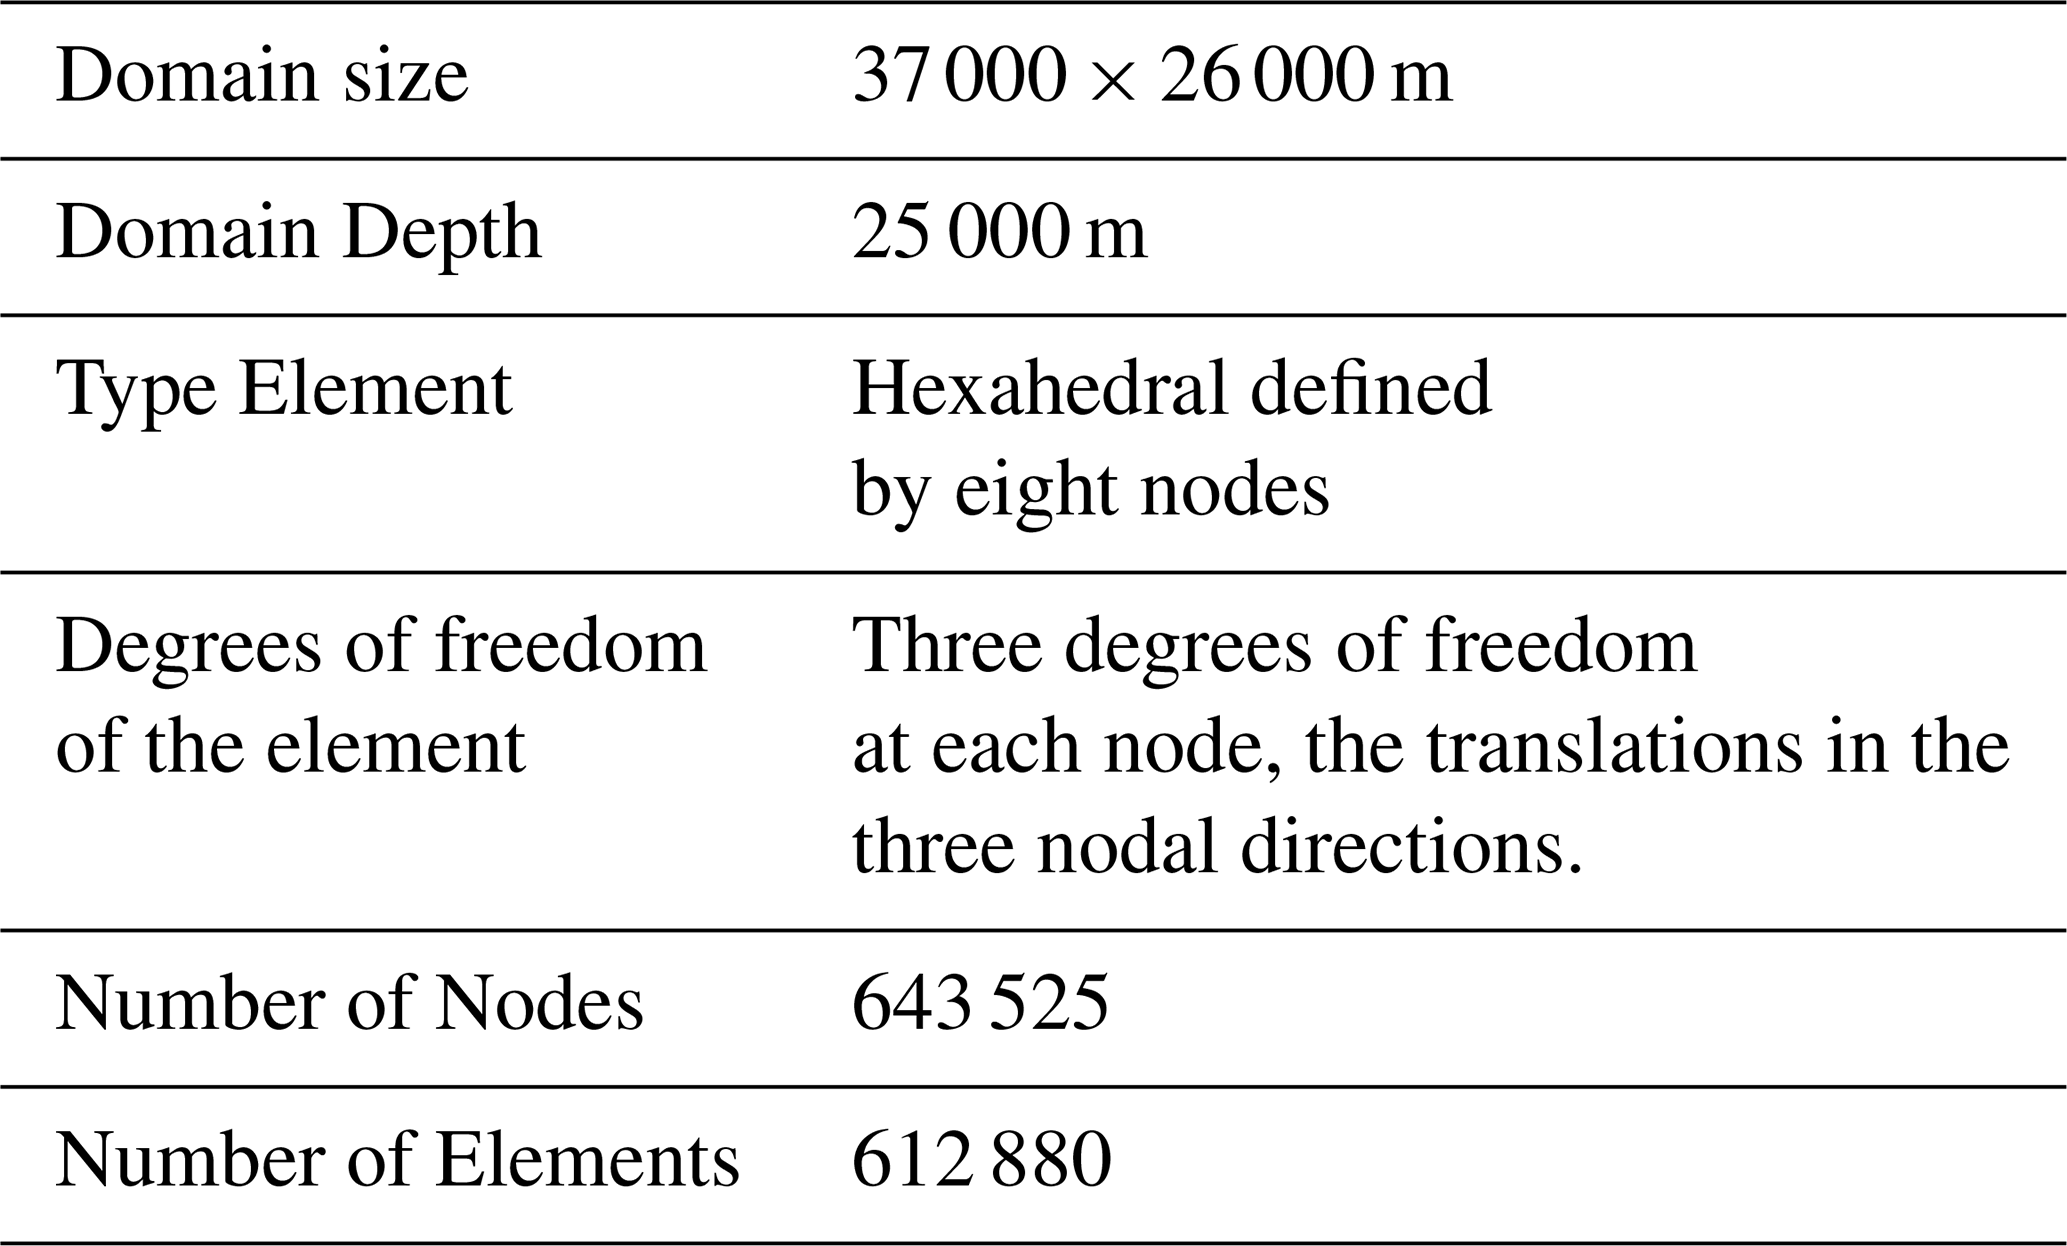
Regarding the boundary conditions, the different constraints imposed on the faces of the domain are described in Table 2.

Structural heterogeneities have been modelled in terms of the three dynamical elastic parameters: Young's modulus (E), Poisson's ratio (σ) and density (ρ). At each element, we have inferred these parameters from seismic waves velocities retrieved from seismic tomography conducted at Somma-Vesuvius volcano during TomoVes project (Gasparini et al., 1998; Capuano et al., 2003). In particular, we have derived the density of volcano by means the relationship (4) obtained by Currenti et al. (2007) and therein references. The derived density lead to density differences consistent with those obtained by 3D gravity inversion by Capuano et al. (2013). Instead, Young's modulus and Poisson's ratio can be calculated with the relations (5) and (6). Moreover, as already done in Meo et al. (2008), the model is built taking into account the real topography of the volcano, which is inferred from a detailed digital elevation model.
In these relationships α and β are P-wave and S-wave propagation velocities respectively. Starting from these assumptions, we have built a heterogeneity volcanic structure with distributions of elastic and density parameters.
The elastic Young's modulus varies in the range from 10 GPa at shallower depth to about 80 GPA at higher depth (Fig. 2), Poisson's ratio varies between 0.246 and 0.250. Indeed, the density varies in the range from 1800 to 2800 kg/m3.
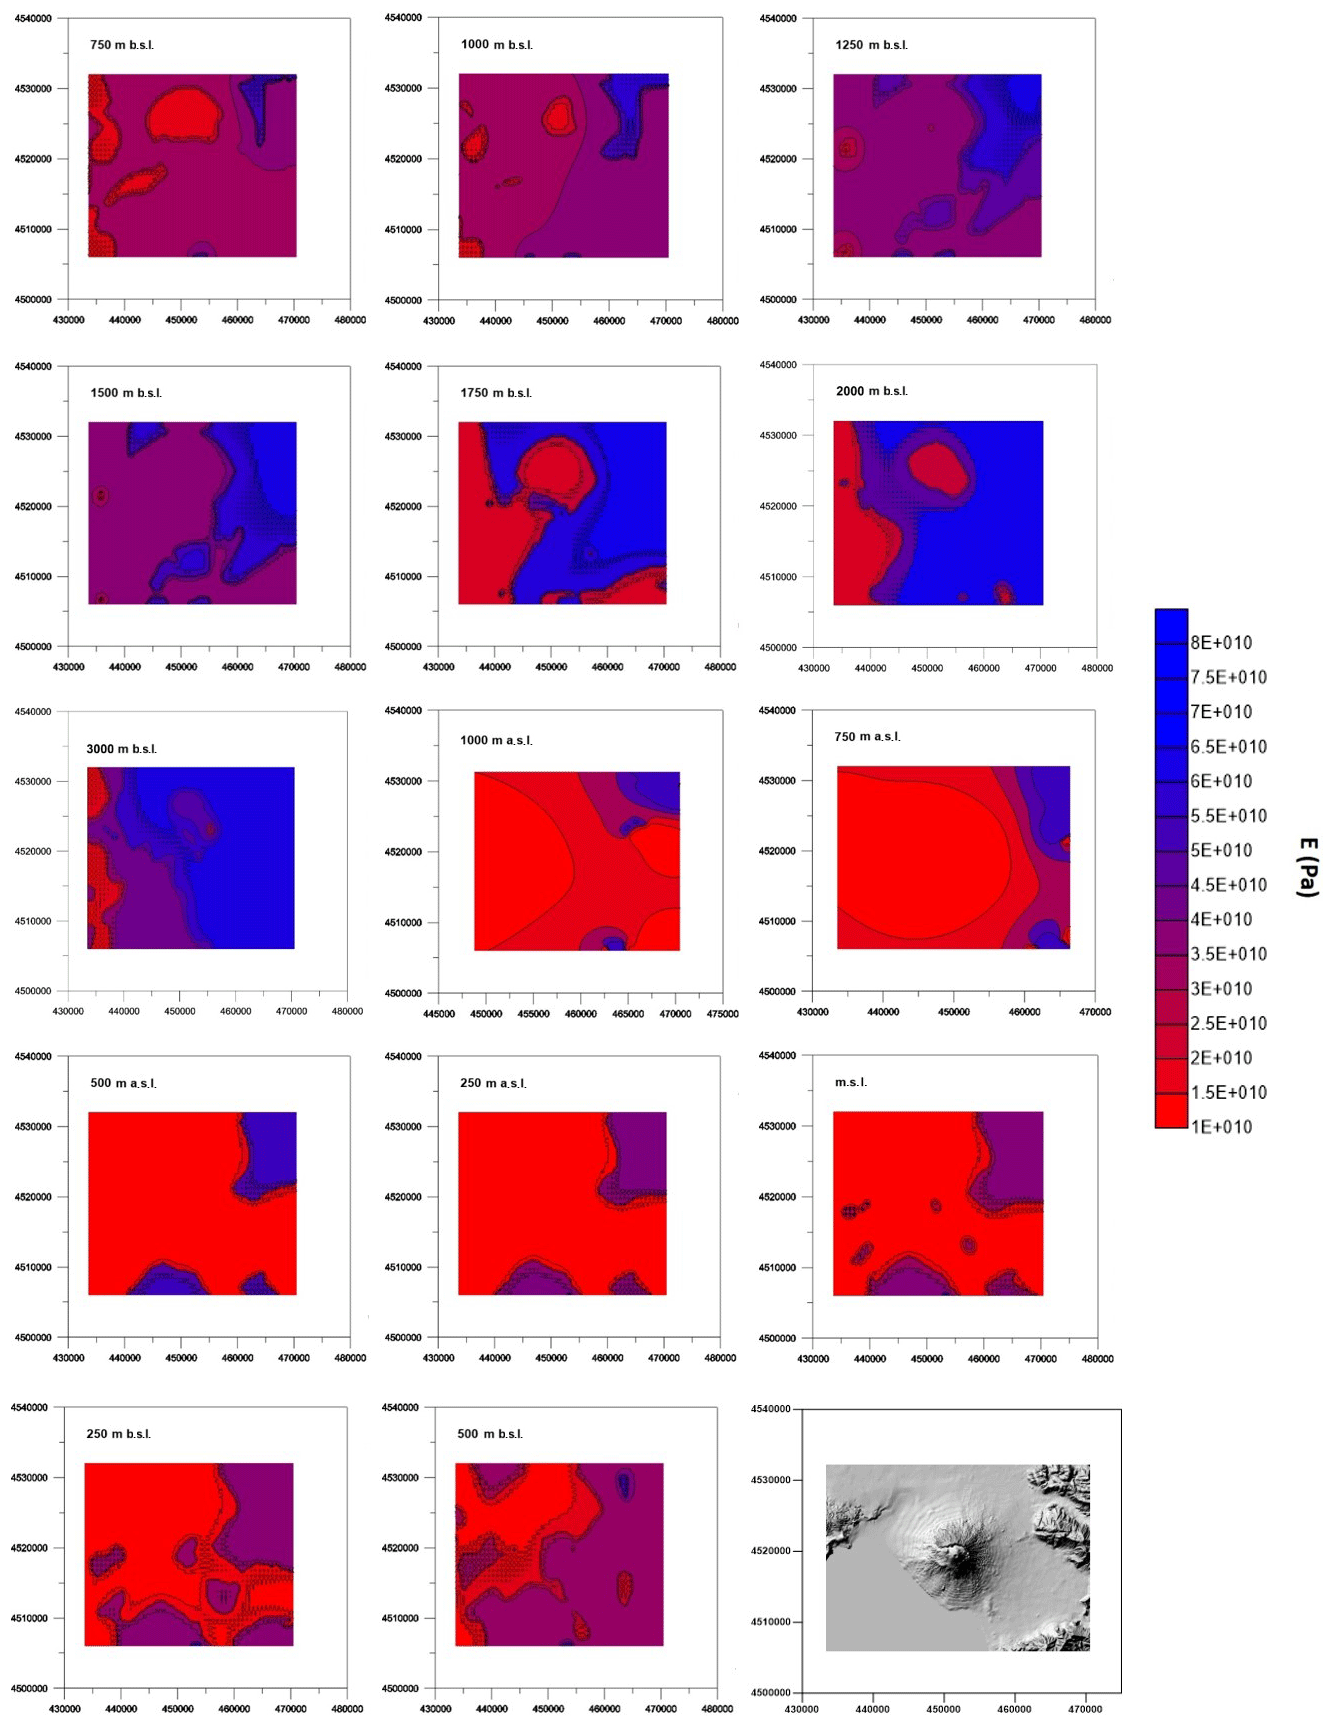
Figure 2Internal structure derived from the seismic tomography (Gasparini et al., 1998; Capuano et al., 2003). The Young's modulus is shown for the depth indicated on the top of each plot. The last box at bottom right shows the topography.
We simulate, for Somma-Vesuvius volcano, the displacements caused by three overpressure sources at various depths, 2, 3 and 5 km, in homogenous and heterogeneous media.
As in Meo et al. (2008), we have represented the reservoirs by means of a prolate overpressure parallelepiped shaped with a horizontal side of 480 m and thickness of 1.8 and 2.0 km both for shallower source at 2 km and for the deeper ones at 3 and 5 km respectively; all sources are located along the crater axis. We have chosen reservoirs with a lateral extension smaller than 500 m, because the resolution of seismic tomography data do not show body with extension greater than 0.5 km. The depth of the source is the position of the center of the parallelepiped. For example, the source at 2 km, which has a height of 1.8 km, has the top at 1.1 km and the bottom at 2.9 km. The shallow part of domain that reaches the top of source (1.1 km) is characterized by a Young's modulus that varies between 10 and about 30 GPa (Fig. 2). Therefore, we have chosen to use the minimum value of E for the homogeneous case.
For each source, the displacements field is computed by using three homogeneous half-space model, with E=10 GPa and σ=0.3, and an heterogeneous one obtained by evaluating, at each node of the mesh, E, σ with Eqs. (5) and (6).
For each model the three components of the ground displacements are computed at the nodes of FEM mesh, corresponding to the real topographic surface. We present results for a uniform overpressure of 10 MPa applied to the source walls. Different overpressure values will affect the ground deformation magnitude but the deformation pattern will keep unchanged, due to the linear elastic material model used in the simulation.
Results relative to the source located at 2 km are reported below. In particular, the surface deformation produced by a source located at 2 km depth in homogenous (E=10 GPa) and heterogeneous medium is shown in Figs. 3 and 4. The deformations produced by a Mogi-type source (Mogi, 1930) are depicted too, only as a term of comparison. In both cases, it is evident a deviation from an axial symmetrical pattern of the displacement field, due to the presence of the real topography. The ground deformation, in both cases, is concentrated in a radius of about 3 km from the crater axis. Another evidence, in the heterogeneous case, is the presence of subsidence areas along both profiles. They are located in the upper part of the volcano, in the younger part of the volcano (Gran Cono) and between the younger and the older area (Somma). Moreover, maximum vertical displacements are greater in homogenous case with respect to heterogeneous medium, both along the south-north (Fig. 5) and east-west profiles (Fig. 6). In a previous paper by Meo et al. (2008), on the other hand, it has been showed that the heterogeneous layered case (10 GPa up to 2 km and 40 GPa under 2 km) turns out the maximum vertical displacement along the south-north profile.
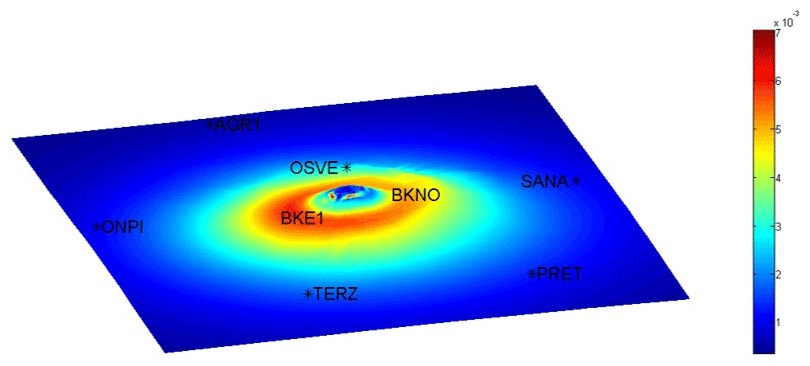
Figure 3Map of vertical displacements produced by a source located at 2 km depth embedded in homogenous medium (E=10 GPa and σ=0.3). The names and locations of continuous GNSS stations are shown.
From our simulations turns out that the maximum vertical displacement is provided by the homogeneous medium. This evident discrepancy with respect to the results by Meo et al. (2008) is not a surprise, because it is recognized that stratified models are strongly influenced by the position of the source.
In Meo et al. (2008), the source was located above and below the two layers and the relative difference in Young's modulus creates additional vertical forces in the area above the overpressure source. Our heterogeneous model, “closer to reality”, mitigates these effects by modelling more realistically the various zones with different Young's modulus calculated from tomography measurements.
The geodetic monitoring of volcanoes is one of the major tools for identifying possible warning signals of volcanic activity. Therefore, the modeling of the expected deformations from possible overpressure sources, taking into account the real topography, can provide useful information for optimizing the position of the sensors. In particular, our results indicate the need for a better definition of the geometry in the summit area of Somma-Vesuvius, in which we highlight the greater variations of the expected deformations compared to simpler models that do not take into account the heterogeneity of the structure and the actual topography. In fact, we believe it is useful a spatial optimization of the geodetic network at higher altitude in order to be able to identify in detail the uplift and subsidence areas, the prompt detection of which, according to our model, would be necessary to evaluate any phenomenology in progress. Obviously, taking into account the operational difficulties, a compromise between dense and sparse network of sensors should be achieved. In fact, as already mentioned in the introduction, the sensors located too close to the area of the deformation, would not allow to distinguish between an inflation dyke and a deflation sphere. A sparse and wide network of sensors might fail to record localized deformation caused by a shallow source.
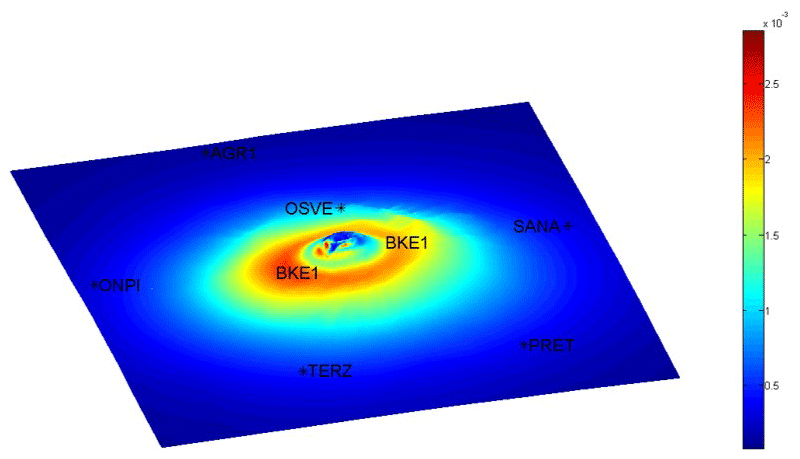
Figure 4Map of vertical displacements produced by a source located at 2 km depth embedded in heterogeneous medium obtained by evaluating, at each node of the mesh, E and σ with Eqs. (5) and (6). The names and locations of continuous GNSS stations are shown.
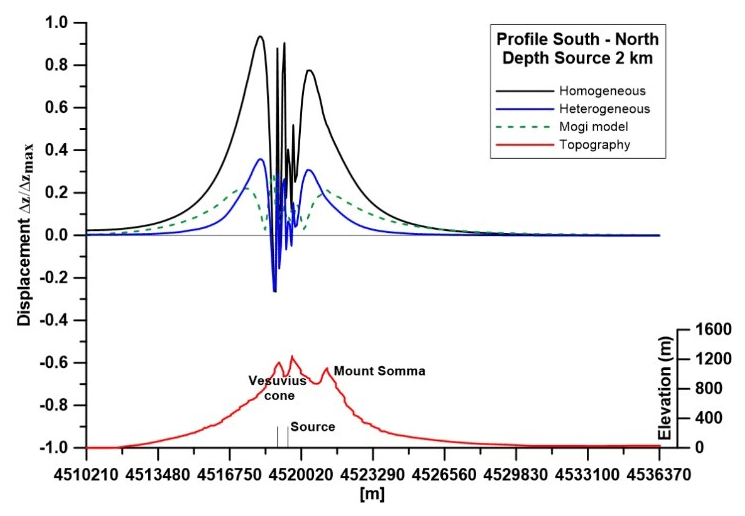
Figure 5Normalized vertical displacements for homogeneous, heterogeneous cases and Mogi model, which does not take into account the topography, along South-North profile.
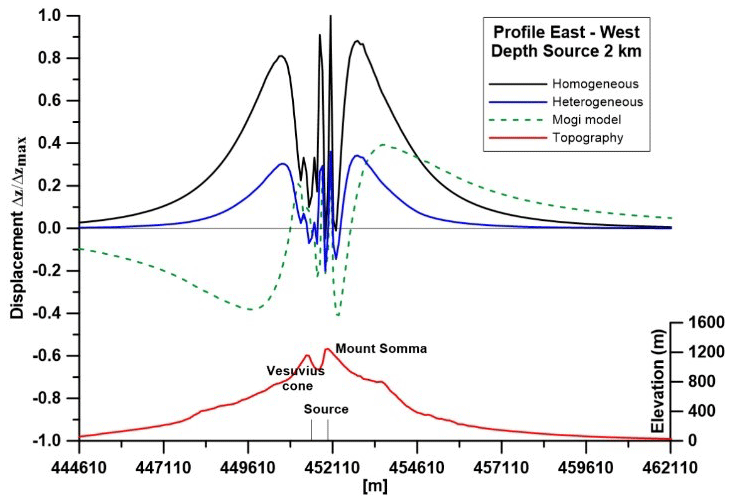
Figure 6Normalized vertical displacements for homogeneous, heterogeneous cases and Mogi model, which does not take into account the topography, along East-West profile.
In conclusion, a better definition of the geometry and characteristic of the GNSS monitoring network, particularly in the summit area, as this study, with the limit of validity of our source model, could represent a further contribution for those ongoing projects that involve the thickening and optimization of the network.
The Finite Element Model has been implemented in the commercial code ANSYS version 14.5. (https://www.ansys.com, last access: 20 May 2020)
All data are available from the authors upon request.
UT, PC and MM designed and developed this study and defined the methodology. UT, MM and VR designed and implemented the data analysis and simulations. MM, VR, UR validated the results. UT prepared the manuscript with contributions from MM, UR. PC supervised the project.
The authors declare that they have no conflict of interest.
This paper, however, does not reflect the position and the official policies of the Dipartimento della Protezione Civile Italiana (DPC – Italian Civil Protection Department).
This article is part of the special issue “Understanding volcanic processes through geophysical and volcanological data investigations: some case studies from Italian sites (EGU2019 GMPV5.11 session, COV10 S01.11session)”. It is not associated with a conference.
Authors are strongly indebted to two reviewers, who contributed to improve the manuscript.
This paper was edited by Antonietta Maria Esposito and reviewed by Guido Russo and Claudio Martino.
Bianco, F., Castellano, M., Milano, G., Ventura, G., and Vilardo, G.: The Somma-Vesuvius stress field induced by regional tectonics: Evidences from seismological and mesostructural data, in: Special Issue Vesuvius, edited by: Spera, F. J., De Vivo, B., Ayuso, R. A., and Belkin, H. E., J. Volcanol. Geoth. Res., 82, 199–218, https://doi.org/10.1016/S0377-0273(97)00065-6, 1998.
Bianco, F., Castellano, M., Milano, G., Vilardo, G., Ferrucci, F., and Gresta, S.: The seismic crises at Mt. Vesuvius during 1995 and 1996, Phys. Chem. Earth (A), 24, 977–983, 1999.
Capuano, P., Gasparini, P., Virieux, J., Zollo, A., Casale, R., and Yeroyanni, M.: The Internal Structure of Mt. Vesuvius: A Seismic Tomography Investigation, Liguori Editore, Napoli, 595 pp., ISBN 88-207-3503-2, 2003.
Capuano, P., Russo, G., and Scarpa, R.: P-wave velocity and density structure beneath Mt. Vesuvius: a magma body in the upper edifice?, Ann. Geophys.-Italy, 54, S0437–S0447, https://doi.org/10.4401/ag-6443, 2013.
Chiodini, G., Marini, L., and Russo, M.: Geochemical evidences of high temperature hydrothermal brines at Vesuvio volcano (Italy), Geochim. Cosmochim. Ac., 65, 2129–2147, 2001.
Cubellis, E., Luongo, G., and Marturano, A.: Seismic hazard assessment at Mt. Vesuvius: the maximum magnitude expected, J. Volcanol. Geoth. Res., 162, 139–149, https://doi.org/10.1016/j.jvolgeores.2007.03.003, 2007.
Currenti, G., Del Negro, C., and Ganci, G.: Modelling of ground deformation and gravity fields using finite element method: an application to Etna volcano, Geophys. J. Int., 169, 775–786, https://doi.org/10.1111/j.1365-246X.2007.03380.x, 2007.
Del Pezzo, E., Bianco, F., and Saccorotti, G.: Seismic Source Dynamics at Vesuvius Volcano, Italy, J. Volcanol. Geoth. Res., 133, 23–39, 2004.
De Natale, G., Capuano, P., Troise, C., and Zollo, A.: Seismicity at Somma-Vesuvius and its implications for the 3D tomography of the volcano, in: Special Issue Vesuvius, edited by: Spera, F. J., De Vivo, B., Ayuso, R. A., and Belkin, H. E., J. Volcanol. Geoth. Res., 82, 175–197, 1998.
De Natale, G., Troise, C., Trigila, R., Dolfi, D., and Chiarabba, C.: Seismicity and 3D substructure at Somma-Vesuvius volcano: evidence for magma quenching, Earth Plan. Sci. Lett., 221, 181–196, 2004.
Dvorak, J. and Dzurisin, D.: Volcano Geodesy: the search for magma reservoirs and the formation of eruptive vents, Rev. Geophys., 35, 343–384, https://doi.org/10.1029/97RG00070, 1997.
Dzurisin, D.: Volcano geodesy: Challenges and opportunities for the 21st century, Phil. Trans. R. Soc. Lond. A, 358, 1547–1566, https://doi.org/10.1098/rsta.2000.0603, 2000.
Dzurisin, D.: A comprehensive approach to monitoring volcano deformation as a window on the eruption cycle, Rev. Geophys., 41, 1001, 1–29, https://doi.org/10.1029/2001RG000107, 2003.
Galluzzo, D., Del Pezzo, E., La Rocca, M., and Petrosino, S.: Peak Ground Acceleration produced by local earthquakes in volcanic areas of Campi Flegrei and Mt. Vesuvius, Ann. Geophys.-Italy, 47, 1377–1390, 2004.
Gasparini, P. and The TomoVes Project Field Team, TomoVes: A project of seismic investigation of Mt.Vesuvius, EOS, 79, 229–232, 1998.
Landi, P., Bertagnini, A., and Rosi, M.: Chemical zoning and crystallization mechanisms in the magma chamber of the Pomici di Base plinian eruption of Somma-Vesuvius (Italy), Contrib. Mineral. Petrol., 135, 179–197, https://doi.org/10.1007/s004100050505, 1999.
Mastrolorenzo, G., Palladino, D., Vecchio, G., and Taddeucci, J.: The 472 A.D. Pollena eruption of Somma-Vesuvius (Italy) and its environmental impact at the end of the Roman Empire, J. Volcanol. Geoth. Res., 113, 19–36, 2002.
Meo, M., Tammaro, U., and Capuano, P.: Influence of topography on ground deformation at Mt. Vesuvius (Italy) by finite element modelling, Int. J. Nonlin. Mech., 43, 178–186, https://doi.org/10.1016/j.ijnonlinmec.2007.12.005, 2008.
Mogi, K.: Relations between the Eruptions of Various Volcanoes and the Deformations of the Ground Surfaces around them, B. Earthq. Res. I. Tokyo, 36, 99–134, 1958.
Pennetta, M.: Beach Erosion in the Gulf of Castellammare di Stabia in Response to the Trapping of Longshore Drifting Sediments of the Gulf of Napoli (Southern Italy), Geosciences, 8, 235, https://doi.org/10.3390/geosciences8070235, 2018.
Pingue, F., Bottiglieri, M., Godano, C., Obrizzo, F., Tammaro, U., Esposito, T., and Serio, C.: Spatial and temporal distribution of vertical ground movements at Mt. Vesuvius in the period 1973–2009, Ann. Geophys.-Italy, 56, 4, S0451, https://doi.org/10.4401/ag-6457, 2013.
Rolandi, G., Bellucci, F., and Cortini, M.: A new model for formation of the Somma Caldera, Miner. Petrol., 80, 27–44, https://doi.org/10.1007/s00710-003-0018-0, 2004.
Tammaro, U., De Martino, P., Obrizzo, F., Brandi, G., D'Alessandro, A., Dolce, M., Malaspina, S., Serio, C., and Pingue, F.: Somma Vesuvius volcano: ground deformations from CGPS observations (2001–2012), Ann. Geophys.-Italy, 56, S0456; https://doi.org/10.4401/ag-6462, 2013.
Zollo, A., Gasparini, P., Virieux, J., Le Meur, H., De Natale, G., Biella, G., Boschi, E., Capuano, P., De Franco, R., Dell'Aversana, P., De Matteis, R., Guerra, I., Iannaccone, G., Mirabile, L., and Vilardo, G.: Seismic evidence for a low velocity zone in the upper crust beneath Mount Vesuvius, Science, 274, 592–594, 1996.