Evaluation of Virtual Reference Station Constraints for GNSS Tropospheric Tomography in Austria Region
Robert Weber
One of the most promising methods of GNSS meteorology is GNSS Tomography. This method can be used for the determination of water vapor distribution, which contributes to the reliability of weather forecasting and early warning of severe weather. Therefore, GNSS Tomography is a valuable source of information for meteorological and weather forecast. The system of equations of this problem is mixed-determined because propagated signals do not pass through some of the model elements within the area of interest. Consequently, the normal matrix is close to singular without any unique solution. To avoid singularity and achieve a unique solution, additional sources or horizontal and/or vertical constraints are usually applied. Here, three schemes have been considered for remedying the rank deficiency of the problem. In the first scheme, minimum horizontal and vertical constraints were imposed on the system of observation equations. Then, we have defined three schemes to evaluate the impact of Virtual Reference Stations (VRS) in comparison to horizontal and vertical constraints in the sparse GNSS network. Within a network of Austrian GNSS reference stations these schemes have been analyzed and validated with available radiosonde profiles for the period DoY 245–256 in 2017. According to our results, the consistency of the estimated refractivity field with radiosonde profiles in the dense GNSS network was generally better (RMSE 2.80 ppm) than for the two other schemes in the period of interest. Moreover, in the sparse GNSS network, the average of RMSE for schemes with VRS stations and constraints equation was about 3.02 and 3.27 ppm, respectively. Hence, the obtained results illustrate that applying VRS stations in the sparse GNSS network can lead to a better solution in comparison to applying horizontal and vertical constraints.
- Article
(2418 KB) - Full-text XML
- BibTeX
- EndNote
GNSS satellites are used mainly in positioning and navigation applications. However, GNSS observations can be utilized for the reconstruction of the water vapor content of the troposphere due to the continuous pass of GNSS rays through the atmosphere. One of the favorable methods to estimate the spatio-temporal structure of the troposphere is GNSS Tomography. In this method, the troposphere is discretized into a number of cells, named voxels, for each of which the amount of water vapor is to be determined. The quality of the estimated field depends on a number of factors such as the constellation of GNSS satellites, the topological distribution of GNSS stations, the spatial resolution of the tomography model, the integration time, the reconstruction method and the initial field (Bender and Raabe, 2007; Brenot et al., 2018; Chen and Liu, 2014; Guerova et al., 2016; Möller, 2017; Rohm, 2012a; Rohm and Bosy, 2009; Rohm et al., 2013; Shangguan et al., 2013; Troller, 2004b).
In practice, the number and distribution of STDs (Slant Tropospheric Delays) are in general not sufficient to enable reconstruction at the demanded resolution in meteorology applications. At this resolution, the inversion problem is ill-posed with several possible solutions. In the last decade, much effort has been applied to obtain a unique solution by adding additional constraints (Adavi and Mashhadi-Hossainali, 2014, 2015; Bender et al., 2011; Benevides et al., 2016; Flores et al., 2000; Gradinarsky and Jarlemark, 2004; Guo et al., 2016; Manning et al., 2012; Möller, 2017; Rohm, 2012b; Rohm and Bosy, 2009; Rohm et al., 2013; Troller, 2004a; Trzcina and Rohm, 2019; Xia et al., 2013; Zhao et al., 2018, 2019).
Flores et al. (2000) applied horizontal constraints, vertical constraints and boundary conditions using the Singular Value Decomposition (SVD) to solve the tomography problem. This kind of constraints has been developed by many troposphere tomography scientists to obtain a unique solution (Champollion et al., 2005; Hirahara, 2000; Lutz, 2008; Perler, 2011; Perler et al., 2011; Rohm and Bosy, 2011; Rohm et al., 2014; Troller, 2004b). Zhang et al. (2017) proposed an improved tomography approach based on adaptive Laplacian smoothing (ALS) and ground meteorological observations. According to their results, the consistency between the reconstructed field and reference data will be enhanced compared to the constant Laplacian smoothing. Adavi and Mashhadi-Hossainali (2014) successfully used the Virtual Reference Stations (VRS) concept to estimate a unique solution of the tropospheric tomography problem. Moreover, applying independent sets of constraints like radiosonde measurements and radio occultation profiles is another method to remedy the rank deficiency of the tomography problem (Bender et al., 2011; Foelsche and Kirchengast, 2001; Xia et al., 2013). Rohm and Bosy (2011) added a set of parameters from the analysis of air flow to the corresponding system of equations for solving the tomography problem. During recent years, some researchers have estimated the 3-D field of tropospheric wet refractivity (Nw) using the integration of Interferometric Synthetic Aperture Radar (InSAR) and the GNSS tomography model (Benevides et al., 2015, 2016; Heublein, 2019). Benevides et al. (2018) introduced Atmospheric Infrared Sounder (AIRS) remote sensing data to initiate and update a 3-D tropospheric wet refractivity field.
In this research, we have investigated the impact of using Horizontal and Vertical constraints against the VRS concept. An Austrian GNSS network of twenty-one stations with a mean inter-station distance of about 40 km has been considered to reconstruct the wet refractivity field for evaluating the effect of different constraints in the solution quality. To analyze the accuracy of the tomography solution in case of a more sparse GNSS network, the number of GNSS stations has been reduced to fifteen. In this situation, the impact of using horizontal and vertical constraints in comparison to introduce observation of VRS stations becomes significantly stronger.
In the following, the tomographic reconstruction of the refractivity parameter (Sect. 2) is provided. In this section, the Tomography constraints and the concept of VRS are introduced. Then, the study area and the designed tomography model using the resolution matrix concept are detailed in Sect. 3. In Sect. 4 the tomography results of the defined schemes are compared to radiosonde data. Discussion and conclusions are presented in the last section.
To reconstruct the spatiotemporal refractivity field a large number of Slant Tropospheric Delays (STD) are combined in GNSS tomography (Flores et al., 2000) using the following equation (Bevis et al., 1992):
where N represents the refractivity parameter and S is the differential ray path between a satellite and a receiver. Due to the high variation of water vapour in space and time, Eq. (1) is mainly used to model the wet part of the refractivity field (Nw). Therefore, we can rewrite Eq. (1) as below:
In GNSS signal processing, the Slant Wet Delay (SWD) is not computed directly but its components ZWD (ZTD−ZHD), GN and GE are estimated by means of the Bernese GNSS software (Dach et al., 2015; Möller, 2017):
where, ε and α are the satellite elevation and azimuth angles. ZWD, GN and GE are the wet delays in the zenith direction and horizontal gradients in the north-south and east-west, respectively. Furthermore, VMF1w(ε) and mfg(ε) are the Vienna Mapping Function 1 and Chen–Herring mapping functions for ZWD and horizontal gradients (Böhm et al., 2006; Chen and Herring, 1997).
As observations are made in discrete form in practice, so to estimate a numerical solution for wet refractivity by Eq. (2), the troposphere should be discretized to a finite series of 3-D elements (voxels). Consequently, Eq. (2) is changed to discrete form as follows (Flores et al., 2000):
Here, SWD is the observation vector of size (m×1) and Nw is the unknown parameters vector of size (n×1). The number of observations (m) depends on the number of GNSS stations, the number of satellites and the time resolution of the tomography model. A is the coefficient matrix of size m×n which contains the length of ray i inside the model element j(dij) (Rohm and Bosy, 2009):
As the design matrix A characterizes the mapping of the unknown parameters on the observation vector, A is related to the geometry of the model, the geometry of the measurements as well as the temporal resolution of the reconstruction (Bender et al., 2011; Lutz, 2008; Troller, 2004b).
The kernel matrix A is non-singular if information related to model's voxels are complete. Nevertheless, the inverse of matrix A does not exist and matrix A−1 is singular. In GNSS tomography due to a sparse station distribution, it is relatively hard to retrieve enough information in all model elements and so some voxels are under-determined. In this situation, the null space of the design matrix has a non-trivial (N(A)≠0) solution and as a result A is non-invertible. Accordingly, Eq. (4) is ill-posed. Hence, it is necessary to add some constraints or initial fields (see Sect. 2.1) and apply regularization methods to solve the system of Eqs. (4).
Here, we have used the Landweber method. It is one of the classical iterative schemes from the Simultaneous Iterative Reconstruction Technique (SIRT) family and defined as follows (Hansen, 1998; Kaltenbacher et al., 2008):
where λk is a relaxation parameter which is defined as (Elfving et al., 2010; Hansen, 1998). The initial values of Nw that are necessary for Eq. (6) are extracted from the AROME model (https://www.zamg.ac.at/cms/de/forschung/wetter/arome, last access: 13 November 2019). Similar to other iterative regularization methods, obtaining the best-reconstructed solution is completely dependent on the iteration number k which can be considered as a regularization parameter (Hansen, 1998; Rasmussen, 2001), as well. In other words, after the kth iteration number, a regularized solution often converges to the least squares solution (Hansen, 1998). This phenomenon is referred to as semi-convergence in the iterative regularization methods (Elfving et al., 2014, 2010; Hansen, 1998; Nikazad, 2007; Rasmussen, 2001).
Consequently, we need to use stopping rule strategies to converge to the expected value. The most reasonable stopping rule is to obtain a minimum discrepancy between estimated values and a priori information (Nikazad, 2007). However, in practice, the values of the desired solution may be not available. Therefore, other methods, like Discrepancy Principal (DP), the L-Curve method, Flattest Slope (FS) and Generalized Cross Validation (GCV) might be applied (Golub and von Matt, 1996; Hansen, 1998; Wu, 2003). In this study, because of access to the radiosonde data, the iteration was stopped when the RMSE of the reconstructed image was minimized.
2.1 Tomography constraints
As not all voxels are penetrated by GNSS signals, the model null space is not trivial. Consequently, the design matrix A in Eq. (4) is a large sparse matrix that is badly ill-conditioned. Therefore, some constraints have to be applied to repair the rank deficiency of the structure matrix A.
One of the most used methods is to define horizontal and vertical constraint equations. In our approach, horizontal constraints are based on the Gaussian inverse distance weighted function, where each wet refractivity is the weighted mean of the neighboring voxels at the same layer (Flores et al., 2000; Rohm and Bosy, 2011):
In addition, vertical constraints are added to Eq. (4) with the purpose to determine the characteristic of the wet refractivity field in this direction. Here, we have applied an exponential law according to Davis et al. (1993) which is defined as follows (Elósegui et al., 1998; Yang et al., 2018):
where hj and hj+m are the height of voxel j and voxel j+m, respectively. Moreover, H is the wet scale height, which varies between 1 to 2 km (Kleijier, 2004; Yang et al., 2018).
By adding Eqs. (7) and (8) to Eq. (4), an expanded tomography model can be formulated:
In Eq. (9), H and V are the coefficients of the horizontal and vertical constraints.
2.2 The Concept of Virtual Reference Station
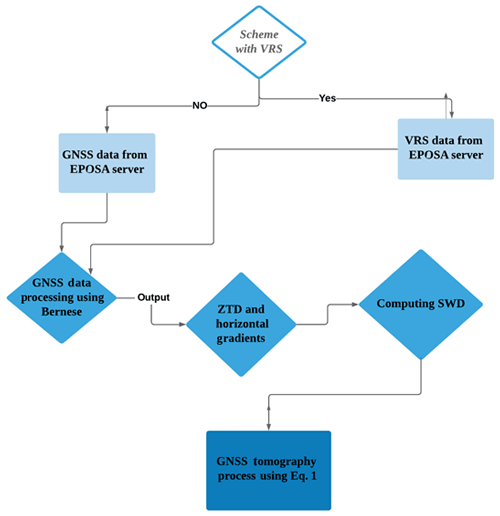
Virtual Reference Stations (VRS) are points of interest for which synthetic GNSS observations are calculated from neighboring GNSS permanent stations data (Al-Shaery et al., 2011; Odijk, 2002; Zhang et al., 2009). In Austria, EPOSA (Echtzeit Positionierung Austria) offers VRS observations for any point within the GNSS network, which consists of about 35 national distributed sites. For our study, the EPOSA service (http://eposa.oebb.at/, last access: 13 November 2019) has been used for computation of the desired VRS data. Moreover, we have used the Bernese GNSS software to process of GNSS observation in order to estimate the zenith tropospheric delay (ZTD). After that, we applied Eq. (3) to calculate SWD observations for Eq. 4) (Adavi and Mashhadi-Hossainali, 2014; Dach et al., 2015). The flow diagram of these steps is illustrated in Fig. 1.
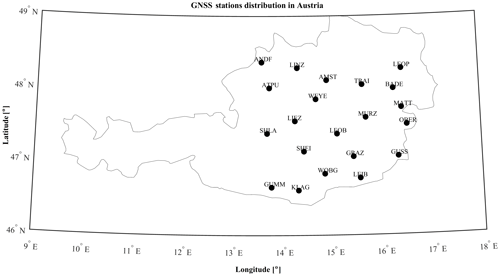
The region used in this study covers the area of the EPOSA GNSS network. As shown in Fig. 2, our case study includes data from 21 multi GNSS stations, which are mostly located in the eastern part of Austria. In this study, we have only used GPS and GLONASS observations because in 2017 only a minor number of active Galileo satellites was available and Beidou satellites were not be tracked by the used receivers. On the other hand, by analyzing a slightly limited observation scenario is well suited to focus on the effect of constraints in the tomography solution.
In addition, the height of the GNSS stations varies from 220 to 860 m. Therefore, significant height differences (around 550 m) exist which will impact the accuracy of the reconstructed field (Troller, 2004b). Moreover, DoYs 245–256 in September 2017 was chosen as a period of interest due to the unstable weather conditions in the period (see Fig. 3). In Fig. 3 precipitation and relative humidity were obtained from the AROME model and radiosonde observation, respectively.
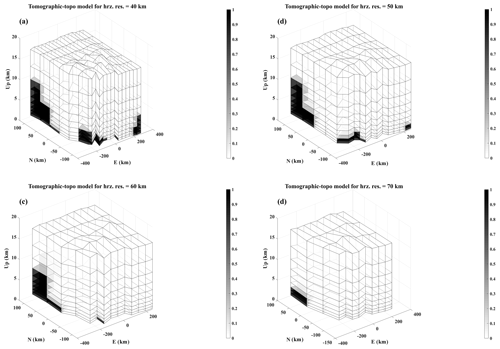
Figure 4The tomography model for the horizontal resolutions of (a) 40 km, (b) 50 km, (c) 60 km and (d) 70 km.
For parameterization above the area of interest, we need to select an optimum size of the model elements. Here, the model space resolution matrix (Rm) concept (Adavi and Mashhadi-Hossainali, 2014) has been applied to select an optimal horizontal resolution of the tomography model between 40 and 70 km (see Fig. 4). According to this tool, an optimal resolution is obtained when the resolution matrix is close to identity (Aster et al., 2003). In this situation, the number of poorly resolved model elements by GNSS signals (shaded voxels in Fig. 4), is decreased. Consequently, resolution matrices have converged to the identity matrix (see Fig. 4d). However, as the refractivity is considered as constant value in each voxel, the model elements should not be too large. Hence, 60 km was selected as the optimum horizontal resolution. In vertical direction, an exponential model was applied (Manning, 2013; Möller, 2017; Perler, 2011). Moreover, in this research the time resolution of the tomographic model was chosen to be 1 h that means 24 epochs in each day.

Figure 5GNSS stations distribution in Scheme 1 (a) and GNSS and VRS distribution in Scheme 2 (b), where GNSS stations, VRS stations and Radiosonde station are displayed in black, red and blue colors, respectively.
In this section, we evaluate the quality of the reconstructed refractivity field according to Eq. (9) in comparison with the VRS stations concept. Therefore, three different schemes have been considered as explained below:
Scheme 1. GNSS Reference Stations + Horizontal Constraints + Vertical Constraints.
Scheme 2. GNSS Reference Stations excluding five stations + Virtual Reference Stations.
Scheme 3. GNSS Reference Stations excluding five stations + Horizontal Constraints + Vertical Constraints.
This allows us to analyze the impact of VRS station data and the applied constraints equation in a sparse GNSS network. Figure 5 illustrates the distribution of GNSS and VRS stations in Schemes 1 and 2. In addition, the distribution of GNSS stations in Scheme 3 is the same as for Scheme 2 without any VRS stations. Moreover, as shown in Fig. 5b VRS stations have been purposely placed at the corners of the voxels due to the fact that the minimum number of virtual stations, which solve the rank deficiency of matrix A is attained when VRSs are placed at the corners of the voxels (Adavi and Mashhadi-Hossainali, 2014).
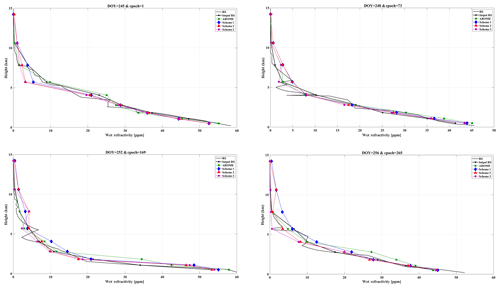
Figure 7Comparison of wet refractivity profiles of different schemes to the profile derived from radiosonde data in DoYs (a) 245, (b) 248, (c) 252 and (d) 256 at first epoch (00:00 UTC).
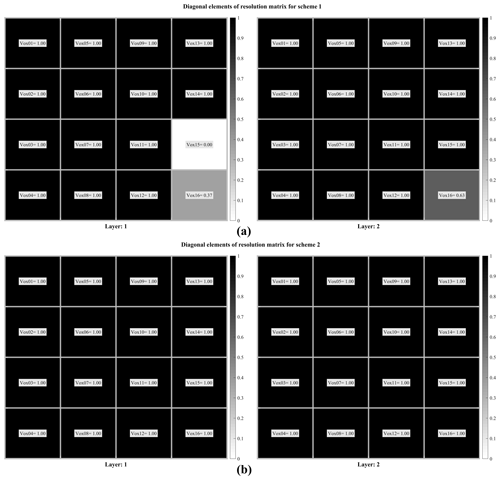
To illustrate the ability of VRS station data to improve the resolution of model elements, especially in the boundary layers, Fig. 6 shows the model elements of resolution matrix in different layers. According to this figure, some voxels are empty in the first and second layers (see Fig. 6a), but by adding VRS stations, all voxels are crossed by GNSS signals (see Fig. 6b), and the rank deficiency of the problem is solved.
To analyze the efficiency of the three schemes, the reconstructed refractivity profile at the position of the Vienna radiosonde station (see Fig. 5) has been compared to the corresponding wet refractivity profile which is computed from the radiosonde data. This comparison has been done for each day at 00:00 UTC. Therefore, the AROME intial field and the RS data were interpolated to the center heights of the voxel model (see Intpol RS profile in Fig. 7). According to Fig. 7, up to a height of 5 km, the agreement between the reconstructed profiles and the radiosonde profile is about 0.93, 1.016, and 1.08 ppm for Schemes 1 to 3, respectively. Therefore, compared to the AROME initial field profile (RMSE: 1.71 ppm), all tomography schemes provide an improved consistency with RS profile in lower parts using tomography estimation. Nevertheless, in the upper parts, differences between these profiles become visible. They can be attributed to a real difference in atmospheric conditions which are sampled at different locations and times or an insufficient number of GNSS rays in the intended voxels (Shangguan et al., 2013).
Table 1RMSE of wet refractivity profile for different schemes during study period at first epoch (00:00 UTC).
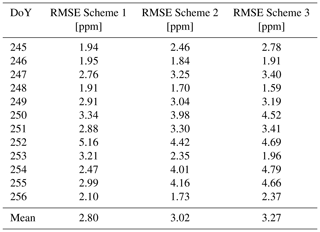
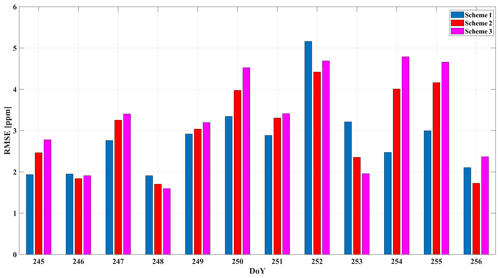
As shown in Table 1 and Fig. 8, the average of RMSE in Scheme 1 is about 2.80 ppm. Moreover, the average of RMSE for the second and third scheme are 3.02 and 3.27 ppm. Therefore, the accuracy of Scheme 1 (21 GNSS stations) is generally better than Scheme 2 (15 GNSS stations + 2 VRS stations) during the period of interest. It maybe returns to the effect of modeling errors during the VRS station data generation. On the other hand, applying the VRS stations concept compared to horizontal and vertical constraints in sparse GNSS network provides a better reconstructed profile. This indicates that the idea of adding VRS stations data performs well where the network of GNSS stations is not dense.
In this paper, we have analyzed the impact of different constraints on the accuracy of the reconstructed refractivity field. For this purpose, data from a GNSS network located in the Austrian region has been used. Then, we have defined three different schemes to reduce the elements of the model null space to the trivial ones. In the first scheme, minimum horizontal and vertical constraints were added to the system of observation equations. Then, we have left out five real GNSS stations but added data of two additional VRS sites to focus on the accuracy of reconstructed field using the VRS stations concept in a sparse GNSS network. In the third schemes, to evaluate the accuracy of estimated parameters by the previous schemes, we have applied constraints to the tomography model in the sparse GNSS network. According to our results, the RMSE of the reconstructed refractivity field in the dense GNSS network with respect to the radiosonde profile was about 2.80 ppm for a period of interest. Moreover, in the sparse GNSS network, the average of RMSE for schemes with VRS stations and applied constraints was about 3.02 and 3.27 ppm, respectively. Consequently, the quality of reconstructed refractivity profiles in Scheme 1 was generally better than two other schemes. Besides, according to these results applying VRS stations in the sparse GNSS network can lead to a better solution in comparison to just applying vertical and horizontal constraints. We can conclude that, the refractivity field can be reconstructed using VRS stations with acceptable accuracy when one of the following conditions exists: (1) the distance between GNSS stations are larger than the horizontal resolution, (2) topography is too rough, (3) some GNSS station are not working for a short period of time. Nevertheless, applying VRS stations in dense GNSS networks is not recommended as it might increase the inconsistency between the reconstructed field and the reference solution.
The investigated GNSS station and VRS data was provided by national GNSS Reference service EPOSA; and the used meteorological data was taken from ZAMG service. Both data can be provided for the interested parties upon request. In addition, radiosonde observation is available at http://weather.uwyo.edu/upperair/sounding.html (last access: 13 November 2019).
ZA as a first and corresponding author contributed by the formulation of the GNSS tomography process. The discussion of the reconstructed field has been provided by ZA and RW. RW commenced the research idea, supervised the project and reviewed the paper. The paper has been prepared by ZA with contributions from RW.
The authors declare that they have no conflict of interest.
This article is part of the special issue “European Geosciences Union General Assembly 2019, EGU Geodesy Division Sessions G1.1, G2.4, G2.6, G3.1, G4.4, and G5.2”. It is a result of the EGU General Assembly 2019, Vienna, Austria, 7–12 April 2019.
The authors would like to thank EPOSA for providing GNSS and VRS observations required for conducting this study. The ZAMG is also thanked for providing Numerical weather model data for Austria. Moreover, the IGS and CODE are appreciated for providing orbit data and ionospheric grid (IONEX) information.
This paper was edited by Rosa Pacione and reviewed by Gregor Moeller and one anonymous referee.
Adavi, Z. and Mashhadi-Hossainali, M.: 4D-Tomographic Reconstruction of the Tropospheric Wet Refractivity Using the Concept of Virtual Reference Station, Case Study: North West of Iran, Meteorol. Atmos. Phys., 125, 193–205, https://doi.org/10.1007/s00703-014-0342-4, 2014.
Adavi, Z. and Mashhadi-Hossainali, M.: 4D-tomographic reconstruction of water vapor using the hybrid regularization technique with application to the North West of Iran, Adv. Space Res., 55, 1845–1854, https://doi.org/10.1016/j.asr.2015.01.025, 2015.
Al-Shaery, A., Lim, S., and Rizos, C.: Investigation of Different Interpolation Models Used in Network-RTK for the Virtual Reference Station Technique, Journal of Global Positioning Systems, 10, 136–148, 2011.
Aster, R., Borchers, B., and Thurber, C.: Parameter Estimation and Inverse Problems, Elsevier Academic Press, Amsterdam Boston, 313 pp., 2003.
Bender, M. and Raabe, A.: Preconditions to ground based GPS water vapour tomography, Ann. Geophys., 25, 1727–1734, https://doi.org/10.5194/angeo-25-1727-2007, 2007.
Bender, M., Dick, G., Ge, M., Deng, Z., Wickert, J., Kahle, H.-G., Raabe, A., and Tetzlaff, G.: Development of a GNSS water vapour tomography system using algebraic reconstruction techniques, Adv. Space Res., 47, 1704–1720, https://doi.org/10.1016/j.asr.2010.05.034, 2011.
Benevides, P., Nico, G., Catalão, J., and Miranda, P.: Merging SAR interferometry and GPS tomography for high-resolution mapping of 3D tropospheric water vapour, in: 2015 IEEE International Geoscience and Remote Sensing Symposium (IGARSS), Milan, Italy, 26–31 July 2015, IEEE, 3607–3610, https://doi.org/10.1109/IGARSS.2015.7326602, 2015.
Benevides, P., Nico, G., Catalão, J., and Miranda, P. M. A.: Bridging InSAR and GPS Tomography: A New Differential Geometrical Constraint, IEEE T. Geosci. Remote, 54, 697–702, https://doi.org/10.1109/TGRS.2015.2463263, 2016.
Benevides, P., Catalao, J., Nico, G., and Miranda, P. M. A. J. G. S.: 4D wet refractivity estimation in the atmosphere using GNSS tomography initialized by radiosonde and AIRS measurements: results from a 1-week intensive campaign, 22, 91, https://doi.org/10.1007/s10291-018-0755-5, 2018.
Bevis, M., Businger, S., Herring, T. A., Rocken, C., Anthes, R. A., and Ware, R. H.: GPS meteorology: remote sensing of atmospheric water vapor using the Global Positioning System, J. Geophys. Res., 97, 15787–15801, 1992.
Böhm, J., Werl, B., and Schuh, H.: Troposphere mapping functions for GPS and very long baseline interferometry from European Centre for Medium-Range Weather Forecasts operational analysis data, J. Geophys. Res., 111, B02406, https://doi.org/10.1029/2005JB003629, 2006.
Brenot, H., Rohm, W., Kačmařík, M., Möller, G., Sá, A., Tondaś, D., Rapant, L., Biondi, R., Manning, T., and Champollion, C.: Cross-validation of GPS tomography models and methodological improvements using CORS network, Atmos. Meas. Tech. Discuss., https://doi.org/10.5194/amt-2018-292, 2018.
Champollion, C., Masson, F., Bouin, M.-N., Walpersdorf, A., Doerflinger, E., Bock, O., and van Baelen, J.: GPS water vapour tomography: preliminary results from the ESCOMPTE field experiment, Atmos. Res., 74, 253–274, https://doi.org/10.1016/j.atmosres.2004.04.003, 2005.
Chen, B. and Liu, Z.: Voxel-optimized regional water vapor tomography and comparison with radiosonde and numerical weather model, J. Geodesy., 88, 691–703, https://doi.org/10.1007/s00190-014-0715-y, 2014.
Chen, G. and Herring, T. A.: Effects of atmospheric azimuthal asymmetry on the analysis of space geodetic data, J. Geophys. Res., 102, 20489–20502, https://doi.org/10.1029/97JB01739, 1997.
Dach, R., Lutz, S., Walser, P., and Fridez, P.: Bernese GNSS Software Version 5.2, Astronomical Institute, University of Bern, Switzerland, 2015.
Davis, J. L., Elgered, G., Niell, A. E., and Kuehn, C. E.: Ground-based measurements of the gradients in the “wet” radio refractivity of air, Radio Sci., 28, 1003–1018, 1993.
Elfving, T., Nikazad, T., and Hansen, P. C.: Semi-convergence and relaxation parameters for a class of SIRT algorithms, Electron. T. Numer. Ana., 37, 321–336, 2010.
Elfving, T., Hansen, P. C., and Nikazad, T.: Semi-convergence properties of Kaczmarz's method, Inverse Probl., 30, 055007, https://doi.org/10.1088/0266-5611/30/5/055007, 2014.
Elósegui, P., Ruis, A., Davis, J. L., Ruffini, G., Keihm, S. J., Bürki, B., and Kruse, L. P.: An experiment for estimation of the spatial and temporal variations of water vapor using GPS data, Phys. Chem. Earth, 23, 125–130, https://doi.org/10.1016/S0079-1946(97)00254-1, 1998.
Flores, A., Ruffini, G., and Rius, A.: 4D tropospheric tomography using GPS slant wet delays, Ann. Geophys., 18, 223–234, https://doi.org/10.1007/s00585-000-0223-7, 2000.
Foelsche, U. and Kirchengast, G.: Tropospheric water vapor imaging by combination of ground-based and space born GNSS sounding data, J. Geophys. Res., 106, 27221–27231, 2001.
Golub, G. H. and von Matt, U.: Generalized Cross-Validation for Large Scale Problems, J. Comput. Graph. Stat., 6, 1–34, https://doi.org/10.1080/10618600.1997.10474725, 1997.
Gradinarsky, L. and Jarlemark, P.: Ground-based GPS tomography of water vapour: Analysis of simulated and real data, J. Meteorol. Soc. Jpn., 82, 551–560, 2004.
Guerova, G., Jones, J., Douša, J., Dick, G., de Haan, S., Pottiaux, E., Bock, O., Pacione, R., Elgered, G., Vedel, H., and Bender, M.: Review of the state of the art and future prospects of the ground-based GNSS meteorology in Europe, Atmos. Meas. Tech., 9, 5385–5406, https://doi.org/10.5194/amt-9-5385-2016, 2016.
Guo, J., Yang, F., Shi, J., and Xu, C.: An Optimal Weighting Method of Global Positioning System (GPS) Troposphere Tomography, IEEE J. Sel. Top. Appl., 9, 5880–5887, https://doi.org/10.1109/JSTARS.2016.2546316, 2016.
Hansen, P. C.: Rank-Deficient and Discrete III-Posed Problems: Numerical Aspect of Linear Inversion, edited by: SIAM, Philadelphia, 264 pp., 1998.
Heublein, M.: GNSS and InSAR based water vapor tomography: A Compressive Sensing solution, PhD thesis, Institute of Photogrammetry and Remote Sensing, Karlsruhe Institute of Technology, Germany, 134 pp., 2019.
Hirahara, K.: Local GPS tropospheric tomography, Earth Planets Space, 52, 935–939, 2000.
Kaltenbacher, B., Neubauer, A., and Scherzer, O.: Iterative Regularization Methods for Nonlinear Ill-Posed Problems, in: volume 6 of Radon Series on Computational and Applied Mathematics, Walter de Gruyter GmbH & Co. KG, Berlin, 2008.
Kleijier, F.: Troposphere Modeling and Filtering for Precise GPS Leveling, PhD thesis, Department of Mathematical Geodesy and Positioning, Delft Univetrsity of Technology, Delft, Netherlands, 260 pp., 2004.
Lutz, S. M.: High-resolution GPS tomography in view of hydrological hazard assessment, PhD thesis, ETH Zurich, Switzerland, 219 pp., 2008.
Manning, T., Zhang, K., Rohm, W., Choy, S., and Hurter, F.: Detecting Severe Weather using GPS Tomography: An Australian Case Study, Journal of Global Positioning Systems, 11, 58–70, 2012.
Manning, T.: Sensing the dynamics of severe weather using 4D GPS tomography in the Australian region, PhD thesis, School of Mathematical and Geospatial Sciences College of Science, Engineering and Health, Royal Melbourne Institute of Technology (RMIT) University, Australia, 2013.
Möller, G.: Reconstruction of 3D wet refractivity fields in the lower atmosphere along bended GNSS signal paths, PhD thesis, TU Wien, Austria, 2017.
Nikazad, T.: The Use of Landweber Algorithm in Image Reconstruction, PhD thesis, Department of Mathematics, Linköpings University, Sweden, 2007.
Odijk, D.: Fast precise GPS positioning in the presence of ionospheric delays, PhD thesis, University of Delft, Netherlands, 2002.
Perler, D.: Water vapour tomography using global navigation satellite systems, PhD, ETH Zurich, Switzerland, 2011.
Perler, D., Geiger, A., and Hurter, F.: 4D GPS water vapor tomography: new parameterized approaches, J. Geodesy., 85, 539–550, https://doi.org/10.1007/s00190-011-0454-2, 2011.
Rasmussen, J. M.: Compact Linear Operators and Krylov Subspace Methods, Master thesis, Mathematics and Informatics and Mathematical Modeling, Technical University of Denmark, Denmark, 2001.
Rohm, W.: The precision of humidity in GNSS tomography, Atmos. Res., 107, 69–75, 2012a.
Rohm, W.: The ground GNSS tomography – unconstrained approach, Adv. Space Res., 51, 501–513, 2012b.
Rohm, W. and Bosy, J.: Local tomography troposphere model over mountains area, Atmos. Res., 93, 777–783, https://doi.org/10.1016/j.atmosres.2009.03.013, 2009.
Rohm, W. and Bosy, J.: The verification of GNSS tropospheric tomography model in a mountainous area, Adv. Space Res., 47, 1721–1730, https://doi.org/10.1016/j.asr.2010.04.017, 2011.
Rohm, W., Zhang, K., and Bosy, J.: Unconstrained, robust Kalman filtering for GNSS troposphere tomography, Atmos. Meas. Tech. Discuss., 6, 9133–9162, https://doi.org/10.5194/amtd-6-9133-2013, 2013.
Rohm, W., Zhang, K., and Bosy, J.: Limited constraint, robust Kalman filtering for GNSS troposphere tomography, Atmos. Meas. Tech., 7, 1475–1486, https://doi.org/10.5194/amt-7-1475-2014, 2014.
Shangguan, M., Bender, M., Ramatschi, M., Dick, G., Wickert, J., Raabe, A., and Galas, R.: GPS tomography: validation of reconstructed 3-D humidity fields with radiosonde profiles, Ann. Geophys., 31, 1491–1505, https://doi.org/10.5194/angeo-31-1491-2013, 2013.
Troller, M.: GPS based determination of the integrated and spatially distributed water vapor in the troposphere, Geodätisch-geophysikalische Arbeiten in der Schweiz, Swiss Geodetic Commission, volume 67, 2004a.
Troller, M. R.: GPS ased determination of the integrated and spatially distributed water vapor in the troposphere, PhD thesis, ETH Zurich, 189 pp., https://doi.org/10.3929/ethz-a-004796376, 2004b.
Trzcina, E. and Rohm, W.: Estimation of 3D wet refractivity by tomography, combining GNSS and NWP data: First results from assimilation of wet refractivity into NWP, Q. J. Roy. Meteor. Soc., 145, 1034–1051, https://doi.org/10.1002/qj.3475, 2019.
Wu, L.: A Parameter Choice Method for Tikhonov Regularization ENTA Kent State University, 6, 22, 2003.
Xia, P., Cai, C., and Liu, Z.: GNSS troposphere tomography based on two-step reconstructions using GPS observations and COSMIC profiles, Ann. Geophys., 31, 1805–1815, https://doi.org/10.5194/angeo-31-1805-2013, 2013.
Yang, F., Guo, J., Shi, J., Zhou, L., Xu, Y., and Chen, M.: A Method to Improve the Distribution of Observations in GNSS Water Vapor Tomography, Sensors, 18, 2526, https://doi.org/10.3390/s18082526, 2018.
Zhang, B., Fan, Q., Yao, Y., Xu, C., and Li, X.: An Improved Tomography Approach Based on Adaptive Smoothing and Ground Meteorological Observations, Remote Sens., 9, 886, https://doi.org/10.3390/rs9090886, 2017.
Zhang, S., Lim, S., Rizos, C., and Guo, J.: Atmosphere Decomposition for VRS Based Network-RTK System, in: Proceedings of the 22nd International Technical Meeting of the Satellite Division of The Institute of Navigation (ION GNSS 2009), Savannah, GA, 22–25 September 2009, 2707–2716, 2009.
Zhao, Q., Yao, Y., Cao, X., Zhou, F., and Xia, P.: An Optimal Tropospheric Tomography Method Based on the Multi-GNSS Observations, Remote Sens., 10, 234, https://doi.org/10.3390/rs10020234, 2018.
Zhao, Q., Zhang, K., Yao, Y., and Li, X. J.: A new troposphere tomography algorithm with a truncation factor model (TFM) for GNSS networks, GPS Solut., 23, 64, https://doi.org/10.1007/s10291-019-0855-x, 2019.


