 | 17 Oct 2019
Small reservoirs for a sustainable water resources management
Stefano Casadei
Silvia Di Francesco
Francesca Giannone
Arnaldo Pierleoni
Small reservoirs are widely used for storing water, especially for irrigation purposes. During the last decades, in Italy many of these reservoirs have been dismissed, becoming an untapped resource. As a matter of fact, maintenance problems connected to these structures together with their natural tendency to silt have favored the use of other water supply resources such as withdrawal from wells.
The increase of drought periods and the high water volume demand for agricultural purposes suggest to evaluate a full and rational use of all water resources, leading to a rediscovery and enhancement of untapped resources. Specifically, this research focuses on small reservoirs and on their potential contribution to a sustainable water management in agriculture. Unfortunately, there are no reliable data on their number, spatial distribution and potential storage volume. The aim of this work is to define reservoir spatial distribution and evaluate potential available water volumes. The upper Tiber river basin has been selected as a case study for the methodology proposed. The work starts from the acquisition and re-elaboration of the old census of small reservoirs, evaluating, through GIS and regression techniques, the distribution over the territory and the available volumes. Then the reservoir census and the derived database were updated for the period from 2015 up to 2019 introducing combined computational procedures of remote sensing techniques and GIS, based on satellite images and water index calculation. The results of the semi automatic procedure used show good performance in lake identification, making it a promising tool for a fast and reliable water body identification and evaluation in wide areas.
- Article
(12745 KB) - Full-text XML
- BibTeX
- EndNote


The topic of small reservoirs has been, in the history of Italy, of fluctuating interest: from the boom of the 1960s and 1970s to the abandonment in the following years, up to a very recent new interest for these hydraulic works distributed all over the national territory, which derives from the extreme fluctuations in water availability. At the turn of the 1960s and 1970s thousands of small reservoirs were built in Italy with the aim of having a considerable water reserve distributed over the territory to the benefit of agriculture. This was also possible thanks to a far-sighted agricultural policy that offered great financing to companies for the building of these works.
Over the years maintenance problems of these structures have become a huge issue for farmers, and their restoration is surely not economically viable, leading to the abandonment of a considerable number of small reservoirs.
The problem of drought mitigation, one of the most serious problems on the planet linked to climate change, lies also in the management of these reservoirs. They could be a possible tool to preserve agriculture and protect water resources.
Small reservoirs are widespread all over the territory, but often there are no reliable data on their potential storage volume and water availability. In the recent literature, there are studies that describe new approaches for estimating the storage volume, which are essentially based on new computational procedures combined with remote sensing techniques and GIS (Rodrigues et al., 2012; Sawunyama et al., 2006). On the other hand, since they are so widespread, it is often not easy to evaluate their contribution in water resources management policies (Venot and Krishnan, 2011; Wisser et al., 2010; Pierleoni et al., 2014) as well as their environmental impact and risk analysis in emergency conditions, such as flood and dam break (Habets et al., 2014; Biscarini et al., 2016; Di Francesco et al., 2016).
The situation in Italy is portrayed by the Italian Environmental Data Yearbook Edition 2016 (ISPRA, 2016). In 1998, the number of small reservoirs (height of the dam lower than or equal to 15 m and storage volume up to 106 m3) was assessed in 8288 units. In 2015 this result was updated to 6333, but this number is the result of a regional census and many regions did not provided reliable data. The Italian Committee for Large Dams, based on data from a satellite census carried out in 1988 and those obtained from a partial census conducted at regional level in 2010, estimates that small reservoirs have increased in number by 60 % over the period. Extending this result to all regions, the committee hypothesizes a possible total number of small reservoirs in Italy of between 12 000 and 14 000 (ITCOLD, 2017). During the last 30 years, Italy has been stressed by severe water crisis. In the past, drought periods brought this issue directly to the attention of the public awareness; now it is possible to plan proactive approaches to this problem with an accurate data analysis. Moreover, data from the withdrawals database show that about 70 % of all the freshwater withdrawals are for irrigation use. This aspect is highly relevant, not only from an administrative point of view, but also from a technical one, because irrigation use is concentrated in a 4-month period (June–September), which is also a critical period for drought in combination with hot weather. In this stressed scenario, water storage strategy has to involve also small-reservoir reuse.
The present study improves the knowledge about small reservoirs in the region of Umbria, on the basis of a regional database which has been analyzed and georeferenced on the map. Correlation equations were then built to estimate storage volume from surface area of lakes; finally a simulation model compared available water volume with the corresponding data for the irrigation demand at the basin and sub-basin scale. The simulated scenarios evaluate the possible contribution of small reservoirs in the framework of water resources management policies in drought periods. The first results of the study show the need to re-focus on these untapped reservoirs for water resources management, environmental impact and risk analysis. The georeferenced database and the WebGIS system can surely facilitate this operation. However, the need for further investigations is particularly evident, especially for the maintenance status of these small reservoirs.
These considerations highlight the need to update the regional database, in order to include new reservoirs present in the territory and exclude those no longer available. One of the objectives of this work is the evaluation of reservoirs in the period from 2015 up to now using remotely sensed data (Venturi et al., 2016). With satellite imagery it is possible to obtain a direct estimation of water bodies and update the previous regional census information. The applicability of remote sensing technique for the correct individuation of reservoir will be limited by spatial resolution of images, but despite this limitation, the advantage of this technique is the rapid acquisition of ground information over a large test area.
The initial part of the study deals with the collection of the most complete information on small reservoirs. In fact, as already mentioned about surveys conducted at national level, it is not easy to find a complete and reliable database; moreover difficulties in data management are increased by recent changes in competence between different administrative bodies: from provinces to regions.
First of all, the available data have been analyzed and georeferenced on the map for the entire province of Perugia, focusing on the availability of water volume storage data. Because in many cases this value is not available, reservoir capacities are evaluated through correlation laws between volume and lake surface. Data on lake surfaces have also been verified with computations from aerial images, as proposed by Sawunyama et al. (2006) for the Limpopo River basin. The georeferencing allows the identification of areas with the highest presence of small reservoirs to perform a first evaluation on the possible risk assessment and, consequently, to plan more detailed analysis, considering land use and morphological evolution of the territory with respect to the initial situation in which the reservoirs were built (back to over 50 years ago). The importance of having easily detectable data on the map led to the development of a WebGIS system, so the updating, analysis and spatial analysis of database can all be conducted in a high-performance way (Casadei et al., 2018), with the possibility of developing applications to quantify the water resource and risk.
All results will be inserted in the project Water Resources Management and Evaluation (WRME), an online virtual desktop where researchers, administrators and users can access/enter data and update processing. The ultimate goal of the platform is to verify the sustainability of the use and management of surface water resources. The available data can easily be displayed on the river network, providing information on possible criticality on surface water balance. WRME will be an open-development (easy-to-use) platform for researchers, technicians, administrators and various users.
Remote sensing techniques for lake identification
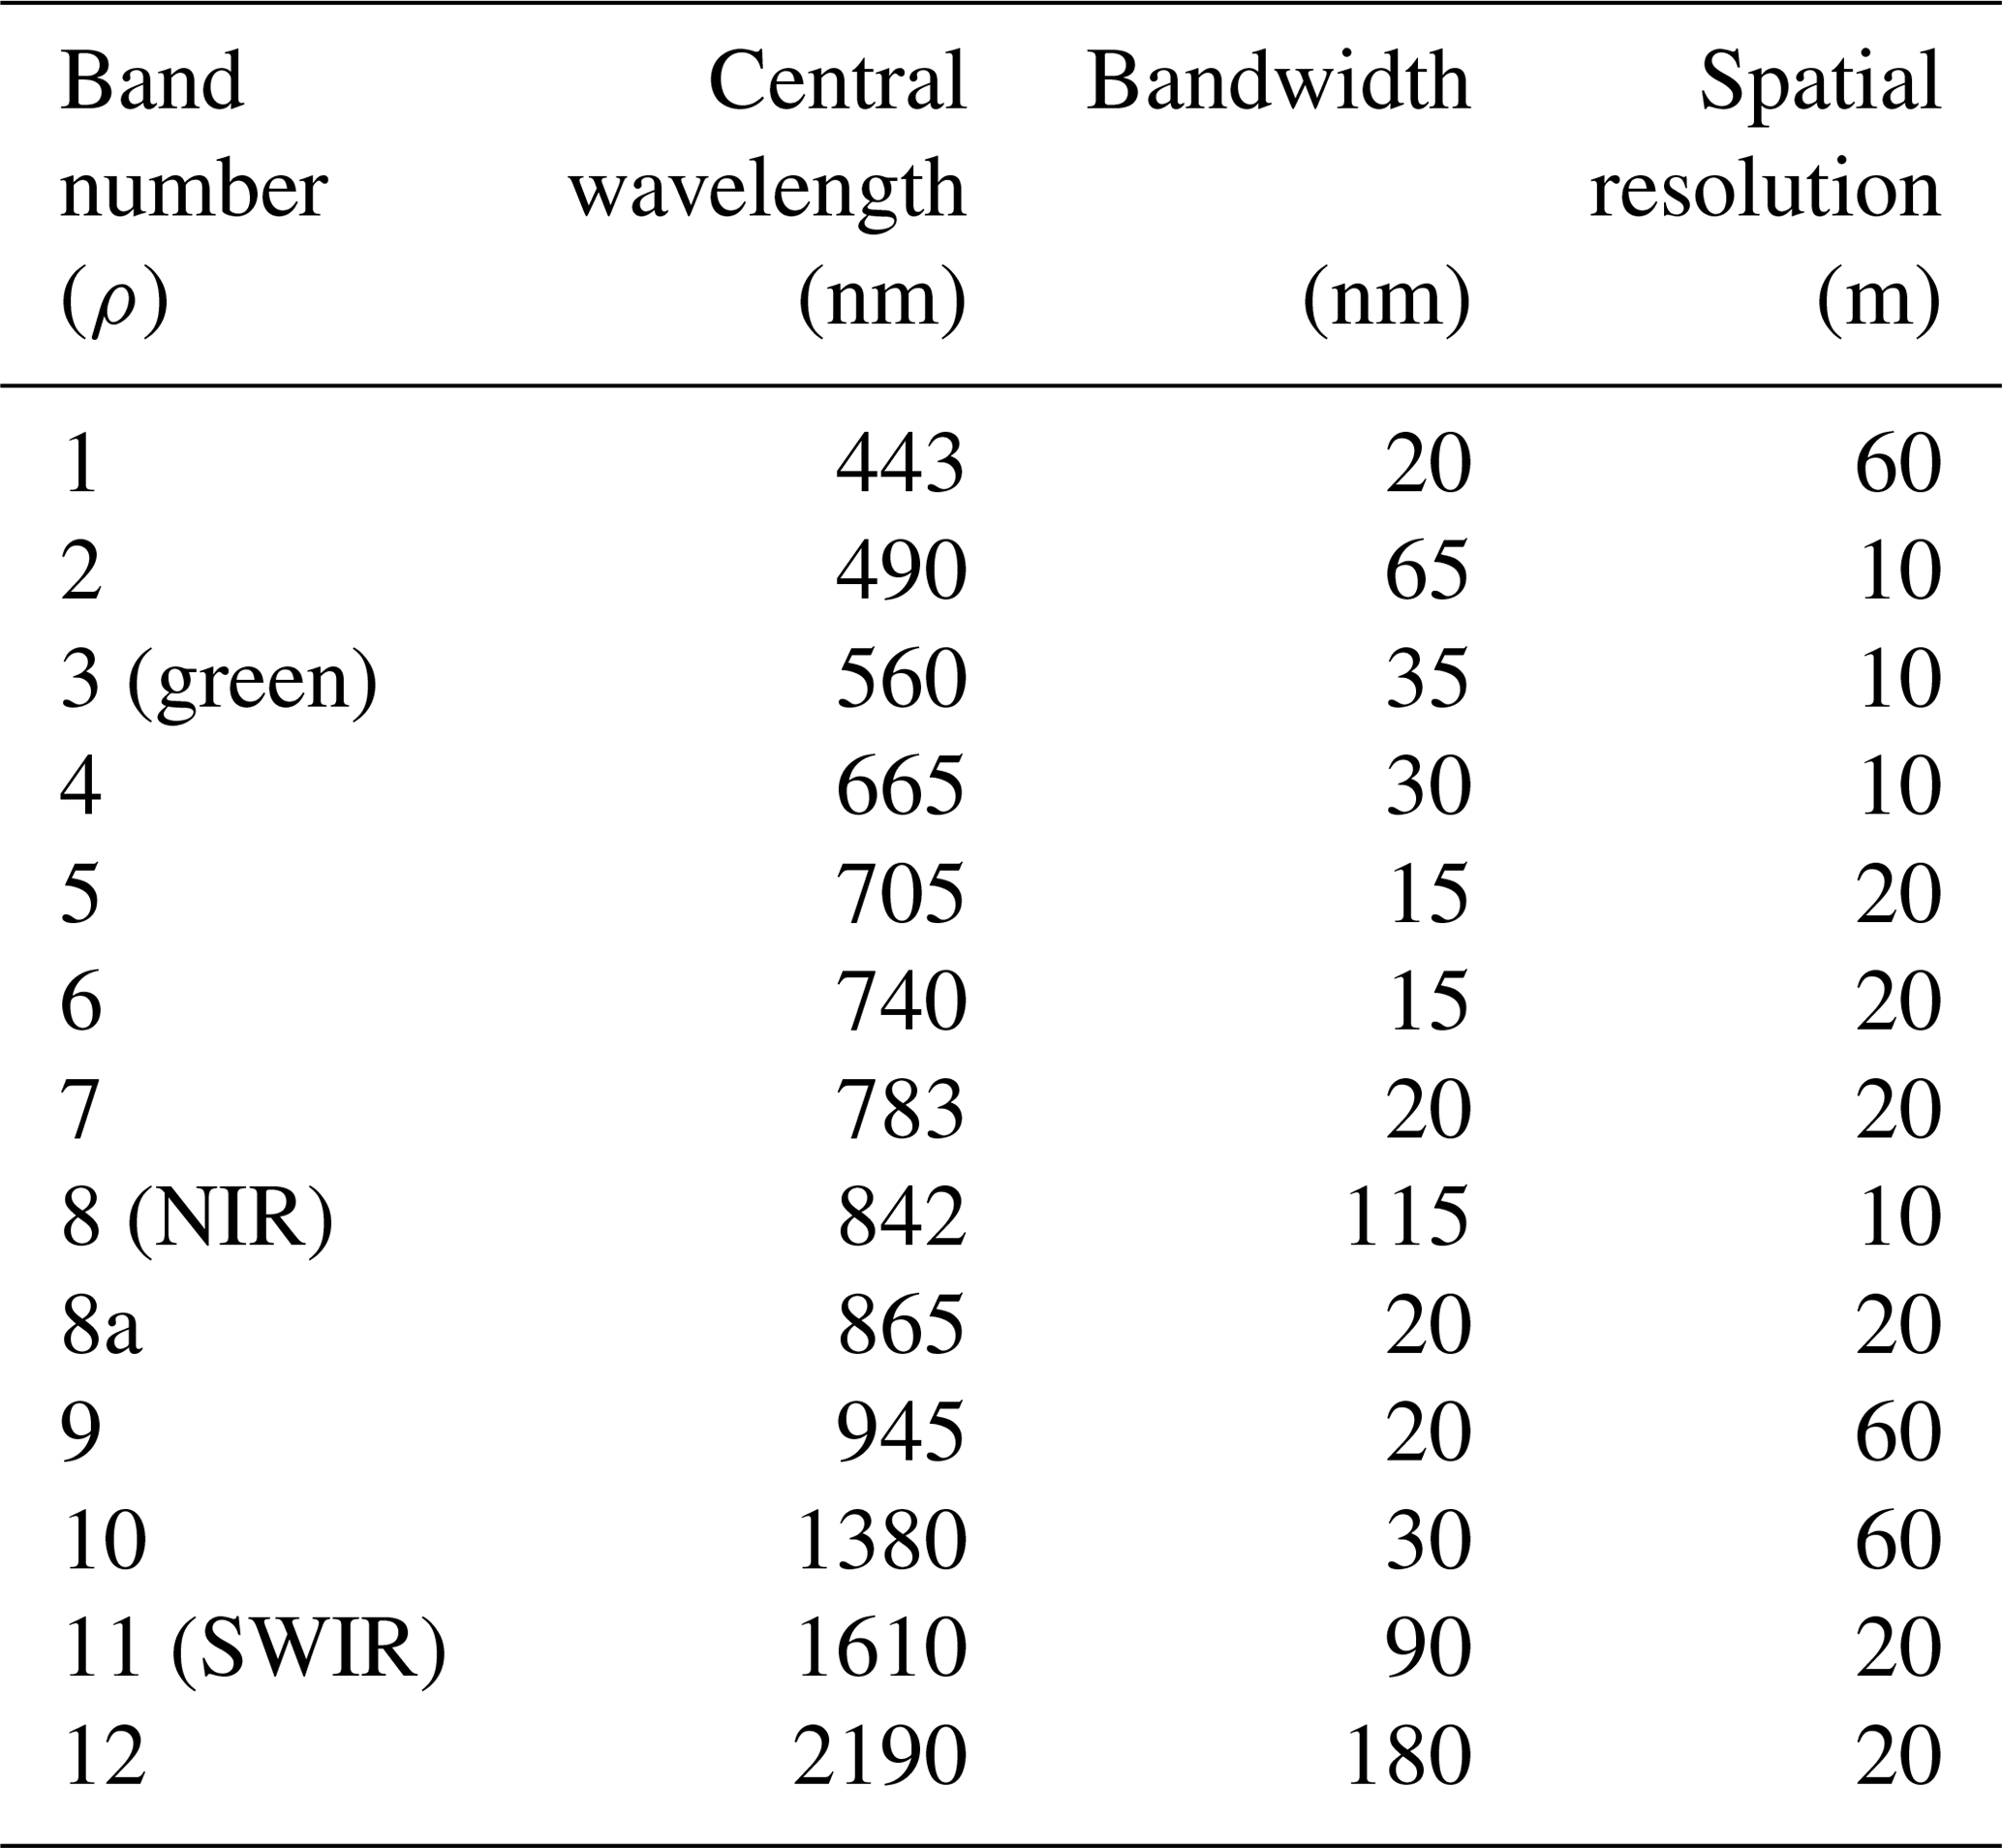
Sentinel-2 images are useful remote sensing data for regional water body mapping due to their attractive features: 10 m spatial resolution for four bands, 5 d revisit time and free access.
The Sentinel-2 satellite is a Copernicus mission including a constellation of two polar-orbiting satellites placed in the same sun-synchronous orbit at a mean altitude of 786 km, phased at 180∘ to each other (Sentinel-2A, Sentinel-2B).
Both Sentinel-2 platforms are equipped with a multi-spectral sensor that acquires 13 spectral bands with 12 bit radiometric resolution and different geometric resolutions at 10 m (blue, green, red and NIR), 20 m (six bands including SWIR) and 60 m, as reported in Table 1.
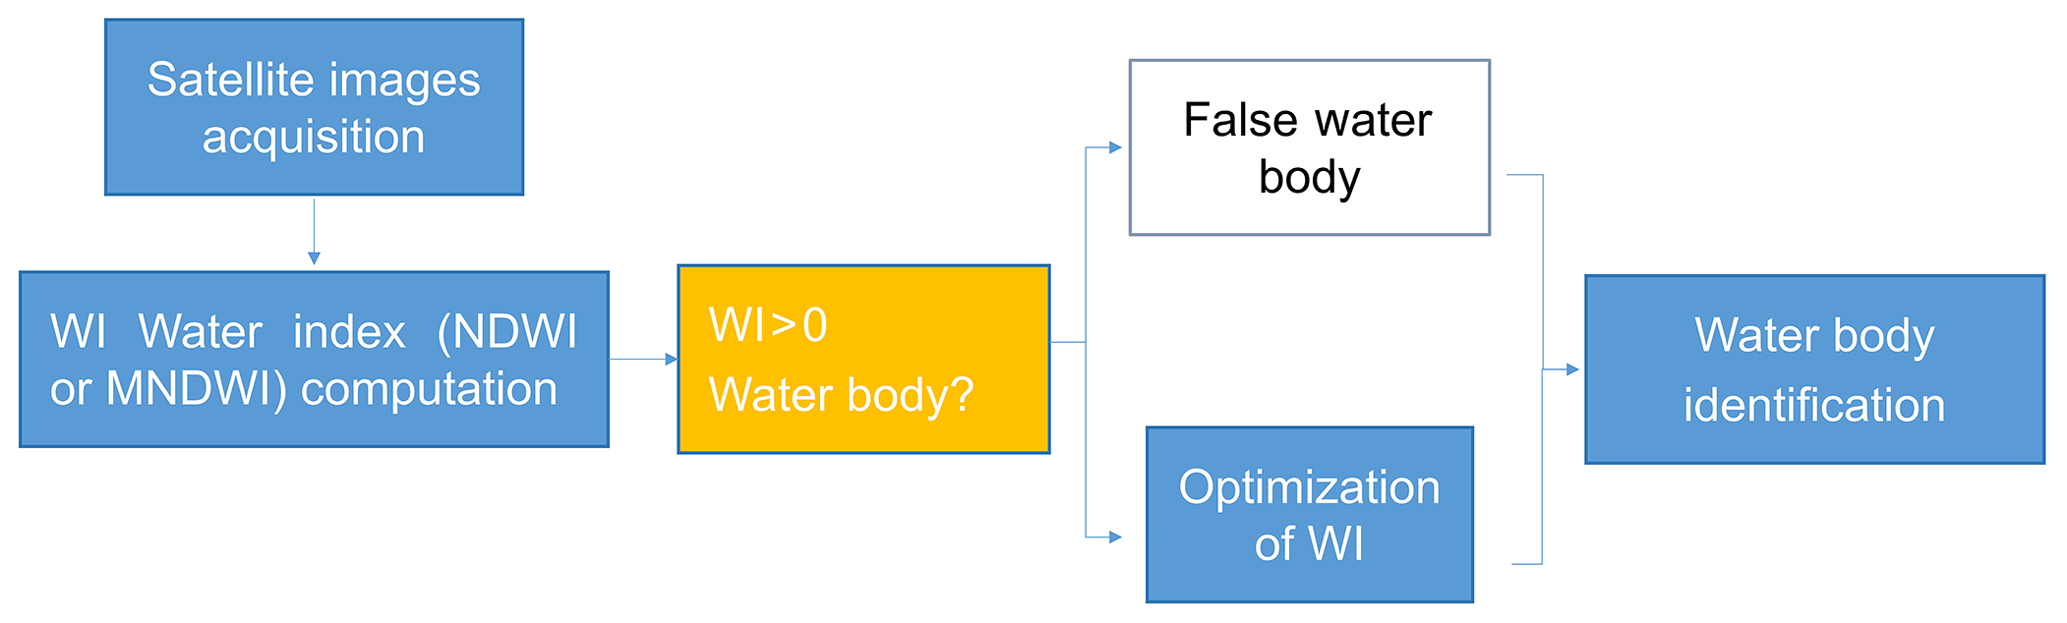
Remote sensed data are used for lake identification through water index (WI) evaluation by means of the NDWI (Normalized Difference Water Index) and the MNDWI (Modified Normalized Difference Water Index; Xiucheng et al., 2017; Gordana and Ugur, 2017; Yun et al., 2016; Dominici et al., 2019; Avisse et al., 2017; Gideon and Maurice, 2015; Mishra and Prasad, 2015).
The NDWI (Eq. 1) maximizes the reflectance properties of water by minimizing the low reflectance of near-infrared (NIR) and maximizing the reflectance in the green wavelength (Xu, 2006): better results are obtained for deeper water bodies and than for shallower parts.
The MNDWI (Eq. 2) is based on the fact that the reflected radiance of water in shortwave-infrared (SWIR) band is lower than that of other objects like vegetation, buildings, bare soil, and roads. This method also has constraints related to the resolution of the SWIR band that is lower than the green and NIR bands used in the NDWI.
The combination of images with different resolution requires therefore a resampling, upscaling in our case the green band from 10 to 20 m, losing in this way part of the information originally stored.
For both indexes, the possible presence of water is highlighted by positive values.
The water body identification using remote sense data was widely investigated in several geographical contexts. Different satellite platform products were used to compute the NDWI and MNDWI indices (Di Francesco and Giannone, 2019): Landsat images produced an accuracy of extracted water bodies greater than 88 % (Mishra and Prasad, 2015), while for RapidEye imagery the overall accuracy of 95 % was reached (Gideon and Maurice, 2015). Finally, Sentinel-2 multispectral images were tested in Venice coastland (Italy) obtaining an overall accuracy greater than 94 % (Yun et al., 2016) and in the urban area of Beijing and Yantai (China) obtaining an overall accuracy greater than 97 % (Xiucheng et al., 2017).
In this work we perform the extraction of water bodies from satellite imagery using different threshold values of WI: each pixel that passes the threshold test is classified as a water body (along with some other objects which are not truly a water class, providing false-positive results; Fig. 1).
All analyses are performed using free software SNAP (Sentinel Application Platform; Addabbo et al., 2016) and QGIS (QGIS Development Team, 2019) for the comparison between satellite information and the previous census.
3.1 Umbria Region database management and analysis
The database was processed with the use of GIS tools on the basis of the regional territory division into irrigation districts and following the 1989 Irrigation Plan. The subdivision of the reservoirs thus made it possible to evaluate, for each irrigation area, the total number of reservoirs present and to divide them, depending on the distance from the boundaries of the same district, into internal and external reservoirs (Table 2).

The analysis and rearrangement of the Umbria Region database led to the identification of 3210 small lakes. In the province of Perugia, 2740 small lakes are georeferenced on the map. The number goes down to 1346 excluding those with a useful volume of less than 10 000 m3; finally the number reaches 121 considering those with a useful volume between 50 000 and 106 m3. The mean distribution of small reservoirs therefore is one lake every 2 km2 if all lakes georeferenced are considered (2740 lakes); one lake every 4 km2 (1346 lakes considered) or one lake every 50 km2 (121 lakes considered). However, considering the surface of each corresponding hydrographic basin, this scenario tends to increase in smaller basins (100∕200 km2), where the number of total reservoirs per square kilometer approaches the unit.
Due to the serious lack of database records about lake-storage volume, the investigation has focused on the study of correlation equations for lake-surface area vs. lake-storage volume, for each irrigation district.
The coefficient of determination (R2) is used as a statistical measure of how successful the fitted regression model is in explaining the variation of the observed data.
With the application of the power relationship proposed by Sawunyama et al. (2006),
where A is the lake-surface area in square meters, C the lake-storage volume in cubic meters, and a and b calibration constants; the coefficient of determination is 0.5.
Better results have been obtained considering linear relations () between area and volume at irrigation district level, underestimating however the overall volume availability.
The water surface (A), available for all reservoirs from the database, is certainly more reliable information because it is easily verified with the surface data extrapolated by the GIS. The correlations obtained are then used to estimate the missing capacity data (C) and evaluate, for each district, the quantity of water resources potentially derived from the small reservoirs.
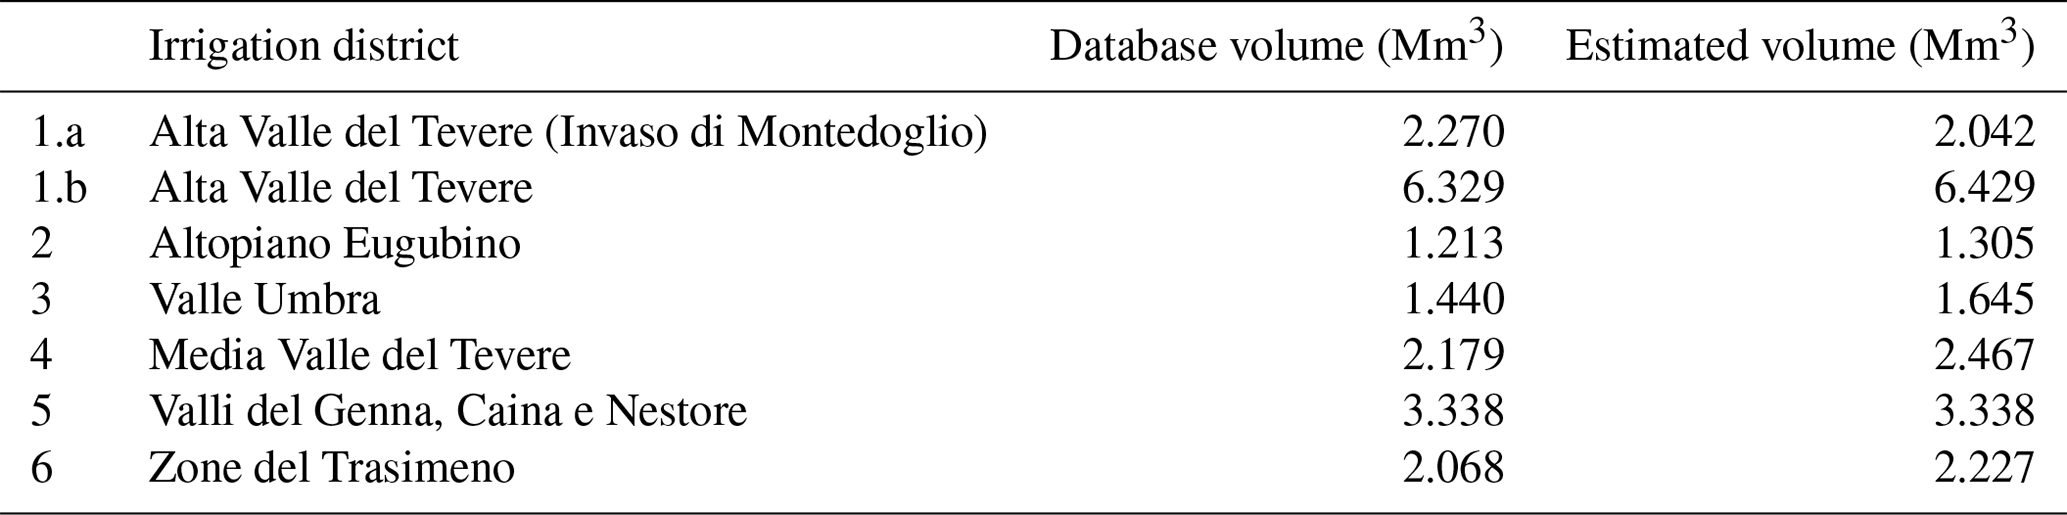
Table 2 shows the data obtained from these first elaborations: for each irrigation district, the total capacity value derived from database and that estimated with linear relationship are reported, highlighting a good estimation of reservoir capacity data by the proposed C–A relationships.
Considering this relation it is possible to use the entire database in order to analyze the water resource potentially available in these reservoirs, with respect to the currently active water withdrawals for irrigation use.
As illustrated in Fig. 2, the potential contribution of small reservoirs to irrigation can be easily evaluated and managed in a GIS environment, hence taken into account as integration to canonical water withdrawals from rivers and wells, especially in dry seasons.
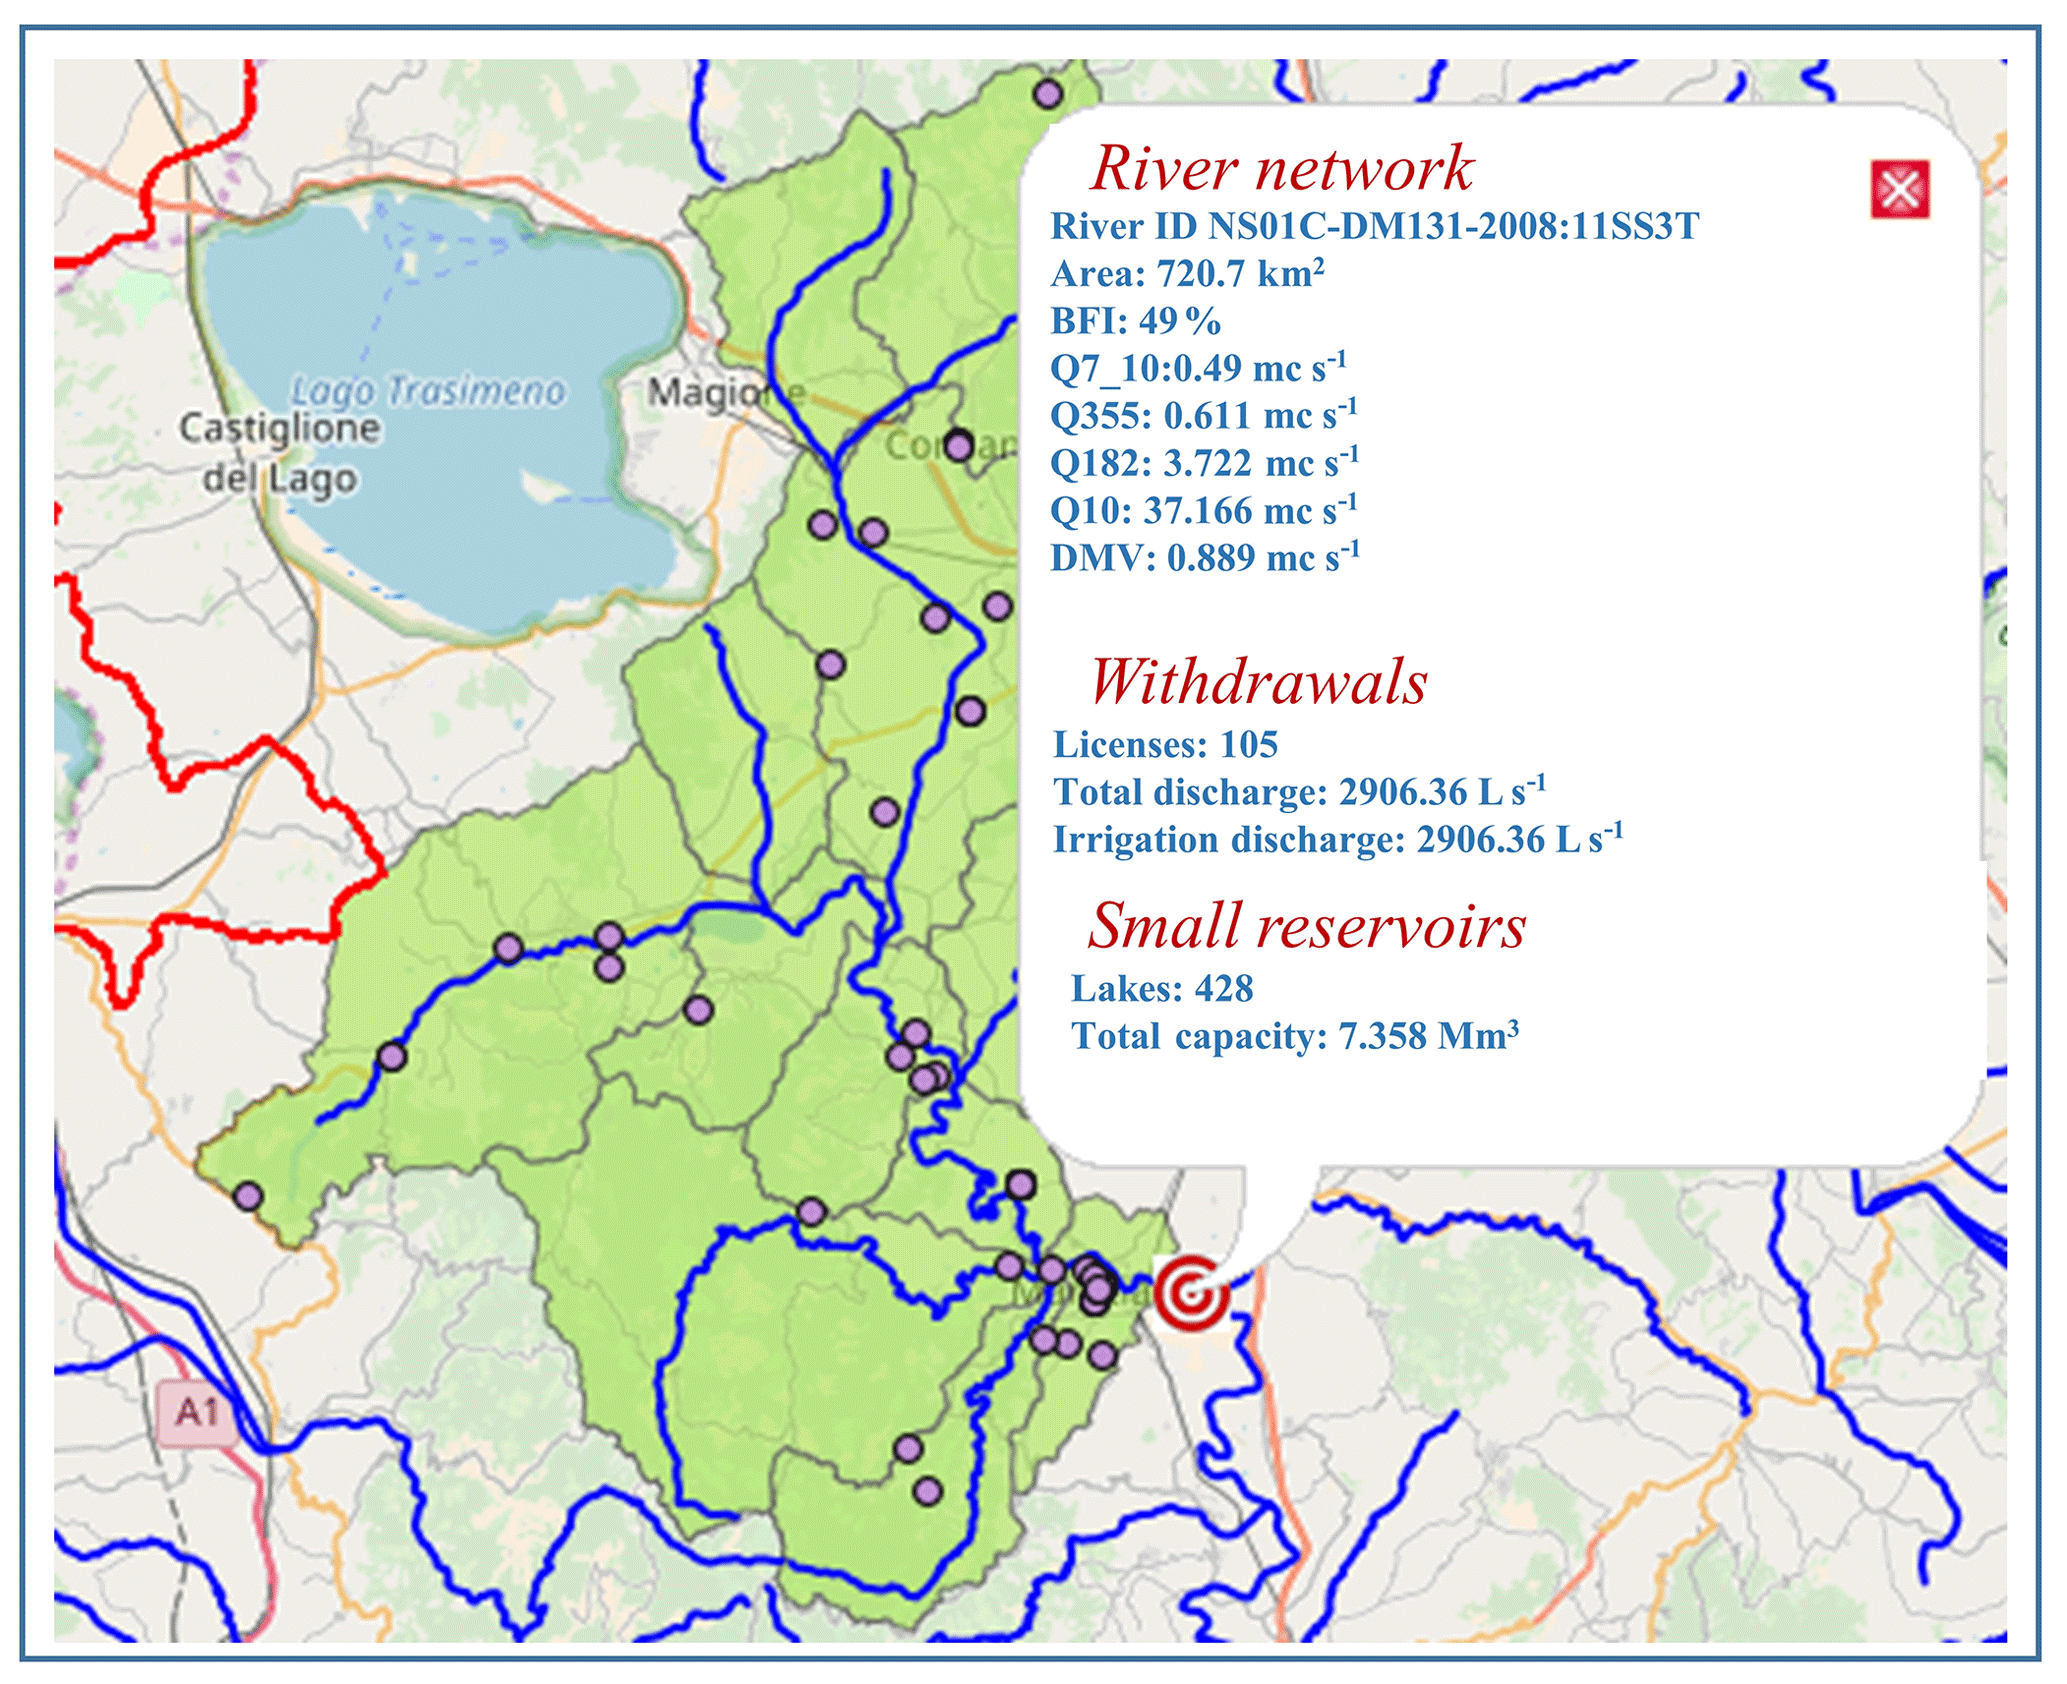
Figure 2WebGIS spatial query example: withdrawals from rivers and wells and small-reservoir availability. ©Google (Base) Map source: Dati Cartografici©2018.
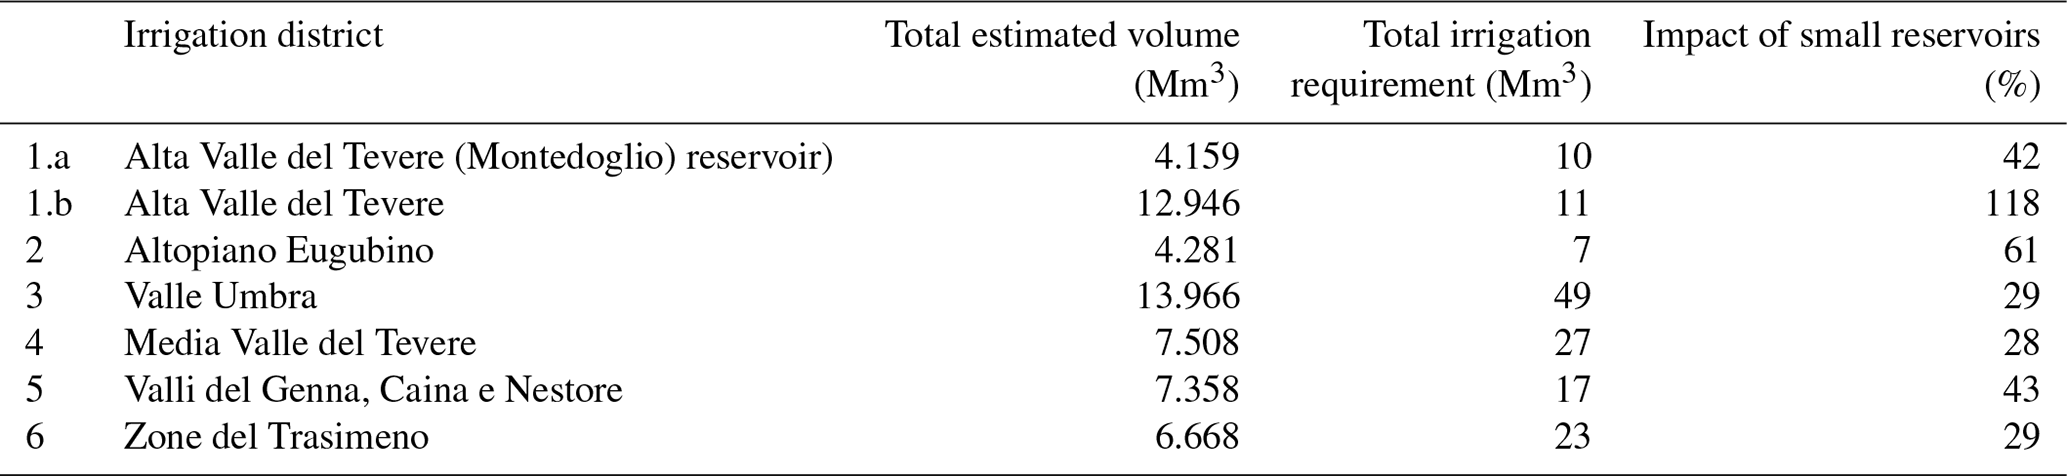
Table 3Comparison between database and estimated volumes by volume–area relationships at irrigation district level.
A WebGIS tool, inside the WRME platform, was developed to analyze the water withdrawals at the basin or sub-basin scale and its potentialities can be extended to other spatial information sources such as small reservoirs, to evaluate their contribution in different areas.
The potential volumes were therefore evaluated for seven irrigation districts in the part of the Umbria Region upstream of the Corbara dam (Table 3), leading to a total estimated volume of around 57 Mm3. For each district it is possible to make a comparison between the total irrigation requirement (Mm3) and potential volume stored in small reservoirs. It is evident that small reservoirs can have a key role in water resources management with an impact value, measured as available volume over demands, greater than 29 % (Table 4).
3.2 Environmental impact and assessment
From the point of view of the impact over the territory, small reservoirs, usually in activity by decades, also highlight the need for assessments on their degree of safety. This analysis is still at a preliminary stage; however, two fundamental problems were immediately revealed:
-
the lack of maintenance
-
the increase of hydraulic risk, due to the land use change in the downstream area of the dam (presence of built-up areas).
The surface spillways are always present; however, there is a high number of cases in which the structure is not operative because of lack of maintenance. In most of the cases, they have rectangular sections, made with a base slab and vertical walls in reinforced concrete, with dimensions congruent with regulations in force in the 1970s–1980s. In smaller reservoirs one or more elements of reinforced concrete pipes, with a diameter between 500 and 1000 mm, are sometimes used, leading therefore to obstructions of the outflow section. However, the most compelling problem concerns the tendency of owners and managers of reservoirs to implement not technically adequate interventions on the spillway structure (Fig. 3b). These kinds of actions can lead to the complete occlusion of the spillway section (Fig. 3a) and consequent generation of secondary natural or induced spillways, in any case insufficient to maintain safety standards. This problem has a significant impact on the connected hydraulic risk; therefore, it has to be examined in detail: at the initial stage a remote survey and check can be organized, but targeted inspections in situ must be foreseen.

Figure 3Surface spillway maintenance status: partially efficient (a), completely obstructed (b).
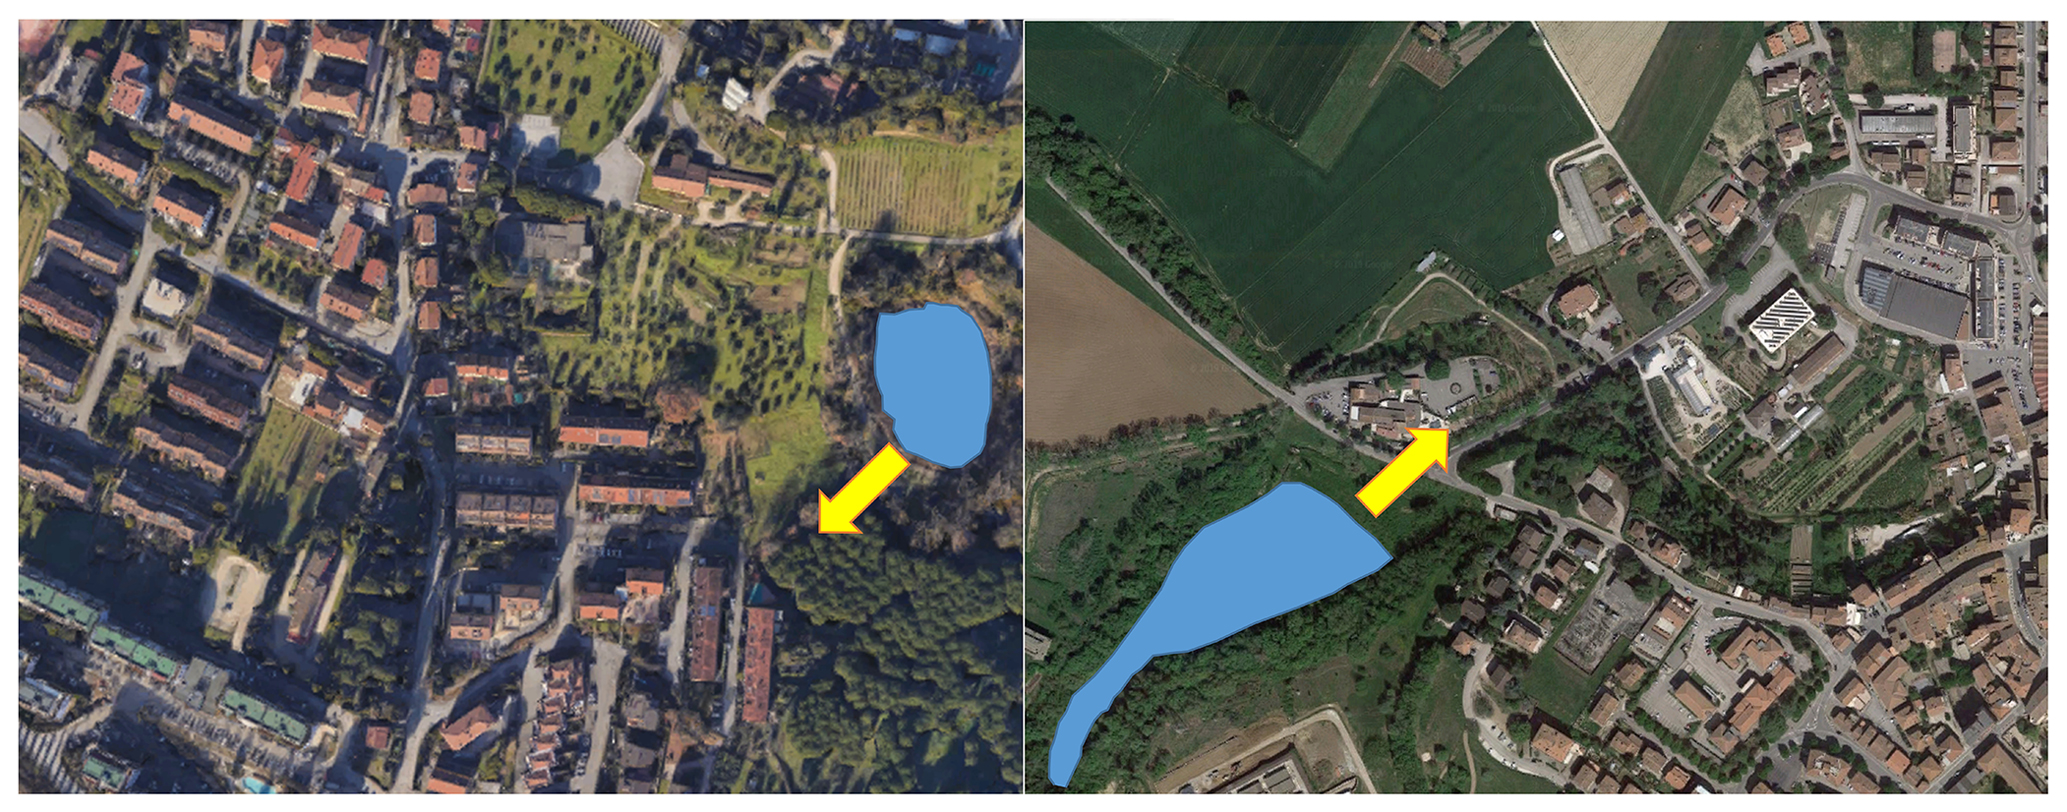
Figure 4Examples of small reservoirs with densely built-up areas. ©Google Map source: Immagini©2018 TerraMetrics, Dati Cartografici©2018.
A similar consideration can be made for the problem of land use change in downstream areas and for the connected hydraulic risk, as shown in the examples reported in Fig. 4.
3.3 Database update – remote sensing analysis
The use of remote sensing techniques allows the identification of water bodies and the rapid update of the small-reservoir database.
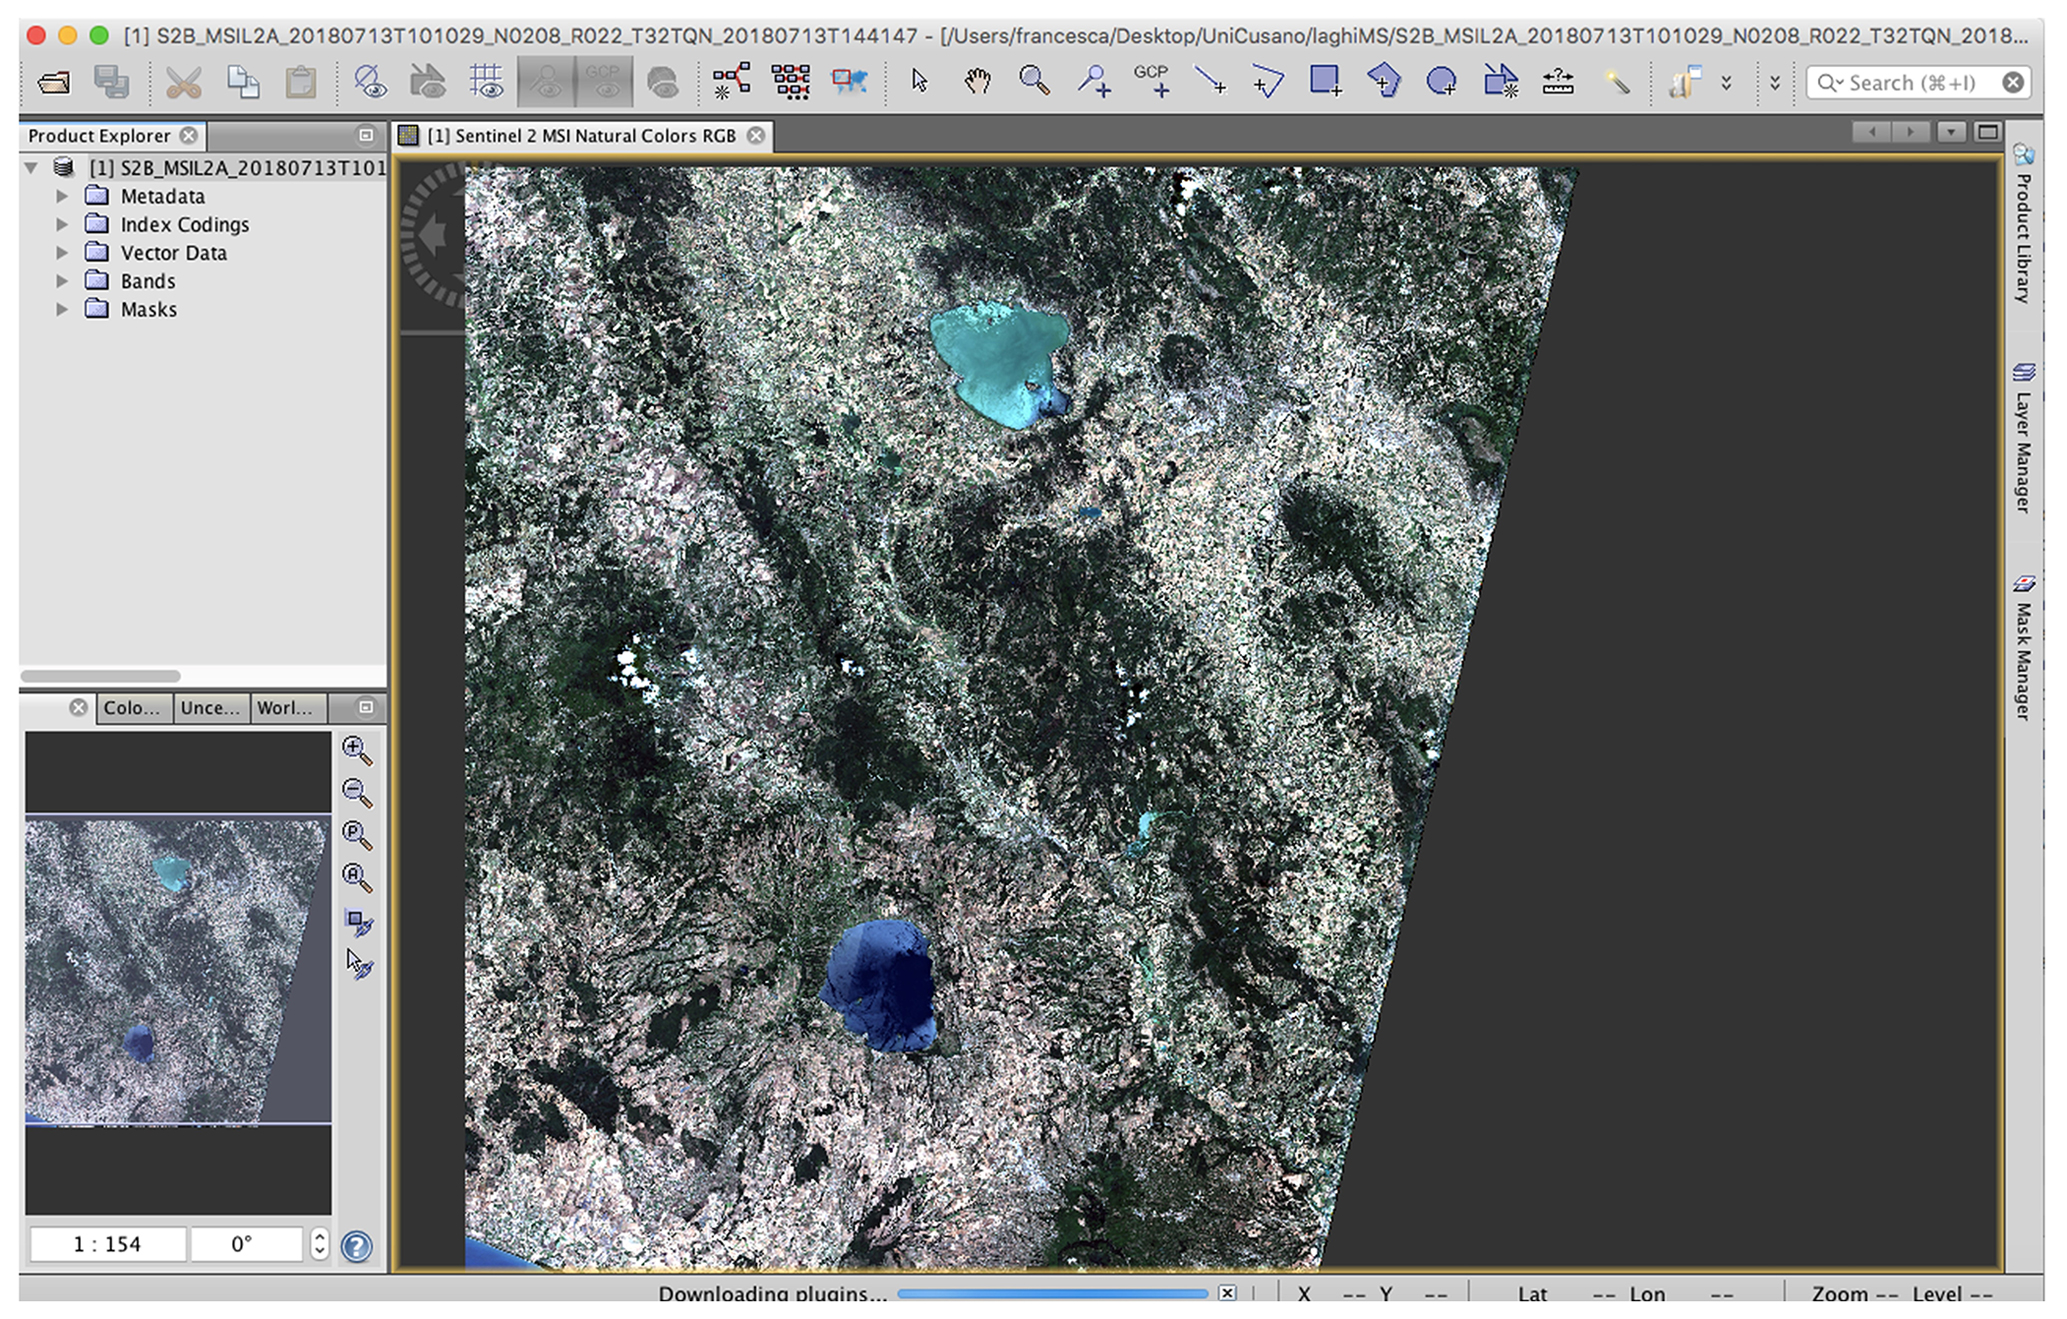
Figure 5Example of Sentinel-2 imagery in SNAP software.
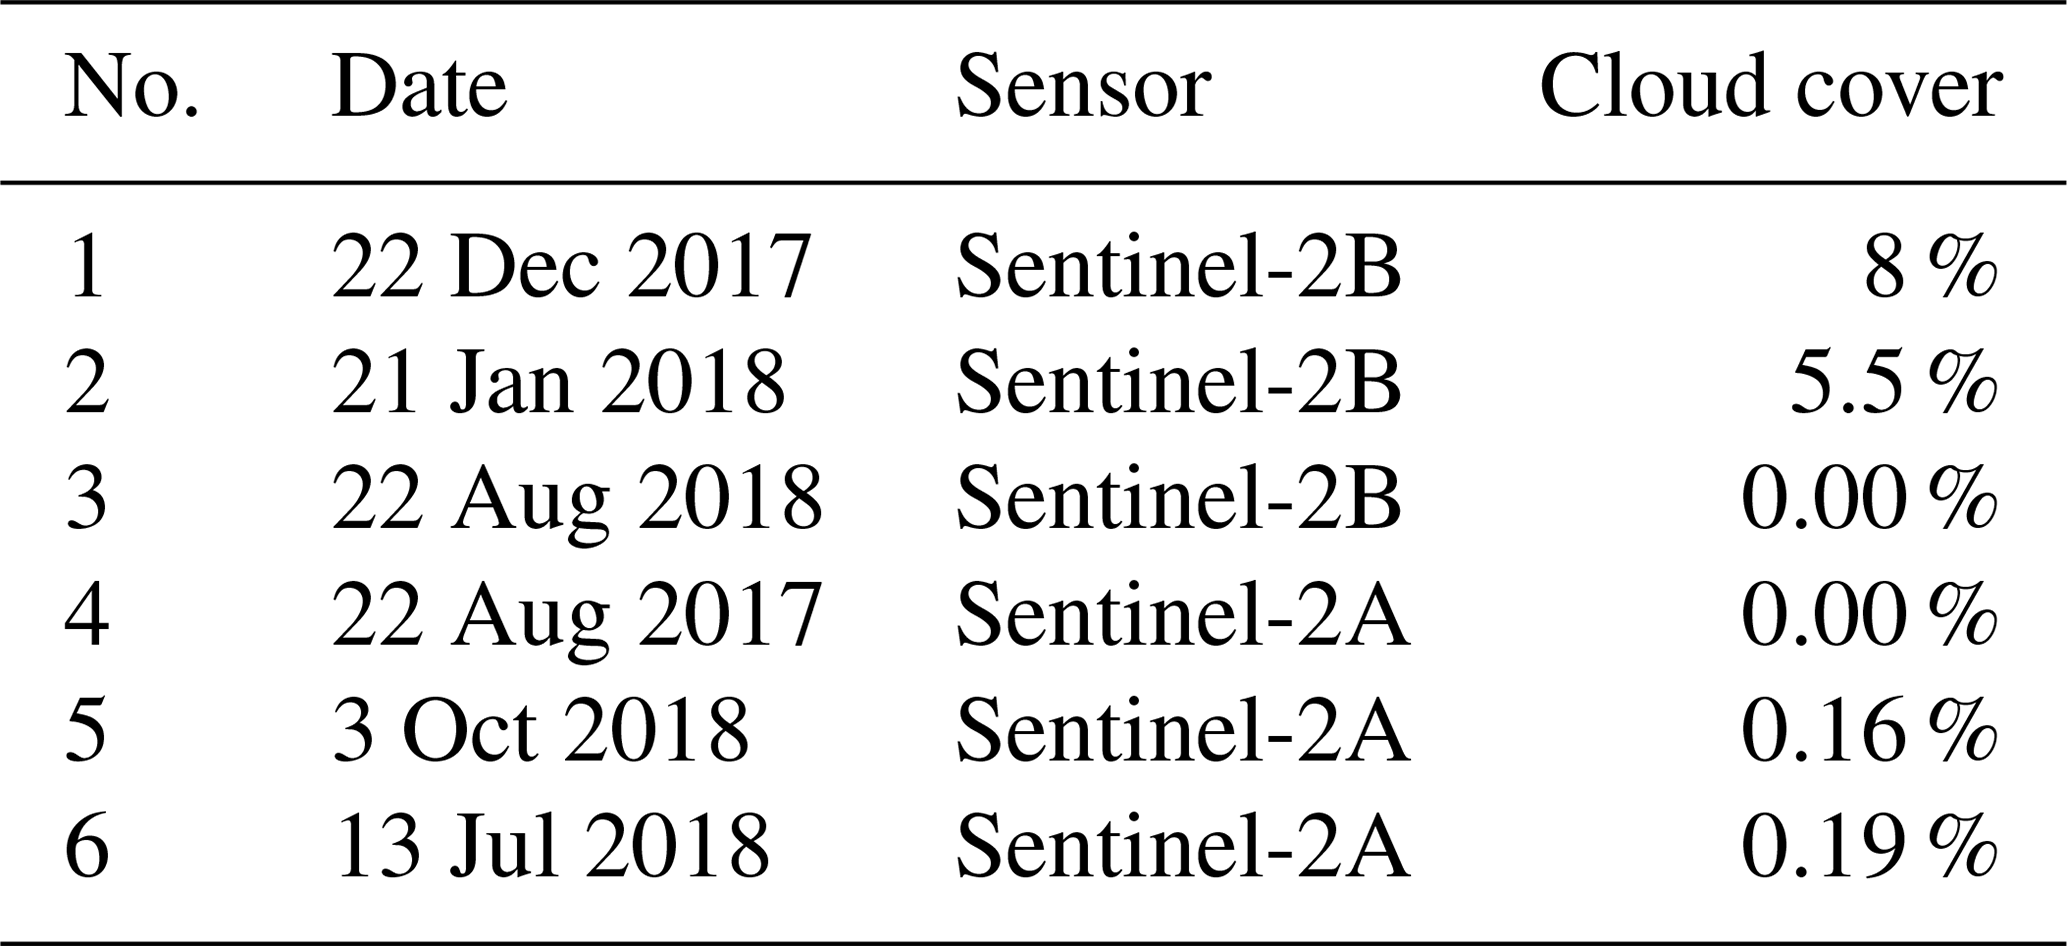

Figure 6Example of the NDWI (computed using the imagery acquired on 13 July 2018) in QGIS software. ©Google Map source: Immagini©2018 TerraMetrics, Dati Cartografici©2018.
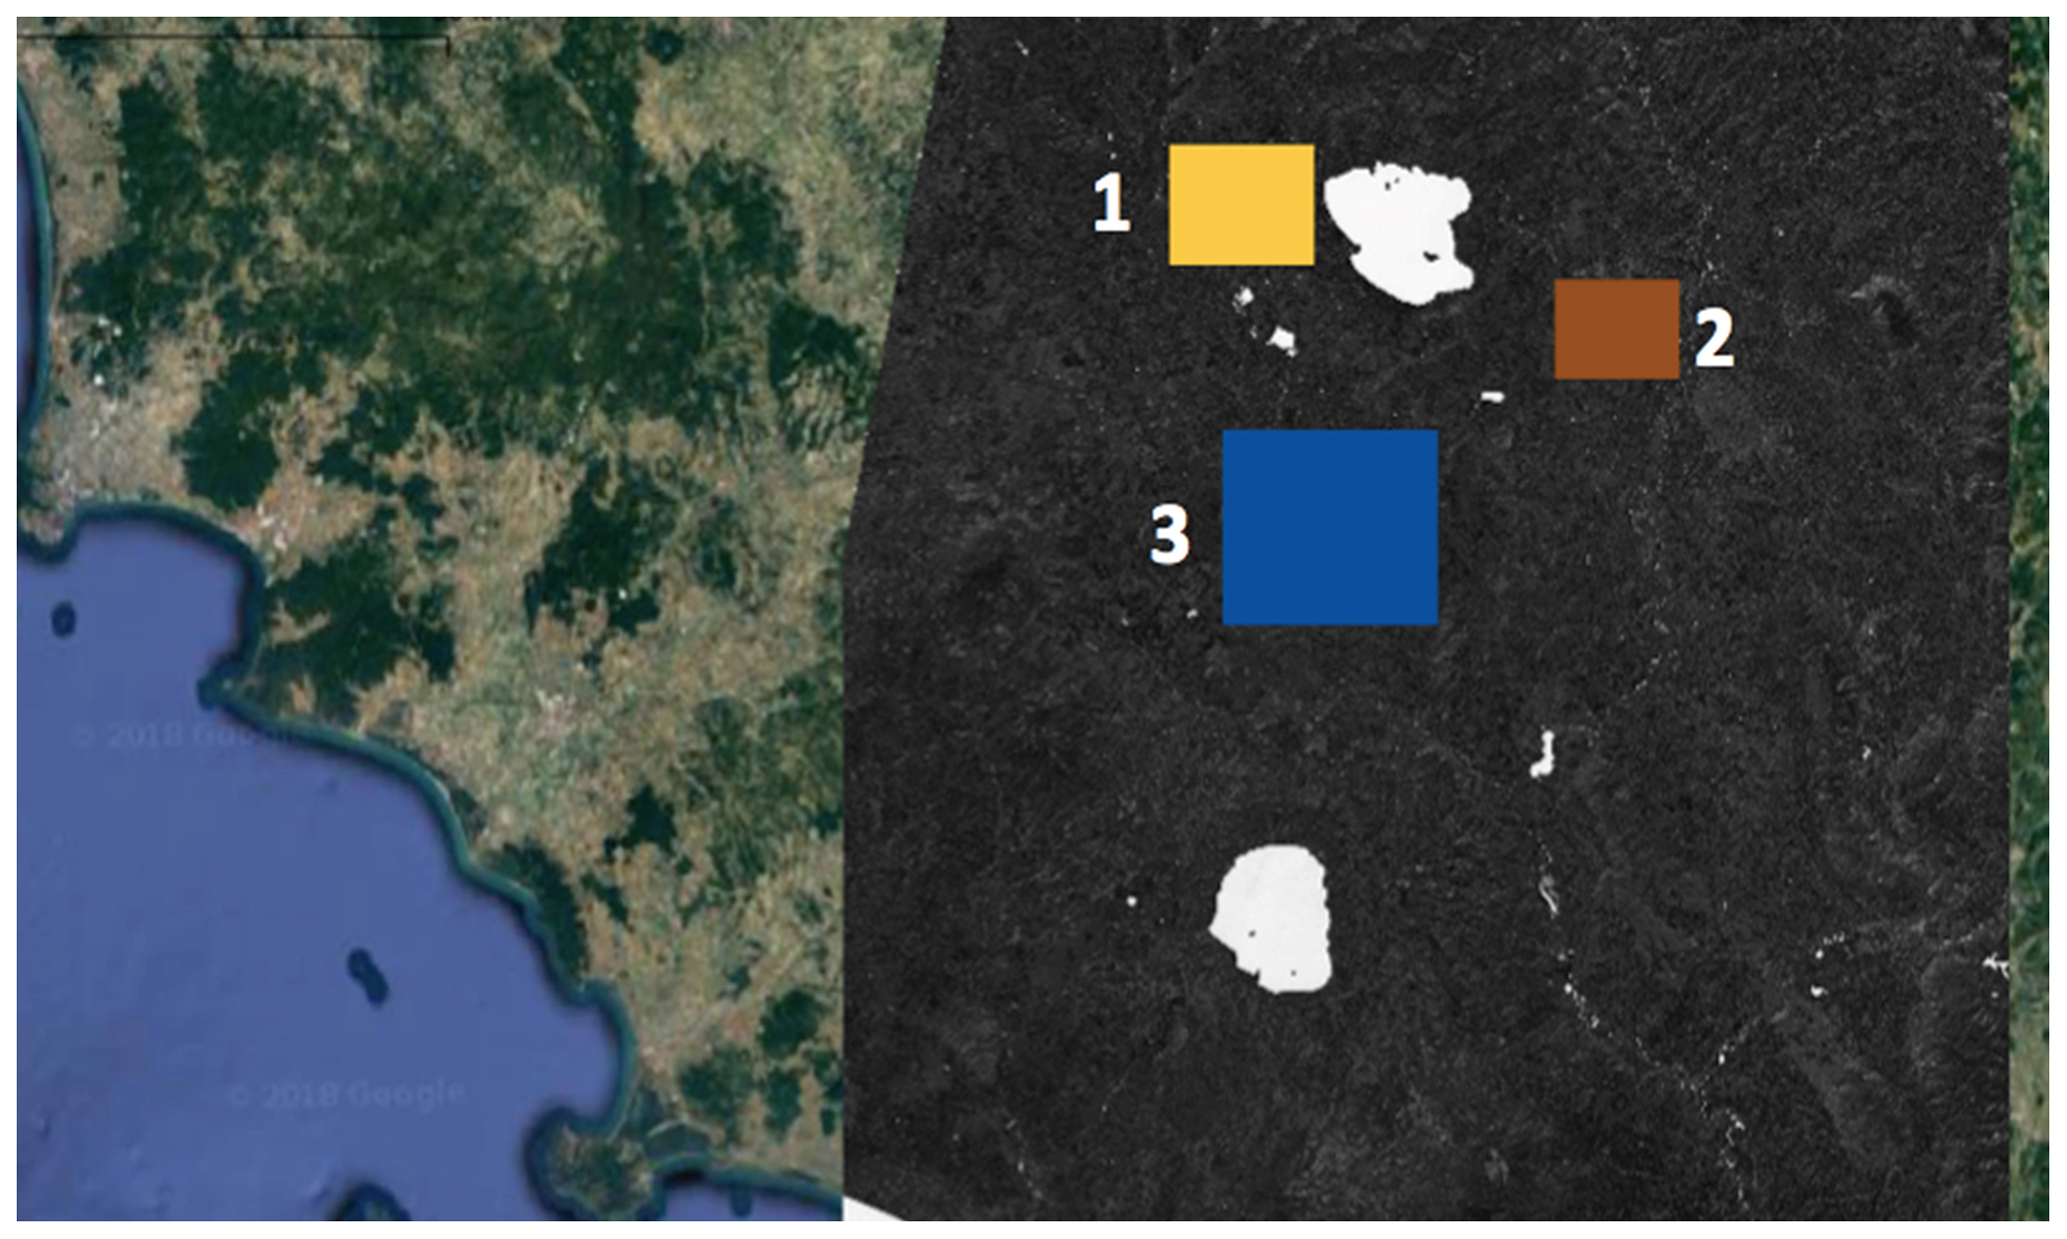
Figure 7Test areas (T1, T2, T3) selected for the NDWI–MNDWI comparison. ©Google Map source: Immagini©2018 TerraMetrics, Dati Cartografici©2018.
The multispectral images can be downloaded for free from the Copernicus Open Access Hub web platform (https://scihub.copernicus.eu, last access: March 2019). Specifically for this work six images in JPEG 2000 format are selected (Table 5) (Fig. 5).
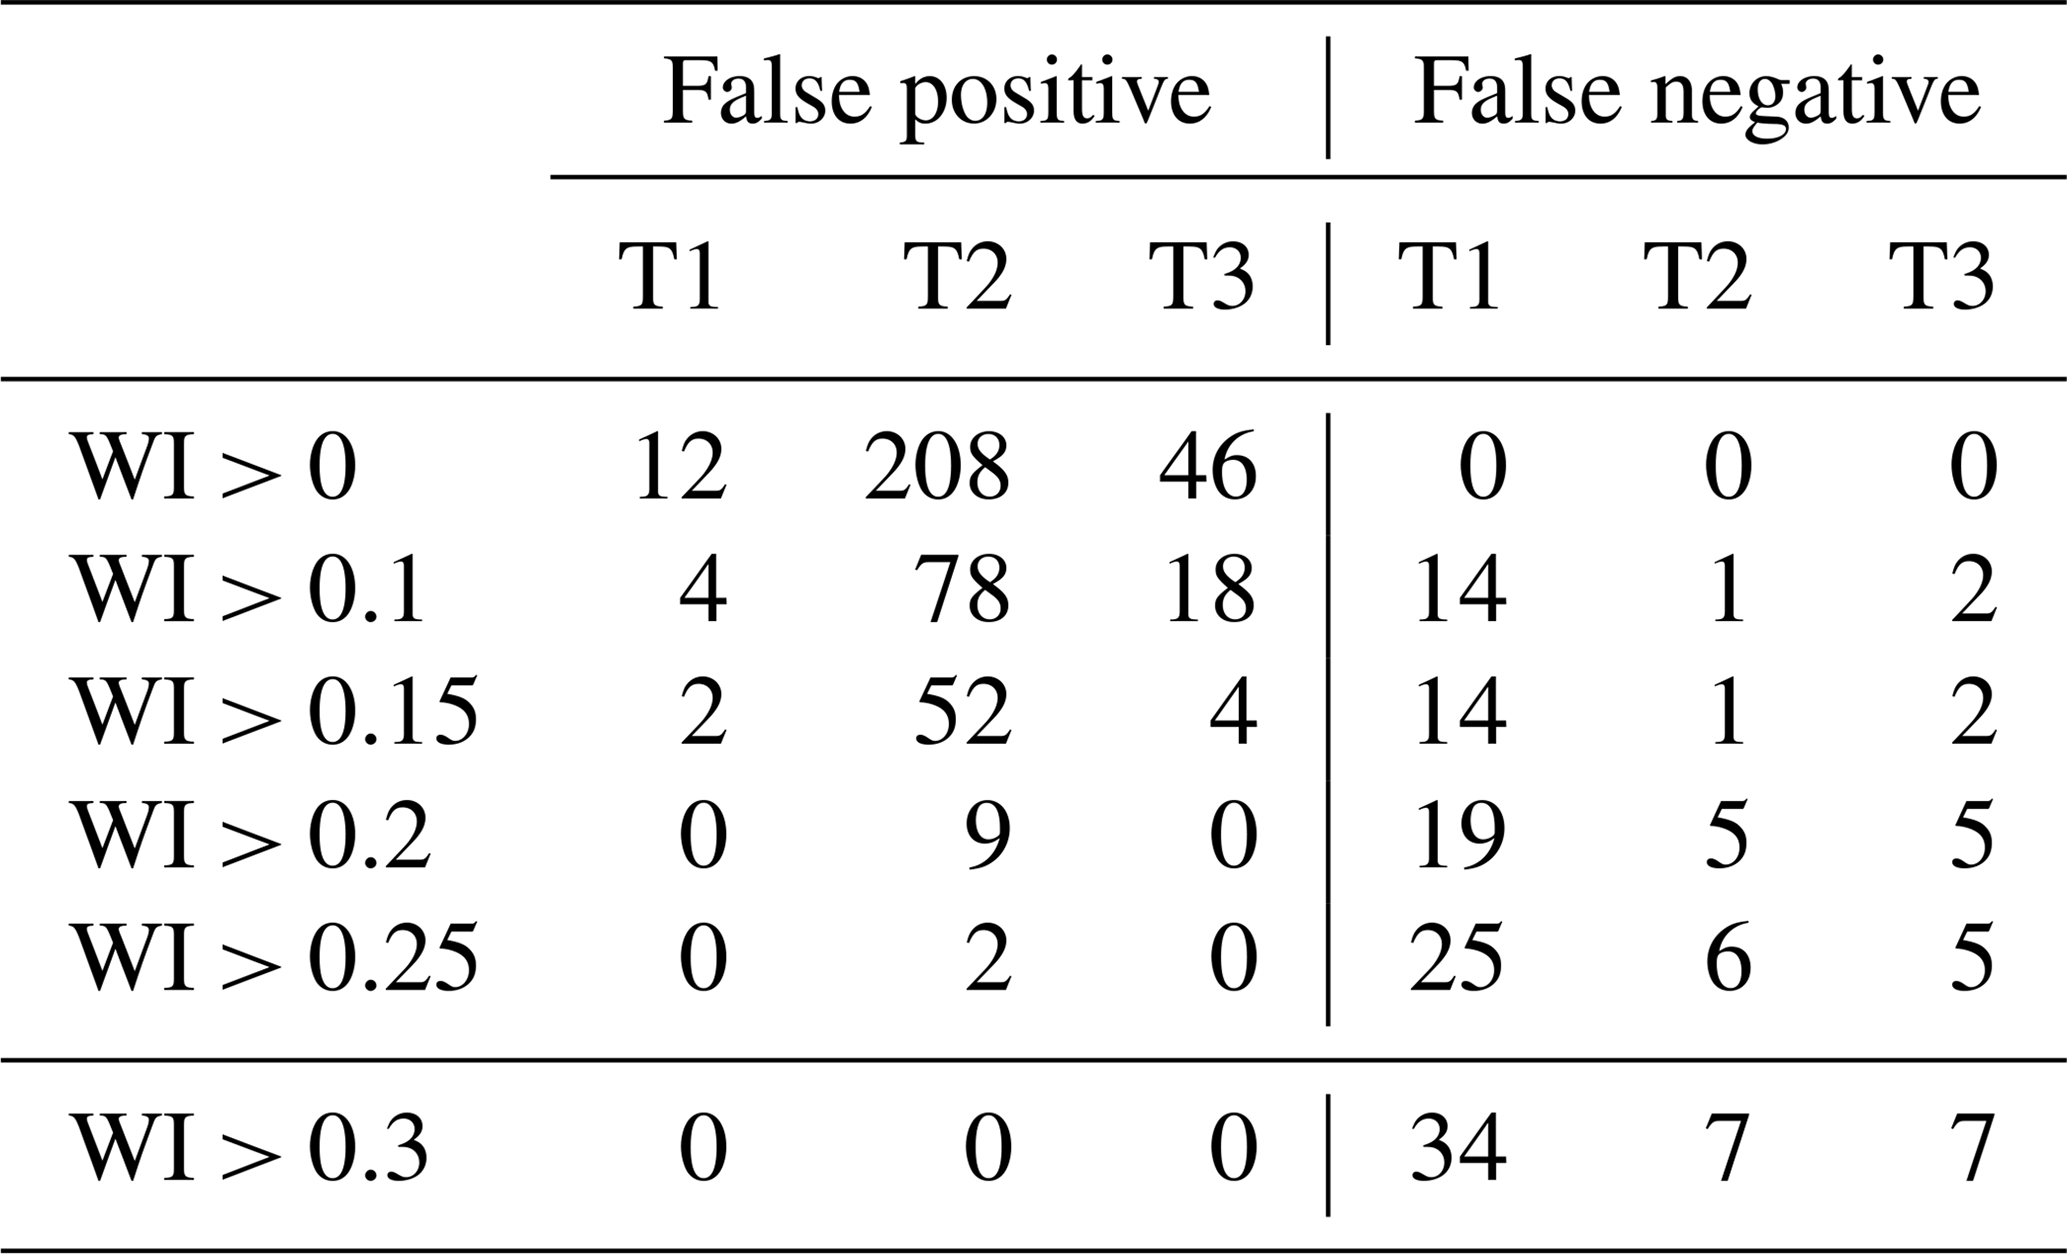
Table 7False positives and negatives for the different threshold values and land uses.
For all the images, the NDWI and MNDWI indexes were computed in SNAP software; Fig. 6 shows an example of the NDWI related to Sentinel-2A imagery acquired on 13 July 2018.
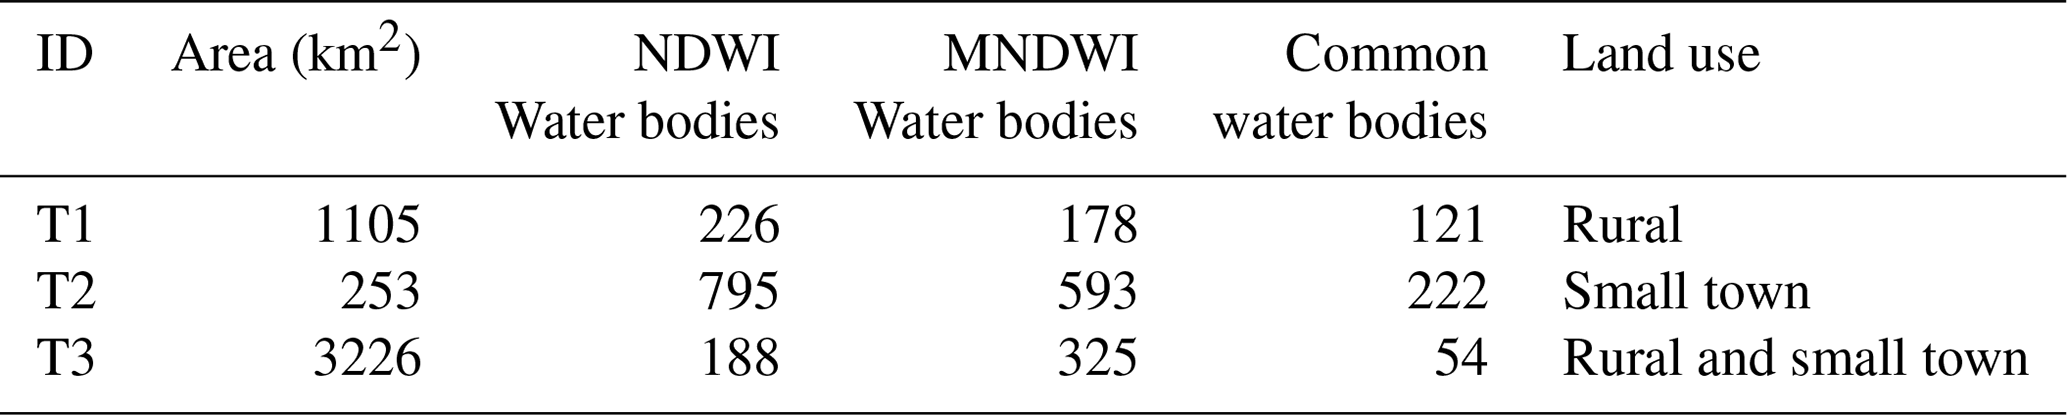
A first analysis was conducted comparing the two WIs, MNDWI and NDWI, on three different test areas (T1, T2, T3) as shown in Fig. 7 considering different land coverage: rural, anthropic or a combination of both (Table 6).
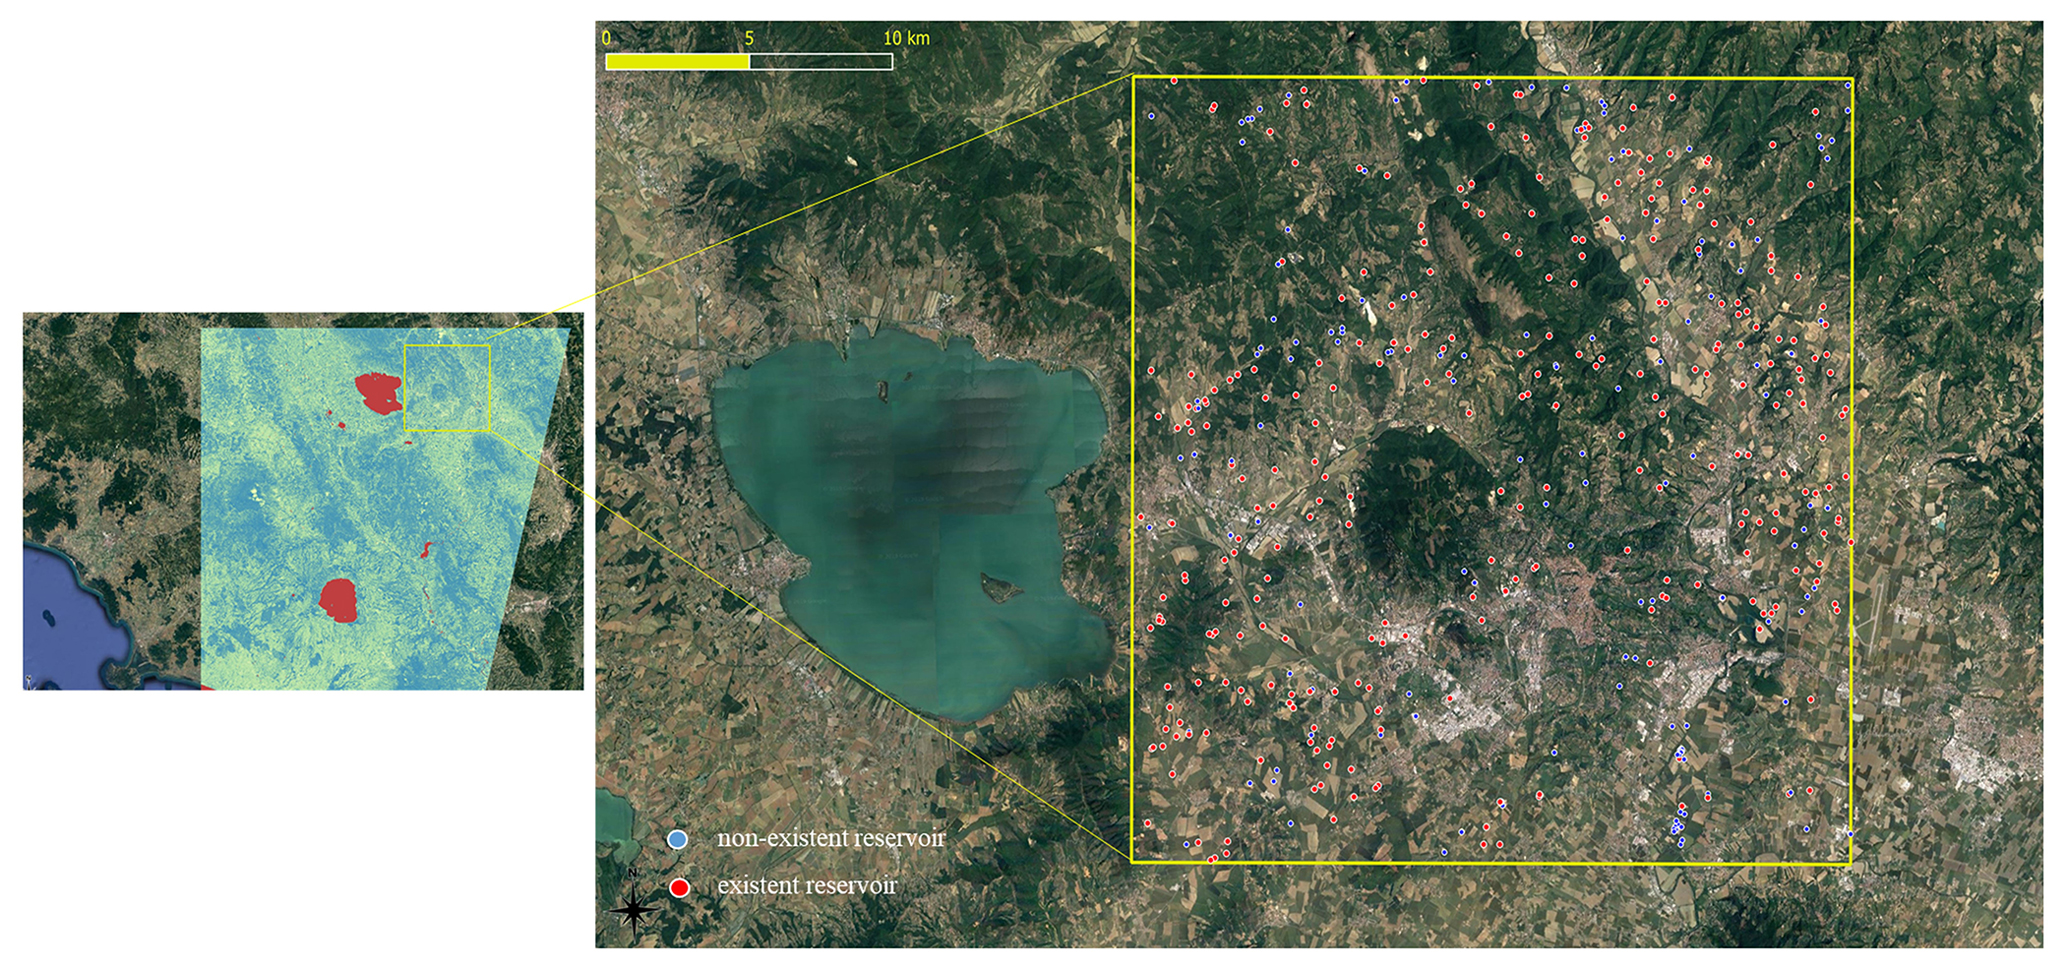
Figure 8Test area selected for the NDWI–database comparison. ©Google Map source: Immagini©2018 TerraMetrics, Dati Cartografici©2018.

Figure 9Identification of new reservoir with the NDWI.
As a preliminary analysis, possible water bodies identified by the two indexes are investigated in order to highlight false identification, both negative (water bodies not detected) and positive (other surface detected as water bodies). Computations are carried out using different threshold values for the WIs: 0; 0.1; 0.15; 0.2; 0.25; 3. Higher threshold values imply a decrease of false-positive identification and an increase of false negative (Table 7).
Remote sensing performance in small-reservoir identification is verified through a comparison with the database. To this aim, we have considered an area of 625 km2 where the database highlights the presence of 435 reservoirs.
A first check has been conducted through the use of optical images from Google Earth: 145 of the lakes are no longer existent (Fig. 8). The remaining 290 reservoirs have been investigated and analyzed through the procedure of water body extraction from the Sentinel-2 images described.
For the sake of brevity, only results relative to the NDWI in a single Sentinel acquisition of 13 July 2018 are reported.
The results from the NDWI analysis show that the method successfully extracts water body areas, but it obviously fails to eliminate some misleading information identifying possible building shadows, dark objects, roofs or asphalt as water (false positives).
Threshold values of the NDWI adopted in this analysis are 0; 0.05; 0.1. For NDWI > 0, 637 possible water bodies have been identified and 174 coincide with the database. This means that 116 are false negatives and that a consistent number of identifications are false positives. An increase of the threshold value (0.1) leads to a loss of information: only 130 lakes of the database are identified. A good compromise between identification and false-positive issues is given using a 0.05 threshold value: 148 water bodies are identified on the NDWI and the database.
We have found 180 additional identifications with respect to the database: 84 of which are false positives, and the remaining are superficial water bodies not present in the census. This therefore represents the real update to the database in terms of lake numbers (Fig. 9).
Therefore this study proposes an integrated approach to evaluating the resource of small reservoirs, which is developed in three phases: remote sensing analysis to identify the lake surfaces, the study of correlations between area and volume for estimating the available water resource, and finally the WebGIS to locate the reservoir on the territory and evaluate the hydraulic risk.
At the moment there are no similar studies of this type of problem. The development of this methodology represents a new approach in the field of integrated management of all water resources.
The first results of the study on small reservoirs highlight the need to focus again on these structures that are sometimes forgotten, both for their potential use as an alternative water resource and for safety purposes in terms of hydraulic risk. The creation of a georeferenced database and a WebGIS system certainly facilitates this operation. However, the need for further in-depth analysis aimed at assessing the state of maintenance of small reservoirs is evident. The focus of investigation deals with lake identification and estimation of the potential available irrigation volumes.
The methodology described in this paper provides a practical approach to evaluating and mitigating the problem of imbalance between the available water and the demand, integrating water volumes with those stored in small reservoirs.
Firstly, this work has organized and analyzed previous census data using WebGIS tools. Then, a fast procedure based on the analysis of multispectral images from the Sentinel-2 platform has been proposed and discussed. This last approach could make it possible to extend the survey at national and international level.
Water body extraction for Sentinel-2 multispectral images will be improved considering a machine learning technique that nowadays offers an efficient classification of remotely sensed data. Furthermore, in the free geospatial software QGIS, some machine learning algorithms are implemented, thus allowing for the fulfillment of a completely free methodology (Maxwell et al., 2018).
Potential applications of the methodology in further works could lead to identification and evaluation of lake surfaces at national or even international scale.
The effects and impacts of water volumes from small reservoirs in other countries could be similar to the Italian case study proposed here. However, to the knowledge of the authors, there are no applicable datasets which allow for a quantitative assessment.
The lake database is not accessible to the public without preliminary permission. In order to gain access to the database, please contact the WRME website administrator for information (arnaldo.pierleoni@unicusano.it).
AP and SC acquired available reservoir data, designed and built the main database and the spatial queries for WRME platform. SDF and FG analyzed the spectral images, performed WI computations, updated the database and wrote the manuscript. All authors contributed in reviewing and editing the paper. SC coordinated the research.
The authors declare that they have no conflict of interest.
This article is part of the special issue “European Geosciences Union General Assembly 2019, EGU Division Energy, Resources & Environment (ERE)”. It is a result of the EGU General Assembly 2019, Vienna, Austria, 7–12 April 2019.
The authors thank the Umbria Region Office for providing small-reservoir data.
This research has been supported by the Italian Ministry of Education, University and Research under the PRIN grant no. 20154EHYW9 “Combined numerical and experimental methodology for fluid structure interaction in free surface flows under impulsive loading”.
This paper was edited by Michael Kühn and reviewed by Giacomo Falchetta and one anonymous referee.
Addabbo, P., Focareta, M., Mariuccio, S., Votto, C., and Ullo, S. L.: Contribution of Sentinel-2 data for applications in vegetation monitoring, Acta Imeko, 5, 44–54, 2016.
Avisse, N., Tilmant, A., Müller, M. F., and Zhang, H.: Monitoring small reservoirs' storage with satellite remote sensing in inaccessible areas, Hydrol. Earth Syst. Sci., 21, 6445–6459, https://doi.org/10.5194/hess-21-6445-2017, 2017.
Biscarini, C., Di Francesco, S., Ridolfi, E., and Manciola, P.: On the Simulation of Floods in a Narrow Bending Valley: The Malpasset Dam Break Case Study, Water, 8, 545, https://doi.org/10.3390/w8110545, 2016.
Casadei, S., Pierleoni, A., and Bellezza, M.: Sustainability of Water Withdrawals in the Tiber River Basin (Central Italy), Sustainability, 10, 485, https://doi.org/10.3390/su10020485, 2018.
Di Francesco, S. and Giannone, F.: A Fast Procedure For Water Reservoir Identification And Evaluation From Sentinel 2 Images, 17th International Conference of Numerical Analysis and Applied Mathematics 2019: ICNAAM 2019, Proceedings of the AIP Conference, 23–28 September 2019, Sheraton Hotel, Rhodes, Greece, accepted, 2019.
Di Francesco, S., Biscarini, C., and Manciola, P.: Characterization of a Flood Event through a Sediment Analysis: The Tescio River Case Study, Water, 8, 308, https://doi.org/10.3390/w8070308, 2016.
Dominici, D., Zollini, S., Alicandro, M., Della Torre, F., Buscema, M., and Baiocchi, V.: High Resolution Satellite Images for Instantaneous Shoreline Extraction Using New Enhancement Algorithms, Geosciences, 9, 123, https://doi.org/10.3390/geosciences9030123, 2019.
Gideon, O. T. and Maurice, S.: Automatic Generation of Water Masks from RapidEye Images, Journal of Geoscience and Environment Protection, 3, 17–23 https://doi.org/10.4236/gep.2015.310003, 2015.
Gordana, K. and Ugur, A.: Object-based water body extraction model using Sentinel-2 satellite imagery, Eur. J. Remote Sens., 50, 137–143, https://doi.org/10.1080/22797254.2017.1297540, 2017
Habets, F., Philippe, E., Martin, E., David, C. H., and Leseur, F.: Small farm dams: impact on river flows and sustainability in a context of climate change, Hydrol. Earth Syst. Sci., 18, 4207–4222, https://doi.org/10.5194/hess-18-4207-2014, 2014.
ISPRA (Istituto Superiore per la Protezione e la Ricerca Ambientale): Annuario dei dati ambientali, Edizione 2016, Invasi Artificiali, available at: http://annuario.isprambiente.it/entityada/basic/6210 (last access: September 2018), 2016.
ITCOLD: Le piccole dighe in Italia, Comitato Nazionale Italiano per le Grandi Dighe, Roma, 2017.
Maxwell, A. E., Warner, T. A., and Fang, F.: Implementation of machine-learning classification in remote sensing: An applied review, Int. J. Remote Sens., 39, 2784–2817, https://doi.org/10.1080/01431161.2018.1433343, 2018.
Mishra, K. and Prasad, P. R. C.: Automatic Extraction of Water Bodies from Landsat Imagery Using Perceptron Model, Journal of Computational Environmental Sciences, 2015, 903465, https://doi.org/10.1155/2015/903465, 2015.
Pierleoni, A., Camici, S., Brocca, L., Moramarco, T., and Casadei, S.: Climate change and decision support systems for water resource management, Procedia Engineer., 70, 1324–1333, https://doi.org/10.1016/j.proeng.2014.02.146, 2014
QGIS Development Team: QGIS Geographic Information System, Open Source Geospatial Foundation Project, available at: http://qgis.osgeo.org, last access: March 2019.
Rodrigues, L. N., Sano, E. E., Steenhuis, T. S., and Passo, D. P.: Estimation of Small Reservoir Storage Capacities with Remote Sensing in the Brazilian Savannah Region, Water Resour. Manage., 26, 873–882, 2012.
Sawunyama, T., Senzanje, A., and Mhizha, A.: Estimation of small reservoir storage capacities in Limpopo River Basin using geographical information systems (GIS) and remotely sensed surface areas: Case of Mzingwane catchment, Phys. Chem. Earth, 31 935–943, 2006.
Venot, J. P. and Krishnan, J.: Discursive Framing: Debates over Small Reservoirs in the Rural South, Water Altern., 4, 316–324, 2011.
Venturi, S., Di Francesco, S., Materazzi, F., and Manciola, P.: Unmanned aerial vehicles and Geographical Information System integrated analysis of vegetation in Trasimeno Lake, Italy, Lakes Reserv Res Manage, 21, 5–19, https://doi.org/10.1111/lre.12117, 2016.
Wisser, D., Frolking, S., Douglas, E. M., Fekete, B. M., Schumann, A. H., Vörösmarty, C. J.: The significance of local water resources captured in small reservoirs for crop production – A global-scale analysis, J. Hydrol., 384, 264–275, 2010.
Xiucheng, Y., Shanshan, Z., Xuebin, Q., Na, Z., and Ligang, L.: Mapping of Urban Surface Water Bodies from Sentinel-2 MSI Imagery at 10 m Resolution via NDWI-Based Image Sharpening, Remote Sensing, 9, 596; https://doi.org/10.3390/rs9060596, 2017
Xu, H.: Modification of normalised difference water index (NDWI) to enhance open water features in remotely sensed imagery, Int. J. Remote Sens., 27, 3025–3033, https://doi.org/10.1080/01431160600589179, 2006.
Yun, D., Yihang, Z., Feng, L., Qunming, G., Wenbo, L., and Xiaodong, L.: Water Bodies Mapping from Sentinel-2 Imagery with Modified Normalized Difference Water Index at 10-m Spatial Resolution Produced by Sharpening the SWIR Band, Remote Sensing, 8, 354, https://doi.org/10.3390/rs8040354, 2016.