 | 10 Sep 2018
The North Sea surge of 31 October–1 November 2006 during Storm Britta
Anthony James Kettle
Offshore energy infrastructure, including the petroleum and wind energy sectors, are susceptible to damage and interruption by extreme meteorological events. In northwest Europe and especially the North Sea, these extreme meteorological events are mostly associated with severe storms in the autumn and winter seasons. In the North Sea, storm surges have an impact on the offshore energy sector mainly from the flooding of port facilities and from strong ocean currents causing extra structural loading and bottom scouring. Storm Britta on 31 October–1 November 2006 was an important North Sea storm with a high surge along the coast of the Netherlands and Germany and a significant number of high wave reports. The paper presents an analysis of the national tide gauge records of the United Kingdom, the Netherlands, Germany, and Denmark to spectrally isolate and reconstruct time series components corresponding to the storm surge, semi-diurnal tide, and short period contribution. The semi-diurnal tides and storm surge during Storm Britta are tracked counter-clockwise around the North Sea from Scotland to northern Denmark. The storm surge was remarkable for its pronounced peak in the coastal area between the Netherlands and Germany with no precedent in the ∼100 year measurement record. The short period component of the tide gauge records show large oscillations during the height of the storm that may correspond with reports of unusually high waves at nearby coastal locations.
- Article
(3228 KB) - Full-text XML
-
Supplement
(452 KB) - BibTeX
- EndNote


Offshore energy infrastructure is susceptible to damage and interruption by extreme meteorological events. In subtropical areas, hurricanes and cyclones have serious impacts on offshore energy infrastructure, but in northwest Europe – especially in the North Sea – winter storms represent an important threat to offshore oil and gas industry, as well as the developing offshore wind energy sector (Magnusson, 2008; Diamond, 2012). The worst North Sea winter storms are typically characterized by a high wave field, and the infrastructure damage that results from individual wave impacts is often given a high profile in media reports (Kettle, 2016). However, the coastal flooding that often accompanies the worst North Sea storms also impacts offshore energy infrastructure and interrupts transport networks. The storm surge is associated with strong ocean currents on the continental shelf and is an important contributing factor to bottom scouring effects that have affected many offshore wind turbines in the North Sea (Diamond, 2012).
Several high profile storms in different parts of the world highlight the impacts of storm surges on energy infrastructure. Hurricane Katrina in August 2005 was the most damaging hurricane in United States history. It was associated with a high storm surge that was >8 m at some locations along the coast of the Gulf of Mexico, which was much larger than the 4.5 m storm surge for a historically important disaster at Galveston, Texas in 1900 (Pugh, 1987). Petroleum infrastructure was significantly impacted during Hurricane Katrina with a number of offshore drilling platforms destroyed by the high wind and wave field, floating platforms set adrift by strong ocean currents, and oil storage tanks displaced and ruptured by storm surge flooding of the ports (Cruz and Krausmann, 2013). For the wind energy industry, the Kandla cyclone of June 1998 was an important event with gusts >70 m s−1 that caused significant destruction at three coastal onshore wind farms at near Porbandar, Gujarat where the Arabian Sea cyclone made landfall (Winther-Jensen and Jørgensen, 1999). The cyclone caused a 2–3 m storm surge that flooded the port of Kandla and caused extensive damage to energy infrastructure in the state of Gujarat (IMD, 1999). In the North Sea, two important storm surges of the past 100 years – in 31 January–1 February 1953 and 6 December 2013 – had significant impacts on onshore energy generation and transmissions systems, in addition to property damage and interrupted transportation networks (Wadey et al., 2015). Paskal (2009) highlights that a significant amount of energy infrastructure around the North Sea is close to sea level and hence potentially at risk from storm surge damage.
This report investigates the storm surge associated with Storm Britta in the North Sea on 31 October–1 November 2006, an event that was important for the offshore energy and transport sectors. The storm centre passed across the northern North Sea between Scotland and southern Norway and caused a high storm surge on the Dutch and German coasts from the cold air outbreak in its wake. There were a number of maritime accidents and shoreline incidents in the North Sea, and limited evidence from eyewitness accounts and automated instruments indicates an important role of small groups of large waves (KNRM, 2007; RWS, 2007; Pleskachevsky et al., 2012). Instrumental recordings provide basic information about the magnitude of the waves, but the mechanism of their formation and propagation remains unclear. The waves have been linked with a resonant interaction with travelling convection cells over the North Sea (Pleskachevsky et al., 2012), but there is not a consensus on this within the scientific community (Larsén et al., 2017). Literature surveys for this storm are presented in Kettle (2015, 2016) including information on wind speed and meteorological parameters from media reports. Brusch et al. (2008), Pleskachevsky et al. (2012) and Larsén et al. (2017) present important insights into this storm with remote sensing data and numerical models. The goal of the present study is to investigate data from the North Sea tide gauge network, firstly to quantify the magnitude of the storm surge at different locations, and secondly to assess if the short period component of the water level records is linked with the reported wave events.
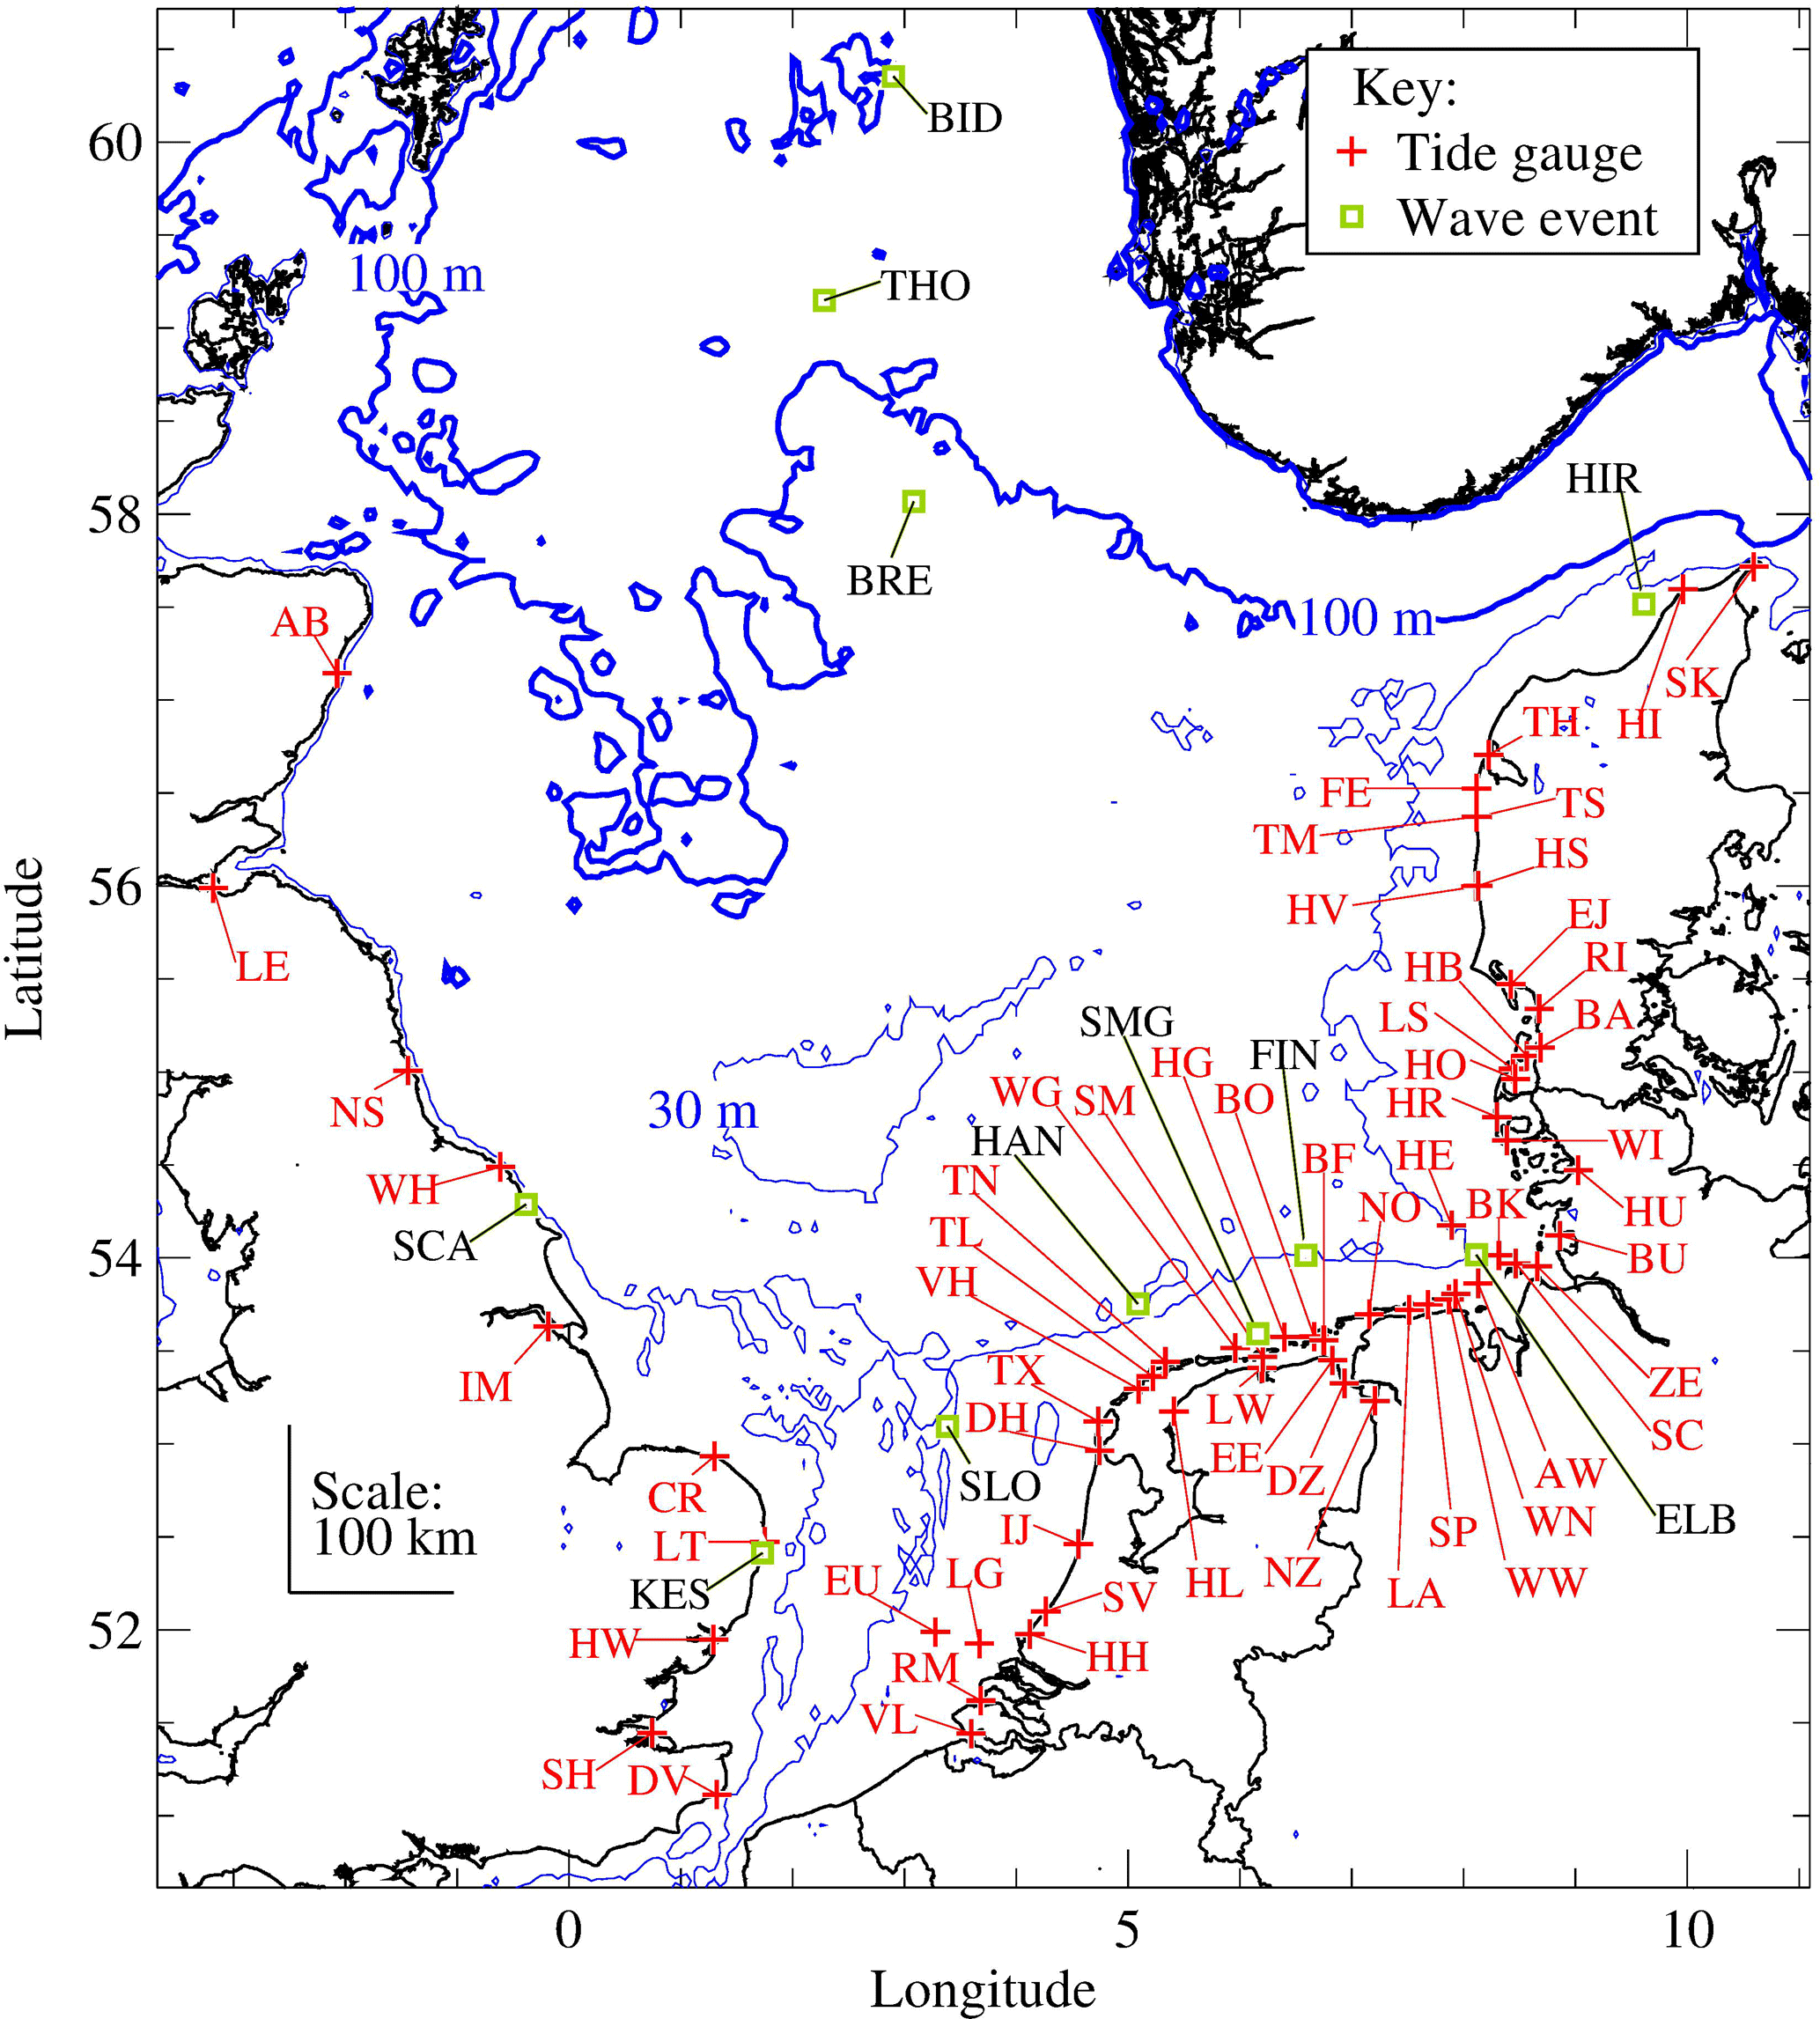
Figure 1Map of tide gauge stations and large wave events during Storm Britta on 31 October–1 November 2006. The wave events include media reports of wave strikes that have damaged ships, interrupted platform operations, or caused shoreline incidents, in addition to recordings of automated instrumentation. Information on the tide gauges and large wave events are given in the Supplement.
The analysis strategy was to use an array of tide gauges around the North Sea to isolate and study the propagation characteristics of semi-diurnal tide, long period component (storm surge), and short period component. The semi-diurnal tidal peaks propagate counter-clockwise around the North Sea every ∼ 12 h as coastally trapped shallow-water waves. Storm surges with longer period characteristics have two important source components. Firstly, there is a storm-induced sea level pulse from the Atlantic Ocean continental shelf that enters the North Sea north of Scotland propagates in a similar manner as the tides, and secondly, there is a local wind-driven component that depends on the onshore wind speed and depth characteristics of the water basin (Pugh, 1987). The short period components are identified with “harbour seiches” by Pugh (1987), although tsunamis and more recently identified meteo-tsunamis have similar frequency characteristics.
The present study is based on 60 North Sea tide gauge records (Fig. 1) from the national networks of the United Kingdom (10 stations), the Netherlands (20 stations), Germany (17 stations), and Denmark (13 stations). The time discretization of the water level data sets varies among the different national authorities, and ranges from 1 min for Germany to 10 min for the Netherlands and Denmark and 15 min for the United Kingdom. To shorten the computational processing time of the large number of stations, 10 min averages were calculated for the 1 min data sets from Germany. Further information about the characteristics of the tide gauge data sets is given in the Table S1 in the Supplement. A spectral analysis approach was used to separate the tidal signal from the long period and short period components. From the original data sets, time segments across the period of the storm (24 October–5 November 2006, inclusive) were extracted. These data segments were detrended and then subjected to analysis with a discrete Fourier transform (Stull, 1988) to derive plots of spectral energy vs. period. Figure S1 gives a sample power spectrum for one station. The power spectra were used to identify frequency time thresholds of 0.2 to 1.2 days to identify the tidal band and isolate it from the short and long period components. The 1.2 day threshold separating the tidal band and identified storm surge was chosen based on a minimum in the spectral energy plots for many stations. The 0.2 day (or 4.8 h) short period threshold for the tidal band was more difficult to define as higher harmonics of the dominant semi-diurnal tide may extend to short periods especially in shallow water areas of the southern North Sea. This threshold was chosen by trial and error to give a single-peaked semidiurnal tide, and shorter period thresholds resulted in oscillations in the reconstructed tidal signal for some stations. For the three frequency bands, time series data sets were reconstructed following Stull (1988).
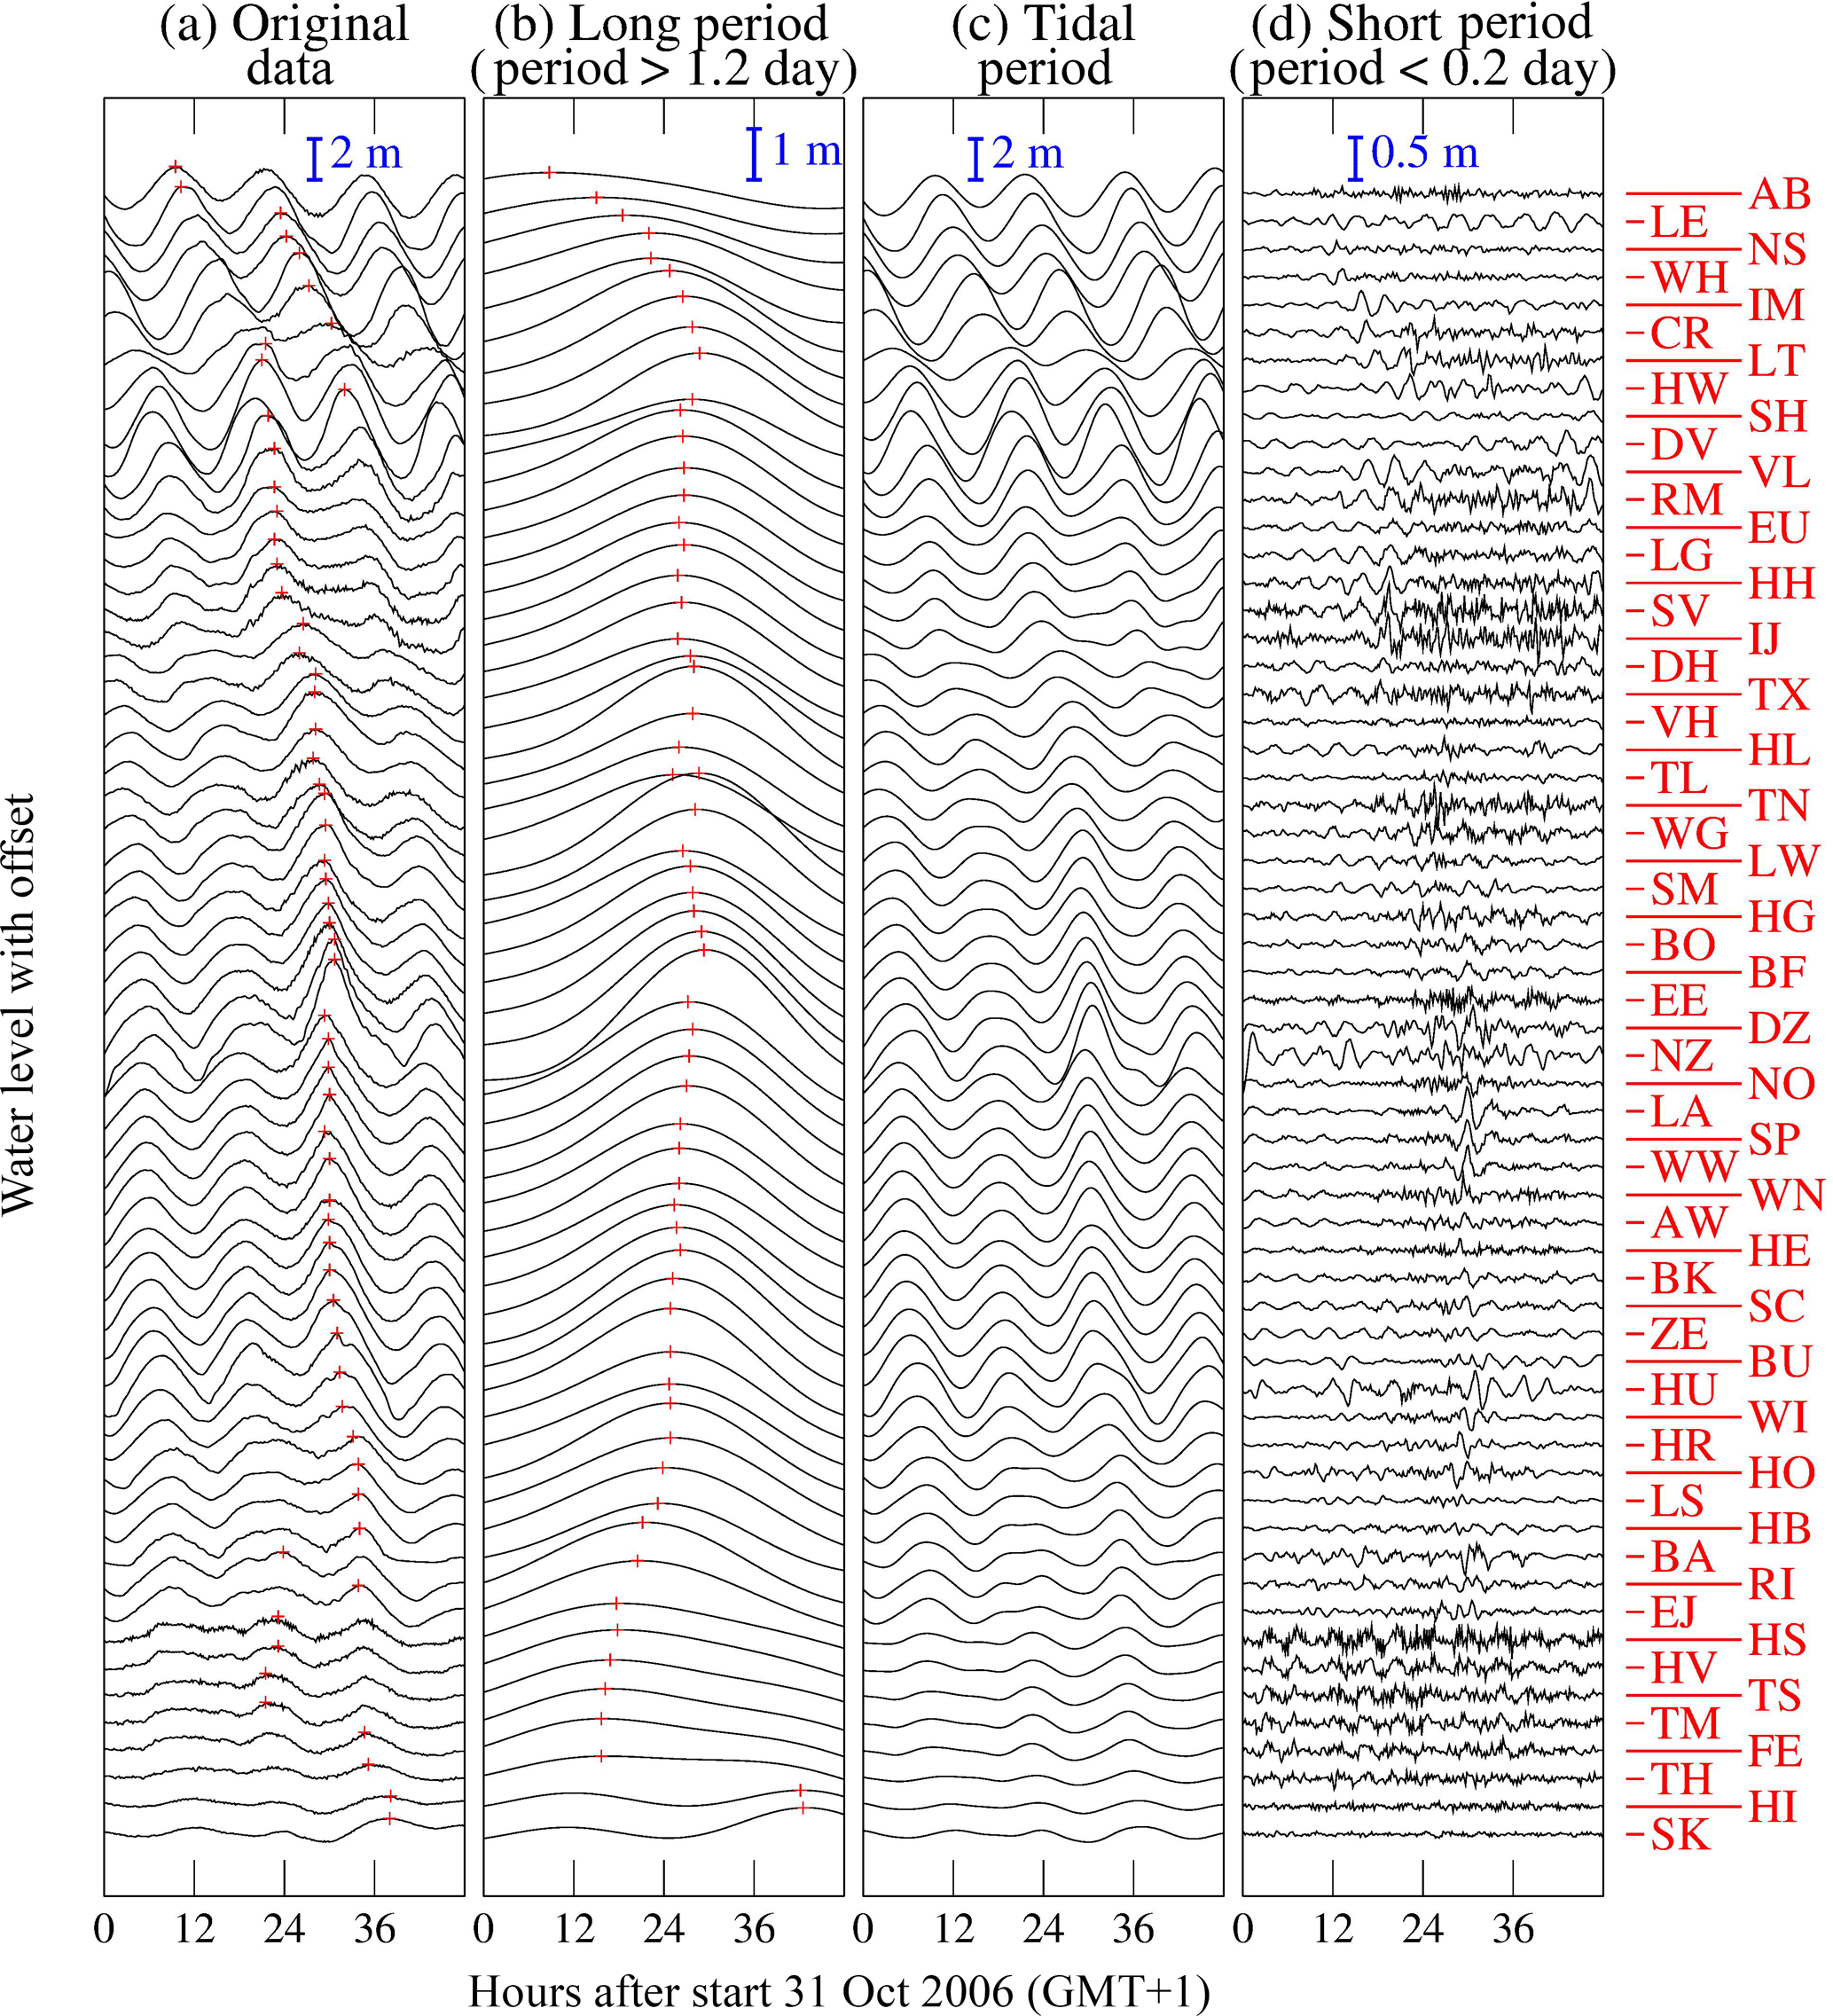
Figure 2(a) Original tide gauge time series and frequency band reconstructions for the (b) storm surge, (c) tidal, and (d) short period components. The red plus symbols mark the maximum of the 48 h time series for (a) and (b).
A list of high wave events was selected from the compilation of Kettle (2016) to compare with the time series derived from the tide gauge data, and these are also shown in Fig. 1. The events include eye-witness accounts of wave strikes that caused damage on ships (Hanseatic Sea, Slotergracht, and Thor Sentry) and possible wave-related cable breaks for platforms (Bideford Dolphin and Bredford Dolphin), as well as two shoreline incidents (Kessingland and Scarborough in the UK). There were instrumental recordings of unusual wave events at several offshore locations: “Schiermonnikoog” off the Dutch coast, “FINO1” and “Elbe2” off the German coast, and “Hirtshals-W” off the Danish coast. These included unusual features in the half-hour records of significant and maximum wave heights. For the Schiermonnikoog and FINO1 sites, high resolution wave height source data indicated large, well-formed wave groups with multiple events during the storm. Most of the instrumental wave data available for analysis for this storm were from Datawell Waverider buoys, a particularly rugged design that has undergone several decades of development and is used globally (Joosten, 2011). Many of the wave events are supported by eyewitness accounts, other instrumental recordings, and structural damage (Hessner and Reichert, 2007; KNRM, 2007; RWS, 2007). Several national authorities and an offshore service company additionally made data recordings and original reports available. The primary source for the wave events is given in Table S2. Most of the wave events occurred within a 100 km of the coast in the vicinity of a tide gauge station. However, the three wave events that took place in the centre of northern North Sea (Thor Sentry, Bideford Dolphin, and Bredford Dolphin) were far away from the tide gauge network, and as indicated in the Results section below, it was unclear how to link these with the tide gauge events in the southern North Sea.
The original time series data from the tide gauge stations around the North Sea are plotted in Fig. 2a for the two days of the storm on 31 October–1 November 2006. The semi-diurnal tidal signal is the most significant feature in the raw time series in Fig. 2a, and many traces also show short period noise that was hypothesized to give information on reported wave events. The time series reconstructions of main frequency bands of the water level record are shown in Fig. 2b–d, corresponding to the storm surge, tidal, and short period components. The tidal component has the highest variance in the spectral analysis and the largest amplitudes in the time series reconstructions, followed by the storm surge and short period components. The tidal peaks travel counter-clockwise around North Sea starting from Aberdeen (Fig. 2c). Figure 2b shows how the storm surge component propagates as a single broad peak southward along the English and Danish coasts of the northern North Sea toward the German Bight (with two stations in northern Denmark breaking the trend). The short period reconstructions for most stations (Fig. 2d) show oscillations with average trough-to-peak ranges of 1–15 cm and average periods ranging from ∼0.4–3 h. The highest trough-to-peak range for several stations during the storm exceeds 40 cm (IJmuiden buitenhaven, Delfzijl, and Terschelling Nordzee on the Netherlands coast, and Wangerooge-West and Langeoog on the German coast). Some stations show a ring-down effect after the appearance of large oscillations, with the amplitudes of successive oscillations becoming smaller in time. An example of this is shown for three neighbouring stations on the German coast in Fig. S2. In some cases, clusters of stations in close proximity show large amplitude oscillations at the about same time, as if they were all excited together by the same event. The behaviour is qualitatively similar to the examples of weather-induced harbour seiches described by Pugh (1987).
The skew surge for a tide gauge station is calculated as the maximum water level during a storm minus the average high tide. It is a simple, robust diagnostic of an anomalous storm surge water level that can be estimated from a short tide gauge time series segment. For Storm Britta, the skew surge for different locations around the North Sea is shown in Fig. 3. The skew surge was highest along the coast between the Netherlands and Germany, and the results from the present analysis are in approximate agreement with the government and media reports that were issued soon after the storm (see also Table S3). Literature reports indicate that Storm Britta established a new record of measured water levels for Delfzijl and nearby locations on the German coast (RWS, 2007).
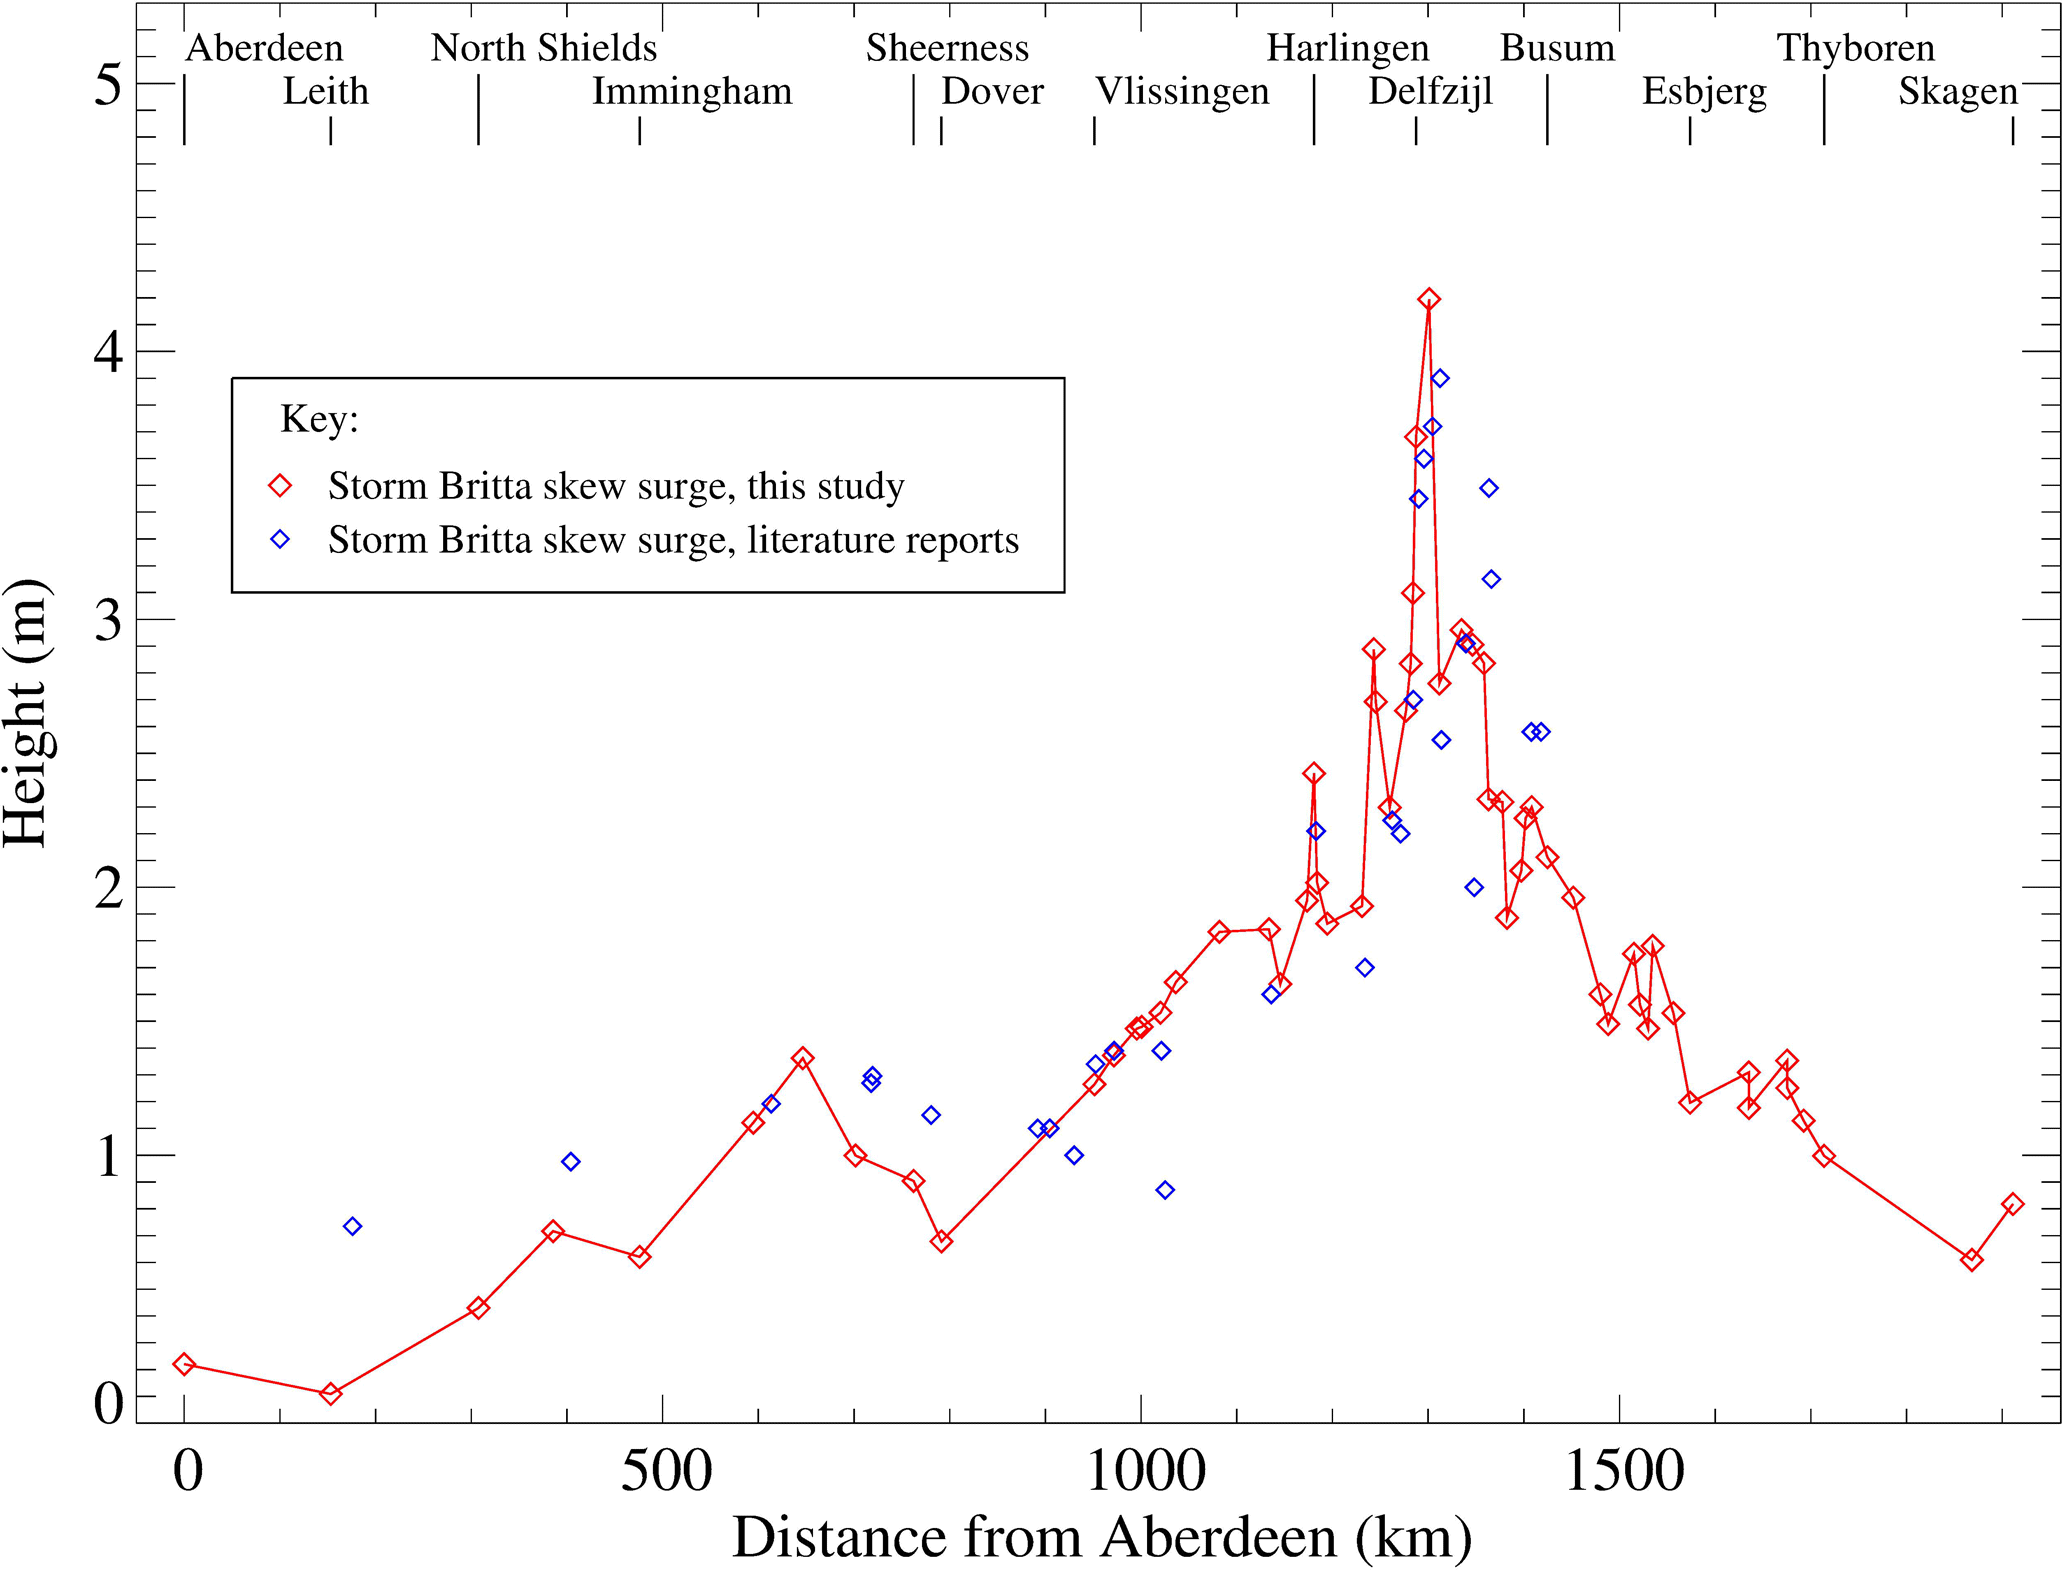
Figure 4 shows the relationship among the propagating semi-diurnal tidal peaks, storm surge peak, wave events, and dominant peaks in the short period reconstruction on axes of time vs. counter-clockwise distance along the coast from Aberdeen. The tidal peaks entered over northern Scotland and travelled counter-clockwise around the North Sea with a speed of ∼20 m s−1, which corresponds to a shallow water wave propagating across a water body of ∼40 m depth (Pugh, 1987). The propagation characteristic of the surge was mostly different from the tides. In western North Sea, the external surge propagated southward from Aberdeen, but with a different speed from the tide so that the surge maximum became associated with different ∼12 h tidal peaks at different locations around the North Sea. In the eastern North Sea, the surge moved southward along the coast of Denmark against the tidal direction. Between the northern Netherlands and the German North Sea coast, the surge peak and semi-diurnal tide peak were in close association. Figure 4 also shows the wave incidents and the two highest maxima of the short period tide gauge reconstruction (from Fig. 2d) on the same axes used for the moving tide and storm surge peaks. Along the northern coast of the Netherlands and Germany, there is a clustering of short period maxima and wave incidents in the first 12 h of 1 November. This includes the wave strikes on the ships Slotergracht and Hanseatic Sea, all the unusual wave events at the “Schiermonnikoog” and “Elbe” wave recorders, and the wave group that damaged the platform “FINO1”. The wave accidents at Kessingland and Scarborough on the east coast of England occurred within the same time frame but appear to be associated with the two following two semidiurnal tidal peaks. The unusual wave events at Hirtshals-W occurred between two tidal peaks, and first wave incident at this buoy is associated with the maximum of short period reconstruction of a nearby tide gauge. In the central part of the northern North Sea the Bideford Dolphin, Bredford Dolphin, and Thor Sentry were far away from the tide gauge network, and their corresponding symbols (BID, BRE, and THO) have been drawn with question marks near the northernmost (and closest) tide gauge stations at Aberdeen and Skagen. These wave accidents took place in the afternoon of 31 October 2006 several hours before the start of the reported wave accidents in the southern North Sea on the morning of 1 November 2006.
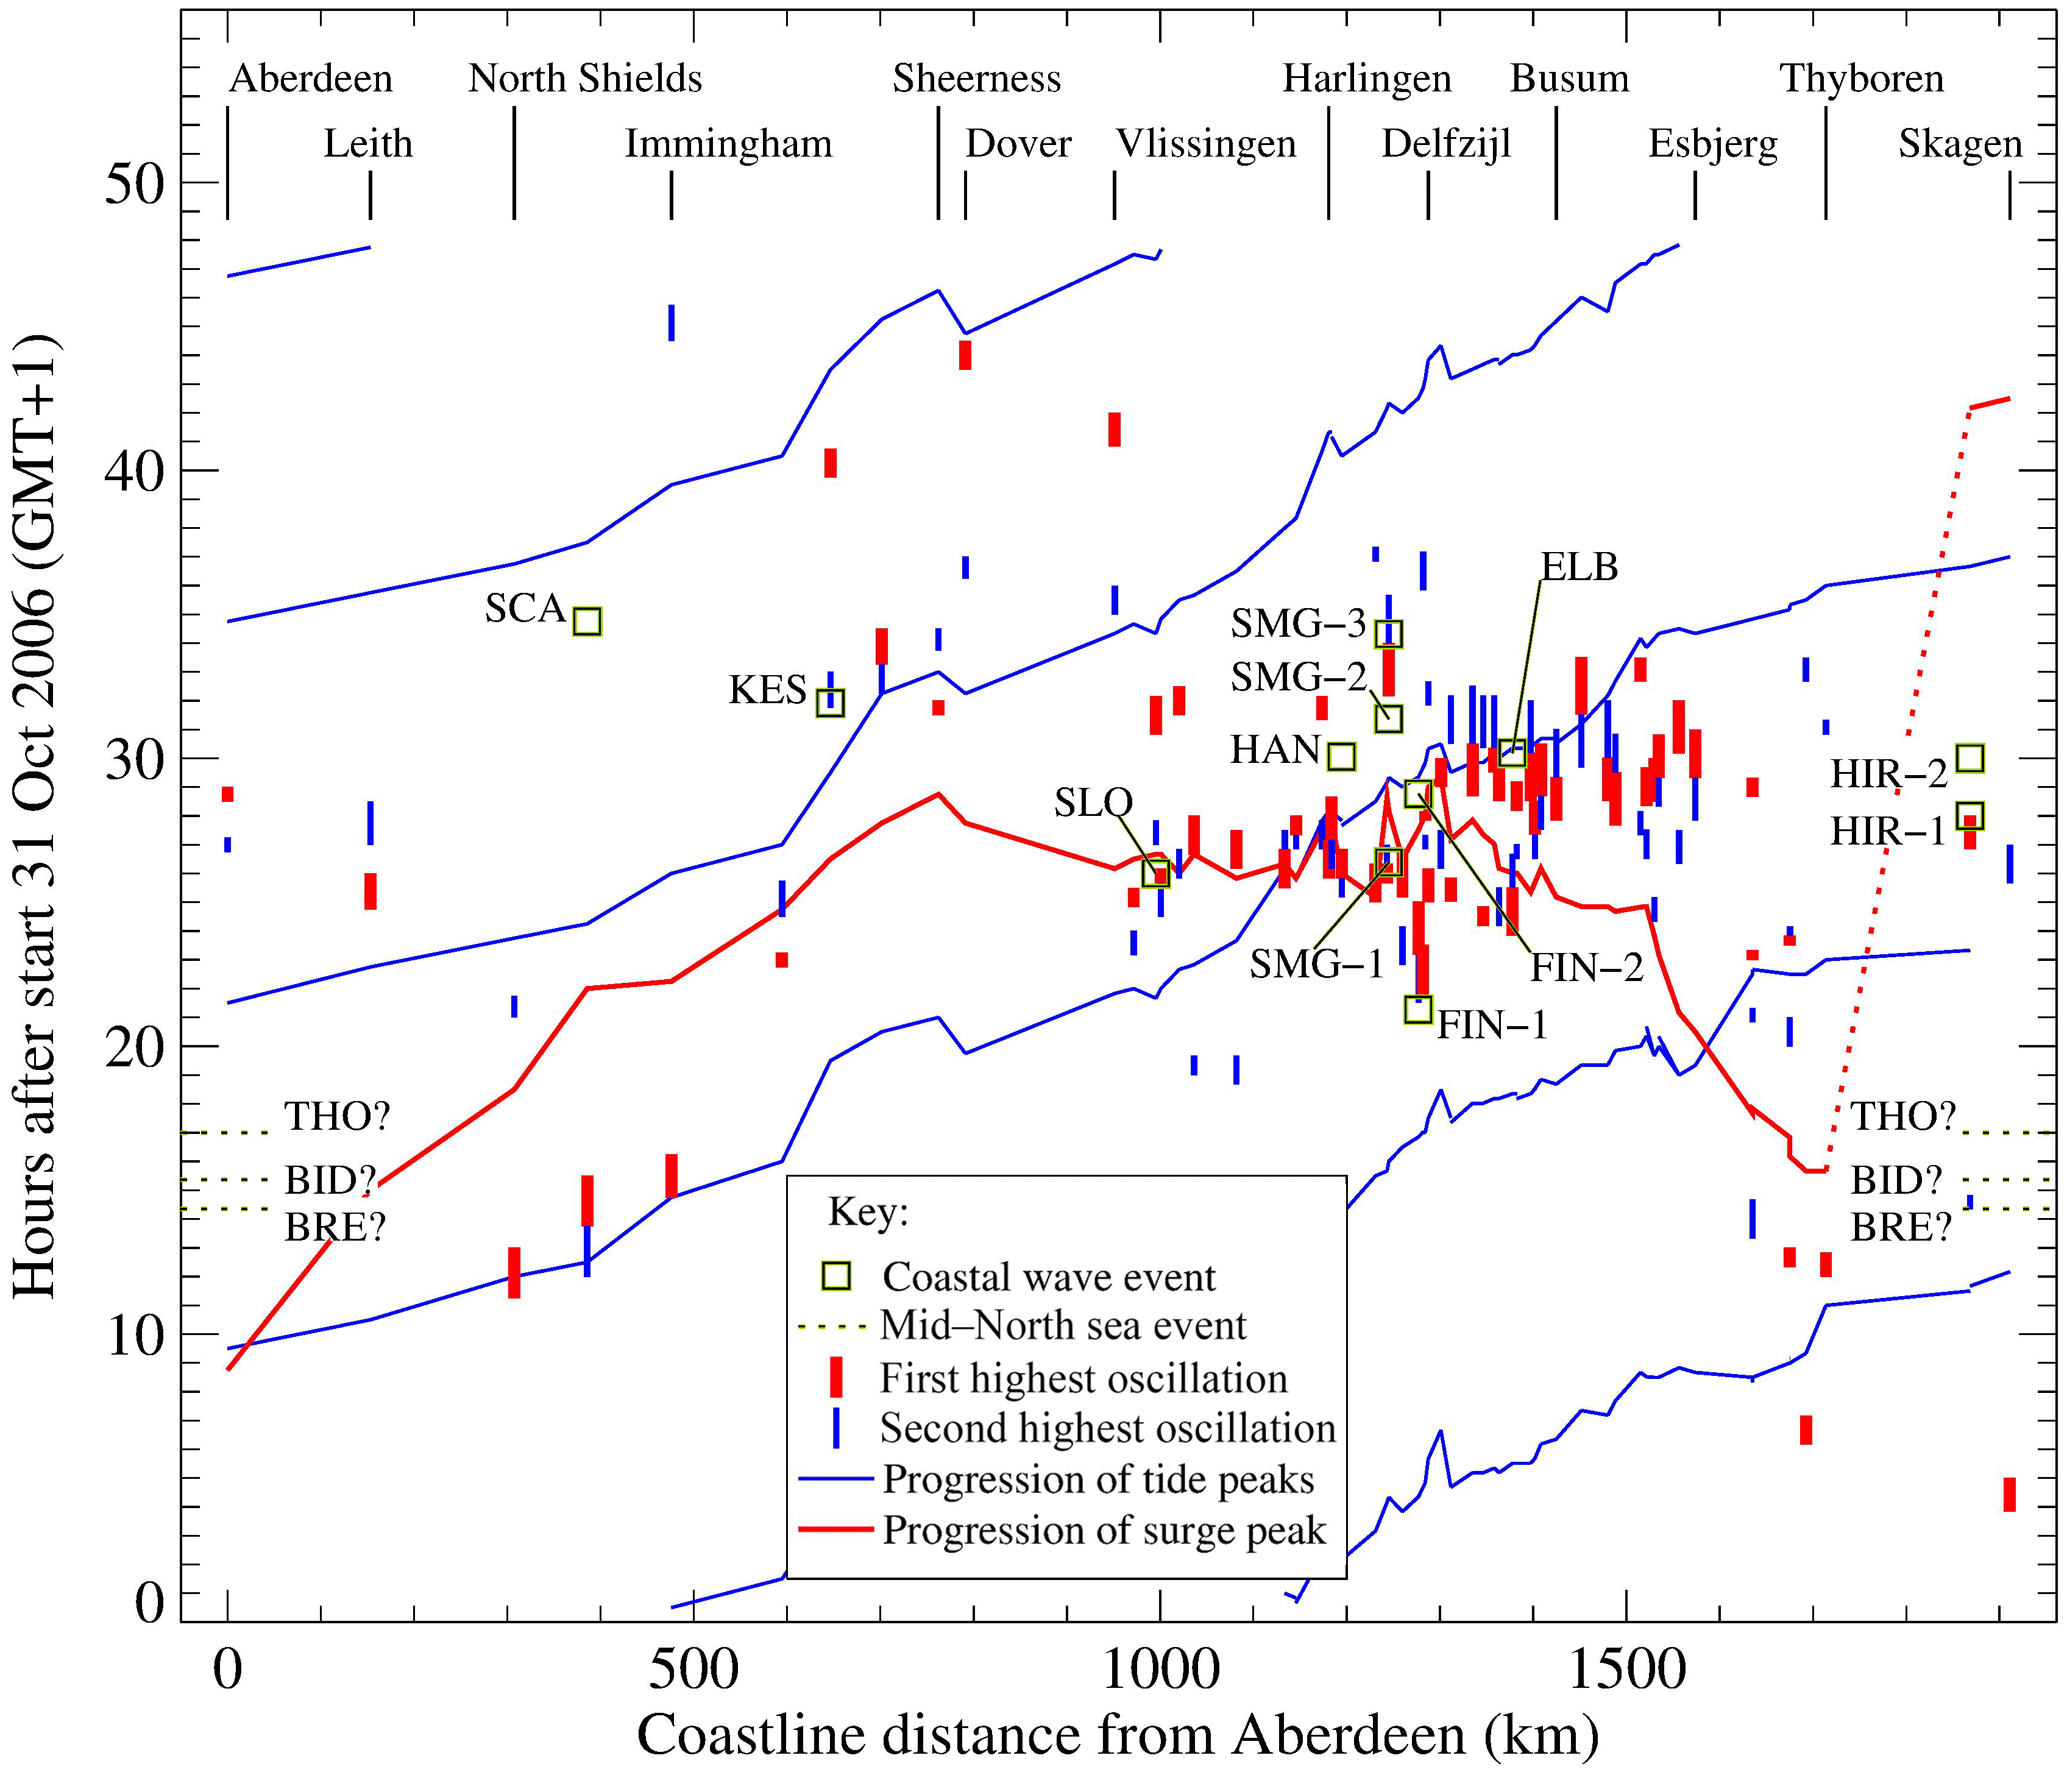
Figure 4Relation between time and coastline distance around the North Sea for the semi-diurnal tide peaks, storm surge peaks, large wave events, and the two highest amplitude oscillations from the short period time series reconstructions for each tide gauge station in Fig. 2d. The abbreviations for the wave events are given in Table S2. The vertical length of the bar for the short period oscillations denotes the zero-crossing period of the down-crossing oscillation; the width and colour of the bar are used to distinguish the first and second highest oscillations.
Figure 4 highlights that the wave incidents were in many cases associated with the maxima in the short period tide gauge reconstruction. Although the features in the short period tide gauge reconstruction do not directly record the small groups of large waves that caused damage offshore, the tide gauge record may capture harbour seiche oscillations that were initiated by large waves striking the coast. The other candidate mechanism for the short period oscillations is linked with the propagation of the atmospheric convection cells that covered North Sea during the storm (Pleskachevsky et al., 2012). However, the characteristic time scale of the travelling convection cells – defined by the horizontal dimension of the cloud pattern in satellite images and measured wind speed – is given as 0.1–0.3 h by Brusch et al. (2008), and this is shorter than the average period of the short period oscillations in Fig. 2d (∼1–2 h for stations in the German Bight area). The arrangement of tide gauge wave maximum and offshore wave accidents in Fig. 4b hints that there may be a relationship between events occurring in different places that are potentially widely separated. This was suggested by Rosenthal et al. (2011) reviewing events of the rogue wave strike on the Draupner platform in the northern North Sea during a winter storm on 1 January 1995 and the Alfried Krupp lifeboat accident in the southern North Sea several hours later. For the Britta storm, Fig. 4b indicates a possible alignment of certain clusters of wave-related events with speed characteristics that are consistent with shallow water waves travelling across the North Sea in the coastwise direction of the tide and possibly also other directions.
The study presents an overview of tide gauge surge record for a serious North Sea storm in 2006 that caused damage to offshore energy infrastructure, in addition to coastal flooding and wave strikes on offshore platforms and shipping. Spectral analysis of the tide gauge records from the UK, Netherlands, Germany, and Denmark were used as the basis of a time series reconstruction to isolate different frequency bands corresponding to the storm surge, tides, and short period component. The analysis highlights the special feature of significant surge flooding in the coastal region between the Netherlands and Germany, which established a new record of high water levels at some stations. This is important for the offshore energy sector for the potential interruption of operations, and for the structural loads and bottom scouring effects associated with extreme ocean currents. The short period component of the tide gauge record shows that pronounced oscillations tended to occur with the high tide and storm surge maximum, with indications of propagation to more distant areas. The largest of these oscillations may have some correspondence with reports of wave accidents and instrument recordings across the North Sea during the Britta storm. While tide gauges cannot be used to quantify big wave strikes on platforms and shipping offshore, the short period oscillations that they register in storm conditions may be linked with large singular wave events in coastal areas.
The water level data for this study was measured by the national tide gauge networks of the UK, the Netherlands, Germany, and Denmark. It was obtained from different sources that are given in Table S1 of the Supplement.
The supplement related to this article is available online at: https://doi.org/10.5194/adgeo-45-273-2018-supplement.
The author conducted the data analysis, wrote the manuscript, and made a poster presentation at the EGU General Assembly 2018, Vienna, Austria.
The author declares that there is no conflict of interest.
This article is part of the special issue “European Geosciences Union General Assembly 2018, EGU Division Energy, Resources & Environment (ERE)”. It is a result of the EGU General Assembly 2018, Vienna, Austria, 8–13 April 2018.
The author gratefully acknowledges data from national tide gauge networks
provided by Wilfried Wiechmann of the Federal Institute of Hydrology of
Germany and Søren Bjerre Knudsen of Kystdirektoratet of Denmark.
Samuel J. Arnoldson of P/F Thor and Stein Solberg of JRCC southern Norway
provided details of certain wave accidents in the northern North Sea. The
author appreciates discussions of the conference presentation with EGU2018
delegates: Ray Bell, Christoph Jörges, Xiaoli Larsen, Elke Meyer,
Stephanie Rynders, Joanna Williams, and Peter Louring Nielsen at the CTBTO
information booth. The author appreciates the comments of two reviewers in
improving the manuscript.
Edited by: Sonja
Martens
Reviewed by: Christoph Jörges and one anonymous
referee
Brusch, S., Lehner, S., and Schulz-Stellenfleth, J.: Synergetic use of radar and optical satellite images to support severe storm prediction of offshore wind farming, IEEE J. Sel. Top. Appl., 1, 57–66, https://doi.org/10.1109/JSTARS.2008.2001838, 2008.
Cruz, A. M. and Krausmann, E.: Vulnerability of the oil and gas sector to climate change and extreme weather events, Climatic Change, 121, 41–53, https://doi.org/10.1007/s10584-013-0891-4, 2013.
Diamond, K. E.: Extreme weather impacts on offshore wind turbines: lessons learned, Nat. Resour. Env. Iss., 27, 1–5, 2012.
Hessner, K. and Reichert, K.: Sea surface elevation maps obtained with a nautical X-band radar – Examples from WaMoS II stations, 10th International Workshop on Wave Hindcasting and Forecasting and Coastal Hazard Symposium, North Shore, Oahu, Hawaii, 11–16 November 2007.
IMD: Report on Cyclonic Disturbances over the North Indian Ocean (abridged report circulated during the meeting of WMO/ESAP panel on tropical cyclones) 1998, RSMC-Tropical Cyclones, New Delhi, February 1999.
Joosten, H. P.: Datawell 1961–2011, Riding the Waves for 50 years, Datawell BV, Haarlem, the Netherlands, 2011.
Kettle, A. J.: Review Article: Storm Britta in 2006: offshore damage and large waves in the North Sea, Nat. Hazards Earth Syst. Sci. Discuss., 3, 5493–5510, https://doi.org/10.5194/nhessd-3-5493-2015, 2015.
Kettle, A. J.: Assessing extreme events for energy meteorology: media and scientific publication to track the events of a North Sea storm, Enrgy. Proced., 96, 116–123, https://doi.org/10.1016/j.egypro.2016.10.033, 2016.
KNRM: Capsize and survival, Report on lifeboat Anna Margaretha's capsizes 1 November 2006, Koninklijke Nederlandse Redding Maatschappij, Ijmuiden, 2007.
Larsén, X. G., Du, J., Bolaños, R., and Larsen, S.: On the impact of wind on the development of wave field during storm Britta, Ocean Dynam., 67, 1407–1427, https://doi.org/10.1007/s10236-017-1100-1, 2017.
Magnusson, A. K.: Forecasting extreme waves in practice, Proceedings of the Rogue Waves 2008 Workshop, edited by: Olagnon, M. and Prevosto, M., Brest, France, 1–15 October, 261–281, 2008.
Paskal, C.: Briefing paper: The vulnerability of energy infrastructure to climate to environmental change (EERG BP 2009/01), Chatham House, London, 2009.
Pleskachevsky, A. L., Lehner, S., and Rosenthal, W.: Storm observations by remote sensing and influences of gustiness on ocean waves and on generation of rogue waves, Ocean Dynam., 62, 1335–1351, https://doi.org/10.1007/s10236-012-0567-z, 2012.
Pugh, D. T.: Tides, Surges and Mean Sea Level, John Wiley and Sons, Chichester, 1987.
Rosenthal, W., Pleskachevsky, A. L., Lehner, S., and Brusch, S.: Observation and modelling of high individual ocean waves and wave groups caused by a variable wind field, 12th International Workshop on Wave Hindcasting and Forecasting, Kohala Coast, Hawai'i, 2011.
RWS: Allerheiligenvloed 2006, Achtergrondverslag van de stormvloed van 1 November 2006, Rijkswaterstaat Rijksinstituut voor Kust en Zee (RIKZ), 30 June 2007.
Stull, R. B.: An Introduction to Boundary Layer Meteorology, Kluwer Academic Publishers, Dordrecht, 1988.
Wadey, M. P., Haigh, A. A., Nicholls, R. J., Brown, J. M., Horsburgh, K., Carroll, B., Gallop, S. L., Mason, T., and Bradshaw, E.: A comparison of the 31 January–1 February 1953 and 5–6 December 2013 coastal flood events around the UK, Front. Mar. Sci., 2, 84, https://doi.org/10.3389/fmars.2015.00084, 2015.
Winther-Jensen, M. and Jørgensen, E. R.: When real life wind speed exceeds design wind assumptions, 1999 European Wind Energy Conference, 1–5 March 1999, Nice, France, 220–223, 1999.